 filings.tools
Item 5. Market for the Registrant's Common Equity, Related Stockholder Matters and Issuer Purchases of Equity Securities
5K characters. Original on sec.gov · Markdown
Item 5. Market for the Registrant's Common Equity, Related Stockholder Matters and Issuer Purchases of Equity Securities
Our common stock is listed on the New York Stock Exchange under the symbol "TGT." We are authorized to issue up to 6,000,000,000 shares of common stock, par value $0.0833, and up to 5,000,000 shares of preferred stock, par value $0.01. At March 2, 2017, there were 15,067 shareholders of record. Dividends declared per share and the high and low closing common stock price for each fiscal quarter during 2016 and 2015 are disclosed in Note 31 of the Financial Statements.
On January 11, 2012, our Board of Directors authorized the repurchase of $5 billion of our common stock and on June 9, 2015 expanded the program by an additional $5 billion for a total authorization of $10 billion. On September 20, 2016, our Board of Directors authorized a new $5 billion share repurchase program. We began repurchasing shares under this new authorization during the fourth quarter of 2016 upon completion of the previous $10 billion program. There is no stated expiration for the share repurchase programs. Under these programs, we repurchased 50.9 million shares of common stock in fiscal 2016, at an average price of $72.35, for a total investment of $3.7 billion. The table below presents information with respect to Target common stock purchases made during the three months ended January 28, 2017, by Target or any "affiliated purchaser" of Target, as defined in Rule 10b-18(a)(3) under the Exchange Act.
| Period | Total Number of Shares Purchased | Average Price Paid per Share | Total Number of Shares Purchased as Part of Publicly Announced Programs | Dollar Value of Shares that May Yet Be Purchased Under Publicly Announced Programs | |||||||||
| October 30, 2016 through November 26, 2016 | |||||||||||||
| Open market and privately negotiated purchases | 802,412 | $ | 67.23 | 802,412 | $ | 5,210,467,654 | |||||||
| September 2016 ASR (a) | 1,286,423 | 67.67 | 1,286,423 | 5,246,730,198 | |||||||||
| November 27, 2016 through December 31, 2016 | |||||||||||||
| Open market and privately negotiated purchases | — | — | — | 5,246,730,198 | |||||||||
| December 2016 ASR | 4,618,451 | 76.77 | 4,618,451 | 4,892,156,933 | |||||||||
| January 1, 2017 through January 28, 2017 | |||||||||||||
| Open market and privately negotiated purchases | 2,362,745 | 66.27 | 2,362,745 | 4,735,572,452 | |||||||||
| Total | 9,070,031 | $ | 71.90 | 9,070,031 | $ | 4,735,572,452 |
| (a) | Represents the incremental shares received upon final settlement of the accelerated share repurchase agreement (ASR) initiated in third quarter 2016. |
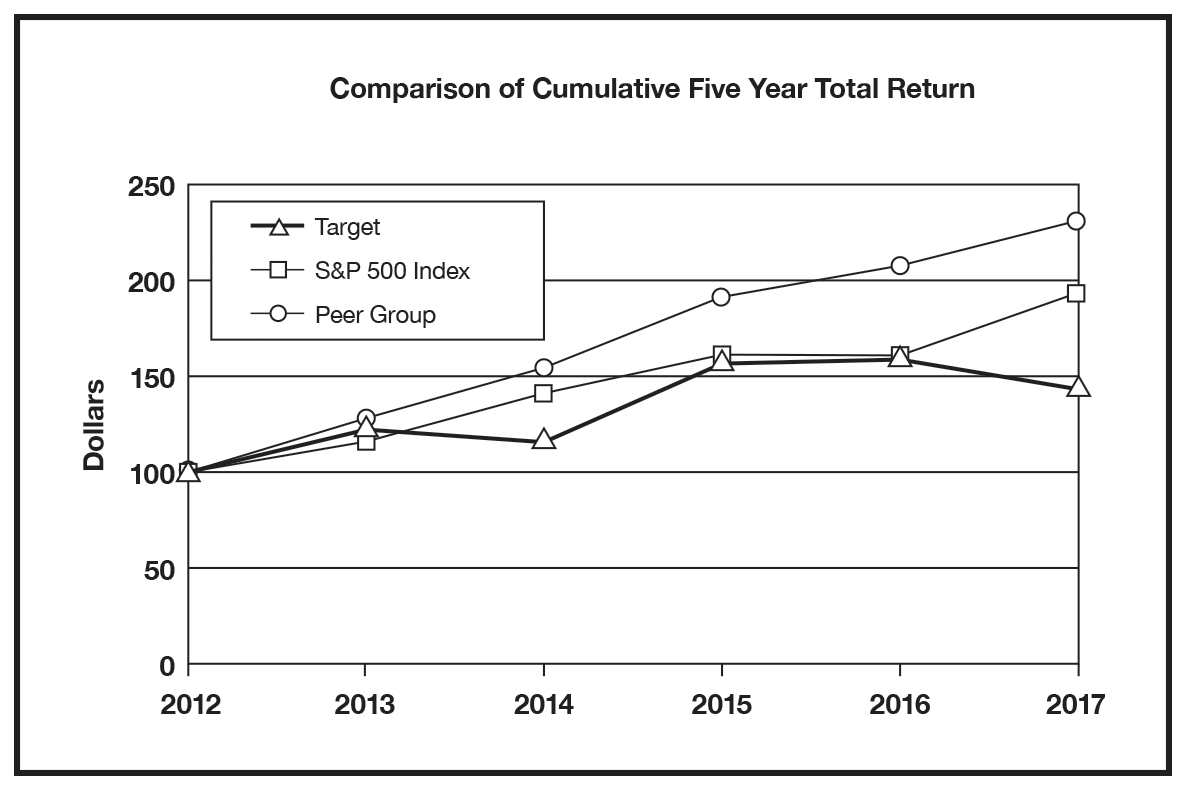
| Fiscal Years Ended | ||||||||||||||||||
| January 28, 2012 | February 2, 2013 | February 1, 2014 | January 31, 2015 | January 30, 2016 | January 28, 2017 | |||||||||||||
| Target | $ | 100.00 | $ | 124.97 | $ | 118.53 | $ | 158.98 | $ | 160.89 | $ | 146.06 | ||||||
| S&P 500 Index | 100.00 | 117.61 | 141.49 | 161.61 | 160.54 | 194.04 | ||||||||||||
| Peer Group | 100.00 | 127.43 | 154.12 | 191.03 | 208.03 | 231.50 |
The graph above compares the cumulative total shareholder return on our common stock for the last five fiscal years with the cumulative total return on the S&P 500 Index and a peer group consisting of 18 online, general merchandise, department store, food, and specialty retailers, which are large and meaningful competitors (Amazon.com, Inc., Best Buy Co., Inc., Costco Wholesale Corporation, CVS Health Corporation, Dollar General Corporation, The Gap, Inc., The Home Depot, Inc., Kohl's Corporation, The Kroger Co., Lowe's Companies, Inc., Macy's, Inc., Publix Super Markets, Inc., Rite Aid Corporation, Sears Holdings Corporation, Staples, Inc., The TJX Companies, Inc., Walgreens Boots Alliance, Inc., and Wal-Mart Stores, Inc.) (Peer Group). The peer group is consistent with the retail peer group used for our definitive Proxy Statement to be filed on or about May 1, 2017.
The peer group is weighted by the market capitalization of each component company. The graph assumes the investment of $100 in Target common stock, the S&P 500 Index and the Peer Group on January 28, 2012, and reinvestment of all dividends.
Previous: Item 4A. Executive Officers · Next: Item 6. Selected Financial Data