 filings.tools
Item 7. Management's Discussion and Analysis of Financial Condition and Results of Operations
48K characters. Original on sec.gov · Markdown
Item 7. Management's Discussion and Analysis of Financial Condition and Results of Operations
Executive Summary
Fiscal 2016 included the following notable items:
| • | GAAP earnings per share from continuing operations were $4.58. |
| • | Adjusted earnings per share were $5.01. |
| • | Comparable sales decreased 0.5 percent, reflecting a 0.8 percent decrease in traffic. |
| • | Comparable digital channel sales growth of 27 percent contributed 1.0 percentage points of comparable sales growth. |
| • | We returned $5.0 billion to shareholders through dividends and share repurchase. |
Sales were $69,495 million for 2016, a decrease of $4,290 million or 5.8 percent from the prior year, primarily due to the Pharmacy Transaction. Earnings from continuing operations before interest expense and income taxes in 2016 decreased by $561 million or 10.1 percent from 2015 to $4,969 million, primarily due to the 2015 gain on the Pharmacy Transaction. Operating cash flow provided by continuing operations was $5,329 million, $5,254 million, and $5,157 million for 2016, 2015, and 2014, respectively. In 2015, proceeds from the Pharmacy Transaction are included in investing cash flows provided by continuing operations. Refer to Note 6 of the Financial Statements for additional information about the transaction.
| Earnings Per Share From Continuing Operations | Percent Change | ||||||||||||
| 2016 | 2015 | 2014 | 2016/2015 | 2015/2014 | |||||||||
| GAAP diluted earnings per share | $ | 4.58 | $ | 5.25 | $ | 3.83 | (12.7 | )% | 37.2 | % | |||
| Adjustments | 0.42 | (0.56 | ) | 0.39 | |||||||||
| Adjusted diluted earnings per share | $ | 5.01 | $ | 4.69 | $ | 4.22 | 6.7 | % | 11.3 | % |
Note: Amounts may not foot due to rounding. Adjusted diluted earnings per share from continuing operations (Adjusted EPS), a non-GAAP metric, excludes the impact of certain items not related to our routine retail operations. Management believes that Adjusted EPS is meaningful to provide period-to-period comparisons of our operating results. A reconciliation of non-GAAP financial measures to GAAP measures is provided on page 21.
We report after-tax return on invested capital (ROIC) from continuing operations because we believe ROIC provides a meaningful measure of our capital-allocation effectiveness over time. For the trailing twelve months ended January 28, 2017, ROIC was 15.0 percent, compared with 16.0 percent for the trailing twelve months ended January 30, 2016. Excluding the net gain on the Pharmacy Transaction, ROIC was 13.9 percent for the trailing twelve months ended January 30, 2016. A reconciliation of ROIC is provided on page 22.
Analysis of Results of Operations
Segment Results
| Percent Change | |||||||||||||
| (dollars in millions) | 2016 | 2015 (a) | 2014 (a) | 2016/2015 | 2015/2014 | ||||||||
| Sales | $ | 69,495 | $ | 73,785 | $ | 72,618 | (5.8 | )% | 1.6 | % | |||
| Cost of sales | 48,872 | 51,997 | 51,278 | (6.0 | ) | 1.4 | |||||||
| Gross margin | 20,623 | 21,788 | 21,340 | (5.4 | ) | 2.1 | |||||||
| SG&A expenses (b) | 13,360 | 14,448 | 14,503 | (7.5 | ) | (0.4 | ) | ||||||
| EBITDA | 7,263 | 7,340 | 6,837 | (1.1 | ) | 7.4 | |||||||
| Depreciation and amortization | 2,298 | 2,213 | 2,129 | 3.8 | 3.9 | ||||||||
| EBIT | $ | 4,965 | $ | 5,127 | $ | 4,708 | (3.2 | )% | 8.9 | % |
Note: See Note 30 of our Financial Statements for a reconciliation of our segment results to earnings before income taxes and more information about items recorded outside of segment SG&A.
| (a) | Sales include $3,815 million and $4,148 million related to our former pharmacy and clinic businesses for 2015 and 2014, respectively, and cost of sales include $3,076 million and $3,222 million, respectively. The sale of these businesses had no notable impact on EBITDA or EBIT. |
| (b) | For 2016, 2015, and 2014, SG&A includes $663 million, $641 million, and $629 million, respectively, of net profit-sharing income from the arrangement with TD. |
| Rate Analysis | 2016 | 2015 | 2014 | |||
| Gross margin rate | 29.7 | % | 29.5 | % | 29.4 | % |
| SG&A expense rate | 19.2 | 19.6 | 20.0 | |||
| EBITDA margin rate (a) | 10.5 | 9.9 | 9.4 | |||
| Depreciation and amortization expense rate | 3.3 | 3.0 | 2.9 | |||
| EBIT margin rate (a) | 7.1 | 6.9 | 6.5 |
Note: Rate analysis metrics are computed by dividing the applicable amount by sales.
| (a) | Excluding sales of our former pharmacy and clinic businesses, EBITDA margin rates were 10.5 percent and 10.0 percent for 2015 and 2014, respectively. and EBIT margin rates were 7.3 percent and 6.9 percent, respectively. |
Sales
Sales include all merchandise sales, net of expected returns, and gift card breakage. Refer to Note 2 of the Financial Statements for a definition of gift card breakage. Digital channel sales include all sales initiated through mobile applications and our conventional websites. Digital channel sales may be fulfilled through our distribution centers, our vendors, or our stores.
The decrease in 2016 sales reflects a decrease of approximately $3,815 million due to the Pharmacy Transaction and a comparable sales decrease of 0.5 percent, partially offset by the contribution from new stores. The increase in 2015 sales reflects an increase in comparable sales of 2.1 percent and the contribution from new stores, partially offset by a decrease of approximately $550 million due to the Pharmacy Transaction. Inflation did not materially affect sales in any period presented.
| Sales by Channel | 2016 | 2015 (a) | 2014 (a) | |||
| Stores | 95.6 | % | 96.6 | % | 97.4 | % |
| Digital | 4.4 | 3.4 | 2.6 | |||
| Total | 100 | % | 100 | % | 100 | % |
| (a) | Excluding sales of our former pharmacy and clinic businesses, stores and digital channels sales were 96.4 percent and 3.6 percent of total sales, respectively, for 2015 and 97.2 and 2.8 percent of total sales, respectively, for 2014. |
Comparable sales is a measure that highlights the performance of our existing stores and digital channel sales by measuring the change in sales for a period over the comparable, prior-year period of equivalent length. Comparable sales include all sales, except sales from stores open less than 13 months, digital acquisitions we have owned less than 13 months, stores that have been closed, and digital acquisitions that we no longer operate. We removed pharmacy and clinic sales from the 2015 sales amounts when calculating 2016 comparable sales. Comparable sales measures vary across the retail industry. As a result, our comparable sales calculation is not necessarily comparable to similarly titled measures reported by other companies.
| Comparable Sales | 2016 | 2015 | 2014 | |||
| Comparable sales change | (0.5 | )% | 2.1 | % | 1.3 | % |
| Drivers of change in comparable sales: | ||||||
| Number of transactions | (0.8 | ) | 1.3 | (0.2 | ) | |
| Average transaction amount | 0.3 | 0.8 | 1.5 |
| Contribution to Comparable Sales Change | 2016 | 2015 | 2014 | |||
| Stores channel comparable sales change | (1.5 | )% | 1.3 | % | 0.7 | % |
| Digital channel contribution to comparable sales change | 1.0 | 0.8 | 0.7 | |||
| Total comparable sales change | (0.5 | )% | 2.1 | % | 1.3 | % |
Note: Amounts may not foot due to rounding.
| Sales by Product Category | Percentage of Sales | |||||
| 2016 | 2015 | 2014 | ||||
| Household essentials (a) | 22 | % | 26 | % | 25 | % |
| Food, beverage, and pet supplies (b) | 22 | 21 | 21 | |||
| Apparel and accessories (c) | 20 | 19 | 19 | |||
| Home furnishings and décor (d) | 19 | 17 | 17 | |||
| Hardlines (e) | 17 | 17 | 18 | |||
| Total | 100 | % | 100 | % | 100 | % |
| (a) | Includes pharmacy, beauty, personal care, baby care, cleaning, and paper products. Pharmacy represented 5 percent and 6 percent in 2015 and 2014, respectively. |
| (b) | Includes dry grocery, dairy, frozen food, beverages, candy, snacks, deli, bakery, meat, produce, and pet supplies. |
| (c) | Includes apparel for women, men, boys, girls, toddlers, infants and newborns, as well as intimate apparel, jewelry, accessories, and shoes. |
| (d) | Includes furniture, lighting, kitchenware, small appliances, home décor, bed and bath, home improvement, automotive, and seasonal merchandise such as patio furniture and holiday décor. |
| (e) | Includes electronics (including video game hardware and software), music, movies, books, computer software, sporting goods, and toys. |
Further analysis of sales metrics is infeasible due to the collective interaction of a broad array of macroeconomic, competitive, and consumer behavioral factors, as well as sales mix and transfer of sales to new stores.
TD offers credit to qualified guests through Target-branded credit cards: the Target Credit Card and the Target MasterCard Credit Card (Target Credit Cards). Additionally, we offer a branded proprietary Target Debit Card. Collectively, we refer to these products as REDcards®. Guests receive a 5 percent discount on virtually all purchases and free shipping at Target.com when they use a REDcard. We monitor the percentage of sales that are paid for using REDcards (REDcard Penetration) because our internal analysis has indicated that a meaningful portion of incremental purchases on our REDcards are also incremental sales for Target.
| REDcard Penetration | 2016 | 2015 | 2014 | |||
| Target Debit Card | 12.8 | % | 12.1 | % | 11.2 | % |
| Target Credit Cards | 11.2 | 10.1 | 9.7 | |||
| Total REDcard Penetration | 24.0 | % | 22.3 | % | 20.9 | % |
Note: Excluding pharmacy and clinic sales, total REDcard penetration would have been 23.2 percent and 21.9 percent for 2015 and 2014, respectively. The sum of Target Credit Cards and Target Debit Card penetration may not equal Total REDcard Penetration due to rounding.
Gross Margin Rate
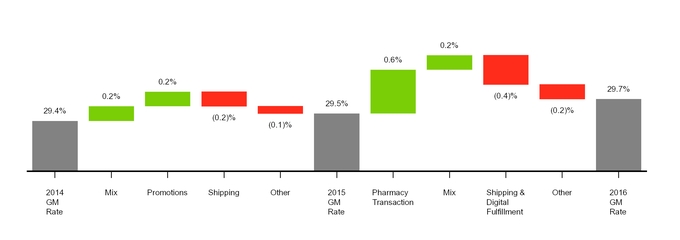
Our gross margin rate was 29.7 percent in 2016, 29.5 percent in 2015, and 29.4 percent in 2014. The 2016 increase was primarily due to the Pharmacy Transaction and favorable category sales mix, partially offset by increased shipping and digital fulfillment costs. Cost of goods savings helped offset the impact of a competitive promotional environment.
The 2015 increase was primarily due to favorable category sales mix and lower promotional activity relative to the highly promotional period in 2014 following the 2013 data breach, partially offset by the impact of increased digital channel sales.
Selling, General and Administrative Expense Rate
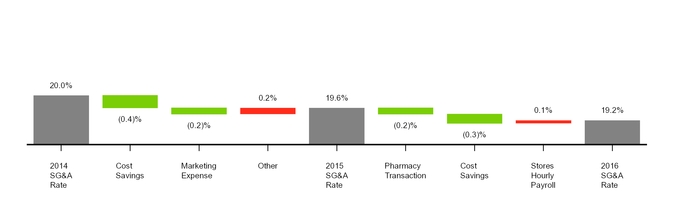
Our SG&A expense rate was 19.2 percent in 2016, 19.6 percent in 2015, and 20.0 percent in 2014. The decrease in 2016 primarily resulted from the benefit of the Pharmacy Transaction and technology-related cost savings, partially offset by increased stores hourly payroll.
The decrease in 2015 primarily resulted from cost saving initiatives and reduced marketing expense, partially offset by investments in other initiatives, none of which were individually significant.
Store Data
| Change in Number of Stores | 2016 | 2015 | ||
| Beginning store count | 1,792 | 1,790 | ||
| Opened | 15 | 15 | ||
| Closed | (5 | ) | (13 | ) |
| Ending store count | 1,802 | 1,792 |
| Number of Stores and Retail Square Feet | Number of Stores | Retail Square Feet (a) | |||||||
| January 28, 2017 | January 30, 2016 | January 28, 2017 | January 30, 2016 | ||||||
| 170,000 or more sq. ft. | 276 | 278 | 49,328 | 49,688 | |||||
| 50,000 to 169,999 sq. ft. | 1,504 | 1,505 | 189,620 | 189,677 | |||||
| 49,999 or less sq. ft. | 22 | 9 | 554 | 174 | |||||
| Total | 1,802 | 1,792 | 239,502 | 239,539 |
| (a) | In thousands, reflects total square feet less office, distribution center and vacant space. |
Other Performance Factors
Other Selling, General and Administrative Expenses
We recorded $(4) million, $216 million, and $174 million of selling, general and administrative expenses outside of the segment during 2016, 2015, and 2014, respectively, because they relate to discretely managed matters. Additional information about these discretely managed items is provided within Note 30 of the Financial Statements.
Net Interest Expense
Net interest expense from continuing operations was $1,004 million, $607 million, and $882 million for 2016, 2015, and 2014, respectively. Net interest expense for 2016 and 2014 included a loss on early retirement of debt of $422 million and $285 million, respectively.
Provision for Income Taxes
Our 2016 effective income tax rate from continuing operations increased to 32.7 percent, from 32.5 percent in 2015, driven primarily by the 2015 rate impact of the $112 million tax benefit from releasing the valuation allowance on a capital loss. This comparative rate impact was partially offset by $27 million of excess tax benefit in 2016 related to shared-based payments after the adoption of Accounting Standards Update (ASU) No. 2016-09, Improvements to Employee Share-Based Payment Accounting, and lower pretax earnings. Note 23 of the Financial Statements provides a tax rate reconciliation.
Our 2015 effective income tax rate from continuing operations decreased to 32.5 percent, from 33.0 percent in 2014, driven primarily by the $112 million tax benefit from releasing the valuation allowance on a capital loss. This benefit was partially offset by a year-over-year decrease in the favorable resolution of various income tax matters and the rate impact of higher pretax earnings. The resolution of various income tax matters reduced tax expense by $8 million and $35 million in 2015 and 2014, respectively.
Discontinued Operations
See Note 7 of the Financial Statements for information about our Canada exit.
Reconciliation of Non-GAAP Financial Measures to GAAP Measures
To provide additional transparency, we have disclosed non-GAAP adjusted diluted earnings per share from continuing operations (Adjusted EPS). This metric excludes certain items presented below. We believe this information is useful in providing period-to-period comparisons of the results of our continuing operations. This measure is not in accordance with, or an alternative to, generally accepted accounting principles in the United States (GAAP). The most comparable GAAP measure is diluted earnings per share from continuing operations. Adjusted EPS should not be considered in isolation or as a substitution for analysis of our results as reported under GAAP. Other companies may calculate Adjusted EPS differently than we do, limiting the usefulness of the measure for comparisons with other companies.
| 2016 | 2015 | 2014 | ||||||||||||||||||||||||||||||||||
| (millions, except per share data) | Pretax | Net of Tax | Per Share Amounts | Pretax | Net of Tax | Per Share Amounts | Pretax | Net of Tax | Per Share Amounts | |||||||||||||||||||||||||||
| GAAP diluted earnings per share from continuing operations | $ | 4.58 | $ | 5.25 | $ | 3.83 | ||||||||||||||||||||||||||||||
| Adjustments | ||||||||||||||||||||||||||||||||||||
| Loss on early retirement of debt | $ | 422 | $ | 257 | $ | 0.44 | $ | — | $ | — | $ | — | $ | 285 | $ | 173 | $ | 0.27 | ||||||||||||||||||
| Gain on sale (a) | — | — | — | (620 | ) | (487 | ) | (0.77 | ) | — | — | — | ||||||||||||||||||||||||
| Restructuring costs (b) | — | — | — | 138 | 87 | 0.14 | — | — | — | |||||||||||||||||||||||||||
| Data breach-related costs, net of insurance (c) | — | — | — | 39 | 28 | 0.04 | 145 | 94 | 0.15 | |||||||||||||||||||||||||||
| Other (d) | (4 | ) | (2 | ) | — | 39 | 29 | 0.05 | 29 | 18 | 0.03 | |||||||||||||||||||||||||
| Resolution of income tax matters | — | (7 | ) | (0.01 | ) | — | (8 | ) | (0.01 | ) | — | (35 | ) | (0.06 | ) | |||||||||||||||||||||
| Adjusted diluted earnings per share from continuing operations | $ | 5.01 | $ | 4.69 | $ | 4.22 |
Note: Amounts may not foot due to rounding.
| (a) | Refer to Note 6 of the Financial Statements. |
| (b) | Refer to Note 8 of the Financial Statements. |
| (c) | Refer to Note 19 of the Financial Statements. |
| (d) | For 2016, represents items related to the Pharmacy Transaction. For 2015, represents impairments related to our decision to wind down certain noncore operations, as described in Note 16 of the Financial Statements. The 2014 amounts include impairments of $16 million related to undeveloped land in the U.S. and $13 million of expense related to converting co-branded card program to MasterCard. |
We have also disclosed after-tax return on invested capital for continuing operations (ROIC), which is a ratio based on GAAP information, with the exception of adjustments made to capitalize operating leases. Operating leases are capitalized as part of the ROIC calculation to control for differences in capital structure between us and our competitors. We believe this metric provides a meaningful measure of the effectiveness of our capital allocation over time. Other companies may calculate ROIC differently than we do, limiting the usefulness of the measure for comparisons with other companies.
| After-Tax Return on Invested Capital | ||||||||||||
| Numerator | Trailing Twelve Months | |||||||||||
| (dollars in millions) | January 28, 2017 | January 30, 2016 | ||||||||||
| Earnings from continuing operations before interest expense and income taxes | $ | 4,969 | $ | 5,530 | ||||||||
| + Operating lease interest (a)(b) | 71 | 87 | ||||||||||
| Adjusted earnings from continuing operations before interest expense and income taxes | 5,040 | 5,617 | ||||||||||
| - Income taxes (c) | 1,648 | 1,827 | ||||||||||
| Net operating profit after taxes | $ | 3,392 | $ | 3,790 |
| Denominator (dollars in millions) | January 28, 2017 | January 30, 2016 | January 31, 2015 | |||||||||
| Current portion of long-term debt and other borrowings | $ | 1,718 | $ | 815 | $ | 91 | ||||||
| + Noncurrent portion of long-term debt | 11,031 | 11,945 | 12,634 | |||||||||
| + Shareholders' equity | 10,953 | 12,957 | 13,997 | |||||||||
| + Capitalized operating lease obligations (b)(d) | 1,187 | 1,457 | 1,490 | |||||||||
| - Cash and cash equivalents | 2,512 | 4,046 | 2,210 | |||||||||
| - Net assets of discontinued operations | 62 | 226 | 1,479 | |||||||||
| Invested capital | $ | 22,315 | $ | 22,902 | $ | 24,523 | ||||||
| Average invested capital (e) | $ | 22,608 | $ | 23,713 |
| After-tax return on invested capital | 15.0 | % | 16.0 | % | (f) |
| (a) | Represents the add-back to operating income driven by the hypothetical interest expense we would incur if the property under our operating leases were owned or accounted for as capital leases, using eight times our trailing twelve months rent expense and an estimated interest rate of six percent. |
| (b) | See the following Reconciliation of Capitalized Operating Leases table for the adjustments to our GAAP total rent expense to obtain the hypothetical capitalization of operating leases and related operating lease interest. |
| (c) | Calculated using the effective tax rate for continuing operations, which was 32.7 percent and 32.5 percent for the trailing twelve months ended January 28, 2017 and January 30, 2016. For the twelve months ended January 28, 2017 and January 30, 2016, includes tax effect of $1,624 million and $1,799 million, respectively, related to EBIT and $23 million and $28 million, respectively, related to operating lease interest. |
| (d) | Calculated as eight times our trailing twelve months rent expense. |
| (e) | Average based on the invested capital at the end of the current period and the invested capital at the end of the prior period. |
| (f) | Excluding the net gain on the Pharmacy Transaction, ROIC was 13.9 percent for the trailing twelve months ended January 30, 2016. |
Capitalized operating lease obligations and operating lease interest are not in accordance with, or an alternative for, GAAP. The most comparable GAAP measure is total rent expense. Capitalized operating lease obligations and operating lease interest should not be considered in isolation or as a substitution for analysis of our results as reported under GAAP.
| Reconciliation of Capitalized Operating Leases | Trailing Twelve Months | |||||||||||||
| (dollars in millions) | January 28, 2017 | January 30, 2016 | January 31, 2015 | |||||||||||
| Total rent expense | $ | 148 | $ | 182 | $ | 186 | ||||||||
| Capitalized operating lease obligations (total rent expense x 8) | 1,187 | 1,457 | 1,490 | |||||||||||
| Operating lease interest (capitalized operating lease obligations x 6%) | 71 | 87 | n/a |
Analysis of Financial Condition
Liquidity and Capital Resources
Our period-end cash and cash equivalents balance decreased to $2,512 million from $4,046 million in 2015, primarily reflecting deployment during 2016 of proceeds from the Pharmacy Transaction and payment of related taxes. Due to the timing of the sale late in 2015, we did not fully deploy the net proceeds by the end of 2015. Short-term investments of $1,110 million and $3,008 million were included in cash and cash equivalents at the end of 2016 and 2015, respectively. Our investment policy is designed to preserve principal and liquidity of our short-term investments. This policy allows investments in large money market funds or in highly rated direct short-term instruments that mature in 60 days or less. We also place dollar limits on our investments in individual funds or instruments.
Capital Allocation
We follow a disciplined and balanced approach to capital allocation based on the following priorities, ranked in order of importance: first, we fully invest in opportunities to profitably grow our business, create sustainable long-term value, and maintain our current operations and assets; second, we maintain a competitive quarterly dividend and seek to grow it annually; and finally, we return any excess cash to shareholders by repurchasing shares within the limits of our credit rating goals.
Cash Flows
Our 2016 operations were funded by internally and externally generated funds. Operating cash flow provided by continuing operations was $5,329 million in 2016 compared with $5,254 million in 2015. These cash flows, combined with period year-end cash position, allowed us to invest in the business, fund early debt retirement and maturities, pay dividends, and repurchase shares under our share repurchase program. Proceeds from the Pharmacy Transaction are included in investing cash flows provided by continuing operations during 2015.
Inventory
Year-end inventory was $8,309 million, compared with $8,601 million in 2015. The decrease was due to our alignment of inventory levels with the slowing sales trend while appropriately supporting instocks.
Share Repurchases
During 2016, 2015, and 2014 we returned $3,686 million, $3,441 million, and $41 million, respectively, to shareholders through share repurchase. See Part II, Item 5 of this Annual Report on Form 10-K and Note 25 to the Financial Statements for more information.
Dividends
We paid dividends totaling $1,348 million ($2.32 per share) in 2016 and $1,362 million ($2.16 per share) in 2015, a per share increase of 7.4 percent. We declared dividends totaling $1,359 million ($2.36 per share) in 2016, a per share increase of 7.3 percent over 2015. We declared dividends totaling $1,378 million ($2.20 per share) in 2015, a per share increase of 10.6 percent over 2014. We have paid dividends every quarter since our 1967 initial public offering, and it is our intent to continue to do so in the future.
Short-term and Long-term Financing
Our financing strategy is to ensure liquidity and access to capital markets, maintain a balanced spectrum of debt maturities, and manage our net exposure to floating interest rate volatility. Within these parameters, we seek to minimize our borrowing costs. Our ability to access the long-term debt and commercial paper markets has provided us with ample sources of liquidity. Our continued access to these markets depends on multiple factors, including the condition of debt capital markets, our operating performance, and maintaining strong credit ratings. As of January 28, 2017, our credit ratings were as follows:
| Credit Ratings | Moody's | Standard and Poor's | Fitch |
| Long-term debt | A2 | A | A- |
| Commercial paper | P-1 | A-1 | F2 |
If our credit ratings were lowered, our ability to access the debt markets, our cost of funds, and other terms for new debt issuances could be adversely impacted. Each of the credit rating agencies reviews its rating periodically and there is no guarantee our current credit ratings will remain the same as described above.
In 2016, we funded our peak holiday sales period working capital needs through internally generated funds and the issuance of commercial paper. In 2015, we funded our peak holiday sales period working capital needs through internally generated funds.
| Commercial Paper | |||||||||
| (dollars in millions) | 2016 | 2015 | 2014 | ||||||
| Maximum daily amount outstanding during the year | $ | 89 | $ | — | $ | 590 | |||
| Average amount outstanding during the year | 1 | — | 129 | ||||||
| Amount outstanding at year-end | — | — | — | ||||||
| Weighted average interest rate | 0.43 | % | — | % | 0.11 | % |
We have additional liquidity through a committed $2.5 billion revolving credit facility obtained through a group of banks in October 2016 which expires in October 2021. This new unsecured revolving credit facility replaced a $2.25 billion unsecured revolving credit facility that was scheduled to expire in October 2018. No balances were outstanding under either credit facility at any time during 2016, 2015, or 2014.
Most of our long-term debt obligations contain covenants related to secured debt levels. In addition to a secured debt level covenant, our credit facility also contains a debt leverage covenant. We are, and expect to remain, in compliance with these covenants. Additionally, at January 28, 2017, no notes or debentures contained provisions requiring acceleration of payment upon a credit rating downgrade, except that certain outstanding notes allow the note holders to put the notes to us if within a matter of months of each other we experience both (i) a change in control and (ii) our long-term credit ratings are either reduced and the resulting rating is non-investment grade, or our long-term credit ratings are placed on watch for possible reduction and those ratings are subsequently reduced and the resulting rating is non-investment grade.
We believe our sources of liquidity will continue to be adequate to maintain operations, finance anticipated expansion and strategic initiatives, fund debt maturities, pay dividends, and execute purchases under our share repurchase program for the foreseeable future. We continue to anticipate ample access to commercial paper and long-term financing.
Capital Expenditures
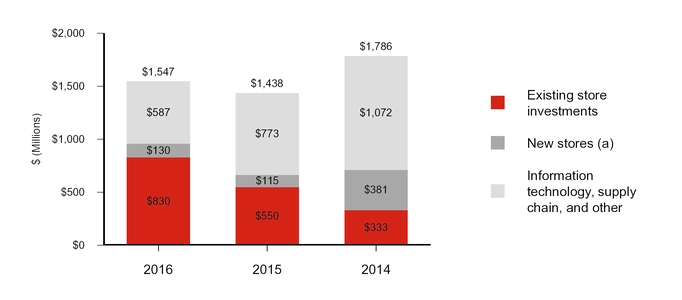
(a) In addition to these cash investments, we entered into leases related to new stores in 2016, 2015, and 2014 with total future minimum lease payments of $550 million, $338 million, and $85 million, respectively.
Capital expenditures increased in 2016 from the prior year because we increased our investments in existing stores, including remodels and guest experience enhancements. These increases were partially offset by continued efficiency gains in technology. Capital expenditures decreased in 2015 from the prior year as we opened fewer large-format stores and realized efficiency gains in technology, partially offset by increased guest experience and supply chain investments. As noted in the footnote to the chart presented above, we substantially increased our investments in leases in 2016 and 2015.
We expect capital expenditures in 2017 to increase to approximately $2.0 billion to $2.5 billion as we accelerate the rate of store remodels and flexible-format store openings, and continue to make supply chain investments. We also expect our rate of investment in store leases to continue to increase.
Commitments and Contingencies
| Contractual Obligations as of | Payments Due by Period | ||||||||||||||
| January 28, 2017 | Less than | 1-3 | 3-5 | After 5 | |||||||||||
| (millions) | Total | 1 Year | Years | Years | Years | ||||||||||
| Recorded contractual obligations: | |||||||||||||||
| Long-term debt (a) | $ | 11,814 | $ | 1,683 | $ | 1,203 | $ | 2,150 | $ | 6,778 | |||||
| Capital lease obligations (b) | 1,963 | 82 | 174 | 178 | 1,529 | ||||||||||
| Deferred compensation (c) | 515 | 56 | 114 | 121 | 224 | ||||||||||
| Real estate liabilities (d) | 52 | 52 | — | — | — | ||||||||||
| Tax contingencies (e) | — | — | — | — | — | ||||||||||
| Unrecorded contractual obligations: | |||||||||||||||
| Interest payments – long-term debt | 6,308 | 510 | 819 | 710 | 4,269 | ||||||||||
| Operating leases (b) | 3,876 | 198 | 398 | 364 | 2,916 | ||||||||||
| Purchase obligations (f) | 1,762 | 609 | 814 | 107 | 232 | ||||||||||
| Real estate obligations (g) | 216 | 185 | 31 | — | — | ||||||||||
| Future contributions to retirement plans (h) | — | — | — | — | — | ||||||||||
| Contractual obligations | $ | 26,506 | $ | 3,375 | $ | 3,553 | $ | 3,630 | $ | 15,948 |
| (a) | Represents principal payments only. See Note 20 of the Financial Statements for further information. |
| (b) | These payments also include $348 million and $269 million of legally binding minimum lease payments for stores that are expected to open in 2017 or later for capital and operating leases, respectively. See Note 22 of the Financial Statements for further information. |
| (c) | The timing of deferred compensation payouts is estimated based on payments currently made to former employees and retirees, forecasted investment returns, and the projected timing of future retirements. |
| (d) | Real estate liabilities include costs incurred but not paid related to the construction or remodeling of real estate and facilities. |
| (e) | Estimated tax contingencies of $222 million, including interest and penalties and primarily related to continuing operations, are not included in the table above because we are not able to make reasonably reliable estimates of the period of cash settlement. See Note 23 of the Financial Statements for further information. |
| (f) | Purchase obligations include all legally binding contracts such as firm minimum commitments for inventory purchases, merchandise royalties, equipment purchases, marketing-related contracts, software acquisition/license commitments, and service contracts. We issue inventory purchase orders in the normal course of business, which represent authorizations to purchase that are cancelable by their terms. We do not consider purchase orders to be firm inventory commitments; therefore, they are excluded from the table above. If we choose to cancel a purchase order, we may be obligated to reimburse the vendor for unrecoverable outlays incurred prior to cancellation. We also issue trade letters of credit in the ordinary course of business, which are excluded from this table as these obligations are conditioned on terms of the letter of credit being met. |
| (g) | Real estate obligations include commitments for the purchase, construction, or remodeling of real estate and facilities. |
| (h) | We have not included obligations under our pension plans in the contractual obligations table above because no additional amounts are required to be funded as of January 28, 2017. Our historical practice regarding these plans has been to contribute amounts necessary to satisfy minimum pension funding requirements, plus periodic discretionary amounts determined to be appropriate. |
Off Balance Sheet Arrangements: Other than the unrecorded contractual obligations noted above, we do not have any arrangements or relationships with entities that are not consolidated into the financial statements.
Critical Accounting Estimates
Our consolidated financial statements are prepared in accordance with GAAP, which requires us to make estimates and apply judgments that affect the reported amounts. In the Notes to Consolidated Financial Statements, we describe the significant accounting policies used in preparing the consolidated financial statements. Our management has discussed the development, selection, and disclosure of our critical accounting estimates with the Audit & Finance Committee of our Board of Directors. The following items require significant estimation or judgment:
Inventory and cost of sales: Our inventory is valued at the lower of cost or market. We reduce inventory for estimated losses related to shrink and markdowns. Our shrink estimate is based on historical losses verified by physical inventory counts. Historically, our actual physical inventory count results have shown our estimates to be reliable. Market adjustments for markdowns are recorded when the salability of the merchandise has diminished. We believe the risk of inventory obsolescence is largely mitigated because our inventory typically turns in less than three months. Inventory was $8,309 million and $8,601 million at January 28, 2017 and January 30, 2016, respectively, and is further described in Note 12 of the Financial Statements.
Vendor income: We receive various forms of consideration from our vendors (vendor income), principally earned as a result of volume rebates, markdown allowances, promotions, and advertising allowances. Substantially all vendor income is recorded as a reduction of cost of sales.
We establish a receivable for vendor income that is earned but not yet received. Based on the agreements in place, this receivable is computed by estimating when we have completed our performance and when the amount is earned. The majority of the year-end vendor income receivables are collected within the following fiscal quarter, and we do not believe there is a reasonable likelihood that the assumptions used in our estimate will change significantly. Historically, adjustments to our vendor income receivable have not been material. Vendor income receivable was $385 million and $384 million at January 28, 2017 and January 30, 2016, respectively. Vendor income is described further in Note 4 of the Financial Statements.
Long-lived assets: Long-lived assets are reviewed for impairment whenever events or changes in circumstances indicate that the carrying amounts may not be recoverable. The evaluation is performed at the lowest level of identifiable cash flows independent of other assets. An impairment loss would be recognized when estimated undiscounted future cash flows from the operation and/or disposition of the assets are less than their carrying amount. Measurement of an impairment loss would be based on the excess of the carrying amount of the asset group over its fair value. Fair value is measured using discounted cash flows or independent opinions of value, as appropriate. We recorded impairments of $43 million, $54 million, and $124 million in 2016, 2015, and 2014, respectively, which are described further in Note 14 of the Financial Statements.
Insurance/self-insurance: We retain a substantial portion of the risk related to certain general liability, workers' compensation, property loss, and team member medical and dental claims. However, we maintain stop-loss coverage to limit the exposure related to certain risks. Liabilities associated with these losses include estimates of both claims filed and losses incurred but not yet reported. We use actuarial methods which consider a number of factors to estimate our ultimate cost of losses. General liability and workers' compensation liabilities are recorded at our estimate of their net present value; other liabilities referred to above are not discounted. Our workers' compensation and general liability accrual was $447 million and $498 million at January 28, 2017 and January 30, 2016, respectively. We believe that the amounts accrued are appropriate; however, our liabilities could be significantly affected if future occurrences or loss developments differ from our assumptions. For example, a five percent increase or decrease in average claim costs would impact our self-insurance expense by $22 million in 2016. Historically, adjustments to our estimates have not been material. Refer to Item 7A, Quantitative and Qualitative Disclosures About Market Risk, for further disclosure of the market risks associated with these exposures. We maintain insurance coverage to limit our exposure to certain events, including network security matters.
Income taxes: We pay income taxes based on the tax statutes, regulations, and case law of the various jurisdictions in which we operate. Significant judgment is required in determining the timing and amounts of deductible and taxable items, and in evaluating the ultimate resolution of tax matters in dispute with tax authorities. The benefits of uncertain tax positions are recorded in our financial statements only after determining it is likely the uncertain tax positions would withstand challenge by taxing authorities. We periodically reassess these probabilities and record any changes in the financial statements as appropriate. Liabilities for uncertain tax positions, including interest and penalties, were $222 million and $215 million at January 28, 2017 and January 30, 2016, respectively, and primarily relate to continuing operations. We believe the resolution of these matters will not have a material adverse impact on our consolidated financial statements. Income taxes are described further in Note 23 of the Financial Statements.
Pension accounting: We maintain a funded qualified, defined benefit pension plan, as well as several smaller and unfunded nonqualified plans for certain current and retired team members. The costs for these plans are determined based on actuarial calculations using the assumptions described in the following paragraphs. Eligibility and the level of benefits varies depending on team members' full-time or part-time status, date of hire, age, and/or length of service. The benefit obligation and related expense for these plans are determined based on actuarial calculations using assumptions about the expected long-term rate of return, the discount rate, and compensation growth rates. The assumptions, with adjustments made for any significant plan or participant changes, are used to determine the period-end benefit obligation and establish expense for the next year.
Our 2016 expected long-term rate of return on plan assets of 6.8 percent is determined by the portfolio composition, historical long-term investment performance, and current market conditions. A one percentage point decrease in our expected long-term rate of return would increase annual expense by $37 million.
The discount rate used to determine benefit obligations is adjusted annually based on the interest rate for long-term high-quality corporate bonds, using yields for maturities that are in line with the duration of our pension liabilities. Our
benefit obligation and related expense will fluctuate with changes in interest rates. A 0.5 percentage point decrease to the weighted average discount rate would increase annual expense by $30 million.
Based on our experience, we use a graduated compensation growth schedule that assumes higher compensation growth for younger, shorter-service pension-eligible team members than it does for older, longer-service pension-eligible team members.
Pension benefits are further described in Note 28 of the Financial Statements.
Legal and other contingencies: We believe the accruals recorded in our consolidated financial statements properly reflect loss exposures that are both probable and reasonably estimable. We do not believe any of the currently identified claims or litigation may materially affect our results of operations, cash flows, or financial condition. However, litigation is subject to inherent uncertainties, and unfavorable rulings could occur. If an unfavorable ruling were to occur, it may cause a material adverse impact on the results of operations, cash flows, or financial condition for the period in which the ruling occurs, or future periods. Refer to Note 19 of the Financial Statements for further information on contingencies.
New Accounting Pronouncements
Refer to Note 2 and Note 22 of the Financial Statements for a description of new accounting pronouncements related to revenues and leases, respectively. We do not expect any other recently issued accounting pronouncements will have a material effect on our financial statements.
Forward-Looking Statements
This report contains forward-looking statements, which are based on our current assumptions and expectations. These statements are typically accompanied by the words "expect," "may," "could," "believe," "would," "might," "anticipates," or words of similar import. The principal forward-looking statements in this report include: our financial performance, statements regarding the adequacy of and costs associated with our sources of liquidity, the expected impact of the Pharmacy Transaction on our financial performance, the continued execution of our share repurchase program, our expected capital expenditures and new lease commitments, the impact of changes in the expected effective income tax rate on net income, the expected compliance with debt covenants, the expected impact of new accounting pronouncements, our intentions regarding future dividends, contributions and payments related to our pension plan, the expected returns on pension plan assets, the expected timing and recognition of compensation expenses, the effects of macroeconomic conditions, the adequacy of our reserves for general liability, workers' compensation and property loss, the expected outcome of, and adequacy of our reserves for investigations, inquiries, claims and litigation, including those related to the 2013 data breach, expected changes to our contractual obligations and liabilities, the expected ability to recognize deferred tax assets and liabilities and the timing of such recognition, the process, timing and effects of discontinuing our Canadian operations, the resolution of tax matters, changes in our assumptions and expectations, and the expected benefits of restructuring activities.
All such forward-looking statements are intended to enjoy the protection of the safe harbor for forward-looking statements contained in the Private Securities Litigation Reform Act of 1995, as amended. Although we believe there is a reasonable basis for the forward-looking statements, our actual results could be materially different. The most important factors which could cause our actual results to differ from our forward-looking statements are set forth on our description of risk factors in Item 1A to this Form 10-K, which should be read in conjunction with the forward-looking statements in this report. Forward-looking statements speak only as of the date they are made, and we do not undertake any obligation to update any forward-looking statement.
Previous: Item 6. Selected Financial Data · Next: Item 7A. Quantitative and Qualitative Disclosures About Market Risk