 filings.tools
Target 10-K 2021-01-30
Filed 2021-03-10. 22 sections, 300K characters. Original on sec.gov · Markdown · JSON
Cover and table of contents
| UNITED STATES SECURITIES AND EXCHANGE COMMISSION |
Washington, D.C. 20549
FORM 10-K
(Mark One)
☒ ANNUAL REPORT PURSUANT TO SECTION 13 OR 15(d) OF THE SECURITIES EXCHANGE ACT OF 1934
For the fiscal year ended January 30, 2021
OR
☐ TRANSITION REPORT PURSUANT TO SECTION 13 OR 15(d) OF THE SECURITIES EXCHANGE ACT OF 1934
For the transition period from ____ to ____
Commission File Number 1-6049

TARGET CORPORATION
(Exact name of registrant as specified in its charter)
Minnesota
(State or other jurisdiction of incorporation or organization)
1000 Nicollet Mall, Minneapolis, Minnesota
(Address of principal executive offices)
41-0215170
(I.R.S. Employer Identification No.)
55403
(Zip Code)
Registrant’s telephone number, including area code: 612/304-6073
Former name, former address and former fiscal year, if changed since last report: N/A
Securities registered pursuant to Section 12(b) of the Securities Exchange Act of 1934:
| Title of each class | Trading Symbol(s) | Name of each exchange on which registered | ||||||||||||
| Common stock, par value $0.0833 per share | TGT | New York Stock Exchange |
Securities registered pursuant to Section 12(g) of the Act: None
Indicate by check mark if the registrant is a well-known seasoned issuer, as defined in Rule 405 of the Securities Act. Yes ☒ No ☐
Indicate by check mark if the registrant is not required to file reports pursuant to Section 13 or Section 15(d) of the Act. Yes o No ☒
Note – Checking the box above will not relieve any registrant required to file reports pursuant to Section 13 or 15(d) of the Exchange Act from their obligations under those Sections.
Indicate by check mark whether the registrant (1) has filed all reports required to be filed by Section 13 or 15(d) of the Securities Exchange Act of 1934 during the preceding 12 months (or for such shorter period that the registrant was required to file such reports), and (2) has been subject to such filing requirements for the past 90 days. Yes ☒ No ☐
Indicate by check mark whether the registrant has submitted electronically every Interactive Data File required to be submitted pursuant to Rule 405 of Regulation S-T (§232.405 of this chapter) during the preceding 12 months (or for such shorter period that the registrant was required to submit such files). Yes ☒ No ☐
Indicate by check mark if disclosure of delinquent filers pursuant to Item 405 of Regulation S-K (§229.405 of this chapter) is not contained herein, and will not be contained, to the best of registrant's knowledge, in definitive proxy or information statements incorporated by reference in Part III of this Form 10-K or any amendment to this Form 10-K. ☒
Indicate by check mark whether the registrant is a large accelerated filer, an accelerated filer, a non-accelerated filer, smaller reporting company, or an emerging growth company (as defined in Rule 12b-2 of the Exchange Act).
| Large accelerated filer | x | Accelerated filer | o | Non-accelerated filer | o |
| Smaller reporting company | ☐ | Emerging growth company | ☐ |
If an emerging growth company, indicate by check mark if the registrant has elected not to use the extended transition period for complying with any new or revised financial accounting standards provided pursuant to Section 13(a) of the Exchange Act. ☐
Indicate by check mark whether the registrant has filed a report on and attestation to its management’s assessment of the effectiveness of its internal control over financial reporting under Section 404(b) of the Sarbanes-Oxley Act (15 U.S.C. 7262(b)) by the registered public accounting firm that prepared or issued its audit report. ☒
Indicate by check mark whether the registrant is a shell company (as defined in Rule 12b-2 of the Act). Yes ☐ No ☒
The aggregate market value of the voting stock held by non-affiliates of the registrant as of July 31, 2020, was $62,803,635,300 based on the closing price of $125.88 per share of Common Stock as reported on the New York Stock Exchange Composite Index.
Indicate the number of shares outstanding of each of registrant's classes of Common Stock, as of the latest practicable date. Total shares of Common Stock, par value $0.0833, outstanding as of March 4, 2021, were 498,616,180.
DOCUMENTS INCORPORATED BY REFERENCE
Portions of Target's Proxy Statement for the Annual Meeting of Shareholders to be held on June 9, 2021, are incorporated into Part III.
| Table of Contents | |||||
| Index to Financial Statements |
TABLE OF CONTENTS
| TARGET CORPORATION |  | 2020 Form 10-K | 1 |
| BUSINESS | Table of Contents | |||||||
| Index to Financial Statements |
PART I
Item 1. Business
General
Target Corporation (Target, the Corporation or the Company) was incorporated in Minnesota in 1902. We offer to our customers, referred to as "guests," everyday essentials and fashionable, differentiated merchandise at discounted prices. Our ability to deliver a preferred shopping experience to our guests is supported by our supply chain and technology, our devotion to innovation, our loyalty offerings and suite of fulfillment options, and our disciplined approach to managing our business and investing in future growth. We operate as a single segment designed to enable guests to purchase products seamlessly in stores or through our digital channels. Since 1946, we have given 5 percent of our profit to communities.
Financial Highlights
For information on key financial highlights, see Part II, Item 7, Management's Discussion and Analysis of Financial Condition and Results of Operations (MD&A).
Seasonality
A larger share of annual revenues and earnings traditionally occurs in the fourth quarter because it includes the November and December holiday sales period.
Merchandise
We sell a wide assortment of general merchandise and food. The majority of our general merchandise stores offer an edited food assortment, including perishables, dry grocery, dairy, and frozen items. Nearly all of our stores larger than 170,000 square feet offer a full line of food items comparable to traditional supermarkets. Our small format stores, generally smaller than 50,000 square feet, offer curated general merchandise and food assortments. Our digital channels include a wide merchandise assortment, including many items found in our stores, along with a complementary assortment.
A significant portion of our sales is from national brand merchandise. Approximately one-third of 2020 sales was related to our owned and exclusive brands, including but not limited to the following:
| Owned Brands | ||||||||
| A New Day™ | Hearth & Hand™ with Magnolia | Shade & Shore™ | ||||||
| All in Motion™ | heyday™ | Simply Balanced™ | ||||||
| Archer Farms™ | Hyde & EEK! Boutique™ | Smartly™ | ||||||
| Art Class™ | JoyLab™ | Smith & Hawken™ | ||||||
| Auden™ | Knox Rose™ | Sonia Kashuk™ | ||||||
| Ava & Viv™ | Kona Sol™ | Spritz™ | ||||||
| Boots & Barkley™ | Made By Design™ | Stars Above™ | ||||||
| Bullseye's Playground™ | Market Pantry™ | Sun Squad™ | ||||||
| Casaluna™ | More Than Magic™ | Threshold™ | ||||||
| Cat & Jack™ | Opalhouse™ | Universal Thread™ | ||||||
| Cloud Island™ | Open Story™ | up & up™ | ||||||
| Colsie™ | Original Use™ | Wild Fable™ | ||||||
| Embark™ | Pillowfort™ | Wondershop™ | ||||||
| Everspring™ | Project 62™ | Xhilaration™ | ||||||
| Good & Gather™ | Prologue™ | |||||||
| Goodfellow & Co™ | Room Essentials™ | |||||||
| Exclusive Adult Beverage Brands | ||||||||
| California Roots™ | Rosé Bae™ | Wine Cube™ | ||||||
| Mystic Reef™ | The Collection™ |
| TARGET CORPORATION | | 2020 Form 10-K | 2 |
| BUSINESS | Table of Contents | |||||||
| Index to Financial Statements |
We also sell merchandise through periodic exclusive design and creative partnerships and generate revenue from in-store amenities such as Target Café and leased or licensed departments such as Target Optical, Starbucks, and other food service offerings. CVS Pharmacy, Inc. (CVS) operates pharmacies and clinics in our stores under a perpetual operating agreement from which we generate annual occupancy income. In 2020, we announced a partnership with Ulta Beauty under which we will operate Ulta Beauty at Target, a shop-in-shop experience debuting on Target.com and in more than 100 Target locations beginning in 2021, with plans to scale to hundreds more over time.
Customer Loyalty Programs
Our guests receive a 5 percent discount on nearly all purchases and receive free shipping at Target.com when they use their Target Debit Card, Target Credit Card, or Target™ MasterCard® (collectively, RedCards™). We also seek to drive customer loyalty and trip frequency through our Target Circle program, where members earn 1 percent rewards on nearly all non-RedCard purchases, among other benefits.
Distribution
The vast majority of merchandise is distributed to our stores through our network of distribution centers. Common carriers ship merchandise to and from our distribution centers. Vendors or third-party distributors ship certain food items and other merchandise directly to our stores. Merchandise sold through our digital channels is distributed to our guests via common carriers (from stores, distribution centers, vendors, and third-party distributors), delivery via our wholly owned subsidiary, Shipt, Inc. (Shipt), and through guest pick-up at our stores. Our stores fulfill the majority of the digitally originated sales, which allows improved product availability, faster fulfillment times, reduced shipping costs, and allows us to offer guests a suite of same-day fulfillment options such as Order Pickup, Drive Up, and Shipt.
Human Capital Management
At Target, our purpose is to help all families discover the joy of everyday life. In support of this purpose we invest in our team, our most important asset, by giving them opportunities to grow professionally, take care of themselves, each other and their families, and to make a difference for our guests and our communities. We are among the largest private employers in the U.S., and our workforce has varying goals and expectations of their employment relationship, from team members looking to build a career to students, retirees and others who are seeking to supplement their income in an enjoyable atmosphere. We seek to be an employer of choice to attract and retain top talent no matter their objectives in seeking employment. To that end, we strive to foster an engaged, diverse, inclusive, safe, purpose-driven culture where employees, referred to as "team members," have equitable opportunities for success.
As of January 30, 2021, we employed approximately 409,000 full-time, part-time, and seasonal team members. Because of the seasonal nature of the retail business, employment levels peak in the holiday season. We also engage independent contractors, most notably in our Shipt subsidiary.
Talent Development and Engagement
We offer a compelling work environment with meaningful experiences and abundant growth and career-development opportunities. This starts with the opportunity to do challenging work and learn on the job and is supplemented by programs and continuous learning that help our team build skills at all levels, including programs focused on specialized skill development, leadership opportunities, coaching, and mentoring. Our talent and succession planning process supports the development of a diverse talent pipeline for leadership and other critical roles. We monitor our team members’ perceptions of these commitments through a number of surveys and take steps to address areas needing improvement.
| TARGET CORPORATION | | 2020 Form 10-K | 3 |
| BUSINESS | Table of Contents | |||||||
| Index to Financial Statements |
Diversity and Inclusion
We champion workplace diversity and inclusion and focus on developing, advancing, and recruiting diverse talent. We monitor the representation of women and racially or ethnically diverse team members at different levels throughout the company and disclose the composition of our team in our annual Workforce Diversity Report (which, beginning with our 2019 report, includes demographic information using the categories disclosed in our EEO-1 report). Developing teams where team members feel heard, respected, and included is a core Target value and is also fundamental to creating an inclusive guest experience.
Compensation and Benefits
Our compensation and benefits are designed to support the financial, mental, and physical well-being of our team members and their families. We believe in paying team members equitably, regardless of gender, race or ethnicity, and we regularly review the pay data of U.S. team members to confirm that we are doing so. Our compensation packages include a $15 per-hour minimum starting wage for US hourly team members (who comprise the vast majority of our team), a 401(k) plan with matching contributions up to five percent of eligible earnings, paid vacation and holidays, family leave, merchandise and other discounts, disability insurance, life insurance, healthcare and dependent care flexible spending accounts, tuition reimbursement, various team member assistance programs, an annual short-term incentive program, long-term equity awards, and health insurance benefits. Eligibility for, and the level of, benefits vary depending on team members’ full-time or part-time status, work location, compensation level, and tenure.
Workplace Health and Safety
We strive to maintain a safe and secure work environment and have specific safety programs. This includes administering a comprehensive occupational injury- and illness-prevention program and training for team members.
COVID-19
In 2020 we invested more than $1 billion in the well-being, health, and safety of our team members and guests. We extended certain benefits to our team members in light of the COVID-19 pandemic, including bonuses, fully-paid leaves for up to 30 days, free back-up dependent care, and a variety of mental, emotional, and physical wellness resources. We also enacted dozens of safety, social distancing, and cleaning measures designed to protect our team and guests during the COVID-19 pandemic.
Working Capital
Effective inventory management is key to our ongoing success, and we use various techniques including demand forecasting and planning and various forms of replenishment management. We achieve effective inventory management by staying in-stock in core product offerings, maintaining positive vendor relationships, and carefully planning inventory levels for seasonal and apparel items to minimize markdowns.
The Liquidity and Capital Resources section in MD&A provides additional details.
Competition
We compete with traditional and internet retailers, including department stores, off-price general merchandise retailers, wholesale clubs, category-specific retailers, drug stores, supermarkets, and other forms of retail commerce. Our ability to positively differentiate ourselves from other retailers and provide compelling value to our guests largely determines our competitive position within the retail industry.
Intellectual Property
Our brand image is a critical element of our business strategy. Our principal trademarks, including Target, our "Expect More. Pay Less." brand promise, and our "Bullseye Design," have been registered with the United States (U.S.) Patent and Trademark Office. We also seek to obtain and preserve intellectual property protection for our brands.
| TARGET CORPORATION | | 2020 Form 10-K | 4 |
| BUSINESS & RISK FACTORS | Table of Contents | |||||||
| Index to Financial Statements |
Geographic Information
Nearly all of our revenues are generated within the U.S. The vast majority of our property and equipment is located within the U.S.
Available Information
Our Annual Report on Form 10-K, quarterly reports on Form 10-Q, current reports on Form 8-K, proxy statements, and amendments to those reports filed or furnished pursuant to Section 13(a) or 15(d) of the Exchange Act are available free of charge at investors.target.com as soon as reasonably practicable after we file such material with, or furnish it to, the U.S. Securities and Exchange Commission (SEC). In addition, the SEC maintains a website (http://www.sec.gov) that contains information we electronically file with, or furnish to, the SEC. Our Corporate Governance Guidelines, Code of Ethics, Corporate Responsibility Report, and the charters for the committees of our Board of Directors are also available free of charge in print upon request or at investors.target.com. Information on our website is not part of this or any other report we file with, or furnish to, the SEC.
Item 1A. Risk Factors
Our business is subject to many risks. Set forth below are the material risks we face. Risks are listed in the categories where they primarily apply, but other categories may also apply.
Competitive and Reputational Risks
Our continued success is dependent on positive perceptions of Target which, if eroded, could adversely affect our business and our relationships with our guests and team members.
We believe that one of the reasons our shareholders, guests, team members, and vendors choose Target is the positive reputation we have built over many years for serving those different constituencies and the communities in which we operate. To be successful in the future, we must continue to preserve Target's reputation. Our reputation is based in large part on perceptions, and broad access to social media makes it easy for anyone to provide public feedback that can influence perceptions of Target. It may be difficult to control negative publicity, regardless of whether it is accurate. Target’s position or perceived lack of position on social, environmental, public policy or other sensitive issues, and any perceived lack of transparency about those matters, could harm our reputation. While reputations may take decades to build, negative incidents can quickly erode trust and confidence and can result in consumer boycotts, governmental investigations, or litigation. In addition, vendors and others with whom we do business may affect our reputation. For example, CVS operates clinics and pharmacies within our stores, and our guests’ perceptions of and experiences with CVS may affect our reputation. Negative reputational incidents could adversely affect our business through lost sales, loss of new store and development opportunities, or team member retention and recruiting difficulties.
If we are unable to positively differentiate ourselves from other retailers, our results of operations could be adversely affected.
We have been able to compete successfully by differentiating our guests’ shopping experience through a careful combination of price, merchandise assortment, store environment, convenience, guest service, loyalty programs, and marketing efforts. Guest perceptions regarding the cleanliness and safety of our stores, the functionality, reliability, and speed of our digital channels and fulfillment options, our in-stock levels, and the value of our promotions are among the factors that affect our ability to compete. In addition, our ability to create a personalized guest experience through the collection and use of accurate and relevant guest data is important to our ability to differentiate from other retailers. No single competitive factor is dominant, and actions by our competitors on any of these factors or the failure of our strategies could adversely affect our sales, gross margins, and expenses.
Our owned and exclusive brand products help differentiate us from other retailers, generally carry higher margins than equivalent national brand products and represent a significant portion of our overall sales. If we are unable to successfully develop, support, and evolve our owned and exclusive brands, if one or more of these brands experiences a loss of consumer acceptance or confidence, or if we are unable to successfully protect our intellectual property rights, our sales and gross margins could be adversely affected.
| TARGET CORPORATION | | 2020 Form 10-K | 5 |
| RISK FACTORS | Table of Contents | |||||||
| Index to Financial Statements |
The retail industry's continuing migration to digital channels has affected the ways we differentiate from other retailers. In particular, consumers are able to quickly and conveniently comparison shop and determine real-time product availability using digital tools, which can lead to decisions based solely on price or the functionality of the digital tools. Consumers may also use third-party channels or devices, such as voice assistants and smart home devices, to initiate shopping searches and place orders, which could sometimes make us dependent on the capabilities and search algorithms of those third parties to reach those consumers. Any difficulties in executing our differentiation efforts, actions by our competitors in response to these efforts, or failures by vendors in managing their own channels, content and technology systems to support these efforts could adversely affect our sales, gross margins, and expenses.
If we are unable to successfully provide a relevant and reliable experience for our guests across multiple channels, our sales, results of operations and reputation could be adversely affected.
Our business has evolved from an in-store experience to interaction with guests across multiple channels (in-store, online, mobile, social media, voice assistants, and smart home devices, among others). Our guests are using those channels to shop with us and provide feedback and public commentary about our business. We must anticipate and meet changing guest expectations and counteract developments and investments by our competitors. Our evolving retailing efforts include implementing technology, software and processes to be able to conveniently and cost-effectively fulfill guest orders directly from any point within our system of stores and distribution centers and from our vendors. We also need to collect accurate, relevant, and usable guest data to personalize our offerings. Providing multiple fulfillment options and implementing new technology is complex and may not meet expectations for accurate order fulfillment, faster and guaranteed delivery times, low-cost or free shipping, and desired payment methods. Even when we are successful in meeting expectations for fulfillment, if we are unable to offset increased costs of fulfilling orders outside of our traditional in-store channel with efficiencies, cost-savings or expense reductions, our results of operations could be adversely affected.
If we do not anticipate and respond quickly to changing consumer preferences, our sales and profitability could suffer.
A large part of our business is dependent on our ability to make trend-right decisions and effectively manage our inventory in a broad range of merchandise categories, including apparel, accessories, home décor, electronics, toys, seasonal offerings, food, and others. If we do not obtain accurate and relevant data on guest preferences, predict and quickly respond to changing consumer tastes, preferences, spending patterns and other lifestyle decisions, emphasize the correct categories, implement competitive and effective pricing and promotion strategies, or personalize our offerings to our guests, we may experience lost sales, spoilage, and increased inventory markdowns, which could adversely affect our results of operations.
Investments and Infrastructure Risks
If our capital investments in remodeling existing stores, building new stores, and improving technology and supply chain infrastructure do not achieve appropriate returns, our competitive position, financial condition and results of operations could be adversely affected.
Our business depends, in part, on our ability to remodel existing stores and build new stores in a manner that achieves appropriate returns on our capital investment. Our store remodel program is large and is being implemented using a custom approach based on the condition of each store and characteristics of the surrounding neighborhood. When building new stores, we compete with other retailers and businesses for suitable locations for our stores. Pursuing the wrong remodel or new store opportunities and any delays, cost increases, disruptions or other uncertainties related to those opportunities could adversely affect our results of operations.
We are making, and expect to continue to make, significant investments in technology and selective acquisitions to improve guest experiences across multiple channels and improve the speed, accuracy, and cost efficiency of our supply chain and inventory management systems. The effectiveness of these investments can be less predictable than remodeling stores, and might not provide the anticipated benefits or desired rates of return. In addition, if we are unable to successfully protect any intellectual property rights resulting from our investments, the value received from those investments may be eroded, which could adversely affect our financial condition.
| TARGET CORPORATION | | 2020 Form 10-K | 6 |
| RISK FACTORS | Table of Contents | |||||||
| Index to Financial Statements |
Pursuing the wrong investment opportunities, being unable to make new concepts scalable, making an investment commitment significantly above or below our needs, or failing to effectively incorporate acquired businesses into our business could result in the loss of our competitive position and adversely affect our financial condition or results of operations.
A significant disruption in our computer systems and our inability to adequately maintain and update those systems could adversely affect our operations and negatively affect our guests.
We rely extensively on computer systems throughout our business. We also rely on continued and unimpeded access to the Internet to use our computer systems. Our systems are subject to damage or interruption from power outages, telecommunications failures, computer viruses, malicious attacks, security breaches, catastrophic events, and implementation errors. If our systems are damaged, disrupted or fail to function properly or reliably, we may incur substantial repair or replacement costs, experience data loss or theft and impediments to our ability to manage inventories or process guest transactions, and encounter lost guest confidence, which could require additional promotional activities to attract guests and otherwise adversely affect our results of operations. We continually invest to maintain and update our computer systems. Implementing significant system changes increases the risk of computer system disruption. The potential problems and interruptions associated with implementing technology initiatives, as well as providing training and support for those initiatives, could disrupt or reduce our operational efficiency, and could negatively impact guest experience and guest confidence. For example, in the past we have experienced disruptions in our point-of-sale system that prevented our ability to process debit or credit transactions, negatively impacted some guests’ experiences, and generated negative publicity.
Information Security, Cybersecurity, and Data Privacy Risks
If our efforts to provide information security, cybersecurity, and data privacy are unsuccessful or if we are unable to meet increasingly demanding regulatory requirements, we may face additional costly government enforcement actions and private litigation, and our reputation and results of operations could suffer.
We regularly receive and store information about our guests, team members, vendors, and other third parties. We have programs in place to detect, contain, and respond to data security incidents. However, because the techniques used to obtain unauthorized access, disable or degrade service, or sabotage systems change frequently and may be difficult to detect for long periods of time, we may be unable to anticipate these techniques or implement adequate preventive measures. In addition, hardware, software, or applications we develop or procure from third parties may contain defects in design or manufacture or other problems that could unexpectedly compromise information security, cybersecurity, and data privacy. Unauthorized parties may also attempt to gain access to our systems or facilities, or those of third parties with whom we do business, through fraud, trickery, or other forms of deceiving our team members, contractors, and vendors.
Prior to 2013, all data security incidents we encountered were insignificant. Our 2013 data breach was significant and went undetected for several weeks. Both we and our vendors have had data security incidents since the 2013 data breach; however, to date these other incidents have not been material to our results of operations. Based on the prominence and notoriety of the 2013 data breach, even minor additional data security incidents could draw greater scrutiny. If we, our vendors, or other third parties with whom we do business experience additional significant data security incidents or fail to detect and appropriately respond to significant incidents, we could be exposed to additional government enforcement actions and private litigation. In addition, our guests could lose confidence in our ability to protect their information, discontinue using our RedCards or loyalty programs, or stop shopping with us altogether, which could adversely affect our reputation, sales, and results of operations.
The legal and regulatory environment regarding information security, cybersecurity, and data privacy is increasingly demanding and has enhanced requirements for using and treating personal data. Complying with data protection requirements, such as those imposed by a variety of state laws, may cause us to incur substantial costs, require changes to our business practices, limit our ability to obtain data used to provide a differentiated guest experience, and expose us to further litigation and regulatory risks, each of which could adversely affect our results of operations.
| TARGET CORPORATION | | 2020 Form 10-K | 7 |
| RISK FACTORS | Table of Contents | |||||||
| Index to Financial Statements |
Supply Chain and Third-Party Risks
Changes in our relationships with our vendors, changes in tax or trade policy, interruptions in our operations or supply chain or increased commodity or supply chain costs could adversely affect our results of operations.
We are dependent on our vendors, including common carriers, to supply merchandise to our distribution centers, stores, and guests. As we continue to add capabilities to quickly move the appropriate amount of inventory at optimal operational costs through our entire supply chain, operating our fulfillment network becomes more complex and challenging. If our fulfillment network does not operate properly, if a vendor fails to deliver on its commitments, or if common carriers have difficulty providing capacity to meet demands for their services like they experienced at times during 2020, we could experience merchandise out-of-stocks, delivery delays or increased delivery costs, which could lead to lost sales and decreased guest confidence, and adversely affect our results of operations.
A large portion of our merchandise is sourced, directly or indirectly, from outside the U.S., with China as our single largest source. Any major changes in tax or trade policy, such as the imposition of additional tariffs or duties on imported products, between the U.S. and countries from which we source merchandise could require us to take certain actions, including for example raising prices on products we sell and seeking alternative sources of supply from vendors in other countries with whom we have less familiarity, which could adversely affect our reputation, sales, and our results of operations.
Political or financial instability, currency fluctuations, the outbreak of pandemics or other illnesses (such as the COVID-19 pandemic), labor unrest, transport capacity and costs, port security, weather conditions, natural disasters, or other events that could alter or suspend our operations, slow or disrupt port activities, or affect foreign trade are beyond our control and could materially disrupt our supply of merchandise, increase our costs, and/or adversely affect our results of operations. There have been periodic labor disputes impacting the U.S. ports that have caused us to make alternative arrangements to continue the flow of inventory, and if these types of disputes recur, worsen, or occur in other countries through which we source products, it may have a material impact on our costs or inventory supply. Changes in the costs of procuring commodities used in our merchandise or the costs related to our supply chain, could adversely affect our results of operations.
A disruption in relationships with third-party service providers could adversely affect our operations.
We rely on third parties to support our business, including portions of our technology infrastructure, development and support, our digital platforms and fulfillment operations, credit and debit card transaction processing, extensions of credit for our 5% RedCard Rewards loyalty program, the clinics and pharmacies operated by CVS within our stores, the infrastructure supporting our guest contact centers, aspects of our food offerings, and delivery services. If we are unable to contract with third parties having the specialized skills needed to support those strategies or integrate their products and services with our business, or if they fail to meet our performance standards and expectations, then our reputation and results of operations could be adversely affected. For example, if our guests unfavorably view CVS’s operations, our ability to discontinue the relationship is limited and our results of operations could be adversely affected.
Legal, Regulatory, Global and Other External Risks
The COVID-19 pandemic has affected our business in many different ways, and may continue to amplify the risks and uncertainties facing our business and their potential impact on our financial position, results of operations, and cash flows.
The COVID-19 pandemic has significantly affected U.S. consumer shopping patterns and caused the overall health of the U.S. economy to deteriorate. In 2020, our sales growth was most pronounced in lower margin categories with an increased percentage originated through our digital channels. While some of the changes in guest shopping patterns in connection with the COVID-19 pandemic may be temporary, others could become long-lasting. If the shifts in our category sales mix to lower-margin merchandise and fulfilling a significantly larger percentage of our sales through digital channels become long-lasting and we are unable to offset the lower margin and increased costs of fulfilling orders outside of our traditional in-store channel with efficiencies, cost-savings, or expense reductions, our results of operations could be adversely affected.
| TARGET CORPORATION | | 2020 Form 10-K | 8 |
| RISK FACTORS | Table of Contents | |||||||
| Index to Financial Statements |
Shifts in shopping patterns during the COVID-19 pandemic have also significantly affected our inventory position and disrupted our supply chain. At times we have been unable to procure certain merchandise items in the quantities our guests seek, including those most in demand due to the COVID-19 pandemic. If we have additional times where we are unable to re-stock those products for an extended period, it may lead to lost sales and negatively affect our results of operations. For other products with demand below historic levels, many of which are in higher-margin categories such as Apparel and Accessories, we took actions to help manage that inventory, such as slowing or cancelling purchase orders and paying related cancellation fees, asking vendors to store excess inventory on their premises, and accelerating markdowns of inventory. Those increased costs, along with lost sales for those higher-margin products, have at times negatively affected, and may continue to negatively affect, our profitability. Our vendors have been and may be affected by the COVID-19 pandemic in differing ways. Some financially distressed vendors may be unable to survive the COVID-19 pandemic, which would require us to seek alternative vendors, while others are having difficulty supplying us products in the quantities our guests seek, which could negatively affect our results of operations.
Nearly all of our stores, digital channels, and distribution centers have remained open during the COVID-19 pandemic. We have incurred significant SG&A expenses related to efforts to protect the health and well-being of our guests and team members. Most of our headquarters operations have transitioned to remote working arrangements, which has amplified our already extensive reliance on computer systems and on our continued and unimpeded access to the Internet to use those systems. During parts of the COVID-19 pandemic, we have had to temporarily alter other parts of our operations, including adjusting our in-store returns process, suspending physical inventory counts at our stores, metering guest traffic, reducing store hours, and, in some locations, restricting access to “non-essential” sections of our stores due to emergency state or local operating restrictions. Those temporary alterations to our operations have at times negatively affected, and in the future could negatively affect, the guest experience, sales, and our results of operations. In addition, if guests or team members have negative perceptions about the cleanliness and safety of our stores in light of the COVID-19 pandemic, our reputation, the guest experience, sales, and our results of operations could be adversely affected.
During the COVID-19 pandemic some of our competitors were forced to temporarily suspend or limit their operations. In addition, many guests significantly reduced their spending on dining, travel, lodging, and other leisure activities outside their homes. Both of those factors may have contributed to our increased sales during the COVID-19 pandemic. As our competitors return to full operations and guests return to spending on those other categories, it could lead to lower sales than we experienced during the COVID-19 pandemic, which could negatively affect our results of operations.
A continued and prolonged deterioration in the health in the U.S. economy could lead to a reduction in our sales in the future, which could magnify any negative effects of the COVID-19 pandemic on our results of operations and negatively and materially affect additional areas of our business, such as asset impairment evaluations and the amount of credit card profit-sharing revenue payments we receive from TD Bank Group (TD).
The full extent of the impact of the COVID-19 pandemic on our business, financial position, and results of operations may not be known for an extended period and will depend on future developments, many of which are outside of our control, including the duration and spread of the COVID-19 pandemic, the availability and effectiveness of the COVID-19 vaccines, and related actions taken by the U.S., state, local, and international governments, which are uncertain and cannot be predicted. If the COVID-19 pandemic continues without improvement or worsens, its impacts could be more prolonged and may become more severe. The fluidity of this situation limits our ability to predict the ultimate impact of COVID-19 on our business, financial condition, and financial performance, which could be material.
Our earnings depend on the state of macroeconomic conditions and consumer confidence in the U.S.
Nearly all of our sales are in the U.S., making our results highly dependent on U.S. consumer confidence and the health of the U.S. economy. Deterioration in macroeconomic conditions or consumer confidence could negatively affect our business in many ways, including slowing sales growth, reducing overall sales, and reducing gross margins.
| TARGET CORPORATION | | 2020 Form 10-K | 9 |
| RISK FACTORS | Table of Contents | |||||||
| Index to Financial Statements |
These same considerations impact the success of our credit card program. We share in the profits generated by the credit card program with TD, which owns the receivables generated by our proprietary credit cards. Deterioration in macroeconomic conditions or changes in consumer preferences concerning our credit card program could adversely affect the volume of new credit accounts, the amount of credit card program balances, and the ability of credit card holders to pay their balances. These conditions could result in us receiving lower profit-sharing payments.
Uncharacteristic or significant weather conditions, natural disasters, and other catastrophic events could adversely affect our results of operations.
Uncharacteristic or significant weather conditions can affect consumer shopping patterns, particularly in apparel and seasonal items, which could lead to lost sales or greater than expected markdowns and adversely affect our short-term results of operations. In addition, three of our largest states by total sales are California, Texas and Florida, areas where natural disasters are more prevalent. Natural disasters in those states or in other areas where our sales or operations are concentrated could result in significant physical damage to or closure of one or more of our stores, distribution centers, facilities, or key vendors. In addition, natural disasters and other catastrophic events, such as the COVID-19 pandemic, in areas where we or our vendors have operations, could cause delays in the distribution of merchandise from our vendors to our distribution centers, stores, and guests, affect consumer purchasing power, or reduce consumer demand, which could adversely affect our results of operations by increasing our costs and lowering our sales.
We rely on a large, global, and changing workforce of team members, contractors, and temporary staffing. If we do not effectively manage our workforce and the concentration of work in certain global locations, our labor costs and results of operations could be adversely affected.
With over 350,000 team members, our workforce costs represent our largest operating expense, and our business is dependent on our ability to attract, train, and retain the appropriate mix of qualified team members, contractors, and temporary staffing and effectively organize and manage those resources as our business and strategic priorities change. Many team members are in entry-level or part-time positions with historically high turnover rates. Our ability to meet our changing labor needs while controlling our costs is subject to external factors such as labor laws and regulations, unemployment levels, prevailing wage rates, benefit costs, changing demographics, and our reputation and relevance within the labor market. If we are unable to attract and retain a workforce meeting our needs, our operations, guest service levels, support functions, and competitiveness could suffer and our results of operations could be adversely affected. We are periodically subject to labor organizing efforts. If we become subject to one or more collective bargaining agreements in the future, it could adversely affect our labor costs and how we operate our business. In addition to our United States operations, we have support offices in India and China, and any extended disruption of our operations in our different locations, whether due to labor difficulties or otherwise, could adversely affect our operations and financial results.
Failure to address product safety and sourcing concerns could adversely affect our sales and results of operations.
If our merchandise offerings do not meet applicable safety standards or Target's or our guests’ expectations regarding safety, supply chain transparency and responsible sourcing, we could experience lost sales and increased costs and be exposed to legal and reputational risk. All of our vendors must comply with applicable product safety laws, and we are dependent on them to ensure that the products we buy comply with all safety standards. Events that give rise to actual, potential or perceived product safety concerns, including food or drug contamination and product defects, could expose us to government enforcement action or private litigation and result in costly product recalls and other liabilities. Our sourcing vendors, including any third parties selling through our digital channels, must also meet our expectations across multiple areas of social compliance, including supply chain transparency and responsible sourcing. We have a social compliance audit process that perform audits on a regular basis, but we cannot continuously monitor every vendor, so we are also dependent on our vendors to ensure that the products we buy comply with our standards. If we need to seek alternative sources of supply from vendors with whom we have less familiarity, the risk of our standards not being met may increase. Negative guest perceptions regarding the safety and sourcing of the products we sell and events that give rise to actual, potential or perceived compliance and social responsibility concerns could hurt our reputation, result in lost sales, cause our guests to seek alternative sources for their needs, and make it difficult and costly for us to regain the confidence of our guests.
| TARGET CORPORATION | | 2020 Form 10-K | 10 |
| RISK FACTORS & UNRESOLVED STAFF COMMENTS | Table of Contents | |||||||
| Index to Financial Statements |
Our failure to comply with federal, state, local, and international laws, or changes in these laws could increase our costs, reduce our margins, and lower our sales.
Our business is subject to a wide array of laws and regulations.
Our expenses could increase and our operations could be adversely affected by law changes or adverse judicial developments involving an employer's obligation to recognize collective bargaining units, minimum wage requirements, advance scheduling notice requirements, health care mandates, the classification of exempt and non-exempt employees, and the classification of workers as either employees or independent contractors (particularly as it applies to our Shipt subsidiary, a technology company that connects Shipt members through its online marketplace with a network of independent contractors who select, purchase, and deliver groceries and household essentials ordered from Target and other retailers). The classification of workers as employees or independent contractors in particular is an area that is experiencing legal challenges and legislative changes. If our Shipt subsidiary is required to treat its independent contractor network as employees, it could result in higher compensation and benefit costs.
Changes in the legal or regulatory environment affecting information security, cybersecurity and data privacy, product safety, payment methods and related fees, responsible sourcing, supply chain transparency, or environmental protection, among others, could cause our expenses to increase without an ability to pass through any increased expenses through higher prices. In addition, if we fail to comply with other applicable laws and regulations, including the Foreign Corrupt Practices Act and local anti-bribery laws, we could be subject to reputation and legal risk, including government enforcement action and class action civil litigation, which could adversely affect our results of operations by increasing our costs, reducing our margins, and lowering our sales.
Financial Risks
Increases in our effective income tax rate could adversely affect our business, results of operations, liquidity, and net income.
A number of factors influence our effective income tax rate, including changes in tax law and related regulations, tax treaties, interpretation of existing laws, and our ability to sustain our reporting positions on examination. Changes in any of those factors could change our effective tax rate, which could adversely affect our net income. In addition, our operations outside of the U.S. may cause greater volatility in our effective tax rate.
If we are unable to access the capital markets or obtain bank credit, our financial position, liquidity, and results of operations could suffer.
We are dependent on a stable, liquid, and well-functioning financial system to fund our operations and capital investments. Our continued access to financial markets depends on multiple factors including the condition of debt capital markets, our operating performance, and maintaining strong credit ratings. If rating agencies lower our credit ratings, it could adversely affect our ability to access the debt markets, our cost of funds, and other terms for new debt issuances. Each of the credit rating agencies reviews its rating periodically, and there is no guarantee our current credit rating will remain the same. In addition, we use a variety of derivative products to manage our exposure to market risk, principally interest rate fluctuations. Disruptions or turmoil in the financial markets could reduce our ability to fund our operations and capital investments, and lead to losses on derivative positions resulting from counterparty failures, which could adversely affect our financial position and results of operations.
Item 1B. Unresolved Staff Comments
Not applicable.
| TARGET CORPORATION | | 2020 Form 10-K | 11 |
| PROPERTIES | Table of Contents | |||||||
| Index to Financial Statements |
Item 2. Properties
| Stores as of January 30, 2021 | Stores | Retail Sq. Ft. (in thousands) | Stores as of January 30, 2021 | Stores | Retail Sq. Ft. (in thousands) | |||||||||||||||
| Alabama | 22 | 3,132 | Montana | 7 | 777 | |||||||||||||||
| Alaska | 3 | 504 | Nebraska | 14 | 2,005 | |||||||||||||||
| Arizona | 46 | 6,080 | Nevada | 18 | 2,262 | |||||||||||||||
| Arkansas | 9 | 1,165 | New Hampshire | 9 | 1,148 | |||||||||||||||
| California | 307 | 36,968 | New Jersey | 47 | 5,992 | |||||||||||||||
| Colorado | 42 | 6,244 | New Mexico | 10 | 1,185 | |||||||||||||||
| Connecticut | 21 | 2,731 | New York | 87 | 10,289 | |||||||||||||||
| Delaware | 3 | 440 | North Carolina | 51 | 6,540 | |||||||||||||||
| District of Columbia | 5 | 342 | North Dakota | 4 | 554 | |||||||||||||||
| Florida | 126 | 17,142 | Ohio | 64 | 7,829 | |||||||||||||||
| Georgia | 50 | 6,814 | Oklahoma | 15 | 2,167 | |||||||||||||||
| Hawaii | 7 | 1,111 | Oregon | 20 | 2,312 | |||||||||||||||
| Idaho | 6 | 664 | Pennsylvania | 75 | 9,094 | |||||||||||||||
| Illinois | 99 | 12,131 | Rhode Island | 4 | 517 | |||||||||||||||
| Indiana | 32 | 4,185 | South Carolina | 19 | 2,359 | |||||||||||||||
| Iowa | 21 | 2,859 | South Dakota | 5 | 580 | |||||||||||||||
| Kansas | 17 | 2,385 | Tennessee | 30 | 3,816 | |||||||||||||||
| Kentucky | 14 | 1,571 | Texas | 153 | 21,029 | |||||||||||||||
| Louisiana | 15 | 2,120 | Utah | 14 | 1,950 | |||||||||||||||
| Maine | 5 | 630 | Vermont | 1 | 60 | |||||||||||||||
| Maryland | 40 | 4,960 | Virginia | 60 | 7,754 | |||||||||||||||
| Massachusetts | 49 | 5,506 | Washington | 40 | 4,424 | |||||||||||||||
| Michigan | 53 | 6,286 | West Virginia | 6 | 755 | |||||||||||||||
| Minnesota | 73 | 10,315 | Wisconsin | 36 | 4,427 | |||||||||||||||
| Mississippi | 6 | 743 | Wyoming | 2 | 187 | |||||||||||||||
| Missouri | 35 | 4,608 | ||||||||||||||||||
| Total | 1,897 | 241,648 |
| Stores and Distribution Centers as of January 30, 2021 | Stores | Distribution Centers (a) | ||||||
| Owned | 1,526 | 34 | ||||||
| Leased | 214 | 10 | ||||||
| Owned buildings on leased land | 157 | — | ||||||
| Total | 1,897 | 44 |
*(a)*The 44 distribution centers have a total of 54.3 million square feet.
We own our corporate headquarters buildings located in and around Minneapolis, Minnesota, and we lease and own additional office space elsewhere in Minneapolis and the U.S. We also lease office space in other countries. Our properties are in good condition, well maintained, and suitable to carry on our business.
For additional information on our properties, see the Capital Expenditures section in MD&A and Notes 11 and 17 to Part II, Item 8, Financial Statements and Supplementary Data (the Financial Statements).
| TARGET CORPORATION | | 2020 Form 10-K | 12 |
| LEGAL PROCEEDINGS & MINE SAFETY DISCLOSURES | Table of Contents | |||||||
| Index to Financial Statements |
Item 3. Legal Proceedings
The following proceedings are being reported pursuant to Item 103 of Regulation S-K:
The Federal Securities Law Class Actions and ERISA Class Actions described below relate to certain prior disclosures by Target about its expansion of retail operations into Canada (the Canada Disclosure).
Federal Securities Law Class Actions
On May 17, 2016 and May 24, 2016, Target Corporation and certain present and former officers were named as defendants in two purported federal securities law class actions (the Federal Securities Law Class Actions) filed in the U.S. District Court for the District of Minnesota (the Court). The lead plaintiff filed a Consolidated Amended Class Action Complaint (First Complaint) on November 14, 2016, alleging violations of Sections 10(b) and 20(a) of the Securities Exchange Act of 1934, as amended, and Rule 10b-5 relating to the Canada Disclosure and naming Target, its former chief executive officer, its present chief operating officer, and the former president of Target Canada as defendants. On March 19, 2018, the Court denied the plaintiff's motion to alter or amend the final judgment issued on July 31, 2017, dismissing the Federal Securities Law Class Actions. On April 18, 2018, the plaintiff appealed the Court's final judgment. On April 10, 2020, the U.S. Court of Appeals for the Eighth Circuit (the Appeals Court) affirmed the prior decision by the Court dismissing the Federal Securities Law Class Actions. The plaintiffs did not seek further review, so this matter is now concluded.
ERISA Class Actions
On July 12, 2016 and July 15, 2016, Target Corporation, the Plan Investment Committee and Target’s current chief operating officer were named as defendants in two purported Employee Retirement Income Security Act of 1974 (ERISA) class actions filed in the Court. The plaintiffs filed an Amended Class Action Complaint (the First ERISA Class Action) on December 14, 2016, alleging violations of Sections 404 and 405 of ERISA relating to the Canada Disclosure and naming Target, the Plan Investment Committee, and seven present or former officers as defendants. The plaintiffs sought to represent a class consisting of all persons who were participants in or beneficiaries of the Target Corporation 401(k) Plan or the Target Corporation Ventures 401(k) Plan (collectively, the Plans) at any time between February 27, 2013 and May 19, 2014 and whose Plan accounts included investments in Target stock. The plaintiffs sought damages, an injunction and other unspecified equitable relief, and attorneys’ fees, expenses, and costs, based on allegations that the defendants breached their fiduciary duties by failing to take action to prevent Plan participants from continuing to purchase Target stock during the class period at prices that allegedly were artificially inflated. After the Court dismissed the First ERISA Class Action on July 31, 2017, the plaintiffs filed a new ERISA Class Action (the Second ERISA Class Action) with the Court on August 30, 2017, which had substantially similar allegations, defendants, class representation, and damages sought as the First ERISA Class Action, except that the class period was extended to August 6, 2014. On June 15, 2018, the Court granted the motion by Target and the other defendants to dismiss the Second ERISA Class Action. On July 16, 2018, the plaintiffs appealed the Court's dismissal. On July 28, 2020, the Appeals Court affirmed the prior decision by the Court dismissing the Second ERISA Class Action. The plaintiffs did not seek further review, so this matter is now concluded.
Item 4. Mine Safety Disclosures
Not applicable.
| TARGET CORPORATION | | 2020 Form 10-K | 13 |
| EXECUTIVE OFFICERS | Table of Contents | |||||||
| Index to Financial Statements |
Item 4A. Executive Officers
Executive officers are elected by, and serve at the pleasure of, the Board of Directors. There are no family relationships between any of the officers named and any other executive officer or member of the Board of Directors, or any arrangement or understanding pursuant to which any person was selected as an officer.
| Name | Title and Business Experience | Age | ||||||
| Katie M. Boylan | Executive Vice President and Chief Communications Officer since February 2021. Senior Vice President and Chief Communications Officer from January 2019 to February 2021. Senior Vice President, Communications from June 2017 to January 2019. Vice President, Communications from December 2015 to June 2017. | 44 | ||||||
| Brian C. Cornell | Chairman of the Board and Chief Executive Officer since August 2014. | 62 | ||||||
| Michael J. Fiddelke | Executive Vice President and Chief Financial Officer since November 2019. Senior Vice President, Operations from August 2018 to October 2019. Senior Vice President, Merchandising Capabilities from March 2017 to August 2018. Senior Vice President, Financial Planning & Analysis from July 2015 to March 2017. | 44 | ||||||
| Rick H. Gomez | Executive Vice President and Chief Food and Beverage Officer since February 2021. Executive Vice President and Chief Marketing, Digital & Strategy Officer from December 2019 to February 2021. Executive Vice President and Chief Marketing & Digital Officer from January 2019 to December 2019. Executive Vice President and Chief Marketing Officer from January 2017 to January 2019. Senior Vice President, Brand and Category Marketing from April 2013 to January 2017. | 51 | ||||||
| A. Christina Hennington | Executive Vice President and Chief Growth Officer since February 2021. Executive Vice President and Chief Merchandising Officer, Hardlines, Essentials and Capabilities from January 2020 to February 2021. Senior Vice President, Group Merchandise Manager, Essentials, Beauty, Hardlines and Services from January 2019 to January 2020. Senior Vice President, Merchandising Essentials, Beauty and Wellness from April 2017 to January 2019. Senior Vice President, Merchandising Transformation and Operations from August 2015 to April 2017. | 46 | ||||||
| Melissa K. Kremer | Executive Vice President and Chief Human Resources Officer since January 2019. Senior Vice President, Talent and Organizational Effectiveness from October 2017 to January 2019. Vice President, Human Resources, Merchandising, Strategy & Innovation, from September 2015 to October 2017. | 43 | ||||||
| Don H. Liu | Executive Vice President, Chief Legal & Risk Officer and Corporate Secretary since October 2017. Executive Vice President, Chief Legal Officer and Corporate Secretary from August 2016 to September 2017. Executive Vice President, General Counsel and Corporate Secretary of Xerox Corporation from July 2014 to August 2016. | 59 | ||||||
| Michael E. McNamara | Executive Vice President and Chief Information Officer since January 2019. Executive Vice President and Chief Information & Digital Officer from September 2016 to January 2019. Executive Vice President and Chief Information Officer from June 2015 to September 2016. | 56 | ||||||
| John J. Mulligan | Executive Vice President and Chief Operating Officer since September 2015. | 55 | ||||||
| Jill K. Sando | Executive Vice President and Chief Merchandising Officer since February 2021. Executive Vice President and Chief Merchandising Officer, Style and Owned Brands from January 2020 to February 2021. Senior Vice President, Group Merchandise Manager, Apparel & Accessories and Home from January 2019 to January 2020. Senior Vice President, Home from May 2014 to January 2019. | 52 | ||||||
| Mark J. Schindele | Executive Vice President and Chief Stores Officer since January 2020. Senior Vice President, Target Properties from January 2015 to January 2020. | 52 | ||||||
| Cara A. Sylvester | Executive Vice President and Chief Marketing & Digital Officer since February 2021. Senior Vice President, Home from March 2019 to February 2021. Vice President, Beauty & Dermstore from June 2017 to March 2019. From March 2014 to June 2017, Ms. Sylvester held different leadership positions in Housewares. | 43 | ||||||
| Laysha L. Ward | Executive Vice President and Chief External Engagement Officer since January 2017. Executive Vice President and Chief Corporate Social Responsibility Officer from December 2014 to January 2017. | 53 |
| TARGET CORPORATION | | 2020 Form 10-K | 14 |
| OTHER INFORMATION | Table of Contents | |||||||
| Index to Financial Statements |
PART II
Item 5. Market for the Registrant's Common Equity, Related Stockholder Matters and Issuer Purchases of Equity Securities
Our common stock is listed on the New York Stock Exchange under the symbol "TGT." We are authorized to issue up to 6,000,000,000 shares of common stock, par value $0.0833, and up to 5,000,000 shares of preferred stock, par value $0.01. As of March 4, 2021, there were 13,760 shareholders of record. Dividends declared per share for the twelve months ended January 30, 2021, February 1, 2020, and February 2, 2019, are disclosed on our Consolidated Statements of Shareholders' Investment.
On September 19, 2019, our Board of Directors authorized a $5 billion share repurchase program with no stated expiration. We began repurchasing shares under the authorization during the first quarter of 2020. Under the program, we have repurchased 4.6 million shares of common at an average price of $105.80, for a total investment of $484 million. As of January 30, 2021, the dollar value of shares that may yet be purchased under the program is $4.5 billion. There were no Target common stock purchases made during the three months ended January 30, 2021, by Target or any "affiliated purchaser" of Target, as defined in Rule 10b-18(a)(3) under the Exchange Act.
| TARGET CORPORATION | | 2020 Form 10-K | 15 |
| OTHER INFORMATION | Table of Contents | |||||||
| Index to Financial Statements |
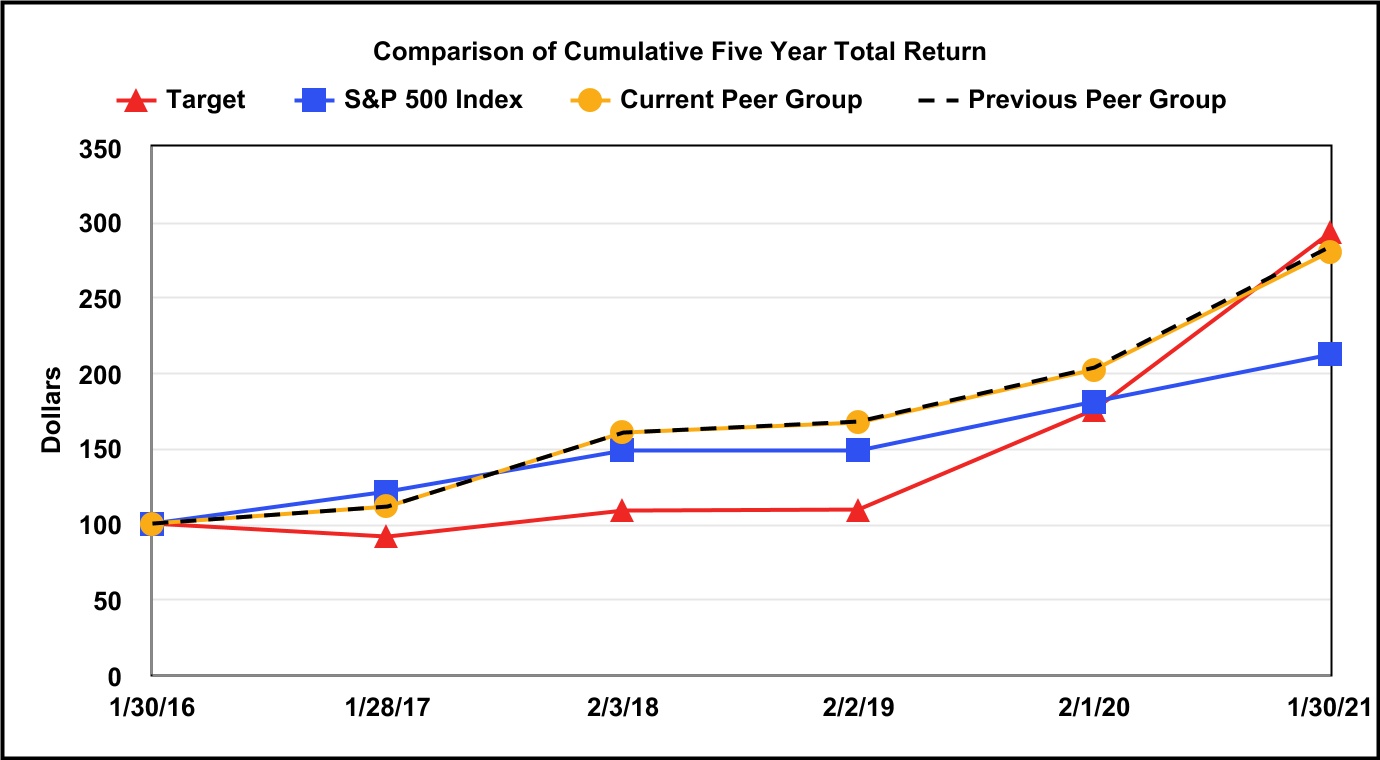
| Fiscal Years Ended | ||||||||||||||||||||
| January 30, 2016 | January 28, 2017 | February 3, 2018 | February 2, 2019 | February 1, 2020 | January 30, 2021 | |||||||||||||||
| Target | $ | 100.00 | $ | 90.84 | $ | 108.44 | $ | 109.33 | $ | 175.54 | $ | 292.98 | ||||||||
| S&P 500 Index | 100.00 | 120.87 | 148.47 | 148.38 | 180.37 | 211.48 | ||||||||||||||
| Current Peer Group | 100.00 | 111.09 | 159.84 | 166.68 | 201.97 | 280.21 | ||||||||||||||
| Previous Peer Group | 100.00 | 111.11 | 160.34 | 167.11 | 202.85 | 283.29 |
The graph above compares the cumulative total shareholder return on our common stock for the last five fiscal years with (i) the cumulative total return on the S&P 500 Index, (ii) the peer group used in previous filings consisting of 16 online, general merchandise, department store, food, and specialty retailers (Amazon.com, Inc., Best Buy Co., Inc., Costco Wholesale Corporation, CVS Health Corporation, Dollar General Corporation, Dollar Tree, Inc., The Home Depot, Inc., Kohl's Corporation, The Kroger Co., Lowe's Companies, Inc., Macy's, Inc., Nordstrom, Inc., Rite Aid Corporation, The TJX Companies, Inc., Walgreens Boots Alliance, Inc., and Walmart Inc.) (Previous Peer Group), and (iii) a new peer group consisting of the companies in the Previous Peer Group, plus Albertsons Companies, Inc., The Gap, Inc., and Ross Stores, Inc. (Current Peer Group). The Current Peer Group is consistent with the retail peer group used for our definitive Proxy Statement for the Annual Meeting of Shareholders to be held on June 9, 2021, excluding Publix Super Markets, Inc., which is not quoted on a public stock exchange.
The peer group is weighted by the market capitalization of each component company. The graph assumes the investment of $100 in Target common stock, the S&P 500 Index, and the Peer Group on January 29, 2016, and reinvestment of all dividends.
Item 6. Selected Financial Data
Not applicable.
| TARGET CORPORATION | | 2020 Form 10-K | 16 |
| MANAGEMENT'S DISCUSSION AND ANALYSIS | Table of Contents | |||||||
| EXECUTIVE OVERVIEW & FINANCIAL SUMMARY | Index to Financial Statements |
Item 7. Management's Discussion and Analysis of Financial Condition and Results of Operations
Executive Overview
While our business was materially affected by the COVID-19 pandemic, resulting in significantly higher sales and profits in 2020, the pandemic highlighted the importance of our multi-category portfolio and our decision to put our stores at the center of our strategy. In 2020, we continued to make strategic investments to support our durable operating and financial model that further differentiates Target and is designed to drive sustainable sales and profit growth. We have done this through an investment strategy focused on:
Elevating the Shopping Experiences and Winning with High-Touch Service
-
We remodeled 132 stores during 2020.
-
We opened 30 new stores, including 29 additional small format stores in key urban markets and on college campuses.
-
We invested significantly in our team, including a $15/hour minimum hourly wage for US team members, recognition bonuses, and certain other benefits in light of the COVID-19 pandemic.
-
We made significant investments in the health and safety of team members and guests.
Curation at Scale
-
We continued the steady stream of newness and exclusives across our assortment and continued to introduce new owned brands. We expanded the assortment of our Food & Beverage owned brand, Good & GatherTM, which launched in 2019 and has become our largest selling food brand.
-
We announced a partnership with Ulta Beauty under which we will operate Ulta Beauty at Target, a shop-in-shop experience debuting on Target.com and in more than 100 Target locations beginning in 2021, with plans to scale to hundreds more over time.
Delivering Ease and Convenience through Same-Day Services
- We expanded our digital fulfillment capabilities, including fresh and frozen Food & Beverage products added to Order Pickup and Drive Up. During 2020, over 50 percent of our comparable digital sales growth was driven by same-day fulfillment options: Order Pickup, Drive Up, and delivery via Shipt.
Financial Summary
2020 included the following notable items:
-
GAAP diluted earnings per share were $8.64.
-
Adjusted diluted earnings per share were $9.42.
-
Total revenue increased 19.8 percent, driven by an increase in comparable sales.
-
Comparable sales increased 19.3 percent, driven by a 15.0 percent increase in average transaction amount.
◦Comparable store originated sales grew 7.2 percent.
◦Comparable digital originated sales increased 145 percent.
-
Operating income of $6.5 billion was 40.4 percent higher than the comparable prior-year period.
-
We repurchased $1.77 billion of debt before its maturity at a market value of $2.25 billion, resulting in a loss of $512 million.
Sales were $92.4 billion for 2020, an increase of $15.3 billion, or 19.8 percent, from the prior year. Operating cash flow provided by continuing operations was $10.5 billion for 2020, an increase of $3.4 billion, or 48.3 percent, from $7.1 billion for 2019.
| TARGET CORPORATION | | 2020 Form 10-K | 17 |
| MANAGEMENT'S DISCUSSION AND ANALYSIS | Table of Contents | |||||||
| EXECUTIVE OVERVIEW & FINANCIAL SUMMARY | Index to Financial Statements |
| Earnings Per Share From Continuing Operations | Percent Change | ||||||||||||||||
| 2020 | 2019 | 2018 | 2020/2019 | 2019/2018 | |||||||||||||
| GAAP diluted earnings per share | $ | 8.64 | $ | 6.34 | $ | 5.50 | 36.3 | % | 15.4 | % | |||||||
| Adjustments | 0.78 | 0.05 | (0.10) | ||||||||||||||
| Adjusted diluted earnings per share | $ | 9.42 | $ | 6.39 | $ | 5.39 | 47.4 | % | 18.4 | % |
Note: Amounts may not foot due to rounding. Adjusted diluted earnings per share from continuing operations (Adjusted EPS), a non-GAAP metric, excludes the impact of certain items. Management believes that Adjusted EPS is useful in providing period-to-period comparisons of the results of our continuing operations. A reconciliation of non-GAAP financial measures to GAAP measures is provided on page 23.
We report after-tax return on invested capital (ROIC) from continuing operations because we believe ROIC provides a meaningful measure of our capital-allocation effectiveness over time. For the trailing twelve months ended January 30, 2021, after-tax ROIC was 23.5 percent, compared with 16.0 percent for the trailing twelve months ended February 1, 2020. The calculation of ROIC is provided on page 24.
COVID-19
On March 11, 2020, the World Health Organization declared the novel coronavirus disease (COVID-19) a pandemic, and on March 13, 2020, the United States declared a national emergency. The rapid development and fluidity of this situation limits our ability to predict the ultimate impact of COVID-19 on our business, financial condition and financial performance, which has been and could continue to be material. States and local governments have taken various measures in response to COVID-19, including mandating the closure of certain businesses and encouraging or requiring citizens to avoid large gatherings. We have implemented numerous safety measures to protect our guests and team members — such as mandating face masks for all team members and guests in our stores, more rigorous cleaning processes, providing disposable face masks, gloves and thermometers for team members, installing distancing markers at stores, limiting guest levels within our stores, and installing partitions at all stores. To date, virtually all of our stores, digital channels, and distribution centers have remained open.
As the pandemic has evolved, we have experienced unusually strong sales, as guests rely on Target for essential items like food, medicine, cleaning products, and household stock-up items, as well as merchandise associated with guests spending more time at home. Underlying this trend, we saw significant volatility in our sales mix, including both category and channel sales mix and same-day fulfillment options.
-
During the first quarter, comparable sales increased 10.8 percent, reflecting a 0.9 percent increase in store originated comparable sales and a 141 percent increase in digitally originated comparable sales. The quarter began with strength across our multi-category portfolio, followed by a shift to strong comparable sales growth in our Food & Beverage and Beauty & Household Essentials core merchandising categories and significant comparable sales declines in Apparel & Accessories. Comparable sales in Apparel & Accessories recovered notably beginning mid-April.
-
During the second through fourth quarters, comparable sales increased 21.7 percent, reflecting store originated comparable sales growth of 9.1 percent, and an increase in digitally originated comparable sales of 146 percent. Comparable sales growth was strong across our multi-category portfolio, with slightly higher growth in lower-margin categories.
For the year ended January 30, 2021, gross margin was negatively impacted by changes in both our category and channel sales mix. Additionally, gross margin reflects the portion of investments in pay and benefits classified within Cost of Sales. Exceptionally low clearance and promotional markdown rates partially offset these pressures.
Our SG&A expenses include significant incremental costs related to investments in pay and benefits for store team members, the spikes in merchandise volume in stores and the supply chain, incremental safety and cleaning supplies, and the impact of additional team member hours dedicated to more rigorous cleaning routines in our facilities. From an SG&A expense rate perspective, these incremental costs were more than offset by cost leverage resulting from exceptionally strong sales growth.
To support our team and minimize potential disruptions in their work to serve our guests, we modified our plans for some of our strategic initiatives, including our previously announced remodel program. We completed 132 remodels
| TARGET CORPORATION | | 2020 Form 10-K | 18 |
| MANAGEMENT'S DISCUSSION AND ANALYSIS | Table of Contents | |||||||
| FINANCIAL SUMMARY & ANALYSIS OF OPERATIONS | Index to Financial Statements |
in 2020, down from the previous expectation of approximately 300. Similarly, we opened 29 new small format stores in 2020, rather than the 36 previously announced.
During the first quarter 2020, we issued $2.5 billion of 5-year and 10-year notes in an effort to increase our cash on hand. Additionally, we entered into a $900 million 364-day credit facility, increasing our total undrawn committed credit facilities to $3.4 billion. Our operating performance during the second and third quarters of 2020 and financial position allowed us to repurchase $1.77 billion of debt before its maturity at a market value of $2.25 billion in October 2020 and terminate the 364-day credit facility in November 2020. Note 17 to the Consolidated Financial Statements and the Liquidity and Capital Resources section provide additional information.
Sale of Dermstore
In February 2021, we sold Dermstore LLC (Dermstore) for approximately $350 million, subject to working capital and other closing adjustments. We expect to recognize a pre-tax gain in excess of $300 million in the first quarter of 2021. Dermstore represented less than 1 percent of our consolidated revenues, operating income and net assets.
Analysis of Results of Operations
| Summary of Operating Income | Percent Change | ||||||||||||||||
| (dollars in millions) | 2020 | 2019 | 2018 | 2020/2019 | 2019/2018 | ||||||||||||
| Sales | $ | 92,400 | $ | 77,130 | $ | 74,433 | 19.8 | % | 3.6 | % | |||||||
| Other revenue | 1,161 | 982 | 923 | 18.2 | 6.3 | ||||||||||||
| Total revenue | 93,561 | 78,112 | 75,356 | 19.8 | 3.7 | ||||||||||||
| Cost of sales | 66,177 | 54,864 | 53,299 | 20.6 | 2.9 | ||||||||||||
| SG&A expenses | 18,615 | 16,233 | 15,723 | 14.7 | 3.2 | ||||||||||||
| Depreciation and amortization (exclusive of depreciation included in cost of sales) | 2,230 | 2,357 | 2,224 | (5.4) | 6.0 | ||||||||||||
| Operating income | $ | 6,539 | $ | 4,658 | $ | 4,110 | 40.4 | % | 13.3 | % |
| Rate Analysis | 2020 | 2019 | 2018 | ||||||||
| Gross margin rate | 28.4 | % | 28.9 | % | 28.4 | % | |||||
| SG&A expense rate | 19.9 | 20.8 | 20.9 | ||||||||
| Depreciation and amortization (exclusive of depreciation included in cost of sales) expense rate | 2.4 | 3.0 | 3.0 | ||||||||
| Operating income margin rate | 7.0 | 6.0 | 5.5 |
Note: Gross margin rate is calculated as gross margin (sales less cost of sales) divided by sales. All other rates are calculated by dividing the applicable amount by total revenue.
A discussion regarding Results of Operations and Analysis of Financial Condition for the year ended February 1, 2020, as compared to the year ended February 2, 2019, is included in Part II, Item 7, MD&A to our Annual Report on Form 10-K for the fiscal year ended February 1, 2020.
| TARGET CORPORATION | | 2020 Form 10-K | 19 |
| MANAGEMENT'S DISCUSSION AND ANALYSIS | Table of Contents | |||||||
| ANALYSIS OF OPERATIONS | Index to Financial Statements |
Sales
Sales include all merchandise sales, net of expected returns, and our estimate of gift card breakage. Note 3 to the Financial Statements defines gift card "breakage." We use comparable sales to evaluate the performance of our stores and digital channel sales by measuring the change in sales for a period over the comparable, prior-year period of equivalent length. Comparable sales include all sales, except sales from stores open less than 13 months, digital acquisitions we have owned less than 13 months, stores that have been closed, and digital acquisitions that we no longer operate. Comparable sales measures vary across the retail industry. As a result, our comparable sales calculation is not necessarily comparable to similarly titled measures reported by other companies. Digitally originated sales include all sales initiated through mobile applications and our websites. Our stores fulfill the majority of digitally originated sales, including shipment from stores to guests, store Order Pickup or Drive Up, and delivery via Shipt. Digitally originated sales may also be fulfilled through our distribution centers, our vendors, or other third parties.
Sales growth – from both comparable sales and new stores – represents an important driver of our long-term profitability. We expect that comparable sales growth will drive the majority of our total sales growth. We believe that our ability to successfully differentiate our guests’ shopping experience through a careful combination of merchandise assortment, price, convenience, guest experience, and other factors will over the long-term drive both increasing shopping frequency (traffic) and the amount spent each visit (average transaction amount).
The increase in 2020 sales compared to 2019 is due to a 19.3 percent comparable sales increase and the contribution from new stores. The COVID-19 pandemic has affected the amount and mix of sales across channels and categories.
| Comparable Sales | 2020 | 2019 | 2018 | ||||||||
| Comparable sales change | 19.3 | % | 3.4 | % | 5.0 | % | |||||
| Drivers of change in comparable sales | |||||||||||
| Number of transactions | 3.7 | 2.7 | 5.0 | ||||||||
| Average transaction amount | 15.0 | 0.7 | 0.1 |
| Contribution to Comparable Sales Change | 2020 | 2019 | 2018 | ||||||||
| Stores originated channel comparable sales change | 7.2 | % | 1.4 | % | 3.2 | % | |||||
| Contribution from digitally originated sales to comparable sales | 12.1 | 1.9 | 1.8 | ||||||||
| Total comparable sales change | 19.3 | % | 3.4 | % | 5.0 | % |
Note: Amounts may not foot due to rounding.
| Sales by Channel | 2020 | 2019 | 2018 | ||||||||
| Stores originated | 82.1 | % | 91.2 | % | 92.9 | % | |||||
| Digitally originated | 17.9 | 8.8 | 7.1 | ||||||||
| Total | 100 | % | 100 | % | 100 | % |
| TARGET CORPORATION | | 2020 Form 10-K | 20 |
| MANAGEMENT'S DISCUSSION AND ANALYSIS | Table of Contents | |||||||
| ANALYSIS OF OPERATIONS | Index to Financial Statements |
| Sales by Product Category | 2020 | 2019 | 2018 | ||||||||
| Apparel and accessories | 16 | % | 19 | % | 18 | % | |||||
| Beauty and household essentials | 26 | 27 | 26 | ||||||||
| Food and beverage | 20 | 19 | 20 | ||||||||
| Hardlines | 18 | 16 | 17 | ||||||||
| Home furnishings and décor | 20 | 19 | 19 | ||||||||
| Total | 100 | % | 100 | % | 100 | % |
Note 3 to the Financial Statements provides additional product category sales information. The collective interaction of a broad array of macroeconomic, competitive, and consumer behavioral factors, as well as sales mix, and transfer of sales to new stores makes further analysis of sales metrics infeasible.
TD Bank Group offers credit to qualified guests through Target-branded credit cards: the Target Credit Card and the Target MasterCard Credit Card (Target Credit Cards). Additionally, we offer a branded proprietary Target Debit Card. Collectively, we refer to these products as RedCards™. We monitor the percentage of purchases that are paid for using RedCards (RedCard Penetration) because our internal analysis has indicated that a meaningful portion of incremental purchases on our RedCards are also incremental sales for Target. Guests receive a 5 percent discount on virtually all purchases when they use a RedCard at Target. RedCard sales increased for all years presented below; however, RedCard penetration declined as total Sales increased at a faster pace.
| RedCard Penetration | 2020 | 2019 | 2018 | ||||||||
| Target Debit Card | 12.3 | % | 12.6 | % | 13.0 | % | |||||
| Target Credit Cards | 9.2 | 10.7 | 10.9 | ||||||||
| Total RedCard Penetration | 21.5 | % | 23.3 | % | 23.8 | % |
Note: Amounts may not foot due to rounding.
Gross Margin Rate
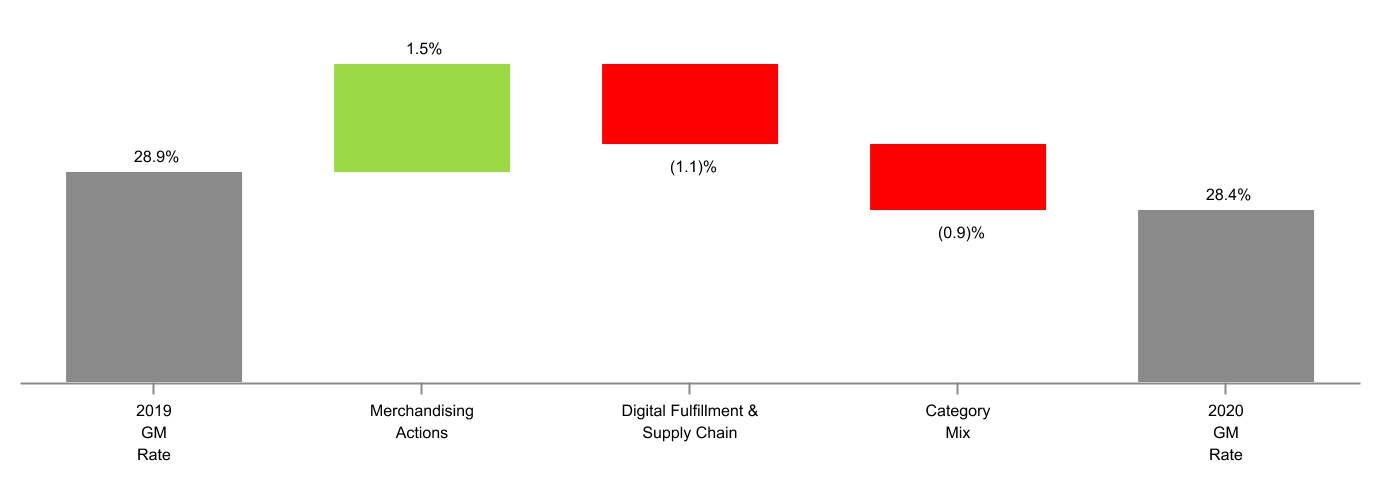
Our gross margin rate was 28.4 percent in 2020 and 28.9 percent in 2019. This decrease reflected increased digital fulfillment and supply chain costs (stemming from unusually strong growth in digital volume combined with the impact of higher pay and benefit costs classified within Cost of Sales) and the impact of category sales mix, as sales growth was strongest in lower-margin categories. The decrease was partially offset by the net impact of merchandising actions, most notably the benefit of exceptionally low clearance and promotional markdown rates.
| TARGET CORPORATION | | 2020 Form 10-K | 21 |
| MANAGEMENT'S DISCUSSION AND ANALYSIS | Table of Contents | |||||||
| ANALYSIS OF OPERATIONS | Index to Financial Statements |
Selling, General and Administrative (SG&A) Expense Rate
Our SG&A expense rate was 19.9 percent in 2020 and 20.8 percent in 2019. Incremental team member pay and benefits and investments to protect the health and safety of guests represented approximately $1.5 billion of the $2.4 billion increase in SG&A expenses for the year ended January 30, 2021, compared with the prior-year periods. From a rate perspective, these increased costs were more than offset by leverage resulting from strong revenue growth.
Store Data
| Change in Number of Stores | 2020 | 2019 | ||||||
| Beginning store count | 1,868 | 1,844 | ||||||
| Opened | 30 | 26 | ||||||
| Closed | (1) | (2) | ||||||
| Ending store count | 1,897 | 1,868 | ||||||
| Number of Stores and Retail Square Feet | Number of Stores | Retail Square Feet (a) | |||||||||||||||
| January 30, 2021 | February 1, 2020 | January 30, 2021 | February 1, 2020 | ||||||||||||||
| 170,000 or more sq. ft. | 273 | 272 | 48,798 | 48,619 | |||||||||||||
| 50,000 to 169,999 sq. ft. | 1,509 | 1,505 | 189,508 | 189,227 | |||||||||||||
| 49,999 or less sq. ft. | 115 | 91 | 3,342 | 2,670 | |||||||||||||
| Total | 1,897 | 1,868 | 241,648 | 240,516 |
*(a)*In thousands, reflects total square feet less office, distribution center, and vacant space.
Other Performance Factors
Net Interest Expense
Net interest expense from continuing operations was $977 million and $477 million for 2020 and 2019, respectively. The increase was primarily due to a $512 million loss on early retirement of debt in 2020.
Provision for Income Taxes
Our 2020 effective income tax rate from continuing operations was 21.2 percent compared with 22.0 percent in 2019. The effective tax rate for 2020 reflects a larger rate benefit from discrete items, primarily related to share-based payments and resolution of certain income tax matters, partially offset by the rate impact of higher earnings, compared with the prior year.
Note 19 to the Financial Statements provides additional information.
| TARGET CORPORATION | | 2020 Form 10-K | 22 |
| MANAGEMENT'S DISCUSSION AND ANALYSIS | Table of Contents | |||||||
| RECONCILIATION OF NON-GAAP FINANCIAL MEASURES | Index to Financial Statements |
Reconciliation of Non-GAAP Financial Measures to GAAP Measures
To provide additional transparency, we have disclosed non-GAAP adjusted diluted earnings per share from continuing operations (Adjusted EPS). This metric excludes certain items presented below. We believe this information is useful in providing period-to-period comparisons of the results of our continuing operations. This measure is not in accordance with, or an alternative to, generally accepted accounting principles in the U.S. (GAAP). The most comparable GAAP measure is diluted earnings per share from continuing operations. Adjusted EPS should not be considered in isolation or as a substitution for analysis of our results as reported in accordance with GAAP. Other companies may calculate Adjusted EPS differently than we do, limiting the usefulness of the measure for comparisons with other companies.
| Reconciliation of Non-GAAP Adjusted EPS | 2020 | 2019 | 2018 | |||||||||||||||||||||||||||||||||||||||||||||||||||||
| (millions, except per share data) | Pretax | Net of Tax | Per Share Amounts | Pretax | Net of Tax | Per Share Amounts | Pretax | Net of Tax | Per Share Amounts | |||||||||||||||||||||||||||||||||||||||||||||||
| GAAP diluted earnings per share from continuing operations | $ | 8.64 | $ | 6.34 | $ | 5.50 | ||||||||||||||||||||||||||||||||||||||||||||||||||
| Adjustments | ||||||||||||||||||||||||||||||||||||||||||||||||||||||||
| Loss on debt extinguishment | $ | 512 | $ | 379 | $ | 0.75 | $ | 10 | $ | 8 | $ | 0.01 | $ | — | $ | — | $ | — | ||||||||||||||||||||||||||||||||||||||
| Loss on investment (a) | 19 | 14 | 0.03 | 41 | 31 | 0.06 | — | — | — | |||||||||||||||||||||||||||||||||||||||||||||||
| Tax Act (b) | — | — | — | — | — | — | — | (36) | (0.07) | |||||||||||||||||||||||||||||||||||||||||||||||
| Other (c) | 28 | 20 | 0.04 | (17) | (13) | (0.02) | — | — | — | |||||||||||||||||||||||||||||||||||||||||||||||
| Other income tax matters (d) | — | (21) | (0.04) | — | — | — | — | (18) | (0.03) | |||||||||||||||||||||||||||||||||||||||||||||||
| Adjusted diluted earnings per share from continuing operations | $ | 9.42 | $ | 6.39 | $ | 5.39 |
Note: Amounts may not foot due to rounding.
*(a)*Represents a loss on our investment in Casper Sleep Inc. (Casper), which is not core to our continuing operations.
*(b)*Represents discrete items related to the Tax Act. Refer to Note 19 to the Financial Statements.
*(c)*For 2020, includes store damage and inventory losses related to civil unrest, net of insurance recoveries. For 2019, represents insurance recoveries related to the 2013 data breach.
*(d)*Represents benefits from the resolution of certain income tax matters unrelated to current period operations.
Earnings from continuing operations before interest expense and income taxes (EBIT) and earnings from continuing operations before interest expense, income taxes, depreciation, and amortization (EBITDA) are non-GAAP financial measures. We believe these measures provide meaningful information about our operational efficiency compared with our competitors by excluding the impact of differences in tax jurisdictions and structures, debt levels, and for EBITDA, capital investment. These measures are not in accordance with, or an alternative to, GAAP. The most comparable GAAP measure is net earnings from continuing operations. EBIT and EBITDA should not be considered in isolation or as a substitution for analysis of our results as reported in accordance with GAAP. Other companies may calculate EBIT and EBITDA differently, limiting the usefulness of the measures for comparisons with other companies.
| EBIT and EBITDA | Percent Change | ||||||||||||||||
| (dollars in millions) | 2020 | 2019 | 2018 | 2020/2019 | 2019/2018 | ||||||||||||
| Net earnings from continuing operations | $ | 4,368 | $ | 3,269 | $ | 2,930 | 33.6 | % | 11.6 | % | |||||||
| + Provision for income taxes | 1,178 | 921 | 746 | 27.9 | 23.4 | ||||||||||||
| + Net interest expense | 977 | 477 | 461 | 105.1 | 3.3 | ||||||||||||
| EBIT | $ | 6,523 | $ | 4,667 | $ | 4,137 | 39.8 | % | 12.8 | % | |||||||
| + Total depreciation and amortization (a) | 2,485 | 2,604 | 2,474 | (4.6) | 5.3 | ||||||||||||
| EBITDA | $ | 9,008 | $ | 7,271 | $ | 6,611 | 23.9 | % | 10.0 | % |
*(a)*Represents total depreciation and amortization, including amounts classified within Depreciation and Amortization and within Cost of Sales.
| TARGET CORPORATION | | 2020 Form 10-K | 23 |
| MANAGEMENT'S DISCUSSION AND ANALYSIS | Table of Contents | |||||||
| RECONCILIATION OF NON-GAAP FINANCIAL MEASURES | Index to Financial Statements |
We have also disclosed after-tax ROIC, which is a ratio based on GAAP information, with the exception of the add-back of operating lease interest to operating income. We believe this metric is useful in assessing the effectiveness of our capital allocation over time. Other companies may calculate ROIC differently, limiting the usefulness of the measure for comparisons with other companies.
| After-Tax Return on Invested Capital | ||||||||||||||||||||
| (dollars in millions) | ||||||||||||||||||||
| Trailing Twelve Months | ||||||||||||||||||||
| Numerator | January 30, 2021 | February 1, 2020 | ||||||||||||||||||
| Operating income | $ | 6,539 | $ | 4,658 | ||||||||||||||||
| + Net other income / (expense) | (16) | 9 | ||||||||||||||||||
| EBIT | 6,523 | 4,667 | ||||||||||||||||||
| + Operating lease interest (a) | 87 | 86 | ||||||||||||||||||
| - Income taxes (b) | 1,404 | 1,045 | ||||||||||||||||||
| Net operating profit after taxes | $ | 5,206 | $ | 3,708 |
| Denominator | January 30, 2021 | February 1, 2020 | February 2, 2019 | |||||||||||||||||
| Current portion of long-term debt and other borrowings | $ | 1,144 | $ | 161 | $ | 1,052 | ||||||||||||||
| + Noncurrent portion of long-term debt | 11,536 | 11,338 | 10,223 | |||||||||||||||||
| + Shareholders' investment | 14,440 | 11,833 | 11,297 | |||||||||||||||||
| + Operating lease liabilities (c) | 2,429 | 2,475 | 2,170 | |||||||||||||||||
| - Cash and cash equivalents | 8,511 | 2,577 | 1,556 | |||||||||||||||||
| Invested capital | $ | 21,038 | $ | 23,230 | $ | 23,186 | ||||||||||||||
| Average invested capital (d) | $ | 22,134 | $ | 23,208 |
| After-tax return on invested capital | 23.5 | % | 16.0 | % |
*(a)*Represents the add-back to operating income driven by the hypothetical interest expense we would incur if the property under our operating leases were owned or accounted for as finance leases. Calculated using the discount rate for each lease and recorded as a component of rent expense within SG&A Expenses. Operating lease interest is added back to operating income in the ROIC calculation to control for differences in capital structure between us and our competitors.
*(b)*Calculated using the effective tax rates for continuing operations, which were 21.2 percent and 22.0 percent for the trailing twelve months ended January 30, 2021, and February 1, 2020, respectively. For the trailing twelve months ended January 30, 2021, and February 1, 2020, includes tax effect of $1.4 billion and $1.0 billion, respectively, related to EBIT, and $18 million and $19 million, respectively, related to operating lease interest.
*(c)*Total short-term and long-term operating lease liabilities included within Accrued and Other Current Liabilities and Noncurrent Operating Lease Liabilities, respectively.
*(d)*Average based on the invested capital at the end of the current period and the invested capital at the end of the comparable prior period.
| TARGET CORPORATION | | 2020 Form 10-K | 24 |
| MANAGEMENT'S DISCUSSION AND ANALYSIS | Table of Contents | |||||||
| ANALYSIS OF FINANCIAL CONDITION | Index to Financial Statements |
Analysis of Financial Condition
Liquidity and Capital Resources
Capital Allocation
We follow a disciplined and balanced approach to capital allocation based on the following priorities, ranked in order of importance: first, we fully invest in opportunities to profitably grow our business, create sustainable long-term value, and maintain our current operations and assets; second, we maintain a competitive quarterly dividend and seek to grow it annually; and finally, we return any excess cash to shareholders by repurchasing shares within the limits of our credit rating goals.
In response to COVID-19, we suspended our share repurchase program in March 2020. In November 2020, we lifted the share repurchase suspension and, in February 2021, began repurchasing shares. We believe our sources of liquidity will continue to be adequate to maintain operations, finance anticipated expansion and strategic initiatives, fund debt maturities, pay dividends, and execute purchases under our share repurchase program for the foreseeable future. We continue to anticipate ample access to commercial paper and long-term financing.
Our period-end cash and cash equivalents balance increased to $8.5 billion from $2.6 billion in 2019. Our cash and cash equivalents balance includes short-term investments of $7.6 billion and $1.8 billion as of January 30, 2021, and February 1, 2020, respectively. Our investment policy is designed to preserve principal and liquidity of our short-term investments. This policy allows investments in large money market funds or in highly rated direct short-term instruments that mature in 60 days or less. We also place dollar limits on our investments in individual funds or instruments.
Operating Cash Flows
Operating cash flow provided by continuing operations was $10.5 billion in 2020 compared with $7.1 billion in 2019. The increase reflects stronger operating performance combined with higher payables leverage during 2020 due to increased inventory turnover driven by strong sales, compared with 2019. Additionally, operating cash flows for 2020 reflect increased payroll-related liabilities, including the deferral of employer social security tax payments and higher incentive compensation.
Inventory
Year-end inventory was $10.7 billion, compared with $9.0 billion in 2019. Inventory levels were higher as of January 30, 2021, compared with February 1, 2020, reflecting efforts to align inventory with sales trends.
| TARGET CORPORATION | | 2020 Form 10-K | 25 |
| MANAGEMENT'S DISCUSSION AND ANALYSIS | Table of Contents | |||||||
| ANALYSIS OF FINANCIAL CONDITION | Index to Financial Statements |
Capital Expenditures
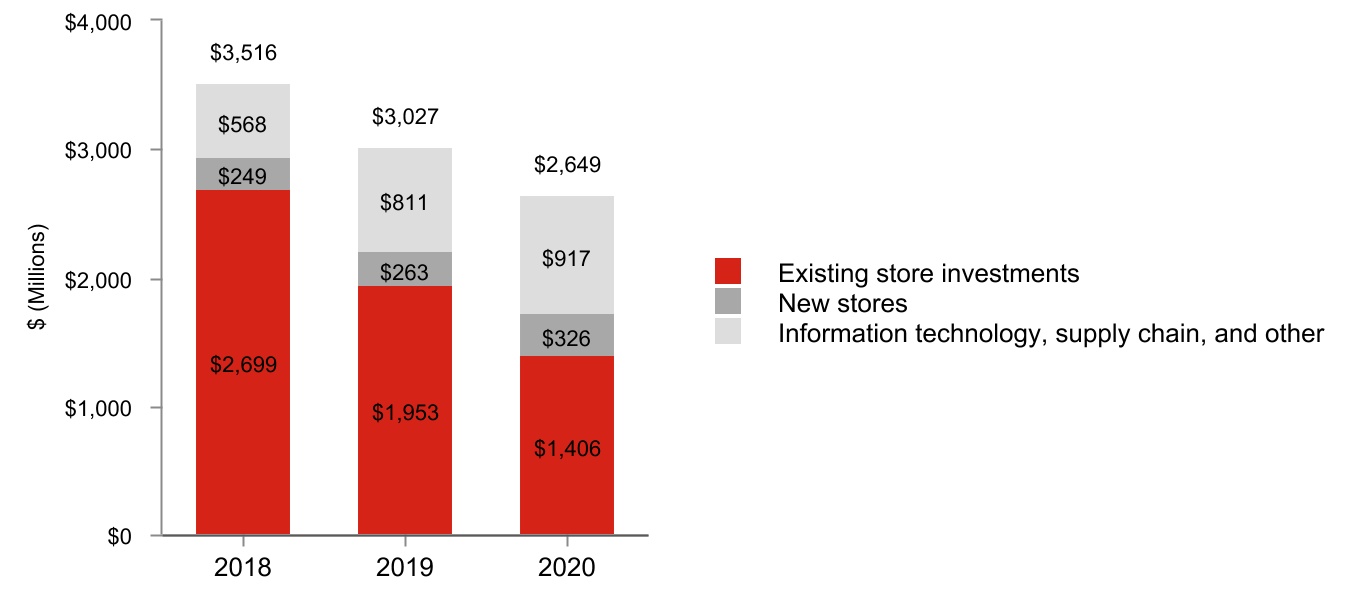
Capital expenditures decreased in 2020 from the prior year as we modified plans for some of our strategic initiatives, including store remodels and new store openings, as a result of COVID-19. We have completed over 800 remodels since the launch of the current program in 2017, including 132 in 2020. We expect to complete 150 full-store remodels and open 30 to 40 new stores during 2021.
In addition to these cash investments, we entered into leases related to new stores in 2020, 2019, and 2018 with total future minimum lease payments of $764 million, $669 million, and $473 million, respectively, and new leases related to our supply chain with total future minimum lease payments of $442 million, $185 million, and $11 million, respectively.
We expect capital expenditures in 2021 of approximately $4.0 billion to support remodels, new stores, and supply chain projects to add replenishment capacity and modernize the network, including sortation centers. Beyond full-store remodels, we will invest in optimizing front-end space in our highest-volume locations, increasing the efficiency of our Pickup and Drive Up services, as well as the build-out of Ulta Beauty shop-in-shops. We also expect to continue to invest in new store and supply chain leases.
Dividends
We paid dividends totaling $1.3 billion ($2.68 per share) in 2020 and $1.3 billion ($2.60 per share) in 2019, a per share increase of 3.1 percent. We declared dividends totaling $1.4 billion ($2.70 per share) in 2020 and $1.3 billion ($2.62 per share) in 2019, a per share increase of 3.1 percent. We have paid dividends every quarter since our 1967 initial public offering and it is our intent to continue to do so in the future.
Share Repurchases
During 2020 and 2019 we returned $609 million and $1.5 billion, respectively, to shareholders through share repurchase. See Part II, Item 5, Market for the Registrant's Common Equity, Related Stockholder Matters and Issuer Purchases of Equity Securities of this Annual Report on Form 10-K and Note 21 to the Financial Statements for more information.
| TARGET CORPORATION | | 2020 Form 10-K | 26 |
| MANAGEMENT'S DISCUSSION AND ANALYSIS | Table of Contents | |||||||
| ANALYSIS OF FINANCIAL CONDITION | Index to Financial Statements |
Financing
Our financing strategy is to ensure liquidity and access to capital markets, to maintain a balanced spectrum of debt maturities, and to manage our net exposure to floating interest rate volatility. Within these parameters, we seek to minimize our borrowing costs. Our ability to access the long-term debt and commercial paper markets has provided us with ample sources of liquidity. Our continued access to these markets depends on multiple factors, including the condition of debt capital markets, our operating performance, and maintaining strong credit ratings. As of January 30, 2021, our credit ratings were as follows:
| Credit Ratings | Moody's | Standard and Poor's | Fitch | ||||||||
| Long-term debt | A2 | A | A- | ||||||||
| Commercial paper | P-1 | A-1 | F1 |
If our credit ratings were lowered, our ability to access the debt markets, our cost of funds, and other terms for new debt issuances could be adversely impacted. Each of the credit rating agencies reviews its rating periodically and there is no guarantee our current credit ratings will remain the same as described above.
In 2020, we funded our holiday sales period working capital needs through internally generated funds. In 2019, we funded our holiday sales period working capital needs through internally generated funds and the issuance of commercial paper.
We have additional liquidity through a committed $2.5 billion revolving credit facility obtained through a group of banks, which expires in October 2023. No balances were outstanding at any time during 2020 or 2019.
Most of our long-term debt obligations contain covenants related to secured debt levels. In addition to a secured debt level covenant, our credit facility also contains a debt leverage covenant. We are, and expect to remain, in compliance with these covenants. Additionally, as of January 30, 2021, no notes or debentures contained provisions requiring acceleration of payment upon a credit rating downgrade, except that certain outstanding notes allow the note holders to put the notes to us if within a matter of months of each other we experience both (i) a change in control and (ii) our long-term credit ratings are either reduced and the resulting rating is non-investment grade, or our long-term credit ratings are placed on watch for possible reduction and those ratings are subsequently reduced and the resulting rating is non-investment grade.
Note 16 to the Financial Statements provides additional information.
Critical Accounting Estimates
Our consolidated financial statements are prepared in accordance with GAAP, which requires us to make estimates and apply judgments that affect the reported amounts. In the Notes to Consolidated Financial Statements, we describe the significant accounting policies used in preparing the consolidated financial statements. Our management has discussed the development, selection, and disclosure of our critical accounting estimates with the Audit & Finance Committee of our Board of Directors. The following items require significant estimation or judgment:
Inventory and cost of sales: The vast majority of our inventory is accounted for under the retail inventory accounting method using the last-in, first-out method (LIFO). Our inventory is valued at the lower of LIFO cost or market. We reduce inventory for estimated losses related to shrink and markdowns. Our shrink estimate is based on historical losses verified by physical inventory counts. Historically, our actual physical inventory count results have shown our estimates to be reliable. Market adjustments for markdowns are recorded when the salability of the merchandise has diminished. Salability can be impacted by consumer preferences and seasonality, among other factors. We believe the risk of inventory obsolescence is largely mitigated because our inventory typically turns in less than three months. Inventory was $10.7 billion and $9.0 billion as of January 30, 2021, and February 1, 2020, respectively, and is further described in Note 9 to the Financial Statements.
Vendor income: We receive various forms of consideration from our vendors (vendor income), principally earned as a result of volume rebates, markdown allowances, promotions, and advertising allowances. Substantially all vendor income is recorded as a reduction of cost of sales. Vendor income earned can vary based on a number of factors, including purchase volumes, sales volumes, and our pricing and promotion strategies.
| TARGET CORPORATION | | 2020 Form 10-K | 27 |
| MANAGEMENT'S DISCUSSION AND ANALYSIS | Table of Contents | |||||||
| ANALYSIS OF FINANCIAL CONDITION | Index to Financial Statements |
We establish a receivable for vendor income that is earned but not yet received. Based on historical trending and data, this receivable is computed by forecasting vendor income collections and estimating the amount earned. The majority of the year-end vendor income receivables are collected within the following fiscal quarter, and we do not believe there is a reasonable likelihood that the assumptions used in our estimate will change significantly. Historically, adjustments to our vendor income receivable have not been material. Vendor income receivable was $504 million and $464 million as of January 30, 2021, and February 1, 2020, respectively. Vendor income is described further in Note 5 to the Financial Statements.
Long-lived assets: Long-lived assets are reviewed for impairment whenever events or changes in circumstances indicate that the carrying amounts may not be recoverable. The evaluation is performed primarily at the store level. An impairment loss would be recognized when estimated undiscounted future cash flows from the operation and/or eventual disposition of the asset or asset group is less than its carrying amount, and is measured as the excess of its carrying amount over fair value. We estimate fair value by obtaining market appraisals, obtaining valuations from third-party brokers, or using other valuation techniques. We recorded impairments of $62 million, $23 million, and $92 million in 2020, 2019, and 2018, respectively, which are described further in Note 11 to the Financial Statements.
Insurance/self-insurance: We retain a substantial portion of the risk related to certain general liability, workers' compensation, property loss, and team member medical and dental claims. However, we maintain stop-loss coverage to limit the exposure related to certain risks. Liabilities associated with these losses include estimates of both claims filed and losses incurred but not yet reported. We use actuarial methods which consider a number of factors to estimate our ultimate cost of losses. General liability and workers' compensation liabilities are recorded based on our estimate of their net present value; other liabilities referred to above are not discounted. Our workers' compensation and general liability accrual was $510 million and $465 million as of January 30, 2021, and February 1, 2020, respectively. We believe that the amounts accrued are appropriate; however, our liabilities could be significantly affected if future occurrences or loss developments differ from our assumptions. For example, a 5 percent increase or decrease in average claim costs would have impacted our self-insurance expense by $25 million in 2020. Historically, adjustments to our estimates have not been material. Refer to Part II, Item 7A, Quantitative and Qualitative Disclosures About Market Risk, for further disclosure of the market risks associated with these exposures. We maintain insurance coverage to limit our exposure to certain events, including network security matters.
Income taxes: We pay income taxes based on the tax statutes, regulations, and case law of the various jurisdictions in which we operate. Significant judgment is required in determining the timing and amounts of deductible and taxable items, and in evaluating the ultimate resolution of tax matters in dispute with tax authorities. The benefits of uncertain tax positions are recorded in our financial statements only after determining it is likely the uncertain tax positions would withstand challenge by taxing authorities. We periodically reassess these probabilities and record any changes in the financial statements as appropriate. Liabilities for uncertain tax positions, including interest and penalties, were $193 million and $188 million as of January 30, 2021, and February 1, 2020, respectively. We believe the resolution of these matters will not have a material adverse impact on our consolidated financial statements. Income taxes are described further in Note 19 to the Financial Statements.
Pension accounting: We maintain a funded qualified defined benefit pension plan, as well as nonqualified and international pension plans that are generally unfunded, for certain current and retired team members. The costs for these plans are determined based on actuarial calculations using the assumptions described in the following paragraphs. Eligibility and the level of benefits vary depending on each team member's full-time or part-time status, date of hire, age, length of service, and/or compensation. The benefit obligation and related expense for these plans are determined based on actuarial calculations using assumptions about the expected long-term rate of return, the discount rate, compensation growth rates, mortality, and retirement age. These assumptions, with adjustments made for any significant plan or participant changes, are used to determine the period-end benefit obligation and establish expense for the next year.
Our 2020 expected long-term rate of return on plan assets of 6.10 percent was determined by the portfolio composition, historical long-term investment performance, and current market conditions. A 1 percentage point decrease in our expected long-term rate of return would increase annual expense by $40 million.
The discount rate used to determine benefit obligations is adjusted annually based on the interest rate for long-term high-quality corporate bonds, using yields for maturities that are in line with the duration of our pension liabilities.
| TARGET CORPORATION | | 2020 Form 10-K | 28 |
| MANAGEMENT'S DISCUSSION AND ANALYSIS | Table of Contents | |||||||
| NEW ACCOUNTING PRONOUNCEMENTS & FORWARD-LOOKING STATEMENTS | Index to Financial Statements |
Our benefit obligation and related expense will fluctuate with changes in interest rates. A 1 percentage point decrease to the weighted average discount rate would increase annual expense by $59 million.
Based on our experience, we use a graduated compensation growth schedule that assumes higher compensation growth for younger, shorter-service pension-eligible team members than it does for older, longer-service pension-eligible team members.
Pension benefits are further described in Note 24 to the Financial Statements.
Legal and other contingencies: We believe the accruals recorded in our consolidated financial statements properly reflect loss exposures that are both probable and reasonably estimable. We do not believe any of the currently identified claims or litigation may materially affect our results of operations, cash flows, or financial condition. However, litigation is subject to inherent uncertainties, and unfavorable rulings could occur. If an unfavorable ruling were to occur, it may cause a material adverse impact on the results of operations, cash flows, or financial condition for the period in which the ruling occurs, or future periods. Refer to Note 15 to the Financial Statements for further information on contingencies.
New Accounting Pronouncements
We do not expect that any recently issued accounting pronouncements will have a material effect on our financial statements.
Forward-Looking Statements
This report contains forward-looking statements, which are based on our current assumptions and expectations. These statements are typically accompanied by the words "expect," "may," "could," "believe," "would," "might," "anticipates," or similar words. The principal forward-looking statements in this report include: our financial performance, statements regarding the adequacy of and costs associated with our sources of liquidity, the funding of debt maturities, the continued execution of our share repurchase program, our expected capital expenditures and new lease commitments, the expected compliance with debt covenants, the expected impact of new accounting pronouncements, our intentions regarding future dividends, contributions and payments related to our pension plan, the expected return on plan assets, the expected timing and recognition of compensation expenses, the effects of macroeconomic conditions, the adequacy of our reserves for general liability, workers' compensation and property loss, the expected outcome of, and adequacy of our reserves for claims, litigation and the resolution of tax matters, our expectations regarding our contractual obligations, liabilities, and vendor income, the expected ability to recognize deferred tax assets and liabilities and the timing of such recognition, the expected impact of changes in information technology systems, future responses to and effects of the COVID-19 pandemic, and changes in our assumptions and expectations.
All such forward-looking statements are intended to enjoy the protection of the safe harbor for forward-looking statements contained in the Private Securities Litigation Reform Act of 1995, as amended. Although we believe there is a reasonable basis for the forward-looking statements, our actual results could be materially different. The most important factors which could cause our actual results to differ from our forward-looking statements are set forth on our description of risk factors included in Part I, Item 1A, Risk Factors to this Form 10-K, which should be read in conjunction with the forward-looking statements in this report. Forward-looking statements speak only as of the date they are made, and we do not undertake any obligation to update any forward-looking statement.
| TARGET CORPORATION | | 2020 Form 10-K | 29 |
| MANAGEMENT'S DISCUSSION AND ANALYSIS | Table of Contents | |||||||
| QUANTITATIVE AND QUALITATIVE DISCLOSURES | Index to Financial Statements |
Item 7A. Quantitative and Qualitative Disclosures About Market Risk
As of January 30, 2021, our exposure to market risk was primarily from interest rate changes on our debt obligations, some of which are at a London Interbank Offered Rate (LIBOR). Our interest rate exposure is primarily due to differences between our floating rate debt obligations compared to our floating rate short-term investments. As of January 30, 2021, our floating rate short-term investments exceeded our floating rate debt by approximately $6.1 billion. Based on our balance sheet position as of January 30, 2021, the annualized effect of a 0.1 percentage point increase in floating interest rates on our floating rate debt obligations, net of our floating rate short-term investments, would increase our earnings before income taxes by $6 million. In general, we expect our floating rate debt to exceed our floating rate short-term investments over time, but that may vary in different interest rate and economic environments. For example, our short-term investments as of January 30, 2021, exceeded our floating rate debt due to operating cash flow acceleration driven by strong operating results, as well as the temporary suspension of share repurchases and reduced capital expenditures in the uncertain environment. See further description of our debt and derivative instruments in Notes 16 and 17 to the Financial Statements.
The United Kingdom's Financial Conduct Authority has announced the intent to phase out LIBOR over the next several years. We do not expect the phase out to materially impact our financial statements, liquidity or access to capital markets.
We record our general liability and workers' compensation liabilities at net present value; therefore, these liabilities fluctuate with changes in interest rates. Based on our balance sheet position as of January 30, 2021, the annualized effect of a 0.5 percentage point decrease in interest rates would be to decrease earnings before income taxes by $5 million.
In addition, we are exposed to market return fluctuations on our qualified defined benefit pension plan. The value of our pension liabilities is inversely related to changes in interest rates. A 1 percentage point decrease in the weighted average discount rate would increase annual expense by $59 million. To protect against declines in interest rates, we hold high-quality, long-duration bonds and derivative instruments in our pension plan trust. At year-end, we had hedged 65 percent of the interest rate exposure of our plan liabilities.
As more fully described in Note 23 to the Financial Statements, we are exposed to market returns on accumulated team member balances in our nonqualified, unfunded deferred compensation plans. We control the risk of offering the nonqualified plans by making investments in life insurance contracts and prepaid forward contracts on our own common stock that substantially offset our economic exposure to the returns on these plans.
There have been no other material changes in our primary risk exposures or management of market risks since the prior year.
| TARGET CORPORATION | | 2020 Form 10-K | 30 |
| FINANCIAL STATEMENTS | Table of Contents | |||||||
| INDEX | Index to Financial Statements |
Item 8. Financial Statements and Supplementary Data
| TARGET CORPORATION | | 2020 Form 10-K | 31 |
| FINANCIAL STATEMENTS | Table of Contents | |||||||
| REPORTS | [Index to Financial Statements](#i5d6e11e9 |
Showing the first 8K of 124K characters. Open the full section
Item 9. Changes in and Disagreements with Accountants on Accounting and Financial Disclosure
Not applicable.
Item 9A. Controls and Procedures
Changes in Internal Control Over Financial Reporting
During the most recently completed fiscal quarter, the following changes materially affected, or are reasonably likely to materially affect, our internal control over financial reporting:
-
We are in the process of a broad multi-year migration of many mainframe-based systems and middleware products to a modern platform, including systems and processes supporting inventory and supply chain-related transactions.
-
During 2020, as a result of COVID-19, we performed physical inventory counts using a statistical sampling method. Under this method, we have recorded estimated losses related to shrink and markdowns based upon the results of our sample counts.
During the most recently completed fiscal quarter, no other change in our internal control over financial reporting materially affected, or is reasonably likely to materially affect, our internal control over financial reporting.
Evaluation of Disclosure Controls and Procedures
As of the end of the period covered by this Annual Report, we conducted an evaluation, under supervision and with the participation of management, including the chief executive officer and chief financial officer, of the effectiveness of the design and operation of our disclosure controls and procedures pursuant to Rules 13a-15 and 15d-15 of the Securities Exchange Act of 1934, as amended (Exchange Act). Based upon that evaluation, our chief executive officer and chief financial officer concluded that our disclosure controls and procedures are effective at a reasonable assurance level. Disclosure controls and procedures are defined by Rules 13a-15(e) and 15d-15(e) of the Exchange Act as controls and other procedures that are designed to ensure that information required to be disclosed by us in reports filed with the SEC under the Exchange Act is recorded, processed, summarized and reported within the time periods specified in the SEC's rules and forms. Disclosure controls and procedures include, without limitation, controls and procedures designed to ensure that information required to be disclosed by us in reports filed under the Exchange Act is accumulated and communicated to our management, including our principal executive and principal financial officers, or persons performing similar functions, as appropriate, to allow timely decisions regarding required disclosure.
For the Report of Management on Internal Control and the Report of Independent Registered Public Accounting Firm on Internal Control over Financial Reporting, see Part II, Item 8, Financial Statements and Supplementary Data.
| TARGET CORPORATION | | 2020 Form 10-K | 60 |
| SUPPLEMENTAL INFORMATION | Table of Contents | |||||||
| Index to Financial Statements |
Item 9B. Other Information
Not applicable.
| TARGET CORPORATION | | 2020 Form 10-K | 61 |
| SUPPLEMENTAL INFORMATION | Table of Contents | |||||||
| Index to Financial Statements |
PART III
Certain information required by Part III is incorporated by reference from Target's definitive Proxy Statement for the Annual Meeting of Shareholders to be held on June 9, 2021 (our Proxy Statement). Except for those portions specifically incorporated in this Form 10-K by reference to the Proxy Statement, no other portions of the Proxy Statement are deemed to be filed as part of this Form 10-K.
Item 10. Directors, Executive Officers and Corporate Governance
The following sections of the Proxy Statement are incorporated herein by reference:
-
Item one--Election of directors
-
General information about corporate governance and the Board
◦Business ethics and conduct
◦Committees
- Questions and answers about the 2021 Annual Meeting and voting--Question 14
See also Part I, Item 4A, Executive Officers of this Form 10-K.
Item 11. Executive Compensation
The following sections of the Proxy Statement are incorporated herein by reference:
-
Compensation Discussion and Analysis
-
Compensation tables
-
Human Resources & Compensation Committee Report
Item 12. Security Ownership of Certain Beneficial Owners and Management and Related Stockholder Matters
The following sections of the Proxy Statement are incorporated herein by reference:
- Stock ownership information--
◦Beneficial ownership of directors and officers
◦Beneficial ownership of Target’s largest shareholders
- Compensation tables--Equity compensation plan information
Item 13. Certain Relationships and Related Transactions, and Director Independence
The following sections of the Proxy Statement are incorporated herein by reference:
- General information about corporate governance and the Board of Directors--
◦Policy on transactions with related persons
◦Director independence
◦Committees
Item 14. Principal Accountant Fees and Services
The following section of the Proxy Statement is incorporated herein by reference:
- Item two-- Ratification of appointment of Ernst & Young LLP as independent registered public accounting firm--audit and non-audit fees
| TARGET CORPORATION | | 2020 Form 10-K | 62 |
| SUPPLEMENTAL INFORMATION | Table of Contents | |||||||
| Index to Financial Statements |
PART IV
Item 15. Exhibits, Financial Statement Schedules
The following information required under this item is filed as part of this report:
a) Financial Statements
-
Consolidated Statements of Operations for the Years Ended January 30, 2021, February 1, 2020, and February 2, 2019
-
Consolidated Statements of Comprehensive Income for the Years Ended January 30, 2021, February 1, 2020, and February 2, 2019
-
Consolidated Statements of Financial Position as of January 30, 2021, and February 1, 2020
-
Consolidated Statements of Cash Flows for the Years Ended January 30, 2021, February 1, 2020, and February 2, 2019
-
Consolidated Statements of Shareholders' Investment for the Years Ended January 30, 2021, February 1, 2020, and February 2, 2019
-
Report of Independent Registered Public Accounting Firm on Consolidated Financial Statements
| Financial Statement Schedules | ||
| None. | ||
| Other schedules have not been included either because they are not applicable or because the information is included elsewhere in this Report. |
| TARGET CORPORATION | | 2020 Form 10-K | 63 |
| SUPPLEMENTAL INFORMATION | Table of Contents | |||||||
| Index to Financial Statements |
b) Exhibits
| TARGET CORPORATION | | 2020 Form 10-K | 64 |
| SUPPLEMENTAL INFORMATION | Table of Contents | |||||||
| Index to Financial Statements |
Copies of exhibits will be furnished upon written request and payment of Registrant's reasonable expenses in furnishing the exhibits.
‡ Certain portions of this exhibit have been omitted pursuant to a request for confidential treatment and have been filed separately with the Securities and Exchange Commission.
† Certain portions of this exhibit are confidential and have been omitted pursuant to Item 601(b)(10) of Regulation S-K. Target agrees to supplementally furnish to the Securities and Exchange Commission a copy of such omissions upon request.
*** Management contract or compensation plan or arrangement required to be filed as an exhibit to this Form 10-K.
*(1)*Incorporated by reference to Exhibit (3)A to Target's Form 8-K Report filed June 10, 2010.
*(2)*Incorporated by reference to Exhibit (3)B to Target's Form 8-K Report filed April 2, 2020.
*(3)*Incorporated by reference to Exhibit 4.1 to Target's Form 8-K Report filed August 10, 2000.
*(4)*Incorporated by reference to Exhibit 4.1 to the Registrant's Form 8-K Report filed May 1, 2007.
*(5)*Incorporated by reference to Exhibit (10)B to Target's Form 10-Q Report for the quarter ended July 30, 2011.
*(6)*Incorporated by reference to Exhibit (10)C to Target's Form 10-Q Report for the quarter ended July 29, 2017.
| TARGET CORPORATION | | 2020 Form 10-K | 65 |
| SUPPLEMENTAL INFORMATION | Table of Contents | |||||||
| Index to Financial Statements |
*(7)*Incorporated by reference to Exhibit (10) D to Target's Form 8-K Report filed June 11, 2020.
(8)Incorporated by reference to Exhibit (10)C to Target's Form 10-Q Report for the quarter ended April 30, 2016.
*(9)*Incorporated by reference to Exhibit (10)D to Target's Form 10-Q Report for the quarter ended April 30, 2016.
*(10)*Incorporated by reference to Exhibit (10)E to Target's Form 10-K Report for the year ended February 1, 2014.
*(11)*Incorporated by reference to Exhibit (10)NN to Target's Form 10-Q Report for the quarter ended April 30, 2016.
*(12)*Incorporated by reference to Exhibit (10)F to Target's Form 10-Q Report for the quarter ended July 30, 2011.
*(13)*Incorporated by reference to Exhibit (10)I to Target's Form 10-K Report for the year ended February 3, 2007.
*(14)*Incorporated by reference to Exhibit (10)I to Target's Form 10-K Report for the year ended February 1, 2014.
*(15)*Incorporated by reference to Exhibit (10)L to Target's Form 10-Q Report for the quarter ended July 29, 2017.
*(16)*Incorporated by reference to Exhibit (10)A to Target's Form 10-Q Report for the quarter ended October 30, 2010.
*(17)*Incorporated by reference to Exhibit (10)O to Target's Form 10-K Report for the year ended January 29, 2005.
*(18)*Incorporated by reference to Exhibit (10)O to Target's Form 10-K Report for the year ended January 31, 2009.
*(19)*Incorporated by reference to Exhibit (10)AA to Target's Form 10-Q Report for the quarter ended July 30, 2011.
*(20)*Incorporated by reference to Exhibit (10)MM to Target's Form 10-Q Report for the quarter ended October 28, 2017.
*(21)*Incorporated by reference to Exhibit (10)V to Target's Form 10-K Report for the year ended January 31, 2015.
*(22)*Incorporated by reference to Exhibit (10)JJ to Target's Form 10-Q Report for the quarter ended April 29, 2017.
*(23)*Incorporated by reference to Exhibit (10)EE to Target's Form 8-K Report filed January 11, 2012.
*(24)*Incorporated by reference to Exhibit (10)Y to Target's Form 10-Q Report for the quarter ended August 1, 2020.
(25)Incorporated by reference to Exhibit (10)W to Target's Form 10-K Report for the year ended February 2, 2013.
*(26)*Incorporated by reference to Exhibit (10)HH to Target's Form 10-K Report for the year ended January 31, 2015.
*(27)*Incorporated by reference to Exhibit (10)A to Target's Form 8-K Report filed January 10, 2019.
*(28)*Incorporated by reference to Exhibit (10)O to Target's Form 10-Q Report for the quarter ended October 29, 2016.
*(29)*Incorporated by reference to Exhibit (10)LL to Target's Form 10-Q Report for the quarter ended October 28, 2017.
*(30)*Incorporated by reference to Exhibit (10)II to Target's Form 10-Q Report for the quarter ended November 3, 2018.
*(31)*Incorporated by reference to Exhibit (10)X to Target's Form 10-Q/A Report for the quarter ended May 4, 2013.
*(32)*Incorporated by reference to Exhibit (10)II to Target's Form 10-Q Report for the quarter ended May 2, 2015.
*(33)*Incorporated by reference to Exhibit (10)HH to Target's Form 10-K Report for the year ended February 1, 2020.
(34)Incorporated by reference to Exhibit (10)KK to Target's Form 10-K Report for the year ended January 30, 2016.
*(35)*Incorporated by reference to Exhibit (10)CC to Target's Form 10-K Report for the year ended January 28, 2017.
*(36)*Incorporated by reference to Exhibit (10)HH to Target's Form 10-K Report for the year ended February 3, 2018.
| TARGET CORPORATION | | 2020 Form 10-K | 66 |
| SUPPLEMENTAL INFORMATION | Table of Contents | |||||||
| Index to Financial Statements |
SIGNATURES
Pursuant to the requirements of Section 13 or 15(d) of the Securities Exchange Act of 1934, Target has duly caused this report to be signed on its behalf by the undersigned, thereunto duly authorized.
| TARGET CORPORATION | ||||||||
| By: | /s/ Michael J. Fiddelke | |||||||
| Dated: March 10, 2021 | Michael J. Fiddelke Executive Vice President and Chief Financial Officer | |||||||
Pursuant to the requirements of the Securities Exchange Act of 1934, the report has been signed below by the following persons on behalf of Target and in the capacities and on the dates indicated.
| /s/ Brian C. Cornell | |||||
| Dated: March 10, 2021 | Brian C. Cornell Chairman of the Board and Chief Executive Officer |
| /s/ Michael J. Fiddelke | |||||
| Dated: March 10, 2021 | Michael J. Fiddelke Executive Vice President and Chief Financial Officer |
| /s/ Robert M. Harrison | |||||
| Dated: March 10, 2021 | Robert M. Harrison Senior Vice President, Chief Accounting Officer and Controller |
| DOUGLAS M. BAKER, JR. GEORGE S. BARRETT CALVIN DARDEN ROBERT L. EDWARDS MELANIE L. HEALEY DONALD R. KNAUSS | CHRISTINE A. LEAHY MONICA C. LOZANO MARY E. MINNICK DERICA W. RICE KENNETH L. SALAZAR DMITRI L. STOCKTON | Constituting a majority of the Board of Directors |
Michael J. Fiddelke, by signing his name hereto, does hereby sign this document pursuant to powers of attorney duly executed by the Directors named, filed with the Securities and Exchange Commission on behalf of such Directors, all in the capacities and on the date stated.
| By: | /s/ Michael J. Fiddelke | |||||||
| Dated: March 10, 2021 | Michael J. Fiddelke Attorney-in-fact |
| TARGET CORPORATION | | 2020 Form 10-K | 67 |