 filings.tools
Target 10-Q 2021-10-30
Filed 2021-11-24. 8 sections, 120K characters. Original on sec.gov · Markdown · JSON
Cover and table of contents
| UNITED STATES SECURITIES AND EXCHANGE COMMISSION |
Washington, D.C. 20549
FORM 10-Q
(Mark One)
☒ QUARTERLY REPORT PURSUANT TO SECTION 13 OR 15(d) OF THE SECURITIES EXCHANGE ACT OF 1934
For the quarterly period ended October 30, 2021
OR
☐ TRANSITION REPORT PURSUANT TO SECTION 13 OR 15(d) OF THE SECURITIES EXCHANGE ACT OF 1934
For the transition period from ____ to ____
Commission File Number 1-6049

TARGET CORPORATION
(Exact name of registrant as specified in its charter)
Minnesota
(State or other jurisdiction of incorporation or organization)
1000 Nicollet Mall, Minneapolis, Minnesota
(Address of principal executive offices)
41-0215170
(I.R.S. Employer Identification No.)
55403
(Zip Code)
Registrant’s telephone number, including area code: 612/304-6073
Former name, former address and former fiscal year, if changed since last report: N/A
Securities registered pursuant to Section 12(b) of the Securities Exchange Act of 1934:
| Title of each class | Trading Symbol(s) | Name of each exchange on which registered | ||||||||||||
| Common stock, par value $0.0833 per share | TGT | New York Stock Exchange |
Indicate by check mark whether the registrant (1) has filed all reports required to be filed by Section 13 or 15(d) of the Securities Exchange Act of 1934 during the preceding 12 months (or for such shorter period that the registrant was required to file such reports), and (2) has been subject to such filing requirements for the past 90 days.
Yes ☒ No ☐
Indicate by check mark whether the registrant has submitted electronically every Interactive Data File required to be submitted pursuant to Rule 405 of Regulation S-T (§232.405 of this chapter) during the preceding 12 months (or for such shorter period that the registrant was required to submit such files). Yes ☒ No ☐
Indicate by check mark whether the registrant is a large accelerated filer, an accelerated filer, a non-accelerated filer, smaller reporting company, or an emerging growth company (as defined in Rule 12b-2 of the Exchange Act).
| Large accelerated filer | ☒ | Accelerated filer | ☐ | Non-accelerated filer | ☐ | ||||||||||||||||||||||||
| Smaller reporting company | ☐ | Emerging growth company | ☐ |
If an emerging growth company, indicate by check mark if the registrant has elected not to use the extended transition period for complying with any new or revised financial accounting standards provided pursuant to Section 13(a) of the Exchange Act. ☐
Indicate by check mark whether the registrant is a shell company (as defined in Rule 12b-2 of the Exchange Act). Yes ☐ No ☒
Indicate the number of shares outstanding of each of registrant’s classes of common stock, as of the latest practicable date. Total shares of common stock, par value $0.0833, outstanding at November 19, 2021, were 479,123,918.
| Table of Contents | ||||||||
| Index to Notes |
TARGET CORPORATION
TABLE OF CONTENTS
| FINANCIAL STATEMENTS | Table of Contents | |||||||
| Index to Notes |
PART I. FINANCIAL INFORMATION
Item 1. Financial Statements
| Consolidated Statements of Operations | |||||||||||||||||||||||
| Three Months Ended | Nine Months Ended | ||||||||||||||||||||||
| (millions, except per share data) (unaudited) | October 30, 2021 | October 31, 2020 | October 30, 2021 | October 31, 2020 | |||||||||||||||||||
| Sales | $ | 25,290 | $ | 22,336 | $ | 73,995 | $ | 64,403 | |||||||||||||||
| Other revenue | 362 | 296 | 1,014 | 819 | |||||||||||||||||||
| Total revenue | 25,652 | 22,632 | 75,009 | 65,222 | |||||||||||||||||||
| Cost of sales | 18,206 | 15,509 | 52,202 | 45,692 | |||||||||||||||||||
| Selling, general and administrative expenses | 4,859 | 4,647 | 14,217 | 13,167 | |||||||||||||||||||
| Depreciation and amortization (exclusive of depreciation included in cost of sales) | 577 | 541 | 1,739 | 1,660 | |||||||||||||||||||
| Operating income | 2,010 | 1,935 | 6,851 | 4,703 | |||||||||||||||||||
| Net interest expense | 105 | 632 | 317 | 871 | |||||||||||||||||||
| Net other (income) / expense | (6) | 5 | (356) | 16 | |||||||||||||||||||
| Earnings before income taxes | 1,911 | 1,298 | 6,890 | 3,816 | |||||||||||||||||||
| Provision for income taxes | 423 | 284 | 1,488 | 828 | |||||||||||||||||||
| Net earnings | $ | 1,488 | $ | 1,014 | $ | 5,402 | $ | 2,988 | |||||||||||||||
| Basic earnings per share | $ | 3.07 | $ | 2.02 | $ | 10.97 | $ | 5.97 | |||||||||||||||
| Diluted earnings per share | $ | 3.04 | $ | 2.01 | $ | 10.87 | $ | 5.91 | |||||||||||||||
| Weighted average common shares outstanding | |||||||||||||||||||||||
| Basic | 484.8 | 500.6 | 492.2 | 500.6 | |||||||||||||||||||
| Diluted | 489.4 | 505.4 | 496.8 | 505.2 | |||||||||||||||||||
| Antidilutive shares | — | — | — | — |
See accompanying Notes to Consolidated Financial Statements.
| TARGET CORPORATION |  | Q3 2021 Form 10-Q | 1 |
| FINANCIAL STATEMENTS | Table of Contents | |||||||
| Index to Notes |
| Consolidated Statements of Comprehensive Income | |||||||||||||||||||||||
| Three Months Ended | Nine Months Ended | ||||||||||||||||||||||
| (millions) (unaudited) | October 30, 2021 | October 31, 2020 | October 30, 2021 | October 31, 2020 | |||||||||||||||||||
| Net earnings | $ | 1,488 | $ | 1,014 | $ | 5,402 | $ | 2,988 | |||||||||||||||
| Other comprehensive income, net of tax | |||||||||||||||||||||||
| Pension benefit liabilities | 21 | 22 | 63 | 66 | |||||||||||||||||||
| Currency translation adjustment and cash flow hedges | 5 | 14 | 6 | 5 | |||||||||||||||||||
| Other comprehensive income | 26 | 36 | 69 | 71 | |||||||||||||||||||
| Comprehensive income | $ | 1,514 | $ | 1,050 | $ | 5,471 | $ | 3,059 |
See accompanying Notes to Consolidated Financial Statements.
| TARGET CORPORATION | | Q3 2021 Form 10-Q | 2 |
| FINANCIAL STATEMENTS | Table of Contents | |||||||
| Index to Notes |
| Consolidated Statements of Financial Position | |||||||||||||||||
| (millions, except footnotes) (unaudited) | October 30, 2021 | January 30, 2021 | October 31, 2020 | ||||||||||||||
| Assets | |||||||||||||||||
| Cash and cash equivalents | $ | 5,753 | $ | 8,511 | $ | 5,996 | |||||||||||
| Inventory | 14,958 | 10,653 | 12,712 | ||||||||||||||
| Other current assets | 1,865 | 1,592 | 1,601 | ||||||||||||||
| Total current assets | 22,576 | 20,756 | 20,309 | ||||||||||||||
| Property and equipment | |||||||||||||||||
| Land | 6,146 | 6,141 | 6,063 | ||||||||||||||
| Buildings and improvements | 32,478 | 31,557 | 31,398 | ||||||||||||||
| Fixtures and equipment | 6,144 | 5,914 | 5,843 | ||||||||||||||
| Computer hardware and software | 2,447 | 2,765 | 2,706 | ||||||||||||||
| Construction-in-progress | 1,302 | 780 | 518 | ||||||||||||||
| Accumulated depreciation | (20,602) | (20,278) | (19,755) | ||||||||||||||
| Property and equipment, net | 27,915 | 26,879 | 26,773 | ||||||||||||||
| Operating lease assets | 2,539 | 2,227 | 2,208 | ||||||||||||||
| Other noncurrent assets | 1,381 | 1,386 | 1,371 | ||||||||||||||
| Total assets | $ | 54,411 | $ | 51,248 | $ | 50,661 | |||||||||||
| Liabilities and shareholders’ investment | |||||||||||||||||
| Accounts payable | $ | 16,250 | $ | 12,859 | $ | 14,203 | |||||||||||
| Accrued and other current liabilities | 5,925 | 6,122 | 5,023 | ||||||||||||||
| Current portion of long-term debt and other borrowings | 1,176 | 1,144 | 131 | ||||||||||||||
| Total current liabilities | 23,351 | 20,125 | 19,357 | ||||||||||||||
| Long-term debt and other borrowings | 11,586 | 11,536 | 12,490 | ||||||||||||||
| Noncurrent operating lease liabilities | 2,494 | 2,218 | 2,196 | ||||||||||||||
| Deferred income taxes | 1,246 | 990 | 1,171 | ||||||||||||||
| Other noncurrent liabilities | 1,931 | 1,939 | 2,128 | ||||||||||||||
| Total noncurrent liabilities | 17,257 | 16,683 | 17,985 | ||||||||||||||
| Shareholders’ investment | |||||||||||||||||
| Common stock | 40 | 42 | 42 | ||||||||||||||
| Additional paid-in capital | 6,381 | 6,329 | 6,285 | ||||||||||||||
| Retained earnings | 8,069 | 8,825 | 7,789 | ||||||||||||||
| Accumulated other comprehensive loss | (687) | (756) | (797) | ||||||||||||||
| Total shareholders’ investment | 13,803 | 14,440 | 13,319 | ||||||||||||||
| Total liabilities and shareholders’ investment | $ | 54,411 | $ | 51,248 | $ | 50,661 |
Common Stock Authorized 6,000,000,000 shares, $0.0833 par value; 480,905,493, 500,877,129 and 500,754,729 shares issued and outstanding as of October 30, 2021, January 30, 2021, and October 31, 2020, respectively.
Preferred Stock Authorized 5,000,000 shares, $0.01 par value; no shares were issued or outstanding during any period presented.
See accompanying Notes to Consolidated Financial Statements.
| TARGET CORPORATION | | Q3 2021 Form 10-Q | 3 |
| FINANCIAL STATEMENTS | Table of Contents | |||||||
| Index to Notes |
| Consolidated Statements of Cash Flows | ||||||||||||||
| Nine Months Ended | ||||||||||||||
| (millions) (unaudited) | October 30, 2021 | October 31, 2020 | ||||||||||||
| Operating activities | ||||||||||||||
| Net earnings | $ | 5,402 | $ | 2,988 | ||||||||||
| Adjustments to reconcile net earnings to cash provided by operating activities: | ||||||||||||||
| Depreciation and amortization | 1,952 | 1,848 | ||||||||||||
| Share-based compensation expense | 187 | 161 | ||||||||||||
| Deferred income taxes | 233 | 26 | ||||||||||||
| Gain on Dermstore sale | (335) | — | ||||||||||||
| Loss on extinguishment of debt | — | 512 | ||||||||||||
| Noncash losses / (gains) and other, net | 18 | 124 | ||||||||||||
| Changes in operating accounts: | ||||||||||||||
| Inventory | (4,305) | (3,720) | ||||||||||||
| Other assets | (117) | (174) | ||||||||||||
| Accounts payable | 3,284 | 4,287 | ||||||||||||
| Accrued and other liabilities | (722) | 992 | ||||||||||||
| Cash provided by operating activities | 5,597 | 7,044 | ||||||||||||
| Investing activities | ||||||||||||||
| Expenditures for property and equipment | (2,483) | (2,009) | ||||||||||||
| Proceeds from disposal of property and equipment | 23 | 27 | ||||||||||||
| Proceeds from Dermstore sale | 356 | — | ||||||||||||
| Other investments | 14 | (3) | ||||||||||||
| Cash required for investing activities | (2,090) | (1,985) | ||||||||||||
| Financing activities | ||||||||||||||
| Additions to long-term debt | — | 2,480 | ||||||||||||
| Reductions of long-term debt | (112) | (2,395) | ||||||||||||
| Dividends paid | (1,116) | (1,002) | ||||||||||||
| Repurchase of stock | (5,042) | (741) | ||||||||||||
| Stock option exercises | 5 | 18 | ||||||||||||
| Cash required for financing activities | (6,265) | (1,640) | ||||||||||||
| Net (decrease) / increase in cash and cash equivalents | (2,758) | 3,419 | ||||||||||||
| Cash and cash equivalents at beginning of period | 8,511 | 2,577 | ||||||||||||
| Cash and cash equivalents at end of period | $ | 5,753 | $ | 5,996 | ||||||||||
| Supplemental information | ||||||||||||||
| Leased assets obtained in exchange for new finance lease liabilities | $ | 234 | $ | 344 | ||||||||||
| Leased assets obtained in exchange for new operating lease liabilities | 482 | 186 |
See accompanying Notes to Consolidated Financial Statements.
| TARGET CORPORATION | | Q3 2021 Form 10-Q | 4 |
| FINANCIAL STATEMENTS | Table of Contents | |||||||
| Index to Notes |
| Consolidated Statements of Shareholders’ Investment | |||||||||||||||||||||||||||||||||||
| Common | Stock | Additional | Accumulated Other | ||||||||||||||||||||||||||||||||
| Stock | Par | Paid-in | Retained | Comprehensive | |||||||||||||||||||||||||||||||
| (millions) (unaudited) | Shares | Value | Capital | Earnings | (Loss) / Income | Total | |||||||||||||||||||||||||||||
| February 1, 2020 | 504.2 | $ | 42 | $ | 6,226 | $ | 6,433 | $ | (868) | $ | 11,833 | ||||||||||||||||||||||||
| Net earnings | — | — | — | 284 | — | 284 | |||||||||||||||||||||||||||||
| Other comprehensive income | — | — | — | — | 14 | 14 | |||||||||||||||||||||||||||||
| Dividends declared | — | — | — | (333) | — | (333) | |||||||||||||||||||||||||||||
| Repurchase of stock | (5.7) | — | — | (609) | — | (609) | |||||||||||||||||||||||||||||
| Stock options and awards | 1.4 | — | (20) | — | — | (20) | |||||||||||||||||||||||||||||
| May 2, 2020 | 499.9 | $ | 42 | $ | 6,206 | $ | 5,775 | $ | (854) | $ | 11,169 | ||||||||||||||||||||||||
| Net earnings | — | — | — | 1,690 | — | 1,690 | |||||||||||||||||||||||||||||
| Other comprehensive income | — | — | — | — | 21 | 21 | |||||||||||||||||||||||||||||
| Dividends declared | — | — | — | (344) | — | (344) | |||||||||||||||||||||||||||||
| Stock options and awards | 0.4 | — | 42 | — | — | 42 | |||||||||||||||||||||||||||||
| August 1, 2020 | 500.3 | $ | 42 | $ | 6,248 | $ | 7,121 | $ | (833) | $ | 12,578 | ||||||||||||||||||||||||
| Net earnings | — | — | — | 1,014 | — | 1,014 | |||||||||||||||||||||||||||||
| Other comprehensive income | — | — | — | — | 36 | 36 | |||||||||||||||||||||||||||||
| Dividends declared | — | — | — | (346) | — | (346) | |||||||||||||||||||||||||||||
| Stock options and awards | 0.5 | — | 37 | — | — | 37 | |||||||||||||||||||||||||||||
| October 31, 2020 | 500.8 | $ | 42 | $ | 6,285 | $ | 7,789 | $ | (797) | $ | 13,319 | ||||||||||||||||||||||||
| Net earnings | — | — | — | 1,380 | — | 1,380 | |||||||||||||||||||||||||||||
| Other comprehensive income | — | — | — | — | 41 | 41 | |||||||||||||||||||||||||||||
| Dividends declared | — | — | — | (344) | — | (344) | |||||||||||||||||||||||||||||
| Stock options and awards | 0.1 | — | 44 | — | — | 44 | |||||||||||||||||||||||||||||
| January 30, 2021 | 500.9 | $ | 42 | $ | 6,329 | $ | 8,825 | $ | (756) | $ | 14,440 |
| TARGET CORPORATION | | Q3 2021 Form 10-Q | 5 |
| FINANCIAL STATEMENTS | Table of Contents | |||||||
| Index to Notes |
| Consolidated Statements of Shareholders’ Investment | |||||||||||||||||||||||||||||||||||
| Common | Stock | Additional | Accumulated Other | ||||||||||||||||||||||||||||||||
| Stock | Par | Paid-in | Retained | Comprehensive | |||||||||||||||||||||||||||||||
| (millions) (unaudited) | Shares | Value | Capital | Earnings | (Loss) / Income | Total | |||||||||||||||||||||||||||||
| January 30, 2021 | 500.9 | $ | 42 | $ | 6,329 | $ | 8,825 | $ | (756) | $ | 14,440 | ||||||||||||||||||||||||
| Net earnings | — | — | — | 2,097 | — | 2,097 | |||||||||||||||||||||||||||||
| Other comprehensive income | — | — | — | — | 31 | 31 | |||||||||||||||||||||||||||||
| Dividends declared | — | — | — | (343) | — | (343) | |||||||||||||||||||||||||||||
| Repurchase of stock | (6.1) | (1) | — | (1,207) | — | (1,208) | |||||||||||||||||||||||||||||
| Stock options and awards | 1.3 | — | (58) | — | — | (58) | |||||||||||||||||||||||||||||
| May 1, 2021 | 496.1 | $ | 41 | $ | 6,271 | $ | 9,372 | $ | (725) | $ | 14,959 | ||||||||||||||||||||||||
| Net earnings | — | — | — | 1,817 | — | 1,817 | |||||||||||||||||||||||||||||
| Other comprehensive income | — | — | — | — | 12 | 12 | |||||||||||||||||||||||||||||
| Dividends declared | — | — | — | (445) | — | (445) | |||||||||||||||||||||||||||||
| Repurchase of stock | (6.6) | — | — | (1,544) | — | (1,544) | |||||||||||||||||||||||||||||
| Stock options and awards | 0.2 | — | 61 | — | — | 61 | |||||||||||||||||||||||||||||
| July 31, 2021 | 489.7 | $ | 41 | $ | 6,332 | $ | 9,200 | $ | (713) | $ | 14,860 | ||||||||||||||||||||||||
| Net earnings | — | — | — | 1,488 | — | 1,488 | |||||||||||||||||||||||||||||
| Other comprehensive income | — | — | — | — | 26 | 26 | |||||||||||||||||||||||||||||
| Dividends declared | — | — | — | (439) | — | (439) | |||||||||||||||||||||||||||||
| Repurchase of stock | (8.8) | (1) | — | (2,180) | — | (2,181) | |||||||||||||||||||||||||||||
| Stock options and awards | — | — | 49 | — | — | 49 | |||||||||||||||||||||||||||||
| October 30, 2021 | 480.9 | $ | 40 | $ | 6,381 | $ | 8,069 | $ | (687) | $ | 13,803 | ||||||||||||||||||||||||
We declared $0.90 and $0.68 dividends per share for the three months ended October 30, 2021, and October 31, 2020, respectively, and $2.70 per share for the fiscal year ended January 30, 2021.
See accompanying Notes to Consolidated Financial Statements.
| TARGET CORPORATION | | Q3 2021 Form 10-Q | 6 |
| FINANCIAL STATEMENTS | Table of Contents | |||||||
| INDEX | Index to Notes |
| TARGET CORPORATION | | Q3 2021 Form 10-Q | 7 |
| FINANCIAL STATEMENTS | Table of Contents | |||||||
| NOTES | Index to Notes |
Notes to Consolidated Financial Statements (unaudited)
1. Accounting Policies
These unaudited condensed consolidated financial statements are prepared in accordance with the rules and regulations of the Securities and Exchange Commission applicable to interim financial statements. While these statements reflect all normal recurring adjustments that are, in the opinion of management, necessary for fair presentation of the results of the interim period, they do not include all of the information and footnotes required by United States generally accepted accounting principles (U.S. GAAP) for complete financial statements. These condensed consolidated financial statements should be read in conjunction with the financial statement disclosures in our 2020 Form 10-K.
We use the same accounting policies in preparing quarterly and annual financial statements.
We operate as a single segment that is designed to enable guests to purchase products seamlessly in stores or through our digital channels. Nearly all of our revenues are generated in the U.S. The vast majority of our long-lived assets are located within the U.S.
Due to the seasonal nature of our business, quarterly revenues, expenses, earnings, and cash flows are not necessarily indicative of the results that may be expected for the full year.
2. Coronavirus (COVID-19)
The novel coronavirus (COVID-19) pandemic continues to evolve. In 2020, states and cities took various measures in response to COVID-19, including mandating the closure of certain businesses and encouraging or requiring citizens to avoid large gatherings. To date, virtually all of our stores, digital channels, and distribution centers have remained open.
Since the onset of the COVID-19 pandemic, we have experienced strong comparable sales growth and significant volatility in our sales category and channel mix, including same-day fulfillment options. Note 4 presents sales by category. We have taken various actions, including accelerating purchases of certain merchandise in our core categories and, early in the pandemic, slowing or canceling purchase orders, primarily for Apparel and Accessories. As a result, during the quarter ended May 2, 2020, we recorded $216 million of purchase order cancellation fees in Cost of Sales.
3. Dermstore Sale
In February 2021, we sold our wholly owned subsidiary Dermstore LLC (Dermstore) for $356 million in cash and recognized a $335 million pretax gain, which is included in Net Other (Income) / Expense. Dermstore has historically represented less than 1 percent of our consolidated revenues, operating income, and net assets.
| TARGET CORPORATION | | Q3 2021 Form 10-Q | 8 |
| FINANCIAL STATEMENTS | Table of Contents | |||||||
| NOTES | Index to Notes |
4. Revenues
General merchandise sales represent the vast majority of our revenues. We also earn revenues from a variety of other sources, most notably credit card profit-sharing income from our arrangement with TD Bank Group (TD).
| Revenues | Three Months Ended | Nine Months Ended | |||||||||||||||||||||
| (millions) | October 30, 2021 | October 31, 2020 | October 30, 2021 | October 31, 2020 | |||||||||||||||||||
| Apparel and accessories (a) | $ | 4,364 | $ | 3,927 | $ | 13,384 | $ | 10,630 | |||||||||||||||
| Beauty and household essentials (b) | 6,980 | 6,103 | 20,070 | 18,172 | |||||||||||||||||||
| Food and beverage (c) | 5,074 | 4,397 | 14,617 | 13,158 | |||||||||||||||||||
| Hardlines (d) | 3,841 | 3,377 | 11,654 | 9,959 | |||||||||||||||||||
| Home furnishings and décor (e) | 4,989 | 4,506 | 14,147 | 12,395 | |||||||||||||||||||
| Other | 42 | 26 | 123 | 89 | |||||||||||||||||||
| Sales | 25,290 | 22,336 | 73,995 | 64,403 | |||||||||||||||||||
| Credit card profit sharing | 184 | 164 | 527 | 488 | |||||||||||||||||||
| Other | 178 | 132 | 487 | 331 | |||||||||||||||||||
| Other revenue | 362 | 296 | 1,014 | 819 | |||||||||||||||||||
| Total revenue | $ | 25,652 | $ | 22,632 | $ | 75,009 | $ | 65,222 |
*(a)*Includes apparel for women, men, boys, girls, toddlers, infants and newborns, as well as jewelry, accessories, and shoes.
*(b)*Includes beauty and personal care, baby gear, cleaning, paper products, and pet supplies.
*(c)*Includes dry grocery, dairy, frozen food, beverages, candy, snacks, deli, bakery, meat, produce, and food service in our stores.
*(d)*Includes electronics (including video game hardware and software), toys, entertainment, sporting goods, and luggage.
*(e)*Includes furniture, lighting, storage, kitchenware, small appliances, home décor, bed and bath, home improvement, school and office supplies, greeting cards and party supplies, and other seasonal merchandise.
Merchandise sales — We record almost all retail store revenues at the point of sale. Digitally originated sales may include shipping revenue and are recorded upon delivery to the guest or upon guest pickup at the store. Sales are recognized net of expected returns, which we estimate using historical return patterns. As of October 30, 2021, January 30, 2021, and October 31, 2020, the accrual for estimated returns was $210 million, $139 million, and $182 million, respectively.
Revenue from Target gift card sales is recognized upon gift card redemption, which is typically within one year of issuance.
| Gift Card Liability Activity | January 30, 2021 | Gift Cards Issued During Current Period But Not Redeemed (b) | Revenue Recognized From Beginning Liability | October 30, 2021 | |||||||||||||||||||
| (millions) | |||||||||||||||||||||||
| Gift card liability (a) | $ | 1,035 | $ | 502 | $ | (631) | $ | 906 |
*(a)*Included in Accrued and Other Current Liabilities.
*(b)*Net of estimated breakage.
Credit card profit sharing — We receive payments under a credit card program agreement with TD. Under the agreement, we receive a percentage of the profits generated by the Target Credit Card and Target MasterCard receivables in exchange for performing account servicing and primary marketing functions. TD underwrites, funds, and owns Target Credit Card and Target MasterCard receivables, controls risk management policies, and oversees regulatory compliance.
| TARGET CORPORATION | | Q3 2021 Form 10-Q | 9 |
| FINANCIAL STATEMENTS | Table of Contents | |||||||
| NOTES | Index to Notes |
5. Fair Value Measurements
Fair value measurements are reported in one of three levels reflecting the valuation techniques used to determine fair value.
| Financial Instruments Measured On a Recurring Basis | Fair Value | ||||||||||||||||||||||
| (millions) | Classification | Pricing Category | October 30, 2021 | January 30, 2021 | October 31, 2020 | ||||||||||||||||||
| Assets | |||||||||||||||||||||||
| Short-term investments | Cash and Cash Equivalents | Level 1 | $ | 4,818 | $ | 7,644 | $ | 5,089 | |||||||||||||||
| Prepaid forward contracts | Other Current Assets | Level 1 | 44 | 38 | 32 | ||||||||||||||||||
| Equity securities | Other Current Assets | Level 1 | — | — | 19 | ||||||||||||||||||
| Interest rate swaps | Other Current Assets | Level 2 | 12 | — | — | ||||||||||||||||||
| Interest rate swaps | Other Noncurrent Assets | Level 2 | 116 | 188 | 205 | ||||||||||||||||||
| Liabilities | |||||||||||||||||||||||
| Interest rate swaps | Other Noncurrent Liabilities | Level 2 | — | — | 3 | ||||||||||||||||||
| Significant Financial Instruments Not Measured at Fair Value (a) (millions) | October 30, 2021 | January 30, 2021 | October 31, 2020 | |||||||||||||||||||||||
| Carrying Amount | Fair Value | Carrying Amount | Fair Value | Carrying Amount | Fair Value | |||||||||||||||||||||
| Long-term debt, including current portion (b) | $ | 10,605 | $ | 12,300 | $ | 10,643 | $ | 12,787 | $ | 10,641 | $ | 12,787 |
*(a)*The carrying amounts of certain other current assets, commercial paper, accounts payable, and certain accrued and other current liabilities approximate fair value due to their short-term nature.
*(b)*The fair value of debt is generally measured using a discounted cash flow analysis based on current market interest rates for the same or similar types of financial instruments and would be classified as Level 2. These amounts exclude commercial paper, unamortized swap valuation adjustments, and lease liabilities.
6. Property and Equipment
We review long-lived assets for impairment when store performance expectations, events, or changes in circumstances—such as a decision to relocate or close a store, office, or distribution center, discontinue a project, or make significant software changes—indicate that the asset’s carrying value may not be recoverable. We recognized impairment charges of $3 million and $84 million during the three and nine months ended October 30, 2021, respectively. We recognized impairment charges of $2 million and $62 million during the three and nine months ended October 31, 2020, respectively. These impairment charges are included in Selling, General and Administrative Expenses (SG&A).
7. Commercial Paper and Long-Term Debt
In October 2021, we obtained a committed $3.0 billion unsecured revolving credit facility that will expire in October 2026. This new facility replaced our $2.5 billion unsecured revolving credit facility that was set to expire in October 2023. No balances were outstanding under either credit facility at any time during 2021 or 2020.
8. Derivative Financial Instruments
Our derivative instruments consist of interest rate swaps used to mitigate interest rate risk. As a result, we have counterparty credit exposure to large global financial institutions, which we monitor on an ongoing basis. Note 5 to the Consolidated Financial Statements provides the fair value and classification of these instruments.
As of October 30, 2021, January 30, 2021, and October 31, 2020, we were party to interest rate swaps with notional amounts totaling $1.5 billion. We pay a floating rate and receive a fixed rate under each of these agreements. All of the agreements are designated as fair value hedges, and all were considered to be perfectly effective under the shortcut method during the three and nine months ended October 30, 2021, and October 31, 2020.
| TARGET CORPORATION | | Q3 2021 Form 10-Q | 10 |
| FINANCIAL STATEMENTS | Table of Contents | |||||||
| NOTES | Index to Notes |
As of October 30, 2021, we were party to forward-starting interest rate swaps with notional amounts totaling $1.25 billion. As of January 30, 2021, and October 31, 2020, we were party to forward-starting interest rate swaps with notional amounts totaling $250 million. We use these derivative financial instruments, which have been designated as cash flow hedges, to hedge the interest rate exposure of anticipated future debt issuances during the next three years. As of October 30, 2021, Accumulated Other Comprehensive Loss (AOCI) included a gain of $15 million that will be reclassified and reduce Net Interest Expense as we record interest expense on the associated debt.
| Effect of Hedges on Debt (millions) | October 30, 2021 | January 30, 2021 | October 31, 2020 | |||||||||||||||||
| Long-term debt and other borrowings | ||||||||||||||||||||
| Carrying amount of hedged debt | $ | 1,609 | $ | 1,677 | $ | 1,696 | ||||||||||||||
| Cumulative hedging adjustments, included in carrying amount | 114 | 183 | 203 |
| Effect of Hedges on Net Interest Expense | Three Months Ended | Nine Months Ended | |||||||||||||||||||||
| (millions) | October 30, 2021 | October 31, 2020 | October 30, 2021 | October 31, 2020 | |||||||||||||||||||
| Gain (loss) on fair value hedges recognized in Net Interest Expense | |||||||||||||||||||||||
| Interest rate swap designated as fair value hedges | $ | (40) | $ | (36) | $ | (69) | $ | 66 | |||||||||||||||
| Hedged debt | 40 | 36 | 69 | (66) | |||||||||||||||||||
| Total | $ | — | $ | — | $ | — | $ | — |
9. Share Repurchase
We periodically repurchase shares of our common stock under a board-authorized repurchase program through a combination of open market transactions, accelerated share repurchase arrangements, and other privately negotiated transactions with financial institutions.
| Share Repurchase Activity | Three Months Ended | Nine Months Ended | |||||||||||||||||||||
| (millions, except per share data) | October 30, 2021 | October 31, 2020 | October 30, 2021 | October 31, 2020 | |||||||||||||||||||
| Number of shares purchased | 8.8 | — | 21.5 | 5.7 | |||||||||||||||||||
| Average price paid per share | $ | 246.80 | $ | — | $ | 226.93 | $ | 107.58 | |||||||||||||||
| Total investment | $ | 2,184 | $ | — | $ | 4,884 | $ | 609 |
10. Pension Benefits
We provide pension plan benefits to eligible team members.
| Net Pension Benefits Expense | Three Months Ended | Nine Months Ended | ||||||||||||||||||||||||
| (millions) | Classification | October 30, 2021 | October 31, 2020 | October 30, 2021 | October 31, 2020 | |||||||||||||||||||||
| Service cost benefits earned | SG&A | $ | 25 | $ | 25 | $ | 73 | $ | 76 | |||||||||||||||||
| Interest cost on projected benefit obligation | Net Other (Income) / Expense | 24 | 30 | 72 | 89 | |||||||||||||||||||||
| Expected return on assets | Net Other (Income) / Expense | (60) | (61) | (178) | (182) | |||||||||||||||||||||
| Amortization of losses | Net Other (Income) / Expense | 28 | 32 | 85 | 96 | |||||||||||||||||||||
| Amortization of prior service cost | Net Other (Income) / Expense | 2 | (3) | 1 | (9) | |||||||||||||||||||||
| Settlement charges | Net Other (Income) / Expense | — | 1 | — | 1 | |||||||||||||||||||||
| Total | $ | 19 | $ | 24 | $ | 53 | $ | 71 |
| TARGET CORPORATION | | Q3 2021 Form 10-Q | 11 |
| FINANCIAL STATEMENTS | Table of Contents | |||||||
| NOTES | Index to Notes |
11. Accumulated Other Comprehensive Loss
| Change in Accumulated Other Comprehensive Loss | Cash Flow Hedges | Currency Translation Adjustment | Pension | Total | |||||||||||||||||||
| (millions) | |||||||||||||||||||||||
| January 30, 2021 | $ | (3) | $ | (18) | $ | (735) | $ | (756) | |||||||||||||||
| Other comprehensive income (loss) before reclassifications, net of tax | 7 | (1) | — | 6 | |||||||||||||||||||
| Amounts reclassified from AOCI, net of tax | — | — | 63 | 63 | |||||||||||||||||||
| October 30, 2021 | $ | 4 | $ | (19) | $ | (672) | $ | (687) |
| TARGET CORPORATION | | Q3 2021 Form 10-Q | 12 |
| MANAGEMENT'S DISCUSSION AND ANALYSIS | Table of Contents | |||||||
| FINANCIAL SUMMARY | Index to Notes |
Item 2. Management’s Discussion and Analysis of Financial Condition and Results of Operations
Financial Summary
Third quarter 2021 included the following notable items:
-
GAAP diluted earnings per share were $3.04.
-
Adjusted diluted earnings per share were $3.03.
-
Total revenue increased 13.3 percent, driven by an increase in comparable sales.
-
Comparable sales increased 12.7 percent, driven primarily by a 12.9 percent increase in traffic.
*◦*Comparable stores originated sales grew 9.7 percent.
◦Comparable digitally originated sales increased 28.9 percent.
- Operating income of $2.0 billion was 3.9 percent higher than for the comparable prior-year period.
Sales were $25.3 billion for the three months ended October 30, 2021, an increase of $3.0 billion, or 13.2 percent, from the comparable prior-year period. Cash flow provided by operating activities was $5.6 billion for the nine months ended October 30, 2021, a decrease of $1.4 billion, or (20.5) percent, from $7.0 billion for the nine months ended October 31, 2020. The drivers of the operating cash flow decrease are described on page 21.
| Earnings Per Share | Three Months Ended | Nine Months Ended | |||||||||||||||||||||||||||||||||
| October 30, 2021 | October 31, 2020 | Change | October 30, 2021 | October 31, 2020 | Change | ||||||||||||||||||||||||||||||
| GAAP diluted earnings per share | $ | 3.04 | $ | 2.01 | 51.6 | % | $ | 10.87 | $ | 5.91 | 83.9 | % | |||||||||||||||||||||||
| Adjustments | (0.01) | 0.78 | (0.50) | 0.83 | |||||||||||||||||||||||||||||||
| Adjusted diluted earnings per share | $ | 3.03 | $ | 2.79 | 8.7 | % | $ | 10.37 | $ | 6.75 | 53.7 | % |
Note: Amounts may not foot due to rounding. Adjusted diluted earnings per share (Adjusted EPS), a non-GAAP metric, excludes the impact of certain items. Management believes that Adjusted EPS is useful in providing period-to-period comparisons of the results of our operations. A reconciliation of non-GAAP financial measures to GAAP measures is provided on page 18.
We report after-tax return on invested capital (ROIC) because we believe ROIC provides a meaningful measure of our capital allocation effectiveness over time. For the trailing twelve months ended October 30, 2021, after-tax ROIC was 31.3 percent, compared with 19.9 percent for the trailing twelve months ended October 31, 2020. The calculation of ROIC is provided on page 20.
COVID-19
Since the onset of the COVID-19 pandemic, we have experienced strong comparable sales growth and significant volatility in our sales category and channel mix.
Supply Chain Disruptions
In recent months, we have seen increasing supply chain disruptions, including country of origin production and port delays. Additionally, trucker and dockworker shortages, a broad-based surge in consumer demand, and other factors have led to industry-wide U.S. port and ground transportation delays. In response, we have taken various actions, including ordering merchandise earlier, securing ocean freight routes, and increased use of air transport for certain merchandise. While our inventory position is over $2 billion higher than a year ago, if we are unable to continue to source enough inventory and move it through our supply chain to our stores on a timely basis, we may experience increased out-of-stocks and lost sales. Some of these supply chain disruptions and resulting actions have resulted in increased costs. The Gross Margin Rate analysis on page 16 provides additional information.
| TARGET CORPORATION | | Q3 2021 Form 10-Q | 13 |
| MANAGEMENT'S DISCUSSION AND ANALYSIS | Table of Contents | |||||||
| ANALYSIS OF RESULTS OF OPERATIONS |
Analysis of Results of Operations
| Summary of Operating Income | Three Months Ended | Nine Months Ended | |||||||||||||||||||||||||||||||||
| (dollars in millions) | October 30, 2021 | October 31, 2020 | Change | October 30, 2021 | October 31, 2020 | Change | |||||||||||||||||||||||||||||
| Sales | $ | 25,290 | $ | 22,336 | 13.2 | % | $ | 73,995 | $ | 64,403 | 14.9 | % | |||||||||||||||||||||||
| Other revenue | 362 | 296 | 22.3 | 1,014 | 819 | 23.9 | |||||||||||||||||||||||||||||
| Total revenue | 25,652 | 22,632 | 13.3 | 75,009 | 65,222 | 15.0 | |||||||||||||||||||||||||||||
| Cost of sales | 18,206 | 15,509 | 17.4 | 52,202 | 45,692 | 14.2 | |||||||||||||||||||||||||||||
| Selling, general and administrative expenses | 4,859 | 4,647 | 4.6 | 14,217 | 13,167 | 8.0 | |||||||||||||||||||||||||||||
| Depreciation and amortization (exclusive of depreciation included in cost of sales) | 577 | 541 | 6.4 | 1,739 | 1,660 | 4.8 | |||||||||||||||||||||||||||||
| Operating income | $ | 2,010 | $ | 1,935 | 3.9 | % | $ | 6,851 | $ | 4,703 | 45.7 | % |
| Rate Analysis | Three Months Ended | Nine Months Ended | |||||||||||||||||||||
| October 30, 2021 | October 31, 2020 | October 30, 2021 | October 31, 2020 | ||||||||||||||||||||
| Gross margin rate | 28.0 | % | 30.6 | % | 29.5 | % | 29.1 | % | |||||||||||||||
| SG&A expense rate | 18.9 | 20.5 | 19.0 | 20.2 | |||||||||||||||||||
| Depreciation and amortization expense rate (exclusive of depreciation included in cost of sales) | 2.2 | 2.4 | 2.3 | 2.5 | |||||||||||||||||||
| Operating income margin rate | 7.8 | 8.5 | 9.1 | 7.2 |
Note: Gross margin rate is calculated as gross margin (sales less cost of sales) divided by sales. All other rates are calculated by dividing the applicable amount by total revenue.
Sales
Sales include all merchandise sales, net of expected returns, and our estimate of gift card breakage. We use comparable sales to evaluate the performance of our stores and digital channel sales by measuring the change in sales for a period over the comparable prior-year period of equivalent length. Comparable sales include all sales—except sales from stores open less than 13 months, digital acquisitions we have owned less than 13 months, stores that have been closed, and digital acquisitions that we no longer operate. Comparable sales measures vary across the retail industry. As a result, our comparable sales calculation is not necessarily comparable to similarly titled measures reported by other companies. Digitally originated sales include all sales initiated through mobile applications and our websites. Our stores fulfill the majority of digitally originated sales, including shipment from stores to guests, store Order Pickup or Drive Up, and delivery via our wholly owned subsidiary, Shipt. Digitally originated sales may also be fulfilled through our distribution centers, our vendors, or other third parties.
Sales growth—from both comparable sales and new stores—represents an important driver of our long-term profitability. We expect that comparable sales growth will drive the majority of our total sales growth. We believe that our ability to successfully differentiate our guests’ shopping experience through a careful combination of merchandise assortment, price, convenience, guest experience, and other factors will, over the long-term, drive both increasing shopping frequency (traffic) and the amount spent each visit (average transaction amount).
| Comparable Sales | Three Months Ended | Nine Months Ended | |||||||||||||||||||||
| October 30, 2021 | October 31, 2020 | October 30, 2021 | October 31, 2020 | ||||||||||||||||||||
| Comparable sales change | 12.7 | % | 20.7 | % | 14.4 | % | 18.7 | % | |||||||||||||||
| Drivers of change in comparable sales | |||||||||||||||||||||||
| Number of transactions | 12.9 | 4.5 | 14.0 | 2.6 | |||||||||||||||||||
| Average transaction amount | (0.2) | 15.6 | 0.3 | 15.7 | |||||||||||||||||||
| TARGET CORPORATION | | Q3 2021 Form 10-Q | 14 |
| MANAGEMENT'S DISCUSSION AND ANALYSIS | Table of Contents | |||||||
| ANALYSIS OF RESULTS OF OPERATIONS |
| Comparable Sales by Channel | Three Months Ended | Nine Months Ended | |||||||||||||||||||||
| October 30, 2021 | October 31, 2020 | October 30, 2021 | October 31, 2020 | ||||||||||||||||||||
| Stores originated comparable sales change | 9.7 | % | 9.9 | % | 11.9 | % | 7.3 | % | |||||||||||||||
| Digitally originated comparable sales change | 28.9 | 154.5 | 27.8 | 163.9 |
| Sales by Channel | Three Months Ended | Nine Months Ended | |||||||||||||||||||||
| October 30, 2021 | October 31, 2020 | October 30, 2021 | October 31, 2020 | ||||||||||||||||||||
| Stores originated | 82.4 | % | 84.3 | % | 82.3 | % | 83.9 | % | |||||||||||||||
| Digitally originated | 17.6 | 15.7 | 17.7 | 16.1 | |||||||||||||||||||
| Total | 100 | % | 100 | % | 100 | % | 100 | % |
| Sales by Fulfillment Channel | Three Months Ended | Nine Months Ended | |||||||||||||||||||||
| October 30, 2021 | October 31, 2020 | October 30, 2021 | October 31, 2020 | ||||||||||||||||||||
| Stores | 96.7 | % | 96.1 | % | 96.5 | % | 96.2 | % | |||||||||||||||
| Other | 3.3 | 3.9 | 3.5 | 3.8 | |||||||||||||||||||
| Total | 100 | % | 100 | % | 100 | % | 100 | % |
Note: Sales fulfilled by stores include in-store purchases and digitally originated sales fulfilled by shipping merchandise from stores to guests, Order Pickup, Drive Up, and Shipt.
| Sales by Product Category | Three Months Ended | Nine Months Ended | |||||||||||||||||||||
| October 30, 2021 | October 31, 2020 | October 30, 2021 | October 31, 2020 | ||||||||||||||||||||
| Apparel and accessories | 17 | % | 18 | % | 18 | % | 17 | % | |||||||||||||||
| Beauty and household essentials | 28 | 27 | 27 | 28 | |||||||||||||||||||
| Food and beverage | 20 | 20 | 20 | 20 | |||||||||||||||||||
| Hardlines | 15 | 15 | 16 | 16 | |||||||||||||||||||
| Home furnishings and décor | 20 | 20 | 19 | 19 | |||||||||||||||||||
| Total | 100 | % | 100 | % | 100 | % | 100 | % |
The collective interaction of a broad array of macroeconomic, competitive, and consumer behavioral factors, as well as sales mix and the transfer of sales to new stores, makes further analysis of sales metrics infeasible.
We monitor the percentage of purchases that are paid for using RedCards (RedCard Penetration) because our internal analysis has indicated that a meaningful portion of the incremental purchases on RedCards are also incremental sales for Target. Guests receive a 5 percent discount on virtually all purchases when they use a RedCard at Target. RedCard sales increased for the three and nine months ended October 30, 2021, and October 31, 2020; however, RedCard penetration declined as total Sales increased at a faster pace.
| RedCard Penetration | Three Months Ended | Nine Months Ended | |||||||||||||||||||||
| October 30, 2021 | October 31, 2020 | October 30, 2021 | October 31, 2020 | ||||||||||||||||||||
| Target Debit Card | 11.7 | % | 12.2 | % | 11.8 | % | 12.2 | % | |||||||||||||||
| Target Credit Cards | 8.9 | 9.3 | 8.7 | 9.2 | |||||||||||||||||||
| Total RedCard Penetration | 20.7 | % | 21.5 | % | 20.5 | % | 21.4 | % |
Note: Amounts may not foot due to rounding.
| TARGET CORPORATION | | Q3 2021 Form 10-Q | 15 |
| MANAGEMENT'S DISCUSSION AND ANALYSIS | Table of Contents | |||||||
| ANALYSIS OF RESULTS OF OPERATIONS |
Gross Margin Rate
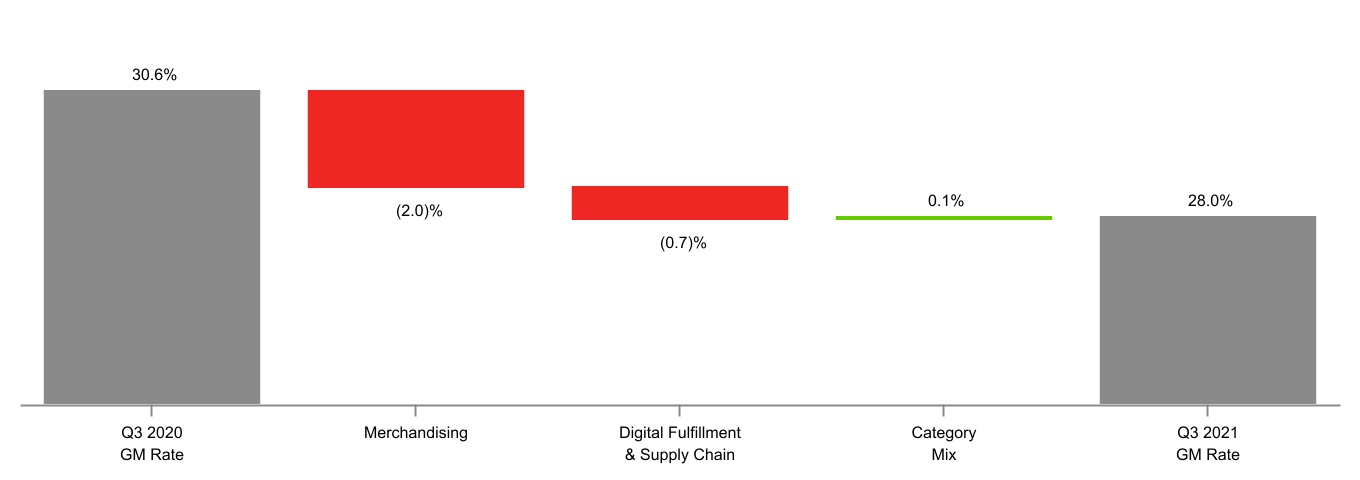
For the three months ended October 30, 2021, our gross margin rate was 28.0 percent compared with 30.6 percent in the comparable prior-year period. This decrease reflected the net impact of
-
pressure from higher merchandise and freight costs and higher inventory shrink, partially offset by the benefit of historically low promotional and clearance markdown rates;
-
supply chain pressure related to increased compensation and headcount in our distribution centers; and
-
favorable mix in the relative growth rates of higher and lower margin categories.
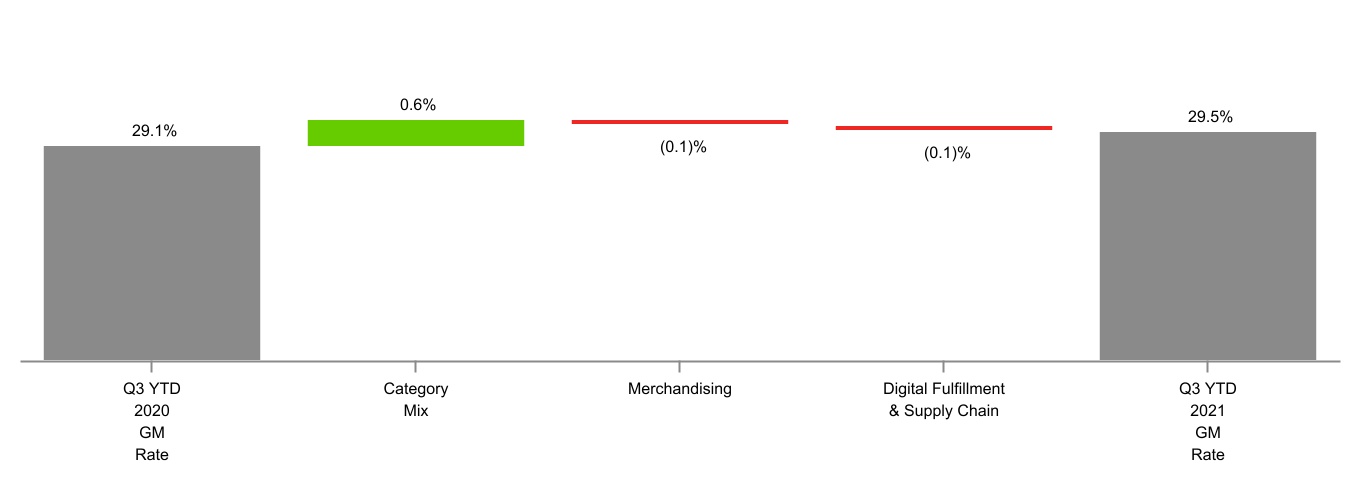
For the nine months ended October 30, 2021, our gross margin rate was 29.5 percent compared with 29.1 percent in the comparable prior-year period. This increase reflected the net impact of
-
favorable mix in the relative growth rates of higher and lower margin categories;
-
higher merchandise and freight costs partially offset by historically low promotional and clearance markdown rates; and
-
supply chain pressure related to increased compensation and headcount in our distribution centers, partially offset by the small net benefit of a higher percentage of digital sales fulfilled through our lower-cost same-day fulfillment options.
Selling, General, and Administrative Expense Rate
For the three months ended October 30, 2021, our SG&A expense rate was 18.9 percent compared with 20.5 percent for the three months ended October 31, 2020. For the nine months ended October 30, 2021, our SG&A expense rate was 19.0 percent compared with 20.2 percent for the nine months ended October 31, 2020. The decreases reflect the net leverage benefit from strong revenue growth.
| TARGET CORPORATION | | Q3 2021 Form 10-Q | 16 |
| MANAGEMENT'S DISCUSSION AND ANALYSIS | Table of Contents | |||||||
| ANALYSIS OF RESULTS OF OPERATIONS |
Store Data
| Change in Number of Stores | Three Months Ended | Nine Months Ended | |||||||||||||||||||||
| October 30, 2021 | October 31, 2020 | October 30, 2021 | October 31, 2020 | ||||||||||||||||||||
| Beginning store count | 1,909 | 1,871 | 1,897 | 1,868 | |||||||||||||||||||
| Opened | 15 | 27 | 29 | 30 | |||||||||||||||||||
| Closed | — | (1) | (2) | (1) | |||||||||||||||||||
| Ending store count | 1,924 | 1,897 | 1,924 | 1,897 | |||||||||||||||||||
| Number of Stores and Retail Square Feet | Number of Stores | Retail Square Feet (a) | |||||||||||||||||||||
| October 30, 2021 | January 30, 2021 | October 31, 2020 | October 30, 2021 | January 30, 2021 | October 31, 2020 | ||||||||||||||||||
| 170,000 or more sq. ft. | 274 | 273 | 273 | 49,071 | 48,798 | 48,798 | |||||||||||||||||
| 50,000 to 169,999 sq. ft. | 1,515 | 1,509 | 1,509 | 190,116 | 189,508 | 189,508 | |||||||||||||||||
| 49,999 or less sq. ft. | 135 | 115 | 115 | 3,952 | 3,342 | 3,342 | |||||||||||||||||
| Total | 1,924 | 1,897 | 1,897 | 243,139 | 241,648 | 241,648 |
*(a)*In thousands, reflects total square feet less office, distribution center, and vacant space.
Other Performance Factors
Net Interest Expense
Net interest expense was $105 million and $317 million for the three and nine months ended October 30, 2021, respectively, compared with $632 million and $871 million, respectively, in the comparable prior-year period. The decrease in net interest expense was primarily due to a loss on early retirement of debt of $512 million for the three and nine months ended October 31, 2020, compared with the current-year periods.
Net Other (Income) / Expense
Net Other (Income) / Expense was $(6) million and $(356) million for the three and nine months ended October 30, 2021, respectively, compared with $5 million and $16 million, respectively, in the comparable prior-year periods. The nine months ended October 30, 2021, included the $335 million gain on the February 2021 sale of Dermstore. Note 3 to the Financial Statements provides additional information.
Provision for Income Taxes
Our effective income tax rate for the three and nine months ended October 30, 2021, was 22.1 percent and 21.6 percent, respectively, compared with 21.9 percent and 21.7 percent, respectively, in the comparable prior-year periods.
| TARGET CORPORATION | | Q3 2021 Form 10-Q | 17 |
| MANAGEMENT'S DISCUSSION AND ANALYSIS | Table of Contents | |||||||
| RECONCILIATION OF NON-GAAP FINANCIAL MEASURES | Index to Notes |
Reconciliation of Non-GAAP Financial Measures to GAAP Measures
To provide additional transparency, we have disclosed non-GAAP adjusted diluted earnings per share (Adjusted EPS). This metric excludes certain items presented below. We believe this information is useful in providing period-to-period comparisons of the results of our operations. This measure is not in accordance with, or an alternative to, U.S. GAAP. The most comparable GAAP measure is diluted earnings per share. Adjusted EPS should not be considered in isolation or as a substitution for analysis of our results as reported in accordance with GAAP. Other companies may calculate Adjusted EPS differently, limiting the usefulness of the measure for comparisons with other companies.
| Reconciliation of Non-GAAP Adjusted EPS | Three Months Ended | |||||||||||||||||||||||||||||||||||||
| October 30, 2021 | October 31, 2020 | |||||||||||||||||||||||||||||||||||||
| (millions, except per share data) | Pretax | Net of Tax | Per Share Amounts | Pretax | Net of Tax | Per Share Amounts | ||||||||||||||||||||||||||||||||
| GAAP diluted earnings per share | $ | 3.04 | $ | 2.01 | ||||||||||||||||||||||||||||||||||
| Adjustments | ||||||||||||||||||||||||||||||||||||||
| Loss on debt extinguishment | $ | — | $ | — | $ | — | $ | 512 | $ | 379 | $ | 0.75 | ||||||||||||||||||||||||||
| Loss on investment (a) | — | — | — | 8 | 9 | 0.02 | ||||||||||||||||||||||||||||||||
| Other (b) | (9) | (7) | (0.01) | 8 | 6 | 0.01 | ||||||||||||||||||||||||||||||||
| Adjusted diluted earnings per share | $ | 3.03 | $ | 2.79 |
| Reconciliation of Non-GAAP Adjusted EPS | Nine Months Ended | |||||||||||||||||||||||||||||||||||||
| October 30, 2021 | October 31, 2020 | |||||||||||||||||||||||||||||||||||||
| (millions, except per share data) | Pretax | Net of Tax | Per Share Amounts | Pretax | Net of Tax | Per Share Amounts | ||||||||||||||||||||||||||||||||
| GAAP diluted earnings per share | $ | 10.87 | $ | 5.91 | ||||||||||||||||||||||||||||||||||
| Adjustments | ||||||||||||||||||||||||||||||||||||||
| Gain on Dermstore sale | $ | (335) | $ | (269) | $ | (0.54) | $ | — | $ | — | $ | — | ||||||||||||||||||||||||||
| Loss on debt extinguishment | — | — | — | 512 | 379 | 0.75 | ||||||||||||||||||||||||||||||||
| Loss on investment (a) | — | — | — | 19 | 18 | 0.03 | ||||||||||||||||||||||||||||||||
| Other (b) | 27 | 20 | 0.04 | 33 | 24 | 0.05 | ||||||||||||||||||||||||||||||||
| Adjusted diluted earnings per share | $ | 10.37 | $ | 6.75 |
Note: Amounts may not foot due to rounding.
*(a)*Represented a loss on our investment in Casper Sleep Inc., which was not core to our operations. We sold this investment during the fourth quarter of 2020.
*(b)*Other items unrelated to current period operations, none of which were individually significant.
| TARGET CORPORATION | | Q3 2021 Form 10-Q | 18 |
| MANAGEMENT'S DISCUSSION AND ANALYSIS | Table of Contents | |||||||
| RECONCILIATION OF NON-GAAP FINANCIAL MEASURES | Index to Notes |
Earnings before interest expense and income taxes (EBIT) and earnings before interest expense, income taxes, depreciation, and amortization (EBITDA) are non-GAAP financial measures. We believe these measures provide meaningful information about our operational efficiency compared with our competitors by excluding the impact of differences in tax jurisdictions and structures, debt levels, and, for EBITDA, capital investment. These measures are not in accordance with, or an alternative to, GAAP. The most comparable GAAP measure is net earnings. EBIT and EBITDA should not be considered in isolation or as a substitution for analysis of our results as reported in accordance with GAAP. Other companies may calculate EBIT and EBITDA differently, limiting the usefulness of the measures for comparisons with other companies.
| EBIT and EBITDA | Three Months Ended | Nine Months Ended | ||||||||||||||||||||||||||||||||||||
| (dollars in millions) | October 30, 2021 | October 31, 2020 | Change | October 30, 2021 | October 31, 2020 | Change | ||||||||||||||||||||||||||||||||
| Net earnings | $ | 1,488 | $ | 1,014 | 46.8 | % | $ | 5,402 | $ | 2,988 | 80.8 | % | ||||||||||||||||||||||||||
| + Provision for income taxes | 423 | 284 | 48.7 | 1,488 | 828 | 79.7 | ||||||||||||||||||||||||||||||||
| + Net interest expense | 105 | 632 | (83.2) | 317 | 871 | (63.5) | ||||||||||||||||||||||||||||||||
| EBIT | $ | 2,016 | $ | 1,930 | 4.5 | % | $ | 7,207 | $ | 4,687 | 53.8 | % | ||||||||||||||||||||||||||
| + Total depreciation and amortization (a) | 652 | 603 | 7.9 | 1,952 | 1,848 | 5.6 | ||||||||||||||||||||||||||||||||
| EBITDA | $ | 2,668 | $ | 2,533 | 5.3 | % | $ | 9,159 | $ | 6,535 | 40.2 | % |
*(a)*Represents total depreciation and amortization, including amounts classified within Depreciation and Amortization and within Cost of Sales.
| TARGET CORPORATION | | Q3 2021 Form 10-Q | 19 |
| MANAGEMENT'S DISCUSSION AND ANALYSIS | Table of Contents | |||||||
| RECONCILIATION OF NON-GAAP FINANCIAL MEASURES | Index to Notes |
We have also disclosed after-tax ROIC, which is a ratio based on GAAP information, with the exception of the add-back of operating lease interest to operating income. We believe this metric is useful in assessing the effectiveness of our capital allocation over time. Other companies may calculate ROIC differently, limiting the usefulness of the measure for comparisons with other companies.
| After-Tax Return on Invested Capital | ||||||||||||||||||||||||||
| (dollars in millions) | ||||||||||||||||||||||||||
| Trailing Twelve Months | ||||||||||||||||||||||||||
| Numerator | October 30, 2021 | October 31, 2020 | ||||||||||||||||||||||||
| Operating income | $ | 8,687 | $ | 5,901 | ||||||||||||||||||||||
| + Net other income / (expense) | 358 | (46) | ||||||||||||||||||||||||
| EBIT | 9,045 | 5,855 | ||||||||||||||||||||||||
| + Operating lease interest (a) | 85 | 87 | ||||||||||||||||||||||||
| - Income taxes (b) | 1,947 | 1,277 | ||||||||||||||||||||||||
| Net operating profit after taxes | $ | 7,183 | $ | 4,665 |
| Denominator | October 30, 2021 | October 31, 2020 | November 2, 2019 | |||||||||||||||||
| Current portion of long-term debt and other borrowings | $ | 1,176 | $ | 131 | $ | 1,159 | ||||||||||||||
| + Noncurrent portion of long-term debt | 11,586 | 12,490 | 10,513 | |||||||||||||||||
| + Shareholders' investment | 13,803 | 13,319 | 11,545 | |||||||||||||||||
| + Operating lease liabilities (c) | 2,737 | 2,400 | 2,390 | |||||||||||||||||
| - Cash and cash equivalents | 5,753 | 5,996 | 969 | |||||||||||||||||
| Invested capital | $ | 23,549 | $ | 22,344 | $ | 24,638 | ||||||||||||||
| Average invested capital (d) | $ | 22,947 | $ | 23,491 | ||||||||||||||||
| After-tax return on invested capital | 31.3 | % | 19.9 | % |
*(a)*Represents the add-back to operating income driven by the hypothetical interest expense we would incur if the property under our operating leases were owned or accounted for as finance leases. Calculated using the discount rate for each lease and recorded as a component of rent expense within SG&A. Operating lease interest is added back to operating income in the ROIC calculation to control for differences in capital structure between us and our competitors.
*(b)*Calculated using the effective tax rates, which were 21.3 percent and 21.5 percent for the trailing twelve months ended October 30, 2021, and October 31, 2020, respectively. For the trailing twelve months ended October 30, 2021, and October 31, 2020, includes tax effect of $1.9 billion and $1.3 billion, respectively, related to EBIT, and $18 million and $19 million, respectively, related to operating lease interest.
*(c)*Total short-term and long-term operating lease liabilities included within Accrued and Other Current Liabilities and Noncurrent Operating Lease Liabilities, respectively.
*(d)*Average based on the invested capital at the end of the current period and the invested capital at the end of the comparable prior period.
| TARGET CORPORATION | | Q3 2021 Form 10-Q | 20 |
| MANAGEMENT'S DISCUSSION AND ANALYSIS | Table of Contents | |||||||
| ANALYSIS OF FINANCIAL CONDITION | Index to Notes |
Analysis of Financial Condition
Liquidity and Capital Resources
Capital Allocation
We follow a disciplined and balanced approach to capital allocation based on the following priorities, ranked in order of importance: first, we fully invest in opportunities to profitably grow our business, create sustainable long-term value, and maintain our current operations and assets; second, we maintain a competitive quarterly dividend and seek to grow it annually; and finally, we return any excess cash to shareholders by repurchasing shares within the limits of our credit rating goals.
Our cash and cash equivalents balance was $5.8 billion, $8.5 billion, and $6.0 billion as of October 30, 2021, January 30, 2021, and October 31, 2020, respectively. Our cash and cash equivalents balance includes short-term investments of $4.8 billion, $7.6 billion, and $5.1 billion as of October 30, 2021, January 30, 2021, and October 31, 2020, respectively. Our investment policy is designed to preserve principal and liquidity of our short-term investments. This policy allows investments in large money market funds or in highly rated direct short-term instruments that mature in 60 days or less. We also place dollar limits on our investments in individual funds or instruments.
Operating Cash Flows
Cash flows provided by operating activities were $5.6 billion for the nine months ended October 30, 2021, compared with $7.0 billion for the nine months ended October 31, 2020. For the nine months ended October 30, 2021, operating cash flows reflect stronger operating results, offset by increased inventory investment and lower accounts payable leverage, compared with the nine months ended October 31, 2020. Additionally, operating cash flows for 2021 reflect a $1.1 billion increase in income tax payments.
Inventory
Inventory was $15.0 billion as of October 30, 2021, compared with $10.7 billion and $12.7 billion at January 30, 2021, and October 31, 2020, respectively. The increase over the balance as of October 31, 2020, reflects efforts to align inventory with sales trends.
Investing Cash Flows
Investing cash flows included capital investments of $2.5 billion and $2.0 billion for the nine months ended October 30, 2021, and October 31, 2020, respectively. For the nine months ended October 31, 2021, investing cash flows includes $356 million of proceeds from the sale of Dermstore.
Dividends
We paid dividends totaling $440 million ($0.90 per share) and $1.1 billion ($2.26 per share) for the three and nine months ended October 30, 2021, respectively, and $340 million ($0.68 per share) and $1.0 billion ($2.00 per share) for the three and nine months ended October 31, 2020, respectively, a per share increase of 32.4 percent and 13.0 percent, respectively. We declared dividends totaling $439 million ($0.90 per share) during the third quarter of 2021 and $346 million ($0.68 per share) during the third quarter of 2020, a per share increase of 32.4 percent. We have paid dividends every quarter since our 1967 initial public offering, and it is our intent to continue to do so in the future.
Share Repurchase
We returned $4.9 billion to shareholders through share repurchase during the nine months ended October 30, 2021. See Part II, Item 2, Unregistered Sales of Equity Securities and Use of Proceeds of this Quarterly Report on Form 10-Q and Note 9 to the Financial Statements for more information.
| TARGET CORPORATION | | Q3 2021 Form 10-Q | 21 |
| MANAGEMENT'S DISCUSSION AND ANALYSIS | Table of Contents | |||||||
| ANALYSIS OF FINANCIAL CONDITION | Index to Notes |
Financing
Our financing strategy is to ensure liquidity and access to capital markets, to maintain a balanced spectrum of debt maturities, and to manage our net exposure to floating interest rate volatility. Within these parameters, we seek to minimize our borrowing costs. Our ability to access the long-term debt and commercial paper markets has provided us with ample sources of liquidity. Our continued access to these markets depends on multiple factors, including the condition of debt capital markets, our operating performance, and maintaining strong credit ratings. As of October 30, 2021, our credit ratings were as follows:
| Credit Ratings | Moody’s | Standard and Poor’s | Fitch | ||||||||
| Long-term debt | A2 | A | A | ||||||||
| Commercial paper | P-1 | A-1 | F1 |
If our credit ratings were lowered, our ability to access the debt markets, our cost of funds, and other terms for new debt issuances could be adversely impacted. Each of the credit rating agencies reviews its rating periodically, and there is no guarantee our current credit ratings will remain the same as described above.
We obtain short-term financing from time to time under our commercial paper program. No balances were outstanding at any time during the nine months ended October 30, 2021, and October 31, 2020. In October 2021, we obtained a committed $3.0 billion unsecured revolving credit facility that will expire in October 2026. This new facility replaced our $2.5 billion unsecured revolving credit facility that was set to expire in October 2023. No balances were outstanding under either credit facility at any time during 2021 or 2020.
Most of our long-term debt obligations contain covenants related to secured debt levels. In addition to a secured debt level covenant, our credit facility also contains a debt leverage covenant. We are, and expect to remain, in compliance with these covenants. Additionally, as of October 30, 2021, no notes or debentures contained provisions requiring acceleration of payment upon a credit rating downgrade, except that certain outstanding notes allow the note holders to put the notes to us if within a matter of months of each other we experience both (i) a change in control and (ii) our long-term credit ratings are either reduced and the resulting rating is non-investment grade, or our long-term credit ratings are placed on watch for possible reduction and those ratings are subsequently reduced and the resulting rating is non-investment grade.
We believe our sources of liquidity will continue to be adequate to maintain operations, finance anticipated expansion and strategic initiatives, fund debt maturities, pay dividends, and execute purchases under our share repurchase program for the foreseeable future. We continue to anticipate ample access to commercial paper and long-term financing.
New Accounting Pronouncements
We do not expect any recently issued accounting pronouncements to have a material effect on our financial statements.
| TARGET CORPORATION | | Q3 2021 Form 10-Q | 22 |
| MANAGEMENT'S DISCUSSION AND ANALYSIS & SUPPLEMENTAL INFORMATION | Table of Contents | |||||||
| FORWARD LOOKING STATEMENTS & CONTROLS AND PROCEDURES | Index to Notes |
Forward-Looking Statements
This report contains forward-looking statements, which are based on our current assumptions and expectations. These statements are typically accompanied by the words “expect,” “may,” “could,” “believe,” “would,” “might,” “anticipates,” or similar words. The principal forward-looking statements in this report include: our financial performance, statements regarding the adequacy of and costs associated with our sources of liquidity, the funding of debt maturities, the continued execution of our share repurchase program, our expected capital expenditures and new lease commitments, the expected compliance with debt covenants, the expected impact of new accounting pronouncements, our intentions regarding future dividends, the expected return on plan assets, the expected outcome of, and adequacy of our reserves for, claims, litigation and the resolution of tax matters, the expected impact of changes in information technology systems, future responses to and effects of the COVID-19 pandemic, and changes in our assumptions and expectations.
All such forward-looking statements are intended to enjoy the protection of the safe harbor for forward-looking statements contained in the Private Securities Litigation Reform Act of 1995, as amended. Although we believe there is a reasonable basis for the forward-looking statements, our actual results could be materially different. The most important factors which could cause our actual results to differ from our forward-looking statements are set forth in our description of risk factors included in Part I, Item 1A, Risk Factors of our Form 10-K for the fiscal year ended January 30, 2021, which should be read in conjunction with the forward-looking statements in this report. Forward-looking statements speak only as of the date they are made, and we do not undertake any obligation to update any forward-looking statement.
Item 3. Quantitative and Qualitative Disclosures About Market Risk
There have been no material changes in our primary risk exposures or management of market risks from those disclosed in Part II, Item 7A, Quantitative and Qualitative Disclosures About Market Risk of our Form 10-K for the fiscal year ended January 30, 2021.
Item 4. Controls and Procedures
Changes in Internal Control Over Financial Reporting
During the most recently completed fiscal quarter, the following changes materially affected, or are reasonably likely to materially affect, our internal control over financial reporting:
- We are in the process of a broad multi-year migration of many mainframe-based systems and middleware products to a modern platform, including systems and processes supporting inventory, sales, and supply chain-related transactions.
During the most recently completed fiscal quarter, no other changes in our internal control over financial reporting materially affected, or are reasonably likely to materially affect, our internal control over financial reporting.
Evaluation of Disclosure Controls and Procedures
As of the end of the period covered by this quarterly report, we conducted an evaluation, under supervision and with the participation of management, including the chief executive officer and chief financial officer, of the effectiveness of the design and operation of our disclosure controls and procedures pursuant to Rules 13a-15 and 15d-15 of the Securities Exchange Act of 1934, as amended (Exchange Act). Based upon that evaluation, our chief executive officer and chief financial officer concluded that our disclosure controls and procedures are effective at a reasonable assurance level. Disclosure controls and procedures are defined by Rules 13a-15(e) and 15d-15(e) of the Exchange Act as controls and other procedures that are designed to ensure that information required to be disclosed by us in reports filed with the SEC under the Exchange Act is recorded, processed, summarized, and reported within the time periods specified in the SEC’s rules and forms. Disclosure controls and procedures include, without limitation, controls and procedures designed to ensure that information required to be disclosed by us in reports filed under the Exchange Act is accumulated and communicated to our management, including our principal executive and principal financial officers, or persons performing similar functions, as appropriate, to allow timely decisions regarding required disclosure.
| TARGET CORPORATION | | Q3 2021 Form 10-Q | 23 |
| SUPPLEMENTAL INFORMATION | Table of Contents | |||||||
| Index to Notes |
PART II. OTHER INFORMATION
Item 1. Legal Proceedings
No response is required under Item 103 of Regulation S-K, nor have there been any material developments for any previously reported legal proceedings.
Item 1A. Risk Factors
There have been no material changes to the risk factors described in Part I, Item 1A, Risk Factors of our Form 10-K for the fiscal year ended January 30, 2021.
Item 2. Unregistered Sales of Equity Securities and Use of Proceeds
On September 19, 2019, our Board of Directors authorized a $5 billion share repurchase program (2019 Program). On August 11, 2021, our Board of Directors authorized a new, $15 billion share repurchase program with no stated expiration (2021 Program). We began repurchasing shares under the 2021 Program during the third quarter of 2021 upon completion of the 2019 Program. Under the 2019 Program, we repurchased 24.5 million shares of common stock at an average price of $203.82, for a total investment of $5.0 billion. Under the 2021 Program, we repurchased 1.6 million shares of common stock at an average price of $235.22, for a total investment of $368 million. The table below presents information with respect to Target common stock purchases made during the three months ended October 30, 2021, by Target or any "affiliated purchaser" of Target, as defined in Rule 10b-18(a)(3) under the Exchange Act.
| Share Repurchase Activity | Total Number of Shares Purchased | Average Price Paid per Share | Total Number of Shares Purchased as Part of Publicly Announced Programs | Dollar Value of Shares that May Yet Be Purchased Under Publicly Announced Programs | ||||||||||||||||||||||
| Period | ||||||||||||||||||||||||||
| August 1, 2021 through August 28, 2021 | ||||||||||||||||||||||||||
| Open market and privately negotiated purchases | 2,952,200 | $ | 255.68 | 2,952,200 | $ | 16,061,054,829 | ||||||||||||||||||||
| August 29, 2021 through October 2, 2021 | ||||||||||||||||||||||||||
| Open market and privately negotiated purchases | 4,380,548 | 244.84 | 4,380,548 | 14,988,537,728 | ||||||||||||||||||||||
| October 3, 2021 through October 30, 2021 | ||||||||||||||||||||||||||
| Open market and privately negotiated purchases | 1,517,041 | 235.18 | 1,517,041 | 14,631,757,193 | ||||||||||||||||||||||
| Total | 8,849,789 | $ | 246.80 | 8,849,789 | $ | 14,631,757,193 |
Item 3. Defaults Upon Senior Securities
Not applicable.
Item 4. Mine Safety Disclosures
Not applicable.
Item 5. Other Information
Not applicable.
| TARGET CORPORATION | | Q3 2021 Form 10-Q | 24 |
| SUPPLEMENTAL INFORMATION | Table of Contents | |||||||
| Index to Notes |
Item 6. Exhibits
(1) Incorporated by reference to Exhibit (3)A to the Registrant’s Form 8-K Report filed June 10, 2010.
(2) Incorporated by reference to Exhibit (3)B to the Registrant’s Form 8-K Report filed April 2, 2020.
| TARGET CORPORATION | | Q3 2021 Form 10-Q | 25 |
| SUPPLEMENTAL INFORMATION | Table of Contents | |||||||
| Index to Notes |
SIGNATURE
Pursuant to the requirements of the Securities Exchange Act of 1934, the registrant has duly caused this report to be signed on its behalf by the undersigned thereunto duly authorized.
| TARGET CORPORATION | |||||||||||
| Dated: November 24, 2021 | By: | /s/ Michael J. Fiddelke | |||||||||
| Michael J. Fiddelke | |||||||||||
| Executive Vice President and | |||||||||||
| Chief Financial Officer | |||||||||||
| (Duly Authorized Officer and | |||||||||||
| Principal Financial Officer) | |||||||||||
| /s/ Robert M. Harrison | |||||||||||
| Robert M. Harrison | |||||||||||
| Senior Vice President, Chief Accounting Officer | |||||||||||
| and Controller | |||||||||||
| TARGET CORPORATION | | Q3 2021 Form 10-Q | 26 |