 filings.tools
Item 2. Management’s Discussion and Analysis of Financial Condition and Results of Operations
42K characters. Original on sec.gov ·
Item 2. Management’s Discussion and Analysis of Financial Condition and Results of Operations
Financial Summary
First quarter 2023 included the following notable items:
-
GAAP and Adjusted diluted earnings per share were $2.05.
-
Total revenue was $25.3 billion, an increase of 0.6 percent, reflecting total sales growth of 0.5 percent and a 10.2 percent increase in other revenue.
-
Comparable sales were flat, reflecting a 0.9 percent increase in traffic and a (0.9) percent decrease in average transaction amount.
*◦*Comparable stores originated sales grew 0.7 percent.
*◦*Comparable digitally originated sales declined (3.4) percent.
- Operating income of $1.3 billion was (1.4) percent lower than the comparable prior-year period. See Business Environment below for additional information.
Cash flow provided by operating activities was $1.3 billion for the three months ended April 29, 2023, compared with $(1.4) billion cash flow required for operating activities for the three months ended April 30, 2022. The drivers of the operating cash flow increase are described on page 20.
| Earnings Per Share | Three Months Ended | ||||||||||||||||||||||||||||||||||
| April 29, 2023 | April 30, 2022 | Change | |||||||||||||||||||||||||||||||||
| GAAP diluted earnings per share | $ | 2.05 | $ | 2.16 | (4.8) | % | |||||||||||||||||||||||||||||
| Adjustments | — | 0.03 | |||||||||||||||||||||||||||||||||
| Adjusted diluted earnings per share | $ | 2.05 | $ | 2.19 | (6.2) | % |
Note: Adjusted diluted earnings per share (Adjusted EPS), a non-GAAP metric, excludes the impact of certain items. Management believes that Adjusted EPS is useful in providing period-to-period comparisons of the results of our operations. A reconciliation of non-GAAP financial measures to GAAP measures is provided on page 18.
We report after-tax return on invested capital (ROIC) because we believe ROIC provides a meaningful measure of our capital allocation effectiveness over time. For the trailing twelve months ended April 29, 2023, after-tax ROIC was 11.4 percent, compared with 25.3 percent for the trailing twelve months ended April 30, 2022. The calculation of ROIC is provided on page 19.
Business Environment
During the first quarter of 2023, sales growth in our Frequency categories (Beauty & Household Essentials and Food & Beverage) was offset by decreases in our Discretionary categories (Apparel & Accessories, Hardlines, and Home Furnishings & Decor). Inventory as of April 29, 2023 decreased compared with January 28, 2023 and April 30, 2022. This decrease was driven by actions we took during 2022 and strategies we employed to align inventories with sales trends, as well as improvements in the supply chain that reduced in-transit inventory. These improvements have resulted in a reduction in costs related to managing elevated inventory levels and reduced our working capital investment. In addition, we experienced a significant decrease in freight costs due to a decline in freight rates compared to 2022.
We continue to experience higher inventory shrink, as a percentage of sales, relative to historical levels — including significantly higher shrink rates at certain stores. We believe that this trend is pervasive across the retail industry. Increased shrink has had, and if current trends persist will continue to have, an adverse impact on our results of operations, including potential impairment of our long-lived assets.
The Gross Margin Rate analysis on page 16 and the Inventory section on page 20 provide additional information.
| TARGET CORPORATION |  | Q1 2023 Form 10-Q | 13 |
| MANAGEMENT'S DISCUSSION AND ANALYSIS | Table of Contents | |||||||
| ANALYSIS OF RESULTS OF OPERATIONS |
Analysis of Results of Operations
| Summary of Operating Income | Three Months Ended | ||||||||||||||||||||||||||||||||||
| (dollars in millions) | April 29, 2023 | April 30, 2022 | Change | ||||||||||||||||||||||||||||||||
| Sales | $ | 24,948 | $ | 24,830 | 0.5 | % | |||||||||||||||||||||||||||||
| Other revenue | 374 | 340 | 10.2 | ||||||||||||||||||||||||||||||||
| Total revenue | 25,322 | 25,170 | 0.6 | ||||||||||||||||||||||||||||||||
| Cost of sales | 18,386 | 18,461 | (0.4) | ||||||||||||||||||||||||||||||||
| Selling, general and administrative expenses | 5,025 | 4,762 | 5.5 | ||||||||||||||||||||||||||||||||
| Depreciation and amortization (exclusive of depreciation included in cost of sales) | 583 | 601 | (3.0) | ||||||||||||||||||||||||||||||||
| Operating income | $ | 1,328 | $ | 1,346 | (1.4) | % |
| Rate Analysis | Three Months Ended | ||||||||||||||||||||||
| April 29, 2023 | April 30, 2022 | ||||||||||||||||||||||
| Gross margin rate | 26.3 | % | 25.7 | % | |||||||||||||||||||
| SG&A expense rate | 19.8 | 18.9 | |||||||||||||||||||||
| Depreciation and amortization expense rate (exclusive of depreciation included in cost of sales) | 2.3 | 2.4 | |||||||||||||||||||||
| Operating income margin rate | 5.2 | 5.3 |
Note: Gross margin rate is calculated as gross margin (sales less cost of sales) divided by sales. All other rates are calculated by dividing the applicable amount by total revenue.
Sales
Sales include all merchandise sales, net of expected returns, and our estimate of gift card breakage. We use comparable sales to evaluate the performance of our stores and digital channel sales by measuring the change in sales for a period over the comparable prior-year period of equivalent length. Comparable sales include all sales, except sales from stores open less than 13 months, digital acquisitions we have owned less than 13 months, stores that have been closed, and digital acquisitions that we no longer operate. Comparable sales measures vary across the retail industry. As a result, our comparable sales calculation is not necessarily comparable to similarly titled measures reported by other companies. Digitally originated sales include all sales initiated through mobile applications and our websites. Our stores fulfill the majority of digitally originated sales, including shipment from stores to guests, store Order Pickup or Drive Up, and delivery via Shipt. Digitally originated sales may also be fulfilled through our distribution centers, our vendors, or other third parties.
Sales growth—from both comparable sales and new stores—represents an important driver of our long-term profitability. We expect that comparable sales growth will drive the majority of our total sales growth. We believe that our ability to successfully differentiate our guests’ shopping experience through a careful combination of merchandise assortment, price, convenience, guest experience, and other factors will, over the long-term, drive both increasing shopping frequency (number of transactions, or "traffic") and the amount spent each visit (average transaction amount).
| Comparable Sales | Three Months Ended | ||||||||||||||||||||||
| April 29, 2023 | April 30, 2022 | ||||||||||||||||||||||
| Comparable sales change | 0.0 | % | 3.3 | % | |||||||||||||||||||
| Drivers of change in comparable sales | |||||||||||||||||||||||
| Number of transactions (traffic) | 0.9 | 3.9 | |||||||||||||||||||||
| Average transaction amount | (0.9) | (0.6) | |||||||||||||||||||||
| TARGET CORPORATION | | Q1 2023 Form 10-Q | 14 |
| MANAGEMENT'S DISCUSSION AND ANALYSIS | Table of Contents | |||||||
| ANALYSIS OF RESULTS OF OPERATIONS |
| Comparable Sales by Channel | Three Months Ended | ||||||||||||||||||||||
| April 29, 2023 | April 30, 2022 | ||||||||||||||||||||||
| Stores originated comparable sales change | 0.7 | % | 3.4 | % | |||||||||||||||||||
| Digitally originated comparable sales change | (3.4) | 3.2 |
| Sales by Channel | Three Months Ended | ||||||||||||||||||||||
| April 29, 2023 | April 30, 2022 | ||||||||||||||||||||||
| Stores originated | 82.5 | % | 81.8 | % | |||||||||||||||||||
| Digitally originated | 17.5 | 18.2 | |||||||||||||||||||||
| Total | 100 | % | 100 | % |
| Sales by Fulfillment Channel | Three Months Ended | ||||||||||||||||||||||
| April 29, 2023 | April 30, 2022 | ||||||||||||||||||||||
| Stores | 97.2 | % | 96.5 | % | |||||||||||||||||||
| Other | 2.8 | 3.5 | |||||||||||||||||||||
| Total | 100 | % | 100 | % |
Note: Sales fulfilled by stores include in-store purchases and digitally originated sales fulfilled by shipping merchandise from stores to guests, Order Pickup, Drive Up, and Shipt.
| Sales by Product Category | Three Months Ended | ||||||||||||||||||||||
| April 29, 2023 | April 30, 2022 | ||||||||||||||||||||||
| Apparel & accessories | 16 | % | 17 | % | |||||||||||||||||||
| Beauty & household essentials | 31 | 29 | |||||||||||||||||||||
| Food & beverage | 24 | 22 | |||||||||||||||||||||
| Hardlines | 14 | 15 | |||||||||||||||||||||
| Home furnishings & décor | 15 | 17 | |||||||||||||||||||||
| Total | 100 | % | 100 | % |
Note 2 to the Financial Statements provides additional product category sales information. The collective interaction of a broad array of macroeconomic, competitive, and consumer behavioral factors, as well as sales mix and the transfer of sales to new stores, makes further analysis of sales metrics infeasible.
We monitor the percentage of purchases that are paid for using RedCards (RedCard Penetration) because our internal analysis has indicated that a meaningful portion of the incremental purchases on RedCards are also incremental sales for Target. Guests receive a 5 percent discount on virtually all purchases when they use a RedCard at Target. For the three months ended April 29, 2023 and April 30, 2022, total RedCard Penetration was 19.0 percent and 20.3 percent, respectively.
| TARGET CORPORATION | | Q1 2023 Form 10-Q | 15 |
| MANAGEMENT'S DISCUSSION AND ANALYSIS | Table of Contents | |||||||
| ANALYSIS OF RESULTS OF OPERATIONS |
Gross Margin Rate
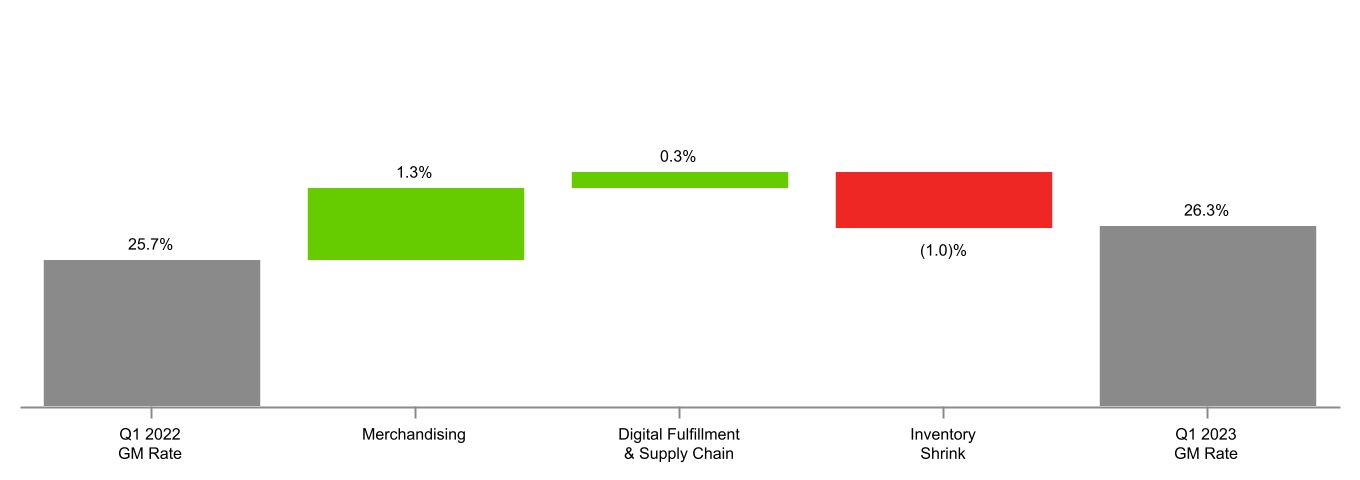
For the three months ended April 29, 2023, our gross margin rate was 26.3 percent compared with 25.7 percent in the comparable prior-year period. The increase reflected the net impact of
- merchandising benefit, including
◦lower freight costs;
◦retail price increases; and
◦lower clearance markdown rates compared with the prior-year, which included the impact of inventory impairments and other actions;
-
lower digital fulfillment costs due to a decrease in digital volume and a beneficial mix of sales fulfilled through lower-cost same-day fulfillment options; and
-
higher inventory shrink.
Business Environment on page 13 provides additional information.
Selling, General, and Administrative Expense Rate
For the three months ended April 29, 2023, our SG&A expense rate was 19.8 percent compared with 18.9 percent for the comparable prior-year period. The increase reflected the net impact of cost increases across our business, including investments in team member pay and benefits.
Store Data
| Change in Number of Stores | Three Months Ended | ||||||||||||||||||||||
| April 29, 2023 | April 30, 2022 | ||||||||||||||||||||||
| Beginning store count | 1,948 | 1,926 | |||||||||||||||||||||
| Opened | 6 | 7 | |||||||||||||||||||||
| Closed | — | — | |||||||||||||||||||||
| Ending store count | 1,954 | 1,933 | |||||||||||||||||||||
| Number of Stores and | Number of Stores | Retail Square Feet (a) | |||||||||||||||||||||
| Retail Square Feet | April 29, 2023 | January 28, 2023 | April 30, 2022 | April 29, 2023 | January 28, 2023 | April 30, 2022 | |||||||||||||||||
| 170,000 or more sq. ft. | 274 | 274 | 274 | 48,985 | 48,985 | 49,071 | |||||||||||||||||
| 50,000 to 169,999 sq. ft. | 1,530 | 1,527 | 1,519 | 191,543 | 191,241 | 190,461 | |||||||||||||||||
| 49,999 or less sq. ft. | 150 | 147 | 140 | 4,465 | 4,358 | 4,147 | |||||||||||||||||
| Total | 1,954 | 1,948 | 1,933 | 244,993 | 244,584 | 243,679 |
*(a)*In thousands; reflects total square feet less office, supply chain facilities, and vacant space.
| TARGET CORPORATION | | Q1 2023 Form 10-Q | 16 |
| MANAGEMENT'S DISCUSSION AND ANALYSIS | Table of Contents | |||||||
| ANALYSIS OF RESULTS OF OPERATIONS |
Other Performance Factors
Net Interest Expense
Net interest expense was $147 million for the three months ended April 29, 2023 and $112 million for the three months ended April 30, 2022. The increase in net interest expense was primarily due to higher average debt levels in addition to higher floating interest rates for the three months ended April 29, 2023 compared with the prior-year period.
Provision for Income Taxes
Our effective income tax rate for the three months ended April 29, 2023 was 21.1 percent, compared with 19.2 percent in the comparable prior-year period. The increase reflects higher discrete tax benefits in the prior-year, primarily related to share-based compensation.
| TARGET CORPORATION | | Q1 2023 Form 10-Q | 17 |
| MANAGEMENT'S DISCUSSION AND ANALYSIS | Table of Contents | |||||||
| RECONCILIATION OF NON-GAAP FINANCIAL MEASURES | Index to Notes |
Reconciliation of Non-GAAP Financial Measures to GAAP Measures
To provide additional transparency, we have disclosed non-GAAP adjusted diluted earnings per share (Adjusted EPS). This metric excludes certain items presented below. We believe this information is useful in providing period-to-period comparisons of the results of our operations. This measure is not in accordance with, or an alternative to, U.S. GAAP. The most comparable GAAP measure is diluted earnings per share. Adjusted EPS should not be considered in isolation or as a substitution for analysis of our results as reported in accordance with GAAP. Other companies may calculate Adjusted EPS differently, limiting the usefulness of the measure for comparisons with other companies.
| Reconciliation of Non-GAAP Adjusted EPS | Three Months Ended | |||||||||||||||||||||||||||||||||||||
| April 29, 2023 | April 30, 2022 | |||||||||||||||||||||||||||||||||||||
| (millions, except per share data) | Pretax | Net of Tax | Per Share | Pretax | Net of Tax | Per Share | ||||||||||||||||||||||||||||||||
| GAAP diluted earnings per share | $ | 2.05 | $ | 2.16 | ||||||||||||||||||||||||||||||||||
| Adjustments | ||||||||||||||||||||||||||||||||||||||
| Other (a) | $ | — | $ | — | $ | — | $ | 20 | $ | 15 | $ | 0.03 | ||||||||||||||||||||||||||
| Adjusted diluted earnings per share | $ | 2.05 | $ | 2.19 |
*(a)*Other items unrelated to current period operations, none of which were individually significant.
Earnings before interest expense and income taxes (EBIT) and earnings before interest expense, income taxes, depreciation, and amortization (EBITDA) are non-GAAP financial measures. We believe these measures provide meaningful information about our operational efficiency compared with our competitors by excluding the impact of differences in tax jurisdictions and structures, debt levels, and, for EBITDA, capital investment. These measures are not in accordance with, or an alternative to, GAAP. The most comparable GAAP measure is net earnings. EBIT and EBITDA should not be considered in isolation or as a substitution for analysis of our results as reported in accordance with GAAP. Other companies may calculate EBIT and EBITDA differently, limiting the usefulness of the measures for comparisons with other companies.
| EBIT and EBITDA | Three Months Ended | |||||||||||||||||||||||||||||||||||||
| (dollars in millions) | April 29, 2023 | April 30, 2022 | Change | |||||||||||||||||||||||||||||||||||
| Net earnings | $ | 950 | $ | 1,009 | (5.8) | % | ||||||||||||||||||||||||||||||||
| + Provision for income taxes | 254 | 240 | 6.0 | |||||||||||||||||||||||||||||||||||
| + Net interest expense | 147 | 112 | 31.2 | |||||||||||||||||||||||||||||||||||
| EBIT | $ | 1,351 | $ | 1,361 | (0.7) | % | ||||||||||||||||||||||||||||||||
| + Total depreciation and amortization (a) | 667 | 679 | (1.8) | |||||||||||||||||||||||||||||||||||
| EBITDA | $ | 2,018 | $ | 2,040 | (1.1) | % |
*(a)*Represents total depreciation and amortization, including amounts classified within Depreciation and Amortization and within Cost of Sales.
| TARGET CORPORATION | | Q1 2023 Form 10-Q | 18 |
| MANAGEMENT'S DISCUSSION AND ANALYSIS | Table of Contents | |||||||
| RECONCILIATION OF NON-GAAP FINANCIAL MEASURES | Index to Notes |
We have also disclosed after-tax ROIC, which is a ratio based on GAAP information, with the exception of the add-back of operating lease interest to operating income. We believe this metric is useful in assessing the effectiveness of our capital allocation over time. Other companies may calculate ROIC differently, limiting the usefulness of the measure for comparisons with other companies.
| After-Tax Return on Invested Capital | ||||||||||||||||||||||||||
| (dollars in millions) | ||||||||||||||||||||||||||
| Trailing Twelve Months | ||||||||||||||||||||||||||
| Numerator | April 29, 2023 | April 30, 2022 | ||||||||||||||||||||||||
| Operating income | $ | 3,830 | $ | 7,918 | ||||||||||||||||||||||
| + Net other income | 57 | 55 | ||||||||||||||||||||||||
| EBIT | 3,887 | 7,973 | ||||||||||||||||||||||||
| + Operating lease interest (a) | 96 | 87 | ||||||||||||||||||||||||
| - Income taxes (b) | 770 | 1,804 | ||||||||||||||||||||||||
| Net operating profit after taxes | $ | 3,213 | $ | 6,256 |
| Denominator | April 29, 2023 | April 30, 2022 | May 1, 2021 | |||||||||||||||||
| Current portion of long-term debt and other borrowings | $ | 200 | $ | 1,089 | $ | 1,173 | ||||||||||||||
| + Noncurrent portion of long-term debt | 16,010 | 13,379 | 11,509 | |||||||||||||||||
| + Shareholders' investment | 11,605 | 10,774 | 14,959 | |||||||||||||||||
| + Operating lease liabilities (c) | 2,921 | 2,854 | 2,563 | |||||||||||||||||
| - Cash and cash equivalents | 1,321 | 1,112 | 7,816 | |||||||||||||||||
| Invested capital | $ | 29,415 | $ | 26,984 | $ | 22,388 | ||||||||||||||
| Average invested capital (d) | $ | 28,199 | $ | 24,686 | ||||||||||||||||
| After-tax return on invested capital | 11.4 | % | 25.3 | % |
*(a)*Represents the add-back to operating income driven by the hypothetical interest expense we would incur if the property under our operating leases were owned or accounted for as finance leases. Calculated using the discount rate for each lease and recorded as a component of rent expense within SG&A. Operating lease interest is added back to operating income in the ROIC calculation to control for differences in capital structure between us and our competitors.
*(b)*Calculated using the effective tax rates, which were 19.3 percent and 22.4 percent for the trailing twelve months ended April 29, 2023 and April 30, 2022, respectively. For the trailing twelve months ended April 29, 2023 and April 30, 2022, includes tax effect of $0.8 billion and $1.8 billion, respectively, related to EBIT and $18 million and $19 million, respectively, related to operating lease interest.
*(c)*Total short-term and long-term operating lease liabilities included within Accrued and Other Current Liabilities and Noncurrent Operating Lease Liabilities, respectively.
*(d)*Average based on the invested capital at the end of the current period and the invested capital at the end of the comparable prior period.
| TARGET CORPORATION | | Q1 2023 Form 10-Q | 19 |
| MANAGEMENT'S DISCUSSION AND ANALYSIS | Table of Contents | |||||||
| ANALYSIS OF FINANCIAL CONDITION | Index to Notes |
Analysis of Financial Condition
Liquidity and Capital Resources
Capital Allocation
We follow a disciplined and balanced approach to capital allocation based on the following priorities, ranked in order of importance: first, we fully invest in opportunities to profitably grow our business, create sustainable long-term value, and maintain our current operations and assets; second, we maintain a competitive quarterly dividend and seek to grow it annually; and finally, we return any excess cash to shareholders by repurchasing shares within the limits of our credit rating goals.
Our cash and cash equivalents balance was $1.3 billion, $2.2 billion, and $1.1 billion as of April 29, 2023, January 28, 2023, and April 30, 2022, respectively. Our cash and cash equivalents balance included short-term investments of $408 million, $1.3 billion, and $182 million as of April 29, 2023, January 28, 2023, and April 30, 2022, respectively. Our investment policy is designed to preserve principal and liquidity of our short-term investments. This policy allows investments in large money market funds or in highly rated direct short-term instruments that mature in 60 days or less. We also place dollar limits on our investments in individual funds or instruments.
Operating Cash Flows
Cash flows provided by operating activities were $1.3 billion for the three months ended April 29, 2023, compared with $(1.4) billion of cash flows required for operating activities for the three months ended April 30, 2022. For the three months ended April 29, 2023, operating cash flows increased as a result of an improvement in working capital, including lower inventory levels, compared with the three months ended April 30, 2022.
Inventory
Inventory was $12.6 billion as of April 29, 2023, compared with $13.5 billion and $15.1 billion at January 28, 2023 and April 30, 2022, respectively. The decrease over the balance as of April 30, 2022 primarily reflects actions taken to align inventory levels with sales trends, as well as improvements in the supply chain that reduced in-transit inventory.
The Business Environment section on page 13 provides additional information.
Investing Cash Flows
Investing cash flows included capital investments of $1.6 billion and $1.0 billion for the three months ended April 29, 2023 and April 30, 2022, respectively. The increase primarily reflects real estate acquisitions for new store and supply chain sites and timing of remodel activity.
Dividends
We paid dividends totaling $497 million ($1.08 per share) for the three months ended April 29, 2023, and $424 million ($0.90 per share) for the three months ended April 30, 2022, a per share increase of 20.0 percent. We declared dividends totaling $507 million ($1.08 per share) during the first quarter of 2023 and $426 million ($0.90 per share) during the first quarter of 2022, a per share increase of 20.0 percent. We have paid dividends every quarter since our 1967 initial public offering, and it is our intent to continue to do so in the future.
Share Repurchase
We did not repurchase any shares during the three months ended April 29, 2023. See Part II, Item 2, Unregistered Sales of Equity Securities and Use of Proceeds of this Quarterly Report on Form 10-Q and Note 7 to the Financial Statements for more information.
| TARGET CORPORATION | | Q1 2023 Form 10-Q | 20 |
| MANAGEMENT'S DISCUSSION AND ANALYSIS | Table of Contents | |||||||
| ANALYSIS OF FINANCIAL CONDITION | Index to Notes |
Financing
Our financing strategy is to ensure liquidity and access to capital markets, to maintain a balanced spectrum of debt maturities, and to manage our net exposure to floating interest rate volatility. Within these parameters, we seek to minimize our borrowing costs. Our ability to access the long-term debt and commercial paper markets has provided us with ample sources of liquidity. Our continued access to these markets depends on multiple factors, including the condition of debt capital markets, our operating performance, and maintaining strong credit ratings. As of April 29, 2023, our credit ratings were as follows:
| Credit Ratings | Moody’s | Standard and Poor’s | Fitch | ||||||||
| Long-term debt | A2 | A | A | ||||||||
| Commercial paper | P-1 | A-1 | F1 |
If our credit ratings were lowered, our ability to access the debt markets, our cost of funds, and other terms for new debt issuances could be adversely impacted. Each of the credit rating agencies reviews its rating periodically, and there is no guarantee our current credit ratings will remain the same as described above.
We have the ability to obtain short-term financing from time to time under our commercial paper program and credit facilities. Our committed $1.0 billion 364-day and $3.0 billion unsecured revolving credit facilities that will expire in October 2023 and October 2027, respectively, backstop our commercial paper program. No balances were outstanding under either credit facility at any time during 2023 or 2022. We had $90 million and $945 million outstanding under our commercial paper program as of April 29, 2023 and April 30, 2022, respectively. Note 5 to the Financial Statements provides additional information.
Most of our long-term debt obligations contain covenants related to secured debt levels. In addition to a secured debt level covenant, our credit facilities also contain a debt leverage covenant. We are, and expect to remain, in compliance with these covenants. Additionally, as of April 29, 2023, no notes or debentures contained provisions requiring acceleration of payment upon a credit rating downgrade, except that certain outstanding notes allow the note holders to put the notes to us if within a matter of months of each other we experience both (i) a change in control and (ii) our long-term credit ratings are either reduced and the resulting rating is non-investment grade, or our long-term credit ratings are placed on watch for possible reduction and those ratings are subsequently reduced and the resulting rating is non-investment grade.
We believe our sources of liquidity, namely operating cash flows, credit facility capacity, and access to capital markets, will continue to be adequate to meet our contractual obligations, working capital and planned capital expenditures, finance anticipated expansion and strategic initiatives, fund debt maturities, pay dividends, and execute purchases under our share repurchase program for the foreseeable future.
New Accounting Pronouncements
We do not expect any recently issued accounting pronouncements to have a material effect on our financial statements.
| TARGET CORPORATION | | Q1 2023 Form 10-Q | 21 |
| MANAGEMENT'S DISCUSSION AND ANALYSIS & SUPPLEMENTAL INFORMATION | Table of Contents | |||||||
| FORWARD LOOKING STATEMENTS & CONTROLS AND PROCEDURES | Index to Notes |
Forward-Looking Statements
This report contains forward-looking statements, which are based on our current assumptions and expectations. These statements are typically accompanied by the words “expect,” “may,” “could,” “believe,” “would,” “might,” “anticipates,” or similar words. The principal forward-looking statements in this report include: our financial performance, statements regarding the adequacy of and costs associated with our sources of liquidity, the funding of debt maturities, the execution of our share repurchase program, our expected capital expenditures and new lease commitments, the expected compliance with debt covenants, the expected impact of new accounting pronouncements, our intentions regarding future dividends, the expected return on plan assets, the expected outcome of, and adequacy of our reserves for, claims, litigation, and the resolution of tax matters, and changes in our assumptions and expectations.
All such forward-looking statements are intended to enjoy the protection of the safe harbor for forward-looking statements contained in the Private Securities Litigation Reform Act of 1995, as amended. Although we believe there is a reasonable basis for the forward-looking statements, our actual results could be materially different. The most important factors which could cause our actual results to differ from our forward-looking statements are set forth in our description of risk factors included in Part I, Item 1A, Risk Factors of our Form 10-K for the fiscal year ended January 28, 2023, which should be read in conjunction with the forward-looking statements in this report. Forward-looking statements speak only as of the date they are made, and we do not undertake any obligation to update any forward-looking statement.
Previous: Item 1. Financial Statements · Next: Item 3. Quantitative and Qualitative Disclosures About Market Risk