 filings.tools
Item 5. Market for Registrant’s Common Equity, Related Security Holder Matters and Issuer Purchases of Equity Securities.
6K characters. Original on sec.gov · Markdown
Item 5. Market for Registrant’s Common Equity, Related Security Holder Matters and Issuer Purchases of Equity Securities.
Market Information
Our Common Stock is traded on the NYSE under the ticker symbol “TPL.” The Company had 200 registered holders of its Common Stock as of February 14, 2024.
Dividends
For the year ended December 31, 2023 and 2022, the Company paid the following regular and special cash dividends per share:
| Years Ended December 31, | |||||||||||||||||||||||
| 2023 | 2022 | ||||||||||||||||||||||
| Regular | Special | Regular | Special | ||||||||||||||||||||
| 1st Quarter | $ | 3.25 | $ | — | $ | 3.00 | $ | — | |||||||||||||||
| 2nd Quarter | 3.25 | — | 3.00 | 20.00 | |||||||||||||||||||
| 3rd Quarter | 3.25 | — | 3.00 | — | |||||||||||||||||||
| 4th Quarter | 3.25 | — | 3.00 | — | |||||||||||||||||||
| Total | $ | 13.00 | $ | — | $ | 12.00 | $ | 20.00 |
The Company has paid a cash dividend each year for the preceding 67 years.
The Board has determined to pay dividends on a quarterly basis in March, June, September and December of each year, subject to the discretion of the Board. Such dividends will depend upon the Company’s earnings, capital requirements and financial position, applicable requirements of law, general economic conditions and other factors considered relevant by the Board. The Company is not a party to any agreement that would limit its ability to pay dividends in the future.
Issuer Purchases of Common Stock
During the three months ended December 31, 2023, the Company repurchased shares of its Common Stock as follows:
| Period | Total Number of Shares Purchased | Average Price Paid per Share | Total Number of Shares Purchased as Part of Publicly Announced Plans or Programs | Maximum Number (or Approximate Dollar Value) of Shares that May Yet Be Purchased Under the Plans or Programs**(1)** | ||||||||||||||||||||||
| October 1 through October 31, 2023 | 1,181 | $ | 1,847 | 1,181 | ||||||||||||||||||||||
| November 1 through November 30, 2023 | 1,228 | 1,693 | 1,228 | |||||||||||||||||||||||
| December 1 through December 31, 2023 | 3,844 | 1,557 | 3,844 | |||||||||||||||||||||||
| Total | 6,253 | $ | 1,639 | 6,253 | $ | 207,583,010 |
*(1)*On November 1, 2022, our Board approved a stock repurchase program to purchase up to an aggregate of $250 million of our outstanding Common Stock effective beginning January 1, 2023. The Company intends to purchase stock under the repurchase program opportunistically with funds generated by cash from operations. This repurchase program may be suspended from time to time, modified, extended or discontinued by the Board at any time. Purchases under the stock repurchase program may be made through a combination of open market repurchases in compliance with Rule 10b-18 promulgated under the Securities Exchange Act of 1934, as amended, privately negotiated transactions, and/or other transactions at the Company’s discretion, including under a Rule 10b5-1 trading plan implemented by the Company, and will be subject to market conditions, applicable legal requirements and other factors.
Performance Graph
The following graph compares the cumulative total return from January 11, 2021 (the date of our Corporate Reorganization) through December 31, 2023 of TPL common stock; the SPDR® S&P® Oil & Gas Exploration & Production ETF (“XOP”), which includes TPL; and the Reference Group. The graph assumes that $100 was invested at the beginning of the period and that all dividends were reinvested for each TPL, the XOP, and the Reference Group.
The Reference Group consists of the companies referenced in Item 11 “Executive Compensation” in this Annual Report on Form 10-K.
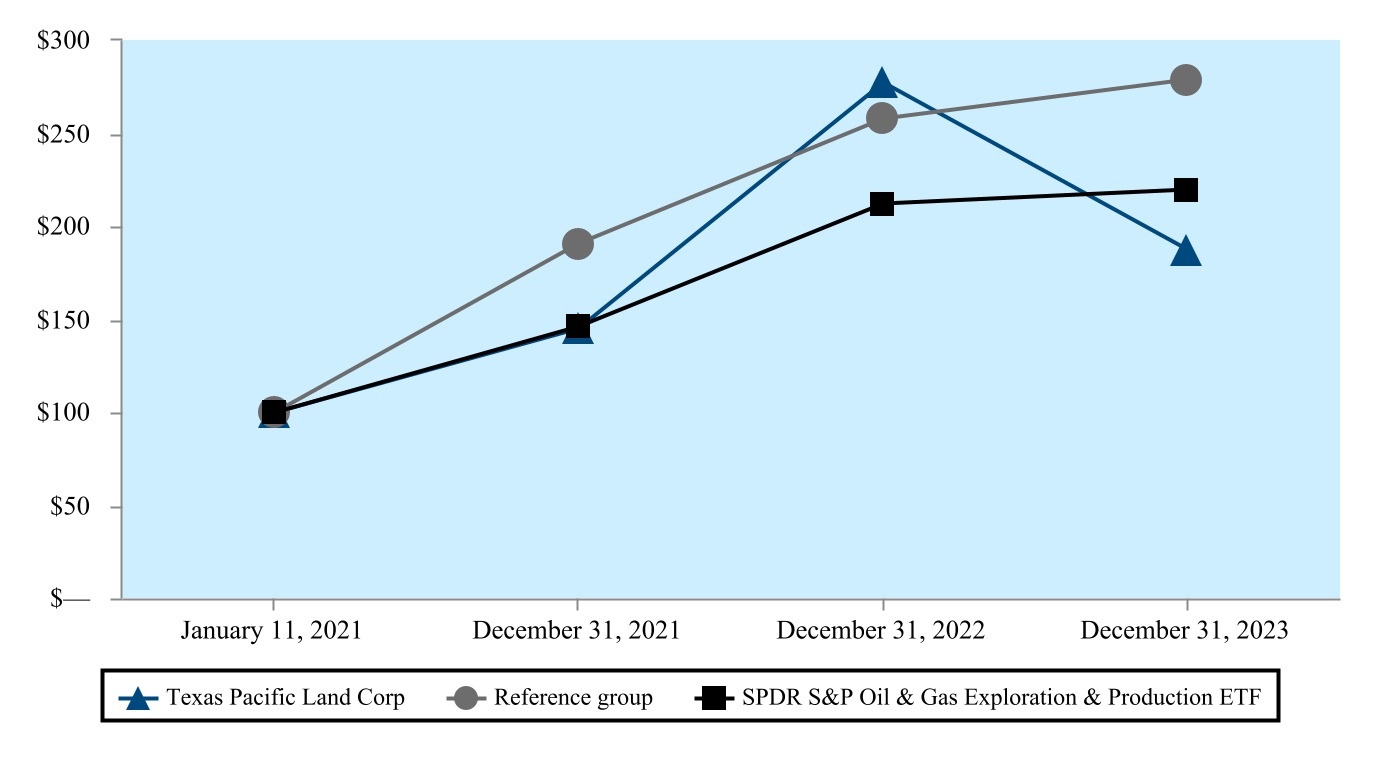
| January 11, 2021 | December 31, 2021 | December 31, 2022 | December 31, 2023 | |||||||||||||||||||||||||||||||||||
| Texas Pacific Land Corporation | $100 | $145 | $277 | $187 | ||||||||||||||||||||||||||||||||||
| Reference Group | $100 | $190 | $258 | $279 | ||||||||||||||||||||||||||||||||||
| SPDR S&P Oil & Gas Exploration & Production ETF | $100 | $146 | $212 | $220 |
The information contained in the graph above is furnished and therefore not to be considered “filed” with the SEC, and is not incorporated by reference into any document that incorporates this Annual Report on Form 10-K by reference.
Previous: Item 4. Mine Safety Disclosures. · Next: Item 6. Reserved.