 filings.tools
Item 1. Financial Statements.
259K characters. Original on sec.gov · Markdown
Item 1. Financial Statements.
TARGA RESOURCES CORP.
CONSOLIDATED BALANCE SHEETS
| December 31, 2019 | December 31, 2018 | |||||||
|---|---|---|---|---|---|---|---|---|
| (In millions) | ||||||||
| ASSETS | ||||||||
| Current assets: | ||||||||
| Cash and cash equivalents | $ | 331.1 | $ | 232.1 | ||||
| Trade receivables, net of allowances of $0.0 and $0.1 million at December 31, 2019 and December 31, 2018 | 855.0 | 865.5 | ||||||
| Inventories | 161.5 | 164.7 | ||||||
| Assets from risk management activities | 103.3 | 115.3 | ||||||
| Other current assets | 69.7 | 41.3 | ||||||
| Held for sale assets (see Note 4) | 137.7 | — | ||||||
| Total current assets | 1,658.3 | 1,418.9 | ||||||
| Property, plant and equipment | 19,876.8 | 17,220.7 | ||||||
| Accumulated depreciation and amortization | (5,328.3 | ) | (4,292.3 | ) | ||||
| Property, plant and equipment, net | 14,548.5 | 12,928.4 | ||||||
| Intangible assets, net | 1,735.0 | 1,983.2 | ||||||
| Goodwill, net | 45.2 | 46.6 | ||||||
| Long-term assets from risk management activities | 35.5 | 34.1 | ||||||
| Investments in unconsolidated affiliates | 738.7 | 490.5 | ||||||
| Other long-term assets | 53.9 | 36.5 | ||||||
| Total assets | $ | 18,815.1 | $ | 16,938.2 | ||||
| LIABILITIES, SERIES A PREFERRED STOCK AND OWNERS' EQUITY | ||||||||
| Current liabilities: | ||||||||
| Accounts payable and accrued liabilities | $ | 1,379.9 | $ | 1,737.3 | ||||
| Liabilities from risk management activities | 104.1 | 33.6 | ||||||
| Current debt obligations | 382.2 | 1,027.9 | ||||||
| Held for sale liabilities (see Note 4) | 6.4 | — | ||||||
| Total current liabilities | 1,872.6 | 2,798.8 | ||||||
| Long-term debt | 7,440.2 | 5,632.4 | ||||||
| Long-term liabilities from risk management activities | 40.8 | 3.1 | ||||||
| Deferred income taxes, net | 434.2 | 525.2 | ||||||
| Other long-term liabilities | 305.6 | 262.2 | ||||||
| Contingencies (see Note 21) | ||||||||
| Series A Preferred 9.5% Stock, $1,000 per share liquidation preference, (1,200,000 shares authorized, 965,100 shares issued and outstanding), net of discount (see Note 13) | 278.8 | 245.7 | ||||||
| Owners' equity: | ||||||||
| Targa Resources Corp. stockholders' equity: | ||||||||
| Common stock ($0.001 par value, 300,000,000 shares authorized) | 0.2 | 0.2 | ||||||
| Issued Outstanding | ||||||||
| December 31, 2019 233,852,810 232,843,526 | ||||||||
| December 31, 2018 232,964,765 231,790,530 | ||||||||
| Preferred stock ($0.001 par value, after designation of Series A Preferred Stock: 98,800,000 shares authorized, no shares issued and outstanding) | — | — | ||||||
| Additional paid-in capital | 5,221.2 | 6,154.9 | ||||||
| Retained earnings (deficit) | (339.6 | ) | (130.4 | ) | ||||
| Accumulated other comprehensive income (loss) | 92.5 | 94.3 | ||||||
| Treasury stock, at cost (1,009,284 shares as of December 31, 2019 and 665,753 shares as of December 31, 2018) | (53.5 | ) | (39.6 | ) | ||||
| Total Targa Resources Corp. stockholders' equity | 4,920.8 | 6,079.4 | ||||||
| Noncontrolling interests | 3,522.1 | 1,391.4 | ||||||
| Total owners' equity | 8,442.9 | 7,470.8 | ||||||
| Total liabilities, Series A Preferred Stock and owners' equity | $ | 18,815.1 | $ | 16,938.2 |
See notes to consolidated financial statements.
F-5
TARGA RESOURCES CORP.
CONSOLIDATED STATEMENTS OF OPERATIONS
| Year Ended December 31, | ||||||||||||
|---|---|---|---|---|---|---|---|---|---|---|---|---|
| 2019 | 2018 | 2017 | ||||||||||
| (In millions, except per share amounts) | ||||||||||||
| Revenues: | ||||||||||||
| Sales of commodities | $ | 7,393.8 | $ | 9,278.7 | $ | 7,751.1 | ||||||
| Fees from midstream services | 1,277.3 | 1,205.3 | 1,063.8 | |||||||||
| Total revenues | 8,671.1 | 10,484.0 | 8,814.9 | |||||||||
| Costs and expenses: | ||||||||||||
| Product purchases | 6,118.5 | 8,238.2 | 6,906.1 | |||||||||
| Operating expenses | 792.9 | 722.0 | 622.9 | |||||||||
| Depreciation and amortization expense | 971.6 | 815.9 | 809.5 | |||||||||
| General and administrative expense | 280.7 | 256.9 | 203.4 | |||||||||
| Impairment of property, plant and equipment | 243.2 | — | 378.0 | |||||||||
| Impairment of goodwill | — | 210.0 | — | |||||||||
| Other operating (income) expense | 71.3 | 3.5 | 17.4 | |||||||||
| Income (loss) from operations | 192.9 | 237.5 | (122.4 | ) | ||||||||
| Other income (expense): | ||||||||||||
| Interest expense, net | (337.8 | ) | (185.8 | ) | (233.7 | ) | ||||||
| Equity earnings (loss) | 39.0 | 7.3 | (17.0 | ) | ||||||||
| Gain (loss) from financing activities | (1.4 | ) | (2.0 | ) | (16.8 | ) | ||||||
| Gain (loss) from sale of equity-method investment | 69.3 | — | — | |||||||||
| Change in contingent considerations | (8.7 | ) | 8.8 | 99.6 | ||||||||
| Other, net | — | 0.1 | (2.6 | ) | ||||||||
| Income (loss) before income taxes | (46.7 | ) | 65.9 | (292.9 | ) | |||||||
| Income tax (expense) benefit | 87.9 | (5.5 | ) | 397.1 | ||||||||
| Net income (loss) | 41.2 | 60.4 | 104.2 | |||||||||
| Less: Net income (loss) attributable to noncontrolling interests | 250.4 | 58.8 | 50.2 | |||||||||
| Net income (loss) attributable to Targa Resources Corp. | (209.2 | ) | 1.6 | 54.0 | ||||||||
| Dividends on Series A Preferred Stock | 91.7 | 91.7 | 91.7 | |||||||||
| Deemed dividends on Series A Preferred Stock | 33.1 | 29.2 | 25.7 | |||||||||
| Net income (loss) attributable to common shareholders | $ | (334.0 | ) | $ | (119.3 | ) | $ | (63.4 | ) | |||
| Net income (loss) per common share - basic | $ | (1.44 | ) | $ | (0.53 | ) | $ | (0.31 | ) | |||
| Net income (loss) per common share - diluted | $ | (1.44 | ) | $ | (0.53 | ) | $ | (0.31 | ) | |||
| Weighted average shares outstanding - basic | 232.5 | 224.2 | 206.9 | |||||||||
| Weighted average shares outstanding - diluted | 232.5 | 224.2 | 206.9 |
See notes to consolidated financial statements.
F-6
TARGA RESOURCES CORP.
CONSOLIDATED STATEMENTS OF COMPREHENSIVE INCOME (LOSS)
| Year Ended December 31, | ||||||||||||||||||||||||||||||||||||
|---|---|---|---|---|---|---|---|---|---|---|---|---|---|---|---|---|---|---|---|---|---|---|---|---|---|---|---|---|---|---|---|---|---|---|---|---|
| 2019 | 2018 | 2017 | ||||||||||||||||||||||||||||||||||
| Pre-Tax | Related Income Tax | After Tax | Pre-Tax | Related Income Tax | After Tax | Pre-Tax | Related Income Tax | After Tax | ||||||||||||||||||||||||||||
| (In millions) | ||||||||||||||||||||||||||||||||||||
| Net income (loss) | $ | 41.2 | $ | 60.4 | $ | 104.2 | ||||||||||||||||||||||||||||||
| Other comprehensive income (loss): | ||||||||||||||||||||||||||||||||||||
| Commodity hedging contracts: | ||||||||||||||||||||||||||||||||||||
| Change in fair value | $ | 135.6 | $ | (32.3 | ) | 103.3 | $ | 132.5 | $ | (32.2 | ) | 100.3 | $ | (28.8 | ) | $ | 13.5 | (15.3 | ) | |||||||||||||||||
| Settlements reclassified to revenues | (138.0 | ) | 32.9 | (105.1 | ) | 38.4 | (9.3 | ) | 29.1 | 44.6 | (20.9 | ) | 23.7 | |||||||||||||||||||||||
| Other comprehensive income (loss) | (2.4 | ) | 0.6 | (1.8 | ) | 170.9 | (41.5 | ) | 129.4 | 15.8 | (7.4 | ) | 8.4 | |||||||||||||||||||||||
| Comprehensive income (loss) | 39.4 | 189.8 | 112.6 | |||||||||||||||||||||||||||||||||
| Less: Comprehensive income (loss) attributable to noncontrolling interests | 250.4 | 58.8 | 50.2 | |||||||||||||||||||||||||||||||||
| Comprehensive income (loss) attributable to Targa Resources Corp. | $ | (211.0 | ) | $ | 131.0 | $ | 62.4 |
See notes to consolidated financial statements.
F-7
TARGA RESOURCES CORP.
CONSOLIDATED STATEMENTS OF CHANGES IN OWNERS' EQUITY AND SERIES A PREFERRED STOCK
| Retained | Accumulated | |||||||||||||||||||||||||||||||||||||||
|---|---|---|---|---|---|---|---|---|---|---|---|---|---|---|---|---|---|---|---|---|---|---|---|---|---|---|---|---|---|---|---|---|---|---|---|---|---|---|---|---|
| Additional | Earnings | Other | Treasury | Total | Series A | |||||||||||||||||||||||||||||||||||
| Common Stock | Paid in | (Accumulated | Comprehensive | Shares | Noncontrolling | Owner's | Preferred | |||||||||||||||||||||||||||||||||
| Shares | Amount | Capital | Deficit) | Income (Loss) | Shares | Amount | Interests | Equity | Stock | |||||||||||||||||||||||||||||||
| (In millions, except shares in thousands) | ||||||||||||||||||||||||||||||||||||||||
| Balance, December 31, 2016 | 184,721 | $ | 0.2 | $ | 5,506.2 | $ | (187.3 | ) | $ | (38.3 | ) | 514 | $ | (32.2 | ) | $ | 475.8 | $ | 5,724.4 | $ | 190.8 | |||||||||||||||||||
| Impact of accounting standard adoption | — | — | — | 56.1 | — | — | — | — | 56.1 | — | ||||||||||||||||||||||||||||||
| Compensation on equity grants | — | — | 42.3 | — | — | — | — | — | 42.3 | — | ||||||||||||||||||||||||||||||
| Distribution equivalent rights | — | — | (9.7 | ) | — | — | — | — | — | (9.7 | ) | — | ||||||||||||||||||||||||||||
| Shares issued under compensation program | 285 | — | — | — | — | — | — | — | — | — | ||||||||||||||||||||||||||||||
| Shares and units tendered for tax withholding obligations | (72 | ) | — | — | — | — | 72 | (3.4 | ) | — | (3.4 | ) | — | |||||||||||||||||||||||||||
| Issuance of common stock | 32,633 | — | 1,644.4 | — | — | — | — | — | 1,644.4 | — | ||||||||||||||||||||||||||||||
| Series A Preferred Stock dividends | ||||||||||||||||||||||||||||||||||||||||
| Dividends - $95.00 per share | — | — | — | (91.7 | ) | — | — | — | — | (91.7 | ) | — | ||||||||||||||||||||||||||||
| Dividends in excess of retained earnings | — | — | (91.7 | ) | 91.7 | — | — | — | — | — | — | |||||||||||||||||||||||||||||
| Deemed dividends - accretion of beneficial conversion feature | — | — | (25.7 | ) | — | — | — | — | — | (25.7 | ) | 25.7 | ||||||||||||||||||||||||||||
| Common stock dividends | ||||||||||||||||||||||||||||||||||||||||
| Dividends - $3.64 per share | — | — | — | (749.4 | ) | — | — | — | — | (749.4 | ) | — | ||||||||||||||||||||||||||||
| Dividends in excess of retained earnings | — | — | (749.4 | ) | 749.4 | — | — | — | — | — | — | |||||||||||||||||||||||||||||
| Distributions to noncontrolling interests | — | — | — | — | — | — | — | (59.4 | ) | (59.4 | ) | — | ||||||||||||||||||||||||||||
| Contributions from noncontrolling interests | — | — | — | — | — | — | — | 141.6 | 141.6 | — | ||||||||||||||||||||||||||||||
| Purchase of noncontrolling interests in subsidiary | — | — | (13.6 | ) | — | — | — | — | (12.5 | ) | (26.1 | ) | — | |||||||||||||||||||||||||||
| Other comprehensive income (loss) | — | — | — | — | 8.4 | — | — | — | 8.4 | — | ||||||||||||||||||||||||||||||
| Net income (loss) | — | — | — | 54.0 | — | — | — | 50.2 | 104.2 | — | ||||||||||||||||||||||||||||||
| Balance, December 31, 2017 | 217,567 | $ | 0.2 | $ | 6,302.8 | $ | (77.2 | ) | $ | (29.9 | ) | 586 | $ | (35.6 | ) | $ | 595.7 | $ | 6,756.0 | $ | 216.5 | |||||||||||||||||||
| Impact of accounting standard adoption | — | — | — | 5.2 | (5.2 | ) | — | — | — | — | — | |||||||||||||||||||||||||||||
| Compensation on equity grants | — | — | 56.3 | — | — | — | — | — | 56.3 | — | ||||||||||||||||||||||||||||||
| Distribution equivalent rights | — | — | (13.7 | ) | — | — | — | — | — | (13.7 | ) | — | ||||||||||||||||||||||||||||
| Shares issued under compensation program | 401 | — | — | — | — | — | — | — | — | — | ||||||||||||||||||||||||||||||
| Shares and units tendered for tax withholding obligations | (80 | ) | — | — | — | — | 80 | (4.0 | ) | — | (4.0 | ) | — | |||||||||||||||||||||||||||
| Issuance of common stock | 13,844 | — | 683.5 | — | — | — | — | — | 683.5 | — | ||||||||||||||||||||||||||||||
| Exercise of warrants - shares settled | 59 | — | — | — | — | — | — | — | — | — | ||||||||||||||||||||||||||||||
| Series A Preferred Stock dividends | ||||||||||||||||||||||||||||||||||||||||
| Dividends - $95.00 per share | — | — | — | (91.7 | ) | — | — | — | — | (91.7 | ) | — | ||||||||||||||||||||||||||||
| Dividends in excess of retained earnings | — | — | (31.7 | ) | 31.7 | — | — | — | — | — | — | |||||||||||||||||||||||||||||
| Deemed dividends - accretion of beneficial conversion feature | — | — | (29.2 | ) | — | — | — | — | — | (29.2 | ) | 29.2 | ||||||||||||||||||||||||||||
| Common stock dividends | ||||||||||||||||||||||||||||||||||||||||
| Dividends - $3.64 per share | — | — | — | (813.1 | ) | — | — | — | — | (813.1 | ) | — | ||||||||||||||||||||||||||||
| Dividends in excess of retained earnings | — | — | (813.1 | ) | 813.1 | — | — | — | — | — | — | |||||||||||||||||||||||||||||
| Distributions to noncontrolling interests | — | — | — | — | — | — | — | (82.0 | ) | (82.0 | ) | — | ||||||||||||||||||||||||||||
| Contributions from noncontrolling interests | — | — | — | — | — | — | — | 817.9 | 817.9 | — | ||||||||||||||||||||||||||||||
| Acquisition of related party | — | — | — | — | — | — | — | 1.1 | 1.1 | — | ||||||||||||||||||||||||||||||
| Purchase of noncontrolling interests in subsidiary | — | — | — | — | — | — | — | (0.1 | ) | (0.1 | ) | — | ||||||||||||||||||||||||||||
| Other comprehensive income (loss) | — | — | — | — | 129.4 | — | — | — | 129.4 | — | ||||||||||||||||||||||||||||||
| Net income (loss) | — | — | — | 1.6 | — | — | — | 58.8 | 60.4 | — | ||||||||||||||||||||||||||||||
| Balance, December 31, 2018 | 231,791 | $ | 0.2 | $ | 6,154.9 | $ | (130.4 | ) | $ | 94.3 | 666 | $ | (39.6 | ) | $ | 1,391.4 | $ | 7,470.8 | $ | 245.7 |
F-8
TARGA RESOURCES CORP.
CONSOLIDATED STATEMENTS OF CHANGES IN OWNERS' EQUITY AND SERIES A PREFERRED STOCK
| Retained | Accumulated | |||||||||||||||||||||||||||||||||||||||
|---|---|---|---|---|---|---|---|---|---|---|---|---|---|---|---|---|---|---|---|---|---|---|---|---|---|---|---|---|---|---|---|---|---|---|---|---|---|---|---|---|
| Additional | Earnings | Other | Treasury | Total | Series A | |||||||||||||||||||||||||||||||||||
| Common Stock | Paid in | (Accumulated | Comprehensive | Shares | Noncontrolling | Owner's | Preferred | |||||||||||||||||||||||||||||||||
| Shares | Amount | Capital | Deficit) | Income (Loss) | Shares | Amount | Interests | Equity | Stock | |||||||||||||||||||||||||||||||
| (In millions, except shares in thousands) | ||||||||||||||||||||||||||||||||||||||||
| Balance, December 31, 2018 | 231,791 | $ | 0.2 | $ | 6,154.9 | $ | (130.4 | ) | $ | 94.3 | 666 | $ | (39.6 | ) | $ | 1,391.4 | $ | 7,470.8 | $ | 245.7 | ||||||||||||||||||||
| Compensation on equity grants | — | — | 60.3 | — | — | — | — | — | 60.3 | — | ||||||||||||||||||||||||||||||
| Distribution equivalent rights | — | — | (14.2 | ) | — | — | — | — | — | (14.2 | ) | — | ||||||||||||||||||||||||||||
| Shares issued under compensation program | 1,397 | — | — | — | — | — | — | — | — | — | ||||||||||||||||||||||||||||||
| Shares and units tendered for tax withholding obligations | (344 | ) | — | — | — | — | 344 | (13.9 | ) | — | (13.9 | ) | — | |||||||||||||||||||||||||||
| Series A Preferred Stock dividends | ||||||||||||||||||||||||||||||||||||||||
| Dividends - $95.00 per share | — | — | — | (91.7 | ) | — | — | — | — | (91.7 | ) | — | ||||||||||||||||||||||||||||
| Dividends in excess of retained earnings | — | — | (91.7 | ) | 91.7 | — | — | — | — | — | — | |||||||||||||||||||||||||||||
| Deemed dividends - accretion of beneficial conversion feature | — | — | (33.1 | ) | — | — | — | — | — | (33.1 | ) | 33.1 | ||||||||||||||||||||||||||||
| Common stock dividends | ||||||||||||||||||||||||||||||||||||||||
| Dividends - $3.64 per share | — | — | — | (846.8 | ) | — | — | — | — | (846.8 | ) | — | ||||||||||||||||||||||||||||
| Dividends in excess of retained earnings | — | — | (846.8 | ) | 846.8 | — | — | — | — | — | — | |||||||||||||||||||||||||||||
| Distributions to noncontrolling interests | — | — | — | — | — | — | — | (294.7 | ) | (294.7 | ) | — | ||||||||||||||||||||||||||||
| Contributions from noncontrolling interests | — | — | — | — | — | — | — | 555.3 | 555.3 | — | ||||||||||||||||||||||||||||||
| Sale of ownership interest in subsidiaries, net | — | — | (8.2 | ) | — | — | — | — | 1,619.7 | 1,611.5 | — | |||||||||||||||||||||||||||||
| Other comprehensive income (loss) | — | — | — | — | (1.8 | ) | — | — | — | (1.8 | ) | — | ||||||||||||||||||||||||||||
| Net income (loss) | — | — | — | (209.2 | ) | — | — | — | 250.4 | 41.2 | — | |||||||||||||||||||||||||||||
| Balance, December 31, 2019 | 232,844 | $ | 0.2 | $ | 5,221.2 | $ | (339.6 | ) | $ | 92.5 | 1,010 | $ | (53.5 | ) | $ | 3,522.1 | $ | 8,442.9 | $ | 278.8 |
See notes to consolidated financial statements.
F-9
TARGA RESOURCES CORP.
CONSOLIDATED STATEMENTS OF CASH FLOWS
| Year Ended December 31, | ||||||||||||
|---|---|---|---|---|---|---|---|---|---|---|---|---|
| 2019 | 2018 | 2017 | ||||||||||
| (In millions) | ||||||||||||
| Cash flows from operating activities | ||||||||||||
| Net income (loss) | $ | 41.2 | $ | 60.4 | $ | 104.2 | ||||||
| Adjustments to reconcile net income (loss) to net cash provided by operating activities: | - | - | ||||||||||
| Amortization in interest expense | 10.3 | 10.8 | 11.5 | |||||||||
| Compensation on equity grants | 60.3 | 56.3 | 42.3 | |||||||||
| Depreciation and amortization expense | 971.6 | 815.9 | 809.5 | |||||||||
| Impairment of property, plant and equipment | 243.2 | — | 378.0 | |||||||||
| Impairment of goodwill | — | 210.0 | — | |||||||||
| Accretion of asset retirement obligations | 4.7 | 3.7 | 3.9 | |||||||||
| Increase (decrease) in redemption value of mandatorily redeemable preferred interests | — | (72.1 | ) | 3.3 | ||||||||
| Deferred income tax expense (benefit) | (87.9 | ) | 5.5 | (392.7 | ) | |||||||
| Equity (earnings) loss of unconsolidated affiliates | (39.0 | ) | (7.3 | ) | 17.0 | |||||||
| Distributions of earnings received from unconsolidated affiliates | 49.6 | 20.8 | 12.5 | |||||||||
| Risk management activities | 112.8 | 9.8 | 10.0 | |||||||||
| (Gain) loss on sale or disposition of business and assets | 71.1 | (0.1 | ) | 15.9 | ||||||||
| (Gain) loss from financing activities | 1.4 | 2.0 | 16.8 | |||||||||
| (Gain) loss from sale of equity-method investment | (69.3 | ) | — | — | ||||||||
| Change in contingent considerations | 8.7 | (8.8 | ) | (99.6 | ) | |||||||
| Changes in operating assets and liabilities, net of business acquisitions: | ||||||||||||
| Receivables and other assets | (24.7 | ) | (6.2 | ) | (20.1 | ) | ||||||
| Inventories | (45.0 | ) | (13.9 | ) | (73.2 | ) | ||||||
| Accounts payable and other liabilities | 80.8 | 57.2 | 100.2 | |||||||||
| Net cash provided by operating activities | 1,389.8 | 1,144.0 | 939.5 | |||||||||
| Cash flows from investing activities | ||||||||||||
| Outlays for property, plant and equipment | (2,877.8 | ) | (3,114.8 | ) | (1,297.5 | ) | ||||||
| Outlays for business acquisition, net of cash acquired | — | — | (570.8 | ) | ||||||||
| Proceeds from sale of business and assets | 14.8 | 256.9 | 2.7 | |||||||||
| Investments in unconsolidated affiliates | (266.8 | ) | (282.0 | ) | (9.5 | ) | ||||||
| Proceeds from sale of equity-method investment | 70.3 | — | — | |||||||||
| Return of capital from unconsolidated affiliates | 3.5 | 5.5 | 0.2 | |||||||||
| Other, net | (15.9 | ) | (12.5 | ) | (17.8 | ) | ||||||
| Net cash used in investing activities | (3,071.9 | ) | (3,146.9 | ) | (1,892.7 | ) | ||||||
| Cash flows from financing activities | ||||||||||||
| Debt obligations: | ||||||||||||
| Proceeds from borrowings under credit facilities | 3,100.0 | 2,235.0 | 2,701.0 | |||||||||
| Repayments of credit facilities | (3,800.0 | ) | (1,555.0 | ) | (2,671.0 | ) | ||||||
| Proceeds from borrowings under accounts receivable securitization facility | 944.2 | 546.6 | 666.6 | |||||||||
| Repayments of accounts receivable securitization facility | (854.2 | ) | (616.6 | ) | (591.6 | ) | ||||||
| Proceeds from issuance of senior notes and term loan | 2,500.0 | 1,000.0 | 750.0 | |||||||||
| Redemption of senior notes and term loan | (749.4 | ) | — | (698.1 | ) | |||||||
| Principal payments of finance leases | (11.5 | ) | — | — | ||||||||
| Proceeds from issuance of common stock | — | 689.0 | 1,660.4 | |||||||||
| Costs incurred in connection with financing arrangements | (35.5 | ) | (24.7 | ) | (23.5 | ) | ||||||
| Payment of contingent consideration | (317.1 | ) | — | — | ||||||||
| Repurchase of shares and units under compensation plans | (13.9 | ) | (4.0 | ) | (3.4 | ) | ||||||
| Sale of ownership interests in subsidiaries | 1,619.7 | — | — | |||||||||
| Purchase of noncontrolling interests in subsidiary | — | (0.1 | ) | (12.5 | ) | |||||||
| Contributions from noncontrolling interests | 555.3 | 817.9 | 141.6 | |||||||||
| Distributions to noncontrolling interests | (191.7 | ) | (70.7 | ) | (48.1 | ) | ||||||
| Distributions to Partnership unitholders | (11.3 | ) | (11.3 | ) | (11.3 | ) | ||||||
| Dividends paid to common and Series A preferred shareholders | (953.5 | ) | (908.3 | ) | (843.2 | ) | ||||||
| Net cash provided by financing activities | 1,781.1 | 2,097.8 | 1,016.9 | |||||||||
| Net change in cash and cash equivalents | 99.0 | 94.9 | 63.7 | |||||||||
| Cash and cash equivalents, beginning of period | 232.1 | 137.2 | 73.5 | |||||||||
| Cash and cash equivalents, end of period | $ | 331.1 | $ | 232.1 | $ | 137.2 |
See notes to consolidated financial statements.
F-10
TARGA RESOURCES CORP.
NOTES TO CONSOLIDATED FINANCIAL STATEMENTS
Except as noted within the context of each footnote disclosure, the dollar amounts presented in the tabular data within these footnote disclosures are stated in millions of dollars.
Note 1 — Organization and Operations
Our Organization
Targa Resources Corp. (“TRC”) is a publicly traded Delaware corporation formed in October 2005. Our common stock is listed on the New York Stock Exchange under the symbol “TRGP.” In this Annual Report, unless the context requires otherwise, references to “we,” “us,” “our,” “the Company” or “Targa” are intended to mean our consolidated business and operations. TRC is the parent company of Targa Resources Partners LP, referred to herein as the “Partnership” or “TRP.”
Our Operations
The Company is primarily engaged in the business of:
| • | gathering, compressing, treating, processing, transporting and selling natural gas; |
|---|
| • | transporting, storing, fractionating, treating and selling NGLs and NGL products, including services to LPG exporters; and |
|---|
| • | gathering, storing, terminaling and selling crude oil. |
|---|
See Note 28 – Segment Information for certain financial information regarding our business segments.
Note 2 — Basis of Presentation
These accompanying financial statements and related notes present our consolidated financial position as of December 31, 2019 and 2018, and the results of operations, comprehensive income, cash flows, and changes in owners’ equity for the years ended December 31, 2019, 2018 and 2017.
We have prepared these consolidated financial statements in accordance with GAAP. All significant intercompany balances and transactions have been eliminated in consolidation. Certain amounts in prior periods may have been reclassified to conform to the current year presentation.
Note 3 — Significant Accounting Policies
Consolidation Policy
Our consolidated financial statements include the accounts of all entities that we control and our proportionate interest in the accounts of certain gas gathering and processing facilities in which we own an undivided interest and are responsible for our proportionate share of the costs and expenses of the facilities. Third party ownership interests in our controlled subsidiaries are presented as noncontrolling interests within the equity section of our Consolidated Balance Sheets. In our Consolidated Statements of Operations and Consolidated Statements of Comprehensive Income, noncontrolling interests reflects the attribution of results to third-party investors. All intercompany balances and transactions have been eliminated in consolidation.
We apply the equity method of accounting to investments over which we exercise significant influence over the operating and financial policies of our investee, but do not exercise control. We evaluate our equity investments for impairment when evidence indicates the carrying amount of our investment is no longer recoverable. Evidence of a loss in value might include, but would not necessarily be limited to, absence of an ability to recover the carrying amount of the investment or inability of the equity method investee to sustain an earnings capacity that would justify the carrying amount of the investment. When the estimated fair value of an equity investment is less than its carrying value and the loss in value is determined to be other than temporary, we recognize the excess of the carrying value over the estimated fair value as an impairment loss within equity earnings (loss) in our Consolidated Statements of Operations.
F-11
Use of Estimates
The preparation of financial statements in conformity with GAAP requires management to make estimates and assumptions that affect the amounts reported in these financial statements and accompanying notes. Estimates and judgments are based on information available at the time such estimates and judgments are made. Changes in facts and circumstances may result in revised estimates and actual results could differ materially from those estimates. Estimates and judgments are used in, among other things, (1) estimating unbilled revenues, product purchases and operating and general and administrative cost accruals, (2) developing fair value assumptions, including estimates of future cash flows and discount rates, (3) analyzing long-lived assets for possible impairment, (4) estimating the useful lives of assets, (5) estimating contingencies, guarantees and indemnifications and (6) estimating redemption value of mandatorily redeemable preferred interests.
Cash and Cash Equivalents
Cash and cash equivalents include all cash on hand, demand deposits, and short-term, highly liquid investments that are readily convertible into cash, and have original maturities of three months or less.
Allowance for Doubtful Accounts
Estimated losses on accounts receivable are provided through an allowance for doubtful accounts. In evaluating the adequacy of the allowance, we make judgments regarding each party’s ability and history of making required payments, economic events and other factors. We assess the need for adjustments to our allowance when the financial condition of any party changes or additional information becomes available.
Inventories
Our inventories consist primarily of NGL product inventories, which are valued at the lower of cost or net realizable value, using the average cost method. Most NGL product inventories turn over monthly, but some inventory, primarily propane, is acquired and held during the year to meet anticipated heating season requirements of our customers. Commodity inventories that are not physically or contractually available for sale under normal operations (“deadstock”) are included in Property, Plant and Equipment.
Product Exchanges
Exchanges of NGL products are executed to satisfy timing and logistical needs of the exchange parties. Volumes received and delivered under exchange agreements are recorded as inventory. If the locations of receipt and delivery are in different markets, an exchange differential may be billed or owed. The exchange differential is recorded as either accounts receivable or accrued liabilities.
Gas Processing Imbalances
Quantities of natural gas and/or NGLs over-delivered or under-delivered, related to certain gas plant operational balancing agreements, are recorded monthly as inventory or as a payable using the weighted average price at the time the imbalance was created. Inventory imbalances receivable are valued at the lower of cost or net realizable value using the average cost method; inventory imbalances payable are valued at replacement cost. These imbalances are settled either by current cash-out settlements or by adjusting future receipts or deliveries of natural gas or NGLs.
Derivative Instruments
We utilize derivative instruments to manage the volatility of our cash flows due to fluctuating energy commodity prices. For balance sheet classification purposes, we analyze the fair values of the derivative instruments on a contract by contract basis and report the related fair values and any related collateral by counterparty on a gross basis. Cash flows from derivative instruments designated as hedges are recognized in the same financial statement line item as the cash flows from the respective item being hedged.
We formally document all relationships between hedging instruments and hedged items, as well as its risk management objectives and strategy for undertaking the hedge. This documentation includes the specific identification of the hedging instrument and the hedged item, the nature of the risk being hedged and the manner in which the hedging instrument’s effectiveness will be assessed. At the inception of the hedge and on an ongoing basis, we assess whether the derivatives used in hedging transactions are highly effective in achieving the offset of changes in cash flows attributable to the hedged risk.
We record all derivative instruments at fair value with the exception of those that we apply the normal purchases and normal sales election.
F-12
The table below summarizes the accounting treatment for our derivative instruments, and the impact on our consolidated financial statements:
| Recognition and Measurement | ||
| Derivative Treatment | Balance Sheet | Income Statement |
| Normal Purchases and Normal Sales | Fair value not recorded | Earnings recognized when volumes are physically delivered or received |
| Mark-to-Market | Recorded at fair value | Change in fair value recognized currently in earnings |
| Cash Flow Hedge | Recorded at fair value with changes in fair value deferred in Accumulated Other Comprehensive Income ("AOCI") | The gain/loss on the derivative instrument is reclassified out of AOCI into earnings when the forecasted transaction occurs |
We will discontinue hedge accounting on a prospective basis when a hedge instrument is terminated, ceases to be highly effective or the forecasted transaction is no longer probable to occur. Gains and losses deferred in AOCI related to cash flow hedges for which hedge accounting has been discontinued remain deferred until the forecasted transaction occurs. If it is probable that a hedged forecasted transaction will not occur, deferred gains or losses on the hedging instrument are reclassified to earnings immediately.
Property, Plant and Equipment
Property, plant and equipment is recorded at acquisition cost less accumulated depreciation. Depreciation is computed using the straight-line method over the estimated useful lives of the assets. The determination of the useful lives of property, plant and equipment requires us to make various assumptions, including our expected use of the asset and the supply of and demand for hydrocarbons in the markets served, normal wear and tear of the facilities, and the extent and frequency of maintenance programs. Upon disposition or retirement of property, plant and equipment, any gain or loss is recorded to operations.
Expenditures for routine maintenance and repairs are expensed as incurred. Expenditures to refurbish an asset that increases its existing service potential or prevents environmental contamination are capitalized and depreciated over the remaining useful life of the asset or major asset component. Certain costs directly related to the construction of assets, including internal labor costs, interest and engineering costs, are capitalized.
Impairment of Long-Lived Assets
We evaluate long-lived assets for impairment when events or changes in circumstances indicate our carrying amount of an asset may not be recoverable. Asset recoverability is measured by comparing the carrying value of the asset or asset group with its expected future pre-tax undiscounted cash flows. Individual assets are grouped at the lowest level for which the related identifiable cash flows are largely independent of the cash flows of other assets and liabilities. These cash flow estimates require us to make judgments and assumptions related to operating and cash flow results, economic obsolescence, the business climate, contractual, legal and other factors.
If the carrying amount exceeds the expected future undiscounted cash flows, we recognize an impairment equal to the excess of net book value over fair value as determined by quoted market prices in active markets or present value techniques if quotes are unavailable. The determination of the fair value using present value techniques requires us to make projections and assumptions regarding the probability of a range of outcomes and the rates of interest used in the present value calculations. Any changes we make to these projections and assumptions could result in significant revisions to our evaluation of recoverability of our long-lived assets and the recognition of additional impairments.
Goodwill
Goodwill is a residual intangible asset that results when the cost of an acquisition exceeds the fair value of the net identifiable assets of the acquired business. Goodwill is not subject to amortization but is tested for impairment at least annually. This test requires us to attribute goodwill to an appropriate reporting unit, which is an operating segment or one level below an operating segment (also known as a component). We evaluate goodwill for impairment on November 30 of each year, or whenever impairment indicators are present. Prior to us conducting the goodwill impairment test, we complete a review of the carrying values of our long-lived assets, including property, plant and equipment and other intangible assets. If it is determined that the carrying values are not recoverable, we reduce the carrying values of the long-lived assets pursuant to our policy on property, plant and equipment.
F-13
As part of our goodwill impairment test, we may first assess qualitative factors to determine if the quantitative goodwill impairment test is necessary. If we choose to bypass this qualitative assessment or determine that a goodwill impairment test is required, our annual goodwill impairment test is performed by comparing the fair value of a reporting unit with its carrying amount (including attributed goodwill). We recognize an impairment loss in our Consolidated Statements of Operations and a corresponding reduction of goodwill on our Consolidated Balance Sheets for the amount by which the carrying amount exceeds the reporting unit’s fair value. The goodwill impairment loss will not exceed the total amount of goodwill allocated to that reporting unit. Additionally, when measuring goodwill, we consider income tax effects from any tax deductible goodwill on the carrying amount of the reporting unit, if applicable.
Intangible Assets
Our intangible assets include producer dedications under long-term contracts and customer relationships associated with business and asset acquisitions. The fair value of these acquired intangible assets was determined at the date of acquisition based on the present value of estimated future cash flows. We amortize the costs of our assets in a manner that closely resembles the expected benefit pattern of the intangible assets or on a straight-line basis, where such pattern is not readily determinable, over the periods in which we benefit from services provided to customers.
Asset Retirement Obligations
Asset retirement obligations (“AROs”) are legal obligations associated with the retirement of tangible long-lived assets that result from their acquisition, construction, development and/or normal operation. We record a liability and increase the basis in the underlying asset for the present value of each expected asset retirement obligation (“ARO”) when there is a legal obligation to settle under existing or enacted law, statute, written or oral contract or by legal construction.
Our obligations are estimated based on discounted cash flow estimates. Over time, the ARO liability is accreted to its present value as a period cost and the capitalized amount is depreciated over the asset’s respective useful life. At least annually, we review the projected timing and amount of asset retirement obligations and reflect revisions as an increase or decrease in the carrying amount of the liability and the basis in the underlying asset. Upon settlement, we will recognize any difference between the recorded amount and the actual settlement cost as a gain or loss.
Debt Issuance Costs
Costs incurred in connection with the issuance of long-term debt and any original issue discount or premium are deferred and charged to interest expense over the term of the related debt. Debt issuance costs related to revolving credit facilities are presented as other long-term assets, and debt issuance costs related to long-term debt obligations with scheduled maturities are reflected as a deduction to the carrying amount of long-term debt on the Consolidated Balance Sheets. Gains or losses on debt repurchases, redemptions and debt extinguishments include any associated unamortized debt issuance costs.
Accounts Receivable Securitization Facility
Proceeds from the sale or contribution of certain receivables under the Partnership’s accounts receivable securitization facility (the “Securitization Facility”) are treated as collateralized borrowings in our financial statements. Proceeds and repayments under the Securitization Facility are reflected as cash flows from financing activities in our Consolidated Statements of Cash Flows.
Environmental Liabilities and Other Loss Contingencies
We accrue a liability for loss contingencies, including environmental remediation costs arising from claims, assessments, litigation, fines, penalties and other sources, when the loss is probable and reasonably estimable.
Income Taxes
We file many income tax returns with the United States Department of the Treasury, as well as numerous states. We are required to estimate our income taxes in each of the jurisdictions in which we operate. This process involves estimating our actual current tax payable and related tax expense, together with assessing temporary differences resulting from differing treatment of certain items, such as depreciation, for tax and accounting purposes. These differences can result in deferred tax assets and liabilities, which are reported on a net basis by jurisdiction within our Consolidated Balance Sheets. We report these timing differences based on statutory tax rates applicable to the scheduled timing difference reversal periods.
F-14
We assess the likelihood that we will recover our deferred tax assets from future taxable income. We establish a valuation allowance if we believe that it is more likely than not (a likelihood of more than 50 percent) that some portion or all of the deferred tax assets will not be realized. Any change in the valuation allowance would impact our income tax provision and net income in the period in which such a determination is made. We consider all available evidence to determine whether, based on the weight of the evidence, we need a valuation allowance. Evidence used includes information about our current financial position and our results of operations for the current and preceding years, as well as all currently available information about future years, including our anticipated future performance, the reversal of deferred tax liabilities and tax planning strategies.
Dividends
Preferred and Common dividends declared are recorded as a reduction of retained earnings to the extent that retained earnings was available at the close of the prior quarter, with any excess recorded as a reduction of additional paid-in capital.
Mandatorily Redeemable Preferred Interests
Mandatorily redeemable preferred interests are included in other long-term liabilities on our Consolidated Balance Sheets. Mandatorily redeemable preferred interests with multiple or indeterminate redemption dates are reported at their estimated redemption value as of the reporting date. This point-in-time value does not represent the amount that ultimately would be redeemed in the future. Changes in the redemption value are included in interest expense, net in our Consolidated Statements of Operations.
Comprehensive Income
Comprehensive income includes net income and other comprehensive income (“OCI”), which includes changes in the fair value of derivative instruments that are designated as cash flow hedges.
Revenue Recognition
Our operating revenues are primarily derived from the following activities:
| • | sales of natural gas, NGLs, condensate and crude oil; |
|---|
| • | services related to compressing, gathering, treating, and processing of natural gas; and |
|---|
| • | services related to NGL fractionation, terminaling and storage, transportation and treating. |
|---|
We have multiple types of contracts with commercial counterparties and many of these may result in cash inflows to Targa due to the structure of settlement provisions with embedded fees. The commercial relationship of the counterparty in such contracts is inherently one of a supplier, rather than a customer, and therefore, such contracts are excluded from the provisions of the revenue recognition guidance in Topic 606. Any cash inflows or fees that are realized on these supply type contracts are reported as a reduction of Product purchases.
Our revenues, therefore, are measured based on consideration specified in a contract with parties designated as customers. We recognize revenue when we satisfy a performance obligation by transferring control over a commodity or service to a customer. Sales and other taxes we collect, that are both imposed on and concurrent with revenue-producing activities, are excluded from revenues.
We generally report sales revenues on a gross basis in our Consolidated Statements of Operations, as we typically act as the principal in the transactions where we receive and control commodities. However, buy-sell transactions that involve purchases and sales of inventory with the same counterparty, which are legally contingent or in contemplation of one another, as well as other instances where we do not control the commodities, but rather are acting as an agent to the supplier, are reported as a single revenue transaction on a combined net basis.
Our commodity sales contracts typically contain multiple performance obligations, whereby each distinct unit of commodity to be transferred to the customer is a separate performance obligation. Under such contracts, revenue is recognized at the point in time each unit is transferred to the customer because the customer is able to direct the use of, and obtain substantially all of the remaining benefits from, the commodity at that time. In certain instances, it may be determinable that the customer receives and consumes the benefits of each unit as it is transferred. Under such contracts, we have a single performance obligation comprised of a series of distinct units of commodity; and in such instance, revenue is recognized over time using the units delivered output method, as each distinct unit is transferred to the customer. Our commodity sales contracts are typically priced at a market index, but may also be set at a fixed price. When our sales are priced at a market index, we apply the allocation exception for variable consideration and allocate the market price to each distinct unit when it is transferred to the customer. The fixed price in our commodity sales contracts generally represents the standalone selling price, and therefore, when each distinct unit is transferred to the customer, we recognize revenue at the fixed price.
F-15
Our service contracts typically contain a single performance obligation. The underlying activities performed by us are considered inputs to an integrated service and not separable because such activities in combination are required to successfully transfer the single overall service that the customer has contracted for and expects to receive. Therefore, the underlying activities in such contracts are not considered to be distinct services. However, in certain instances, the customer may contract for additional distinct services and therefore additional performance obligations may exist. In such instances, the transaction price is allocated to the multiple performance obligations based on their relative standalone selling prices. The performance obligation(s) in our service contracts is a series of distinct days of the applicable service over the life of the contract (fundamentally a stand-ready service), whereby we recognize revenue over time using an output method of progress based on the passage of time (i.e., each day of service). This output method is appropriate because it directly relates to the value of service transferred to the customer to date, relative to the remaining days of service promised under the contract.
The transaction price for our service contracts is typically comprised of variable consideration, which is primarily dependent on the volume and composition of the commodities delivered and serviced. The variable consideration is generally commensurate with our efforts to perform the service and the terms of the variable payments relate specifically to our efforts to satisfy each day of distinct service. Therefore, the variable consideration is typically not estimated at contract inception, but rather the allocation exception for variable consideration is applied, whereby the variable consideration is allocated to each day of service and recognized as revenue when each day of service is provided. When we are entitled to noncash consideration in the form of commodities, the variability related to the form of consideration (market price) and reasons other than form (volume and composition) are interrelated to the service, and therefore, we measure the noncash consideration at the point in time when the volume, mix and market price related to the commodities retained in-kind are known. This results in the recognition of revenue based on the market price of the commodity when the service is performed. In addition, if the transaction price includes a fixed component (i.e., a fixed capacity reservation fee), the fixed component is recognized ratably on a straight line basis over the contract term, as each day of service has elapsed, which is consistent with the output method of progress selected for the performance obligation.
Our customers are typically billed on a monthly basis, or earlier, if final delivery and sale of commodities is made prior to month-end, and payment is typically due within 10 to 30 days. As a practical matter, we define the unit of account for revenue recognition purposes based on the passage of time ranging from one month to one quarter, rather than each day. This is because the financial reporting outcome is the same regardless of whether each day or month/quarter is treated as the distinct service in the series. That is, at the end of each month or quarter, the variability associated with the amount of consideration for which we are entitled to, is resolved, and can be included in that month or quarter’s revenue.
We have certain long-term contractual arrangements under which we have received consideration, but for which all conditions for revenue recognition have not been met. These arrangements result in deferred revenue, which will be recognized over the periods that performance will be provided.
Significant Judgments
Certain provisions of our service contracts (i.e., tiered price structures) require further assessment to determine if the allocation exception for variable consideration is met. If the allocation exception is not met, we estimate the total consideration that we expect to be entitled to for the applicable term of the contract, based on projections of future activity. In such instance, revenue is recognized using an output method of progress based on the volume of commodities serviced during the reporting period. Our estimate of total consideration is reassessed each reporting period until contract completion.
For contracts with minimum volume commitments, we generally expect the customer to meet the commitment. However, such contracts are reassessed throughout the term of the commitment, and if we no longer expect the customer to meet the commitment, the allocation exception for variable consideration would not be met. That is, from that point onwards, an allocation based on the applicable fee applied to the volumes serviced does not depict the amount of consideration which we expect to be entitled to, in exchange for the service. In such instance, revenue will be recognized up to the minimum volume commitment in proportion to the days of service elapsed and the remaining duration of the commitment.
Contract Assets
We classify our contract assets as receivables because we generally have an unconditional right to payment for the commodities sold or services performed at the end of reporting period.
F-16
Share-Based Compensation
We award share-based compensation to employees, directors and non-management directors in the form of restricted stock, restricted stock units and performance share units. Compensation expense on our equity-classified awards is recorded at grant-date fair value. Compensation expense on liability-classified awards is initially recorded at grant-date fair value, and re-measured subsequently at each reporting date through the settlement period. Compensation expense is recognized in general and administrative expense over the requisite service period of each award, and forfeitures are recognized as they occur. We may withhold shares to satisfy employees’ tax withholding obligations on vested awards. The withheld shares are recorded in treasury stock, at cost. Cash paid when directly withholding shares for tax-withholding purposes is classified as a financing activity on the statement of cash flows. All excess tax benefits and tax deficiencies related to share-based compensation are recognized as income tax benefit or expense in the income statement, with the tax effects of exercised or vested awards treated as discrete items in the reporting period which they occur. Excess tax benefits are classified as an operating activity.
Earnings per Share
Basic earnings (loss) per common share (“EPS”) is based on the sum of the weighted-average number of common shares outstanding and vested restricted stock, restricted stock units and performance share units. Diluted EPS includes any dilutive effect of preferred stock, unvested restricted stock, restricted stock units and performance share units. The dilutive effect is calculated through the application of i) the if-converted method for convertible preferred stock, and ii) the treasury stock method for unvested stock awards.
Recent Accounting Pronouncements
Recently adopted accounting pronouncements
Leases
In February 2016, the Financial Accounting Standards Board issued Accounting Standards Update (“ASU”) 2016-02, Leases (Topic 842). The amendments in this update supersede the leases guidance in Topic 840. We adopted Topic 842 on January 1, 2019 by applying the optional transition method in ASU 2018-11, which permits an entity to initially apply the new leases standard at the adoption date and recognize a cumulative-effect adjustment to the opening balance of retained earnings in the period of adoption. The adoption of Topic 842 did not result in a cumulative effect adjustment to retained earnings on January 1, 2019. As part of the adoption of Topic 842, we recognized a net right-of-use asset of $74.6 million (net of $16.3 million of lease incentives/deferred rent) and lease liability of $90.9 million. Other practical expedients we elected include:
| • | The package for transition relief, which among other things, allows us to carry forward our historical lease classification; |
|---|
| • | The land easements transition, which allows us to carry forward our historical accounting treatment for land easements prior to the effective date of the new leases standard, and evaluate only new or modified land easements on or after January 1, 2019 under Topic 842; |
|---|
| • | The short-term lease election, which allows us to elect not to record leases with an initial term of twelve months or less, for all asset classes; |
|---|
| • | The election to not separate non-lease components from lease components for all the asset classes in our current lease portfolio, where Targa is the lessee; and |
|---|
| • | The election to not separate non-lease components from lease components for gathering, processing and storage assets, where Targa is the lessor. Based on our election, we determined the non-lease component in certain of these arrangements is the predominant component and therefore account for the arrangements under ASC 606. |
|---|
We recognize the following for all leases (with the exception of short-term leases) at the commencement date:
| • | A lease liability, which is a lessee’s obligation to make lease payments arising from a lease. |
|---|
| • | A right-of-use asset, which is an asset that represents the lessee’s right to use, or control the use of, a specified asset for the lease term. |
|---|
We determine if an arrangement is or contains a lease at inception. Leases with an initial term of twelve months or less are considered short-term leases, which are excluded from the balance sheet. Right-of-use assets and lease liabilities are recognized at the commencement date based on the present value of future lease payments over the lease term. The right-of-use asset also includes any lease prepayments and excludes lease incentives. As most of the Company’s leases do not provide an implicit interest rate, we use our incremental borrowing rate as the discount rate to compute the present value of our lease liability. The discount rate applied is determined based on information available on the date of adoption for all leases existing as of that date, and on the date of lease commencement for all subsequent leases.
F-17
Our lease arrangements may include variable lease payments based on an index or market rate, or may be based on performance. For variable lease payments based on an index or market rate, we estimate and apply a rate based on information available at the commencement date. Variable lease payments based on performance are excluded from the calculation of the right-of-use asset and lease liability, and are recognized in our Consolidated Statements of Operations when the contingency underlying such variable lease payments is resolved. Our lease terms may include options to extend or terminate the lease. Such options are included in the measurement of our right-of-use asset and liability, provided we determine that we are reasonably certain to exercise the option.
See Note 12 – Leases for additional details.
Note 4 – Joint Ventures, Acquisitions and Divestitures
Joint Ventures
Grand Prix Joint Venture
In May 2017, we announced plans to construct the Grand Prix pipeline (“Grand Prix”), a new common carrier NGL pipeline. Grand Prix transports NGLs from the Permian Basin, North Texas, and Southern Oklahoma to our fractionation and storage complex in the NGL market hub at Mont Belvieu, Texas. Grand Prix is supported by our volumes and other third-party customer volume commitments.
In September 2017, we sold a 25% interest in our consolidated subsidiary, Grand Prix Pipeline LLC (the “Grand Prix Joint Venture”), which owns the portion of Grand Prix extending from the Permian Basin to Mont Belvieu, Texas, to funds managed by Blackstone Energy Partners. We are the operator of Grand Prix. We account for Grand Prix on a consolidated basis in our consolidated financial statements. Grand Prix Joint Venture is included in our Logistics and Transportation segment.
Grand Prix is comprised of three primary segments:
| • | Permian Basin Segment – Connects our Gathering and Processing positions (as well as third-party positions) throughout the Delaware and Midland Basins to North Texas. |
|---|
| • | Southern Oklahoma Extension – Connects our SouthOK and North Texas Gathering and Processing positions (as well as third-party positions) to our North Texas to Mont Belvieu Segment. |
|---|
| • | North Texas to Mont Belvieu Segment – The Permian Basin Segment and Southern Oklahoma Extension connect to a 30-inch diameter pipeline segment in North Texas, which connects Permian, North Texas and Oklahoma volumes to Mont Belvieu. |
|---|
Grand Prix volumes flowing on the pipeline from the Permian Basin to Mont Belvieu are included in Grand Prix Joint Venture, while the volumes flowing from North Texas and Oklahoma to Mont Belvieu accrue solely to Targa’s benefit. In the third quarter of 2019, we began full service into Mont Belvieu on Grand Prix.
Cayenne Joint Venture
In July 2017, we entered into the Cayenne Pipeline, LLC joint venture (“Cayenne”) with American Midstream LLC to convert an existing 62-mile gas pipeline to an NGL pipeline connecting the VESCO plant in Venice, Louisiana to the Enterprise Products Operating LLC (“Enterprise”) pipeline at Toca, Louisiana, for delivery to Enterprise’s Norco Fractionator. We own a 50% interest in Cayenne. See Note 8 – Investments in Unconsolidated Affiliates for activity related to Cayenne.
Gulf Coast Express Joint Venture
In December 2017, we entered into definitive joint venture agreements to form Gulf Coast Express Pipeline LLC (“GCX”) with Kinder Morgan Texas Pipeline LLC (“KMTP”) and DCP Midstream Partners, LP (“DCP”) for the purpose of developing the Gulf Coast Express Pipeline (“GCX Pipeline”), a natural gas pipeline from the Waha hub, including direct connections to the tailgate of many of our Midland Basin processing facilities, to Agua Dulce in South Texas.
Targa GCX Pipeline LLC (“GCX DevCo JV”), a joint venture between us and Stonepeak Infrastructure Partners (“Stonepeak”), and DCP each own a 25% interest, KMTP owns a 34% interest, and Altus Midstream Company owns the remaining 16% interest in GCX. KMTP serves as the operator of GCX Pipeline. We have committed significant volumes to GCX Pipeline. In addition, Pioneer Natural Resources Company, a joint owner in our WestTX Permian Basin assets, also committed volumes to GCX Pipeline. GCX Pipeline is designed to transport up to 1.98 Bcf/d of natural gas and commenced operations late in the third quarter of 2019. See Note 8 – Investments in Unconsolidated Affiliates for activity related to GCX.
F-18
Little Missouri 4 Joint Venture
In January 2018, we formed a 50/50 joint venture in Little Missouri 4 LLC (“Little Missouri 4”) with Hess Midstream Partners LP to construct a new 200 MMcf/d natural gas processing plant (“LM4 Plant”) at Targa’s existing Little Missouri facility. Little Missouri 4 began operations in the third quarter of 2019. Targa is the operator of the LM4 Plant. See Note 8 – Investments in Unconsolidated Affiliates for activity related to Little Missouri 4.
DevCo Joint Ventures
In February 2018, we formed three development joint ventures (“DevCo JVs”) with investment vehicles affiliated with Stonepeak to fund portions of Grand Prix, GCX and an approximately 100 MBbl/d fractionator in Mont Belvieu, Texas (“Train 6”). Stonepeak owns a 95% interest in the Grand Prix DevCo JV, which owns a 20% interest in the Grand Prix Joint Venture (which does not include the extensions into Southern Oklahoma and Central Oklahoma). Stonepeak owns an 80% interest in both GCX DevCo JV, which owns our 25% interest in GCX, and Targa Train 6 LLC (“Train 6 DevCo JV”), which owns a 100% interest in the fractionation train. The Train 6 DevCo JV does not include certain fractionation-related infrastructure such as brine and storage, which were funded and are owned 100% by us. We hold the remaining interests in the DevCo JVs as well as control the management and operation of Grand Prix and Train 6.
The following diagram displays the ownership structure of the DevCo JVs:
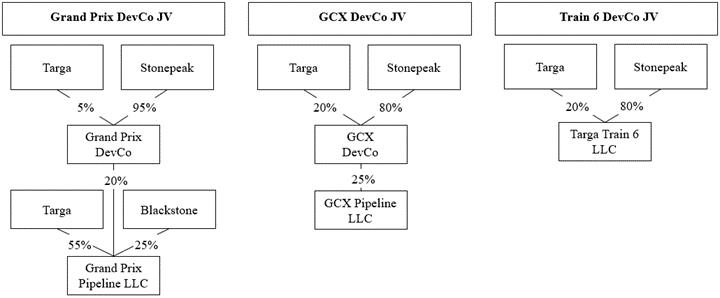
For a four-year period beginning on the date that all three projects commenced commercial operations, we have the option to acquire all or part of Stonepeak’s interests in the DevCo JVs. We may acquire up to 50% of Stonepeak’s invested capital in multiple increments with a minimum of $100 million, and Stonepeak’s remaining 50% interest in a single final purchase. The purchase price payable for such partial or full interests is based on a predetermined fixed return or multiple on invested capital, including distributions received by Stonepeak from the DevCo JVs. Targa controls the management of the DevCo JVs unless and until Targa declines to exercise its option to acquire Stonepeak's interests. Train 6 began operations in the second quarter of 2019. Grand Prix began full service in the third quarter of 2019. GCX Pipeline was placed in service late in the third quarter of 2019.
We hold a controlling interest in each of the DevCo JVs, as we have the majority voting interest and the supermajority voting provisions of the joint venture agreements do not represent substantive participating rights and are protective in nature to Stonepeak. As a result, we have consolidated each of the DevCo JVs in our financial statements. We continue to account for the Grand Prix Joint Venture on a consolidated basis in our consolidated financial statements, and continue to account for GCX as an equity method investment as disclosed in Note 8 – Investments in Unconsolidated Affiliates.
F-19
Carnero Joint Venture
In May 2018, Sanchez Midstream Partners LP and we merged our respective 50% interests in the Carnero gathering and Carnero processing joint ventures, which own the high-pressure Carnero gathering line and Raptor natural gas processing plant, to form an expanded 50/50 joint venture in South Texas (the “Carnero Joint Venture”). We operate the gas gathering and processing facilities in the joint venture. The Carnero Joint Venture is a consolidated subsidiary and its financial results are presented on a gross basis in our reported financials.
Acquisitions
Permian Acquisition
On March 1, 2017, we completed the purchase of 100% of the membership interests of Outrigger Delaware Operating, LLC, Outrigger Southern Delaware Operating, LLC (together “New Delaware”) and Outrigger Midland Operating, LLC (“New Midland” and together with New Delaware, the “Permian Acquisition”).
We paid $484.1 million in cash at closing on March 1, 2017, and paid an additional $90.0 million in cash on May 30, 2017 (collectively, the “initial purchase price”). Subject to certain performance-linked measures and other conditions, additional cash of up to $935.0 million could have been payable to the sellers of New Delaware and New Midland in potential earn-out payments. The first earn-out payment was due in May 2018 and expired with no required payment. The second earn-out payment was based on a multiple of realized gross margin through February 28, 2019 and resulted in a $317.1 million final payment made in May 2019.
The cash portion of the acquisition was funded primarily through the January 2017 public offering of 9,200,000 shares of common stock (including the shares sold pursuant to the underwriters’ overallotment option) at a price to the public of $57.65, providing net proceeds of $524.2 million. Since March 1, 2017, financial and statistical data of New Delaware and New Midland have been included in Permian Delaware operations.
The acquired businesses, which contributed revenues of $127.9 million and a net loss of $19.8 million to us for the period from March 1, 2017 to December 31, 2017, are included in our Gathering and Processing segment. As of December 31, 2017, we had incurred $5.6 million of acquisition-related costs. These expenses are included in Other expense in our Consolidated Statements of Operations for the year ended December 31, 2017.
Pro Forma Impact of Permian Acquisition on Consolidated Statements of Operations
The following summarized unaudited pro forma Consolidated Statements of Operations information for the year ended December 31, 2017 assumes that the Permian Acquisition occurred as of January 1, 2016. We prepared the following summarized unaudited pro forma financial results for comparative purposes only. The summarized unaudited pro forma information may not be indicative of the results that would have occurred had we completed this acquisition as of January 1, 2016, or that would be attained in the future.
| December 31, 2017 | ||||
|---|---|---|---|---|
| Pro Forma | ||||
| Revenues | $ | 8,829.0 | ||
| Net income (loss) | 103.2 |
The pro forma consolidated results of operations amounts have been calculated after applying our accounting policies, and making the following adjustments to the unaudited results of the acquired businesses for the periods indicated:
| • | Reflect the amortization expense resulting from the fair value of intangible assets recognized as part of the Permian Acquisition. |
|---|
| • | Reflect the change in depreciation expense resulting from the difference between the historical balances of the Permian Acquisition’s property, plant and equipment, net, and the fair value of property, plant and equipment acquired. |
|---|
| • | Exclude $5.6 million of acquisition-related costs incurred as of December 31, 2017 from pro forma net income for the year ended December 31, 2017. |
|---|
| • | Reflect the income tax effects of the above pro forma adjustments. |
|---|
The initial fair value of the acquired New Delaware and New Midland assets included $570.8 million cash paid, net of $3.3 million cash acquired, and contingent consideration valued at $416.3 million as of the acquisition date.
F-20
We accounted for the Permian Acquisition as an acquisition of a business under purchase accounting rules. The assets acquired and liabilities assumed related to the Permian Acquisition were recorded at their fair values as of the closing date of March 1, 2017. The fair value of the assets acquired and liabilities assumed at the acquisition date is shown below:
| Fair value determination (final): | March 1, 2017 | |||
|---|---|---|---|---|
| Trade and other current receivables, net | $ | 6.7 | ||
| Other current assets | 0.6 | |||
| Property, plant and equipment | 255.8 | |||
| Intangible assets | 692.3 | |||
| Current liabilities | (14.1 | ) | ||
| Other long-term liabilities | (0.8 | ) | ||
| Total identifiable net assets | 940.5 | |||
| Goodwill | 46.6 | |||
| Total fair value of assets acquired and liabilities assumed | $ | 987.1 |
Under the acquisition method of accounting, the assets acquired and liabilities assumed are recognized at their estimated fair values, with any excess of the purchase price over the estimated fair value of the identifiable net assets acquired recorded as goodwill. Such excess of purchase price over the fair value of net assets acquired was approximately $46.6 million, which was recorded as goodwill. The goodwill is attributable to expected operational and capital synergies and is amortizable for tax purposes.
Contingent Consideration
A contingent consideration liability arising from potential earn-out payments in connection with the Permian Acquisition was recognized at its fair value, which was based on inputs that are not observable in the market and therefore represent level 3 inputs (see Note 18 – Fair Value Measurements). We agreed to pay up to an additional $935.0 million in aggregate potential earn-out payments in May 2018 and May 2019. The acquisition date fair value of the potential earn-out payments was recorded within Other long-term liabilities on our Consolidated Balance Sheets. The final earn-out payment of $317.1 million was made in May 2019. As discussed in Note 18 — Fair Value Measurements, changes in the fair value of the liability (that were not accounted for as revisions of the acquisition date fair value) have been included in Other income (expense).
Flag City Acquisition and Centrahoma Contributions
On May 9, 2017, we purchased all of the equity interests in Flag City Processing Partners, LLC ("FCPP") from Boardwalk Midstream, LLC (“Boardwalk”) and all of the equity interests in FCPP Pipeline, LLC from Boardwalk Field Services, LLC (“BFS”) for a base purchase price of $60.0 million subject to customary closing adjustments. The final adjustment to the base purchase price paid to Boardwalk was an additional $3.6 million. As part of the acquisition (the “Flag City Acquisition”), we acquired a natural gas processing plant with 150 MMcf/d of operating capacity (the “Flag City Plant”) located in Jackson County, Texas; 24 miles of gas gathering pipeline systems and related rights of ways located in Bee and Karnes counties in Texas; 102.1 acres of land surrounding the Flag City Plant; and a limited number of gas supply contracts.
In 2017, due to the redirection of the gas processing activities under the Flag City Plant contracts Flag City Plant was decommissioned and its assets were later contributed to Centrahoma Processing, LLC (“Centrahoma”), a consolidated subsidiary and joint venture that we operate, in which we have a 60% ownership interest. The remaining 40% ownership interest in Centrahoma is held by MPLX LP (“MPLX”). In 2018, utilizing the Flag City Plant assets, Centrahoma constructed the Hickory Hills Plant in Hughes County, Oklahoma (the “Hickory Hills Plant”). In October 2018, Targa also contributed the 120 MMcf/d cryogenic Tupelo Plant in Coal County, Oklahoma (the “Tupelo Plant”) to Centrahoma. In conjunction with Targa’s contribution of both the Flag City Plant assets and the Tupelo Plant, MPLX made cash contributions to Centrahoma in order to maintain its 40% ownership interest. Centrahoma is included in our Gathering and Processing segment.
We accounted for the Flag City Acquisition as an asset acquisition and capitalized less than $0.1 million of acquisition related costs as a component of the cost of assets acquired, which resulted in an allocation of $52.3 million of property, plant and equipment, $7.7 million of intangible assets for customer contracts and $3.6 million of current assets and liabilities, net.
F-21
Divestitures
Sale of Venice Gathering System, L.L.C.
Through our 76.8% ownership interest in Venice Energy Services Company, L.L.C. (“VESCO”), we have operated the Venice Gas Plant and the Venice gathering system. On April 4, 2017, VESCO entered into a purchase and sale agreement with Rosefield Pipeline Company, LLC, an affiliate of Arena Energy, LP, to sell its 100% ownership interests in Venice Gathering System, L.L.C. (“VGS”), a Delaware limited liability company engaged in the business of transporting natural gas in interstate commerce, under authorization granted by and subject to the jurisdiction of the Federal Energy Regulatory Commission (“FERC”), for approximately $0.4 million in cash. Historically, VGS has been reported in our Gathering and Processing segment. After the sale of VGS, we continue to operate the Venice Gas Plant through our ownership in VESCO. As a result of the sale, we recognized a loss of $16.1 million in our Consolidated Statements of Operations for the year ended December 31, 2017 as part of our Other operating (income) expense.
Sale of Refined Products and Crude Oil Storage and Terminaling Facilities
On September 12, 2018, we executed agreements to sell our Downstream refined products and crude oil storage and terminaling facilities in Tacoma, Washington, and Baltimore, Maryland, to a third party for approximately $165 million. The sale closed on October 31, 2018 and resulted in a loss of $57.5 million included within Other operating income (expense) in our Consolidated Statements of Operations. We used the proceeds to repay debt and to fund a portion of our growth capital program. The sale of these businesses is included in our Logistics and Transportation segment and does not qualify for reporting as discontinued operations as it did not represent a strategic shift that would have a major effect on our operations and financial results.
Sale of Interest in Train 7
In February 2019, we announced an extension of the Grand Prix from Southern Oklahoma to the STACK region of Central Oklahoma where it will connect with the Williams Companies, Inc. (“Williams”) Bluestem Pipeline and link the Conway, Kansas, and Mont Belvieu, Texas, NGL markets. In connection with this project, Williams has committed significant volumes to us that we will transport on Grand Prix and fractionate at our Mont Belvieu facilities. Williams also exercised its option to acquire a 20% equity interest in Train 7 and subsequently executed a joint venture agreement with us in the second quarter of 2019. Certain fractionation-related infrastructure for Train 7, including storage caverns and brine handling, will be funded and owned 100% by Targa. We present Train 7 on a consolidated basis in our consolidated financial statements.
Sale of Interest in Targa Badlands LLC
On April 3, 2019, we closed on the sale of a 45% interest in Targa Badlands LLC (“Targa Badlands”), the entity that holds substantially all of the assets previously wholly owned by Targa in North Dakota, to funds managed by GSO Capital Partners and Blackstone Tactical Opportunities (collectively, “Blackstone”) for $1.6 billion in cash. We used the net cash proceeds to repay debt and for general corporate purposes, including funding our growth capital program. Future growth capital of Targa Badlands is expected to be funded on a pro rata ownership basis. Targa Badlands pays a minimum quarterly distribution (“MQD”) to Blackstone and Targa, with Blackstone having a priority right on such MQDs. Once Blackstone receives funds sufficient to meet a predetermined fixed return on their invested capital, their interest will convert to a 7.5% equity interest in Targa Badlands, and it will no longer have a priority right on MQDs. Additionally, upon a sale of Targa Badlands, Blackstone’s capital contributions would have a liquidation preference equal to a predetermined fixed return on their invested capital.
After the seventh anniversary of the closing date or upon the occurrence of certain triggering events, we have the option to acquire all of Blackstone’s interest in Targa Badlands for a purchase price payable to Blackstone based on their liquidation preference after taking into account all prior distributions to Blackstone, plus a set percentage on a multiple of the trailing twelve-month EBITDA of Targa Badlands. Targa will continue to control the management of Targa Badlands pending the occurrence of certain triggering events, including if Blackstone has not received funds sufficient to meet its liquidation preference and Targa has not exercised its purchase right to acquire Blackstone’s interest by April 3, 2029.
We continue to be the operator of Targa Badlands and hold majority governance rights. As a result, we continue to present Targa Badlands on a consolidated basis in our consolidated financial statements and Blackstone’s contributions are reflected as noncontrolling interests. The sale of interest in Targa Badlands is included in our Gathering and Processing segment. Targa Badlands is a discrete entity and the assets and credit of Targa Badlands are not available to satisfy the debts and other obligations of Targa or its other subsidiaries.
F-22
Sale of Crude Gathering and Storage Facilities
Assets and liabilities held for sale
In November 2019, we executed agreements to sell our crude gathering and storage business in Permian Delaware for approximately $134 million. The sale closed on January 22, 2020 and we used the net proceeds to repay debt and to fund a portion of our growth capital program. In relation to the sale, we classified our crude gathering and storage business assets in Permian Delaware as held for sale, and as such we measured these assets at lower of their carrying value or fair value less costs to sell. As a result, we recognized a loss of $59.5 million included within Other operating income (expense) in our Consolidated Statements of Operations for the year ended December 31, 2019. The crude gathering and storage business is included in our Gathering and Processing segment and does not qualify for reporting as a discontinued operation as its divestiture did not represent a strategic shift that would have a major effect on our operations and financial results.
The adjusted carrying amounts of the assets and liabilities held for sale are as follows:
| December 31, 2019 | ||||
|---|---|---|---|---|
| Current assets: | ||||
| Trade receivables | $ | 6.9 | ||
| Intangible assets, net accumulated amortization and estimated loss on sale | 52.1 | |||
| Goodwill | 1.4 | |||
| Property, plant and equipment, net of accumulated depreciation and estimated loss on sale | 77.3 | |||
| Total assets held for sale | $ | 137.7 | ||
| Current liabilities: | ||||
| Accounts payable and accrued liabilities | $ | 6.2 | ||
| Other long-term obligations | 0.2 | |||
| Total liabilities held for sale | $ | 6.4 |
Note 5 — Inventories
| December 31, 2019 | December 31, 2018 | |||||||
|---|---|---|---|---|---|---|---|---|
| Commodities | $ | 156.5 | $ | 151.1 | ||||
| Materials and supplies | 5.0 | 13.6 | ||||||
| $ | 161.5 | $ | 164.7 |
Note 6 — Property, Plant and Equipment and Intangible Assets
Property, Plant and Equipment
| December 31, 2019 | December 31, 2018 | Estimated Useful Lives (In Years) | ||||||||
|---|---|---|---|---|---|---|---|---|---|---|
| Gathering systems | $ | 8,976.8 | $ | 7,547.9 | 5 to 20 | |||||
| Processing and fractionation facilities | 5,143.0 | 4,007.7 | 5 to 25 | |||||||
| Terminaling and storage facilities | 1,495.5 | 1,138.7 | 5 to 25 | |||||||
| Transportation assets | 2,292.4 | 445.1 | 10 to 50 | |||||||
| Other property, plant and equipment | 184.1 | 334.5 | 3 to 25 | |||||||
| Land | 159.7 | 144.3 | — | |||||||
| Construction in progress | 1,576.5 | 3,602.5 | — | |||||||
| Finance lease right-of-use assets | 48.8 | — | — | |||||||
| Property, plant and equipment | 19,876.8 | 17,220.7 | ||||||||
| Accumulated depreciation and amortization | (5,328.3 | ) | (4,292.3 | ) | ||||||
| Property, plant and equipment, net | $ | 14,548.5 | $ | 12,928.4 | ||||||
| Intangible assets | $ | 2,643.5 | $ | 2,736.6 | 10 to 20 | |||||
| Accumulated amortization | (908.5 | ) | (753.4 | ) | ||||||
| Intangible assets, net | $ | 1,735.0 | $ | 1,983.2 |
F-23
During the preparation of the Company's first quarter 2019 consolidated financial statements, the Company identified an error related to depreciation expense on certain assets that should have been placed in-service during 2018. The Company does not believe this error is material to its previously issued historical consolidated financial statements for any of the periods impacted and accordingly, has not adjusted the historical financial statements. The Company recorded the cumulative impact of the adjustment in the period of identification, resulting in a one-time $12.5 million overstatement of depreciation expense.
For each of the years ended December 31, 2019, 2018, and 2017 depreciation expense was $800.0 million, $633.3 million and $621.3 million.
Asset Impairments
We have recorded non-cash pre-tax impairments during the years ended December 31, 2019 and 2017. The impairments were a result of our assessment that forecasted undiscounted future net cash flows from operations, while positive, will not be sufficient to recover the existing total net book value of the underlying assets. For each analysis, we measured the impairment of property, plant and equipment using discounted estimated future cash flows (“DCF”) including a terminal value (a Level 3 fair value measurement). The future cash flows were based on our estimates of operating and cash flow results, economic obsolescence, the business climate, contractual, legal, and other factors. We took into account current and expected industry and market conditions, including commodity prices and volumetric forecasts. The discount rate used in our DCF analysis was based on a weighted average cost of capital determined from relevant market comparisons. These carrying value adjustments are included in Impairment of property, plant and equipment in our Consolidated Statements of Operations.
In the fourth quarter of 2019, we recorded an impairment charge of $225.3 million for the partial impairment of gas processing facilities and gathering systems associated with our North Texas and Coastal operations in our Gathering and Processing segment. Underlying our assessment was the expected continuing decline in natural gas production across the Barnett Shale in North Texas and Gulf of Mexico due to the sustained low commodity price environment.
During 2017, we recorded an impairment charge of $378.0 million for the partial impairment of gas processing facilities and gathering systems associated with our North Texas operations in our Gathering and Processing segment. Given the price environment at the time, we projected a continuing decline in natural gas production across the Barnett Shale in North Texas.
Write-down of Assets
In 2019, we recorded an asset write-down of $17.9 million primarily associated with certain treating units in our Gathering and Processing segment. We wrote down the assets to their recoverable amounts using third party pricing to assess a discounted replacement cost based on the existing condition and location of the units. We consider such input to be a level 2 input in the fair value hierarchy. The write-down of assets is included in Impairment of property, plant and equipment in our Consolidated Statements of Operations.
Intangible Assets
Intangible assets consist of customer contracts and customer relationships acquired in prior business combinations. The fair value of these acquired intangible assets were determined at the date of acquisition based on the present values of estimated future cash flows. Amortization expense attributable to these assets is recorded over the periods in which we benefit from services provided to customers.
For each of the years ended December 31, 2019, 2018, and 2017 amortization expense for our intangible assets was $171.6 million, $182.6 million and $188.2 million. The estimated annual amortization expense for intangible assets is approximately $159.4 million, $149.5 million, $141.2 million, $136.0 million and $132.2 million for each of the years 2020 through 2024. As of December 31, 2019, the weighted average amortization period for our intangible assets was approximately 14.2 years.
The changes in our intangible assets are as follows:
| December 31, 2019 | December 31, 2018 | |||||||
|---|---|---|---|---|---|---|---|---|
| Beginning of period | $ | 1,983.2 | $ | 2,165.8 | ||||
| Held for sale assets | (76.6 | ) | — | |||||
| Amortization | (171.6 | ) | (182.6 | ) | ||||
| End of period | $ | 1,735.0 | $ | 1,983.2 |
F-24
Asset Sales
During the second quarter of 2018, we sold our inland marine barge business, which was included in our Logistics and Transportation segment, to a third party for $69.3 million. As a result of the sale, we recognized a gain of $48.1 million in our Consolidated Statements of Operations for the year ended December 31, 2018 as part of Other operating (income) expense. We continue to own and operate two ocean-going barges.
During the fourth quarter of 2018, we exchanged a portion of our Versado gathering system, located primarily in Yoakum County, Texas, and Lea County, New Mexico, and associated contracts and assets, with a third party for consideration that includes 1) a gathering system located primarily in Lea County, New Mexico, and associated contracts and assets, 2) an initial cash payment and 3) deferred payments due semi-annually beginning on June 30, 2019, through December 31, 2022. The acquired gathering system has been integrated into the Versado gathering system. Due to the significant monetary portion of the consideration received, the exchange of these assets was accounted for as a derecognition of nonfinancial assets, and a gain of $44.4 million was recognized in our Consolidated Statements of Operations for the year ended December 31, 2018 as part of Other operating (income) expense. The gain was calculated as the difference between the fair value of the consideration received, including the fair value of acquired gathering system, less our book basis of the assets transferred.
The fair value of the acquired assets was determined using the indirect cost method of valuation, adjusted for any physical and economic obsolescence, and other management estimates. The fair value measurements of assets acquired are based on inputs that are a combination of Level 2 and Level 3 inputs, as defined in Note 18 – Fair Value Measurements.
Note 7 – Goodwill
Goodwill attributable to the WestTX and SouthTX reporting units in our Gathering and Processing segment was related to our acquisition of Atlas Energy L.P. and Atlas Pipeline Partners L.P. in 2015 (collectively the “Atlas mergers”). We also recognized goodwill of approximately $46.6 million related to the Permian Acquisition on March 1, 2017, which was attributed to the New Midland and Delaware Supersystem reporting units in our Gathering and Processing segment.
Changes in the net amounts of our goodwill are as follows:
| WestTX | SouthTX | New Midland | New Delaware | Delaware Supersystem | Total | |||||||||||||||||||
|---|---|---|---|---|---|---|---|---|---|---|---|---|---|---|---|---|---|---|---|---|---|---|---|---|
| Balance as of December 31, 2017: | ||||||||||||||||||||||||
| Goodwill | $ | 364.5 | $ | 160.3 | $ | 23.2 | $ | 23.4 | $ | — | $ | 571.4 | ||||||||||||
| Accumulated impairment losses | (189.8 | ) | (125.0 | ) | — | — | — | (314.8 | ) | |||||||||||||||
| Net | 174.7 | 35.3 | 23.2 | 23.4 | — | 256.6 | ||||||||||||||||||
| Impairment | (174.7 | ) | (35.3 | ) | — | — | — | (210.0 | ) | |||||||||||||||
| Balance as of December 31, 2018: | ||||||||||||||||||||||||
| Goodwill | 364.5 | 160.3 | 23.2 | 23.4 | — | 571.4 | ||||||||||||||||||
| Accumulated impairment losses | (364.5 | ) | (160.3 | ) | — | — | — | (524.8 | ) | |||||||||||||||
| Net | — | — | 23.2 | 23.4 | — | 46.6 | ||||||||||||||||||
| Impairment | — | — | — | — | — | — | ||||||||||||||||||
| Reporting unit aggregation (1) | — | — | — | (23.4 | ) | 23.4 | — | |||||||||||||||||
| Balance as of December 31, 2019: | ||||||||||||||||||||||||
| Goodwill | 364.5 | 160.3 | 23.2 | — | 23.4 | 571.4 | ||||||||||||||||||
| Goodwill allocated to held for sale assets | — | — | — | — | (1.4 | ) | (1.4 | ) | ||||||||||||||||
| Accumulated impairment losses | (364.5 | ) | (160.3 | ) | — | — | — | (524.8 | ) | |||||||||||||||
| Net | — | — | 23.2 | — | 22.0 | 45.2 |
| (1) | In 2019, we began aggregating the results of Delaware Supersystem activity, including New Delaware. Discrete financial information for New Delaware is no longer available and management now reviews aggregate Delaware Supersystem operating results. |
|---|
The future cash flows and resulting fair values of these reporting units are sensitive to changes in crude oil, natural gas and NGL prices. The direct and indirect effects of significant declines in commodity prices from the date of acquisition would likely cause the fair values of these reporting units to fall below their carrying values, and could result in an impairment of goodwill.
As described in Note 3 – Significant Accounting Policies, we evaluate goodwill for impairment at least annually on November 30, or more frequently if we believe necessary based on events or changes in circumstances. Our annual evaluations utilized an income
F-25
approach including a terminal value to estimate the fair values of our reporting units based on a DCF analysis. The future cash flows for our reporting units are based on our estimates, at that time, of future revenues, income from operations and other factors, such as working capital and timing of capital expenditures. We take into account current and expected industry and market conditions, including commodity pricing and volumetric forecasts in the basins in which the reporting units operate. The discount rates used in our DCF analysis are based on a weighted average cost of capital determined from relevant market comparisons.
The fair value measurements utilized for the evaluation of goodwill for impairment are based on inputs that are not observable in the market and therefore represent Level 3 inputs, as defined in Note 18 – Fair Value Measurements. These inputs require significant judgments and estimates at the time of valuation.
Our 2018 annual evaluation of goodwill for impairment was completed in the fourth quarter of 2018. Due to the impact of lower forecasted commodity prices and a reduction in forecasted volumes as a result of changes in producers’ drilling activity, we recorded impairment expense of $210.0 million in our Consolidated Statements of Operations, representing the impairment of the remaining goodwill for WestTX and SouthTX.
We did not record any goodwill impairment charges for the year ended December 31, 2019, as the fair values of all reporting units exceeded their accounting carrying values. While no impairment is indicated, there is goodwill being allocated to held for sale assets.
Note 8 – Investments in Unconsolidated Affiliates
Our investments in unconsolidated affiliates consist of the following:
Gathering and Processing Segment
| • | two operated joint ventures in South Texas: a 75% interest in T2 LaSalle Gathering Company L.L.C. (“T2 LaSalle”) and a 50% interest in T2 Eagle Ford Gathering Company L.L.C. (“T2 Eagle Ford”), (together the “T2 Joint Ventures”); and |
|---|
| • | a 50% operated ownership interest in Little Missouri 4. |
|---|
Logistics and Transportation Segment
| • | a 25% non-operated ownership interest in GCX; |
|---|
| • | a 38.8% non-operated ownership interest in Gulf Coast Fractionators LP (“GCF”); and |
|---|
| • | a 50% operated ownership interest in Cayenne. |
|---|
The terms of these joint venture agreements do not afford us the degree of control required for consolidating them in our consolidated financial statements, but do afford us the significant influence required to employ the equity method of accounting.
See Note 4 –Joint Ventures, Acquisitions and Divestitures for discussion of the formation of our GCX and Little Missouri 4 and our acquisition of interests in Cayenne.
F-26
The following table shows the activity related to our investments in unconsolidated affiliates:
| Balance at December 31, 2016 | Equity Earnings (Loss) | Cash Distributions | Acquisition | Contributions | Balance at December 31, 2017 | |||||||||||||||||||
|---|---|---|---|---|---|---|---|---|---|---|---|---|---|---|---|---|---|---|---|---|---|---|---|---|
| GCX | $ | — | $ | — | $ | — | $ | — | $ | — | $ | — | ||||||||||||
| Little Missouri 4 | — | — | — | — | — | — | ||||||||||||||||||
| T2 Eagle Ford | 118.6 | (10.6 | ) | — | — | 1.2 | 109.2 | |||||||||||||||||
| T2 LaSalle | 58.6 | (4.9 | ) | — | — | 0.4 | 54.1 | |||||||||||||||||
| GCF | 46.1 | 12.4 | (12.7 | ) | — | — | 45.8 | |||||||||||||||||
| Cayenne | — | — | — | 5.0 | 3.6 | 8.6 | ||||||||||||||||||
| T2 EF Cogen | 17.5 | (13.9 | ) | — | — | 0.3 | 3.9 | |||||||||||||||||
| Agua Blanca | — | — | — | — | — | — | ||||||||||||||||||
| Total | $ | 240.8 | $ | (17.0 | ) | $ | (12.7 | ) | $ | 5.0 | $ | 5.5 | $ | 221.6 | ||||||||||
| Balance at December 31, 2017 | Equity Earnings (Loss) | Cash Distributions (1) | Acquisition (Disposition) | Contributions (2) | Balance at December 31, 2018 | |||||||||||||||||||
| GCX (3) | $ | — | $ | 0.8 | $ | — | $ | — | $ | 210.8 | $ | 211.6 | ||||||||||||
| Little Missouri 4 | — | — | (8.0 | ) | — | 75.3 | 67.3 | |||||||||||||||||
| T2 Eagle Ford | 109.2 | (10.2 | ) | — | — | — | 99.0 | |||||||||||||||||
| T2 LaSalle | 54.1 | (4.9 | ) | — | — | 0.1 | 49.3 | |||||||||||||||||
| GCF | 45.8 | 16.8 | (22.3 | ) | — | — | 40.3 | |||||||||||||||||
| Cayenne | 8.6 | 6.4 | (4.0 | ) | — | 5.6 | 16.6 | |||||||||||||||||
| T2 EF Cogen | 3.9 | (1.8 | ) | — | (2.1 | ) | — | — | ||||||||||||||||
| Agua Blanca | — | 0.2 | — | 3.5 | 2.7 | 6.4 | ||||||||||||||||||
| Total | $ | 221.6 | $ | 7.3 | $ | (34.3 | ) | $ | 1.4 | $ | 294.5 | $ | 490.5 | |||||||||||
| Balance at December 31, 2018 | Equity Earnings (Loss) | Cash Distributions | Disposition | Contributions | Balance at December 31, 2019 | |||||||||||||||||||
| GCX (3) | $ | 211.6 | $ | 27.7 | $ | (25.3 | ) | $ | — | $ | 233.5 | $ | 447.5 | |||||||||||
| Little Missouri 4 | 67.3 | 3.4 | — | — | 33.0 | 103.7 | ||||||||||||||||||
| T2 Eagle Ford (4) | 99.0 | (9.4 | ) | — | — | — | 89.6 | |||||||||||||||||
| T2 LaSalle (4) | 49.3 | (4.5 | ) | — | — | — | 44.8 | |||||||||||||||||
| GCF | 40.3 | 16.1 | (19.2 | ) | — | — | 37.2 | |||||||||||||||||
| Cayenne | 16.6 | 7.2 | (8.2 | ) | — | 0.3 | 15.9 | |||||||||||||||||
| Agua Blanca | 6.4 | (1.5 | ) | (0.4 | ) | (4.5 | ) | — | — | |||||||||||||||
| Total | $ | 490.5 | $ | 39.0 | $ | (53.1 | ) | $ | (4.5 | ) | $ | 266.8 | $ | 738.7 |
| (1) | Includes an $8.0 million distribution from Little Missouri 4 as a reimbursement of pre-formation expenditures. |
|---|
| (2) | Includes a $16.0 million initial contribution of property, plant and equipment to Little Missouri 4. |
|---|
| (3) | As discussed in Note 4 –Joint Ventures, Acquisitions and Divestitures, our 25% interest in GCX is owned by GCX DevCo JV, of which we own a 20% interest. GCX DevCo JV is accounted for on a consolidated basis in our consolidated financial statements. |
|---|
| (4) | The carrying values of the T2 Joint Ventures include the effects of the Atlas mergers purchase accounting, which determined fair values for the joint ventures as of the date of acquisition. As of December 31, 2019, $23.1 million of unamortized excess fair value over the T2 LaSalle and T2 Eagle Ford capital accounts remained. These basis differences, which are attributable to the underlying depreciable tangible gathering assets, are being amortized on a straight-line basis as components of equity earnings over the estimated 20-year useful lives of the underlying assets. |
|---|
Our equity loss for the year ended December 31, 2017 includes the effect of an impairment in the carrying value of our investment in T2 EF Cogen. As a result of the decrease in current and expected future utilization of the underlying cogeneration assets, we determined that factors indicated that a decrease in the value of our investment occurred that was other than temporary. As a result of this evaluation, we recorded an impairment loss of approximately $12.0 million in the first quarter of 2017, which represented our proportionate share (50%) of an impairment charge recorded by the joint venture, as well as our impairment of the unamortized excess fair value resulting from the Atlas mergers.
Effective December 31, 2018: (i) we conveyed our 50% ownership interest in T2 EF Cogen to our joint venture partner and received a distribution of certain assets from the joint venture; and, (ii) we were named as operator of the T2 Joint Ventures. On April 1, 2019, we assumed the operatorship of the T2 Joint Ventures.
During 2019, we closed on the sale of an equity-method investment for $73.8 million, of which $3.5 million contingent consideration was received in January 2020. As a result of the sale, we recognized a gain of $69.3 million reported in Gain (loss) from sale of equity-method investment.
F-27
The following tables summarize the combined financial information of our investments in unconsolidated affiliates (all data presented on a 100% basis):
| December 31, 2019 | December 31, 2018 | |||||||
|---|---|---|---|---|---|---|---|---|
| (In millions) | ||||||||
| Current assets | $ | 136.3 | $ | 200.7 | ||||
| Non-current assets | $ | 2,291.6 | $ | 1,329.7 | ||||
| Current liabilities | $ | 93.8 | $ | 233.9 | ||||
| Non-current liabilities | $ | 3.4 | $ | 179.2 | ||||
| Net assets | $ | 2,330.7 | $ | 1,117.3 |
| Year Ended December 31, | ||||||||||||
|---|---|---|---|---|---|---|---|---|---|---|---|---|
| 2019 | 2018 | 2017 | ||||||||||
| (In millions) | ||||||||||||
| Operating revenues | $ | 265.5 | $ | 130.6 | $ | 84.3 | ||||||
| Operating expenses | $ | 144.2 | $ | 96.9 | $ | 80.5 | ||||||
| Net income (loss) | $ | 87.7 | $ | 34.7 | $ | 3.4 |
Note 9 — Accounts Payable and Accrued Liabilities
| December 31, 2019 | December 31, 2018 | |||||||
|---|---|---|---|---|---|---|---|---|
| Commodities | $ | 683.6 | $ | 721.9 | ||||
| Other goods and services | 313.5 | 478.6 | ||||||
| Interest | 125.7 | 79.9 | ||||||
| Income and other taxes | 62.4 | 47.7 | ||||||
| Permian Acquisition contingent consideration | — | 308.2 | ||||||
| Compensation and benefits | 62.0 | 57.3 | ||||||
| Preferred Series A dividends payable | 22.9 | 22.9 | ||||||
| Accrued distributions to noncontrolling interests | 91.7 | — | ||||||
| Other | 18.1 | 20.8 | ||||||
| $ | 1,379.9 | $ | 1,737.3 |
Accounts payable and accrued liabilities includes $21.9 million and $52.6 million of liabilities to creditors to whom we have issued checks that remain outstanding as of December 31, 2019 and December 31, 2018.
Permian Acquisition Contingent Consideration
As a result of the Permian Acquisition, we included the fair value of the contingent consideration in accounts payable and accrued liabilities as of December 31, 2018. The contingent consideration earn-out period ended on February 28, 2019 and resulted in a $317.1 million payment in May 2019.
F-28
Note 10 — Debt Obligations
| December 31, 2019 | December 31, 2018 | |||||||
|---|---|---|---|---|---|---|---|---|
| Current: | ||||||||
| Obligations of the Partnership: (1) | ||||||||
| Securitization Facility, due December 2020 (2) | $ | 370.0 | $ | 280.0 | ||||
| Senior unsecured notes, 4⅛% fixed rate, due November 2019 (3) | — | 749.4 | ||||||
| 370.0 | 1,029.4 | |||||||
| Debt issuance costs, net of amortization | — | (1.5 | ) | |||||
| Finance lease liabilities | 12.2 | — | ||||||
| Current debt obligations | 382.2 | 1,027.9 | ||||||
| Long-term: | ||||||||
| TRC obligations: | ||||||||
| TRC Senior secured revolving credit facility, variable rate, due June 2023 (4) | 435.0 | 435.0 | ||||||
| Obligations of the Partnership: (1) | ||||||||
| Senior secured revolving credit facility, variable rate, due June 2023 (5) | — | 700.0 | ||||||
| Senior unsecured notes: | ||||||||
| 5¼% fixed rate, due May 2023 | 559.6 | 559.6 | ||||||
| 4¼% fixed rate, due November 2023 | 583.9 | 583.9 | ||||||
| 6¾% fixed rate, due March 2024 | 580.1 | 580.1 | ||||||
| 5⅛% fixed rate, due February 2025 | 500.0 | 500.0 | ||||||
| 5⅞% fixed rate, due April 2026 | 1,000.0 | 1,000.0 | ||||||
| 5⅜% fixed rate, due February 2027 | 500.0 | 500.0 | ||||||
| 6½% fixed rate, due July 2027 | 750.0 | — | ||||||
| 5% fixed rate, due January 2028 | 750.0 | 750.0 | ||||||
| 6⅞% fixed rate, due January 2029 | 750.0 | — | ||||||
| 5½% fixed rate, due March 2030 | 1,000.0 | — | ||||||
| TPL notes, 4¾% fixed rate, due November 2021 (6) | 6.5 | 6.5 | ||||||
| TPL notes, 5⅞% fixed rate, due August 2023 (6) | 48.1 | 48.1 | ||||||
| Unamortized premium | 0.3 | 0.3 | ||||||
| 7,463.5 | 5,663.5 | |||||||
| Debt issuance costs, net of amortization | (49.1 | ) | (31.1 | ) | ||||
| Finance lease liabilities | 25.8 | — | ||||||
| Long-term debt | 7,440.2 | 5,632.4 | ||||||
| Total debt obligations | $ | 7,822.4 | $ | 6,660.3 | ||||
| Irrevocable standby letters of credit: | ||||||||
| Letters of credit outstanding under the TRC Senior secured credit facility (4) | $ | — | $ | — | ||||
| Letters of credit outstanding under the Partnership senior secured revolving credit facility (5) | 88.2 | 79.5 | ||||||
| $ | 88.2 | $ | 79.5 |
| (1) | While we consolidate the debt of the Partnership in our financial statements, we do not have the obligation to make interest payments or debt payments with respect to the debt of the Partnership. |
|---|
| (2) | As of December 31, 2019, the Partnership had $400.0 million of qualifying receivables under its $400.0 million Securitization Facility, resulting in availability of $30.0 million. |
|---|
| (3) | The 4⅛% Senior Notes due 2019 were redeemed in full on February 11, 2019. |
|---|
| (4) | As of December 31, 2019, availability under TRC’s $670.0 million senior secured revolving credit facility (“TRC Revolver”) was $235.0 million. |
|---|
| (5) | As of December 31, 2019, availability under the Partnership’s $2.2 billion senior secured revolving credit facility (“TRP Revolver”) was $2,111.8 million. |
|---|
| (6) | “TPL” refers to Targa Pipeline Partners LP. |
|---|
F-29
The following table shows the contractually scheduled maturities of our debt obligations outstanding at December 31, 2019, for the next five years, and in total thereafter:
| Scheduled Maturities of Debt | |||||||||||||||||||||||||||||||||||
|---|---|---|---|---|---|---|---|---|---|---|---|---|---|---|---|---|---|---|---|---|---|---|---|---|---|---|---|---|---|---|---|---|---|---|---|
| Total | 2020 | 2021 | 2022 | 2023 | 2024 | After 2024 | |||||||||||||||||||||||||||||
| (in millions) | |||||||||||||||||||||||||||||||||||
| TRC Revolver | $ | 435.0 | $ | — | $ | — | $ | — | $ | 435.0 | $ | — | $ | — | |||||||||||||||||||||
| Partnership's Senior unsecured notes | 7,028.2 | — | 6.5 | — | 1,191.6 | 580.1 | 5,250.0 | ||||||||||||||||||||||||||||
| Partnership's Securitization Facility | 370.0 | 370.0 | — | — | — | — | — | ||||||||||||||||||||||||||||
| Total | $ | 7,833.2 | $ | 370.0 | $ | 6.5 | $ | — | $ | 1,626.6 | $ | 580.1 | $ | 5,250.0 |
The following table shows the range of interest rates and weighted average interest rate incurred on our variable-rate debt obligations during the year ended December 31, 2019:
| Range of Interest Rates Incurred | Weighted Average Interest Rate Incurred | ||||
|---|---|---|---|---|---|
| TRC Revolver | 3.5% - 4.3% | 4.0% | |||
| TRP Revolver | 3.5% - 4.7% | 4.1% | |||
| Partnership's Securitization Facility | 2.6% - 3.4% | 3.1% |
Compliance with Debt Covenants
As of December 31, 2019, we were in compliance with the covenants contained in our various debt agreements.
Debt Obligations
TRC Credit Agreement
The TRC Revolver, which has a maturity date of June 2023, provides available commitments up to $670.0 million and allows us to request up to $200.0 million in additional commitments. The TRC Revolver bears interest costs that are dependent on the consolidated leverage ratio of non-Partnership consolidated funded indebtedness to consolidated Adjusted EBITDA, as defined in the TRC Revolver.
We are required to pay a commitment fee ranging from 0.375% to 0.5% (dependent upon the Company’s consolidated leverage ratio) on the daily average unused portion of the TRC Revolver. Loans under the TRC Revolver bear interest at either a base rate or LIBOR (at our option) plus (i) for revolving loans, a margin of 0.75% to 1.75% (in the case of base rate loans) or 1.75% to 2.75% (in the case of LIBOR loans), in each case based on our consolidated leverage ratio and (ii) for term loans, 3.75% (in the case of base rate loans) or 4.75% (in the case of LIBOR loans).
The TRC Revolver is secured by a pledge of the Company’s equity interests in the Partnership and requires us to maintain a consolidated leverage ratio (the ratio of consolidated funded non-partnership indebtedness to consolidated Adjusted EBITDA) of no more than 4.00 to 1.00 for each fiscal quarter. The TRC Revolver restricts our ability to pay dividends to shareholders if, on a pro forma basis after giving effect to such dividend, (a) any default or event of default has occurred and is continuing or (b) we are not in compliance with our consolidated leverage ratio as of the last day of the most recent test period. In addition, it includes various covenants that may limit, among other things, our ability to incur indebtedness, grant liens, make investments, repay or amend the terms of certain other indebtedness, merge or consolidate, sell assets, and engage in transactions with affiliates.
The Partnership’s Revolving Credit Facility
The TRP Revolver, which has a maturity date of June 2023, provides available commitments up to $2.2 billion and allows the Partnership to request up to $500.0 million in additional commitments.
The TRP Revolver provides for certain changes to occur upon the Partnership receiving an investment grade credit rating from Moody’s Investors Service, Inc. (“Moody’s”) or Standard & Poor’s Corporation (“S&P”), including the release of the security interests in all collateral at the request of the Partnership.
F-30
The TRP Revolver bears interest, at the Partnership’s option, either at the base rate or the Eurodollar rate. The base rate is equal to the highest of: (i) Bank of America’s prime rate; (ii) the federal funds rate plus 0.5%; or (iii) the one-month LIBOR rate plus 1.0%, plus an applicable margin (a) before the collateral release date, ranging from 0.25% to 1.25% dependent on the Partnership’s ratio of consolidated funded indebtedness to consolidated Adjusted EBITDA and (b) upon and after the collateral release date, ranging from 0.125% to 0.75% dependent on the Partnership’s non-credit-enhanced senior unsecured long-term debt ratings. The Eurodollar rate is equal to LIBOR rate plus an applicable margin (i) before the collateral release date, ranging from 1.25% to 2.25% dependent on the Partnership’s ratio of consolidated funded indebtedness to consolidated Adjusted EBITDA and (ii) upon and after the collateral release date, ranging from 1.125% to 1.75% dependent on the Partnership’s non-credit-enhanced senior unsecured long-term debt ratings.
The Partnership is required to pay a commitment fee equal to an applicable rate ranging from (a) before the collateral release date, 0.25% to 0.375% (dependent on the Partnership’s ratio of consolidated funded indebtedness to consolidated Adjusted EBITDA) and (b) upon and after the collateral release date, 0.125% to 0.35% (dependent on the Partnership’s non-credit-enhanced senior unsecured long-term debt ratings), in each case, times the actual daily average unused portion of the TRP Revolver. Additionally, issued and undrawn letters of credit bear interest at an applicable margin (i) before the collateral release date, ranging from 1.25% to 2.25% dependent on the Partnership’s ratio of consolidated funded indebtedness to consolidated Adjusted EBITDA and (ii) upon and after the collateral release date, ranging from 1.125% to 1.75% dependent on the Partnership’s non-credit-enhanced senior unsecured long-term debt ratings.
The TRP Revolver is collateralized by a pledge of assets and equity from certain of the Partnership’s subsidiaries. Borrowings are guaranteed by the Partnership’s restricted subsidiaries.
The TRP Revolver requires the Partnership to maintain a total leverage ratio (the ratio of consolidated indebtedness to the Partnership’s consolidated Adjusted EBITDA, in each case as defined in the TRP Revolver), determined as of the last day of each quarter for the four-fiscal quarter period ending on the date of determination, of no more than (a) before the collateral release date, 5.50 to 1.00 and (b) upon and after the collateral release date, 5.25 to 1.00 (or 5.50 to 1.00 during a specified acquisition period).
The TRP Revolver also requires the Partnership to maintain an interest coverage ratio of no less than 2.25 to 1.00 determined as of the last day of each quarter for the four-fiscal quarter period ending on the date of determination. For any four-fiscal quarter period during which a material acquisition or disposition occurs, the total leverage ratio and interest coverage ratio will be determined on a pro forma basis as though such event had occurred as of the first day of such four-fiscal quarter period.
The TRP Revolver restricts the Partnership’s ability to make distributions of available cash to unitholders if a default or an event of default (as defined in the TRP Revolver) exists or would result from such distribution. In addition, the TRP Revolver contains various covenants that may limit, among other things, the Partnership’s ability to incur indebtedness, grant liens, make investments, repay or amend the terms of certain other indebtedness, merge or consolidate, sell assets, and engage in transactions with affiliates (in each case, subject to the Partnership’s right to incur indebtedness or grant liens in connection with, and convey accounts receivable as part of, a permitted receivables financing, the aggregate principal of which shall not exceed $400,000,000).
On June 7, 2019, the Partnership entered into the First Amendment to the TRP Revolver (the “First Amendment”). The First Amendment, among other things, amended the TRP Revolver to (a) increase the maximum percentage of Consolidated EBITDA attributable to Material Project EBITDA. Adjustments from 20% to 30% solely for the fiscal periods from and including the fiscal period ending June 30, 2019 until and including the fiscal period ending June 30, 2020, after which time the maximum percentage of Consolidated EBITDA attributable to Material Project EBITDA. Adjustments shall revert to 20% of Consolidated EBITDA and (b) include in the calculation of Consolidated EBITDA for a period certain cash distributions received by the Partnership (or and of its consolidated restricted subsidiaries) from unrestricted subsidiaries (or entities that are not subsidiaries) after the end of such period but on or prior to the date that TRP calculates Consolidated EBITDA for such period.
The Partnership’s Accounts Receivable Securitization Facility
On December 6, 2019, we renewed and amended the Securitization Facility by changing the termination date from December 6, 2019 to December 4, 2020. As of December 31, 2019, total funding under the Securitization Facility was $370.0 million.
The Securitization Facility provides up to $400.0 million of borrowing capacity at LIBOR market index rates plus a margin through December 4, 2020. Under the Securitization Facility, certain Partnership subsidiaries sell or contribute certain qualifying receivables, without recourse, to another of its consolidated subsidiaries (Targa Receivables LLC or “TRLLC”), a special purpose consolidated subsidiary created for the sole purpose of the Securitization Facility. TRLLC, in turn, sells an undivided percentage ownership in the eligible receivables to third-party financial institutions. Sold or contributed receivables up to the amount of the outstanding debt under the Securitization Facility are not available to satisfy the claims of the creditors of the selling or contributing subsidiaries or the Partnership. Any excess receivables are eligible to satisfy the claims.
F-31
The Partnership’s Senior Unsecured Notes
All issues of senior unsecured notes are pari passu with existing and future senior indebtedness. They are senior in right of payment to any of our future subordinated indebtedness and are unconditionally guaranteed by the Partnership and the Partnership’s restricted subsidiaries. These notes are effectively subordinated to all secured indebtedness under the TRP Revolver and the Partnership’s Securitization Facility, which is secured by accounts receivable pledged under the facility, to the extent of the value of the collateral securing that indebtedness. Interest on all issues of senior unsecured notes is payable semi-annually in arrears.
The Partnership’s senior unsecured notes and associated indenture agreements restrict the Partnership’s ability to make distributions to unitholders in the event of default (as defined in the indentures). The indentures also restrict the Partnership’s ability and the ability of certain of its subsidiaries to: (i) incur additional debt or enter into sale and leaseback transactions; (ii) pay certain distributions on or repurchase equity interests (only if such distributions do not meet specified conditions); (iii) make certain investments; (iv) incur liens; (v) enter into transactions with affiliates; (vi) merge or consolidate with another company; and (vii) transfer and sell assets. These covenants are subject to a number of important exceptions and qualifications. If at any time when the notes are rated investment grade by either Moody’s or S&P and no Default or Event of Default (each as defined in the indentures) has occurred and is continuing, many of such covenants will terminate and the Partnership and its subsidiaries will cease to be subject to such covenants.
The Partnership may redeem the senior unsecured notes, in whole or in part, at any time prior to their maturity at a redemption price equal to the principal amount plus an applicable make-whole premium, plus accrued and unpaid interest and liquidation damages, if any, to the redemption date, as specified in the indenture of each series.
The Partnership may also redeem up to 35% of the aggregate principal amount of each series of notes at the redemption dates and prices set forth in the indentures plus accrued and unpaid interest and liquidation damages, if any, to the redemption date with the net cash proceeds of one or more equity offerings, provided that: (i) at least 65% of the aggregate principal amount of each of the notes (excluding notes held by us) remains outstanding immediately after the occurrence of such redemption; and (ii) the redemption occurs within 180 days of the date of the closing of such equity offering.
The Partnership may also redeem all or part of each of the series of senior unsecured notes on or after the redemption dates as specified in the indenture of each series at the redemption prices as specified in the indenture of each series plus accrued and unpaid interest to the redemption date and liquidation damages, if any, on the notes redeemed.
Senior Unsecured Notes Issuances
In October 2017, the Partnership issued $750.0 million aggregate principal amount of 5% senior notes due January 2028 (the “5% Senior Notes due 2028”). The Partnership used the net proceeds of $744.1 million after costs from this offering to redeem its 5% Senior Notes, reduce borrowings under its credit facilities, and for general partnership purposes.
In April 2018, the Partnership issued $1.0 billion aggregate principal amount of 5⅞% senior notes due April 2026 (the “5⅞% Senior Notes due 2026”). The Partnership used net proceeds of $991.9 million after costs from this offering to repay borrowings under its credit facilities and for general partnership purposes.
In January 2019, the Partnership issued $750.0 million of 6½% Senior Notes due July 2027 and $750.0 million of 6⅞% Senior Notes due January 2029, resulting in total net proceeds of $1,486.6 million. The net proceeds from the issuance were used to redeem in full the Partnership’s outstanding 4⅛% Senior Notes due 2019 at par value plus accrued interest through the redemption date, with the remainder used for general partnership purposes, which included repayment of borrowings under the Partnership’s credit facilities.
In November 2019, the Partnership issued $1.0 billion aggregate principal amount of 5½% Senior Notes due March 2030, resulting in net proceeds of $990.8 million. The net proceeds from the issuance were used to repay borrowings under the Partnership’s credit facilities and for general partnership purposes.
May 2019 Shelf Registration
Our universal shelf registration statement on Form S-3 filed in May 2016 (the “May 2016 Shelf”) expired in May 2019. Accordingly, in May 2019, we filed with the SEC a universal shelf registration statement on Form S-3 that registers the issuance and sale of certain debt and equity securities from time to time in one or more offerings (the “May 2019 Shelf”). The May 2019 Shelf will expire in May 2022. See Note 14 – Common Stock and Related Matters.
F-32
Debt Repurchases & Extinguishments
In March 2017, we repaid the entirety of the TRC Senior secured term loan in the amount of $160.0 million. The repayment resulted in write offs of $2.2 million of discount and $3.7 million of debt issuance costs, which are reflected as Gain (loss) from financing activities in our Consolidated Statements of Operations for the year ended December 31, 2017.
In June 2017, the Partnership redeemed its outstanding 6⅜% Senior Notes due August 2022 (“6⅜% Senior Notes”), totaling $278.7 million in aggregate principal amount, at a price of 103.188% of the principal amount plus accrued interest through the redemption date. The redemption resulted in a $10.7 million loss, which is reflected as Gain (loss) from financing activities in our Consolidated Statements of Operations for the year ended December 31, 2017, consisting of premiums paid of $8.9 million and a non-cash loss to write-off $1.8 million of unamortized debt issuance costs.
In October 2017, the Partnership redeemed its outstanding 5% Senior Notes due 2018 at par value plus accrued interest through the redemption date. The redemption resulted in a non-cash Gain (loss) from financing activities to write-off $0.2 million of unamortized debt issuance costs during the year ended December 31, 2017.
In February 2019, the Partnership redeemed in full its outstanding 4⅛% Senior Notes due 2019 at par value plus accrued interest through the redemption date. The redemption resulted in a non-cash loss to write-off $1.4 million of unamortized debt issuance costs, which is included in Gain (loss) from financing activities in the Consolidated Statements of Operations.
We or the Partnership may retire or purchase various series of the Partnership’s outstanding debt through cash purchases and/or exchanges for other debt, in open market purchases, privately negotiated transactions or otherwise. Such repurchases or exchanges, if any, will depend on prevailing market conditions, our liquidity requirements, contractual restrictions and other factors. The amounts involved may be material.
Debt Repurchases and Extinguishments Summary
The following table summarizes the impact of debt repurchases and extinguishments that are included in our Consolidated Statements of Operations:
| 2019 | 2018 | 2017 | ||||||||||
|---|---|---|---|---|---|---|---|---|---|---|---|---|
| Premium over face value paid upon redemption: | ||||||||||||
| Partnership 6⅜% Senior Notes | $ | — | $ | — | $ | 8.9 | ||||||
| Recognition of unamortized discount: | ||||||||||||
| TRC Senior secured term loan | — | — | 2.2 | |||||||||
| Write-off of debt issuance costs: | ||||||||||||
| TRP Revolver | — | 1.3 | — | |||||||||
| TRC Revolver | — | 0.7 | — | |||||||||
| TRC Senior secured term loan | — | — | 3.7 | |||||||||
| Partnership 4⅛% Senior Notes | 1.4 | — | — | |||||||||
| Partnership 5% Senior Notes | — | — | 0.2 | |||||||||
| Partnership 6⅜% Senior Notes | — | — | 1.8 | |||||||||
| Loss (gain) from financing activities | $ | 1.4 | $ | 2.0 | $ | 16.8 |
Note 11 — Other Long-term Liabilities
Other long-term liabilities are comprised of the following obligations:
| December 31, 2019 | December 31, 2018 | |||||||
|---|---|---|---|---|---|---|---|---|
| Asset retirement obligations | $ | 66.3 | $ | 55.5 | ||||
| Deferred revenue | 172.0 | 175.5 | ||||||
| Operating lease liabilities | 47.2 | — | ||||||
| Other liabilities | 20.1 | 31.2 | ||||||
| Total long-term liabilities | $ | 305.6 | $ | 262.2 |
F-33
Asset Retirement Obligations
Our ARO primarily relate to certain gas gathering pipelines and processing facilities and NGL pipelines. The changes in our ARO are as follows:
| 2019 | 2018 | |||||||
|---|---|---|---|---|---|---|---|---|
| Beginning of period | $ | 55.5 | $ | 50.8 | ||||
| Additions (1) | 11.8 | — | ||||||
| Change in cash flow estimate | (5.1 | ) | 1.8 | |||||
| Accretion expense | 4.7 | 3.7 | ||||||
| Retirement of ARO | (0.6 | ) | (0.8 | ) | ||||
| End of period | $ | 66.3 | $ | 55.5 |
| (1) | Amount reflects additions of ARO related to the commencement of operations of Grand Prix. |
|---|
Mandatorily Redeemable Preferred Interests
Our consolidated financial statements include our interest in two joint ventures that, separately, own a 100% interest in the WestOK natural gas gathering and processing system and a 72.8% undivided interest in the WestTX natural gas gathering and processing system. Our partner in the joint ventures holds preferred interests in each joint venture that are redeemable: (i) at our or our partner’s election, on or after July 27, 2022; and (ii) mandatorily, in July 2037.
The joint ventures, collectively, hold $1.9 billion face value in notes receivable from our partner, which are due July 2042. The interest rate payable under the notes receivable is a variable LIBOR-based rate. For the years ended December 31, 2019, 2018 and 2017, interest earned on the notes receivable of $10.2 million, $9.7 million, and $10.3 million, exclusive of the priority return payable to our partner, is reflected within Interest expense, net in our Consolidated Statements of Operations. We have accounted for the notes receivable at fair value. Upon redemption: (i) the distributable value of our partner’s interest in each joint venture is required to be adjusted by mutual agreement or under a valuation procedure outlined in each joint venture agreement based, among other things, on changes in the market value of the joint venture’s assets allocable to our partner (including the value of the notes receivable); and (ii) the parties are obligated to set off the value of the notes receivable from our partner against the value of our partner’s interest in the applicable joint venture. For reporting purposes under GAAP, an estimate of our partner’s interest in each joint venture is required to be recorded as if the redemption had occurred on the reporting date. Because redemption will not be required until at least 2022, the actual value of our partner’s allocable share of each joint venture’s assets at the time of redemption may differ from our estimate of redemption value as of December 31, 2019.
In February 2018, the parties amended the agreements governing each joint venture to: (i) increase the priority return for capital contributions made on or after January 1, 2017; and (ii) add a non-consent feature effective with respect to certain capital projects undertaken on or after January 1, 2017. During the year ended December 31, 2018, the change in estimated redemption value of the mandatorily redeemable preferred interests of $72.1 million is primarily attributable to the amendments. Income attributable to mandatorily redeemable preferred interests totaled $4.1 million during the year ended December 31, 2018. The estimated redemption value did not change during the year ended December 31, 2019.
Deferred Revenue
Deferred revenue as of December 31, 2019 and December 31, 2018, was $172.0 million and $175.5 million, respectively, which includes $129.0 million of payments received from Vitol Americas Corp. (“Vitol”) (formerly known as Noble Americas Corp.), a subsidiary of Vitol US Holding Co. The payments were received in 2016, 2017, and 2018 as part of an agreement (the “Splitter Agreement”) related to the construction and operation of a crude oil and condensate splitter. In December 2018, Vitol elected to terminate the Splitter Agreement. The Splitter Agreement provides that the first three annual payments are ours if Vitol elects to terminate, which Vitol disputes. The timing of revenue recognition related to the Splitter Agreement deferred revenue is dependent upon resolution of the dispute with Vitol.
F-34
Deferred revenue also includes nonmonetary consideration received in a 2015 amendment (the “gas contract amendment”) to a gas gathering and processing agreement. We measured the estimated fair value of the gathering assets transferred to us using significant other observable inputs representative of a Level 2 fair value measurement. In December 2017, we received monetary consideration to further amend the terms of the gas gathering and processing agreement. The deferred revenue related to these amendments is being recognized on a straight-line basis through the end of the agreement’s term in 2035.
Deferred revenue also includes consideration received for other construction activities of facilities connected to our systems. The deferred revenue related to these other construction activities is being recognized over the periods that future performance will be provided, which extend through 2023.
For the years ended December 31, 2019, 2018 and 2017, we recognized approximately $3.9 million, $3.9 million and $3.1 million of revenue for these transactions.
The following table shows the components of deferred revenue:
| December 31, 2019 | December 31, 2018 | |||||||
|---|---|---|---|---|---|---|---|---|
| Splitter agreement | $ | 129.0 | $ | 129.0 | ||||
| Gas contract amendment | 39.8 | 42.2 | ||||||
| Other deferred revenue | 3.2 | 4.3 | ||||||
| Total deferred revenue | $ | 172.0 | $ | 175.5 |
The following table shows the changes in deferred revenue:
| 2019 | 2018 | |||||||
|---|---|---|---|---|---|---|---|---|
| Balance at December 31, 2018 | $ | 175.5 | $ | 136.2 | ||||
| Additions | 0.4 | 43.2 | ||||||
| Revenue recognized | (3.9 | ) | (3.9 | ) | ||||
| Balance at December 31, 2019 | $ | 172.0 | $ | 175.5 |
Permian Acquisition Contingent Consideration
Upon closing of the Permian Acquisition, a contingent consideration liability arising from potential earn-out provisions was recognized at its preliminary fair value. The first potential earn-out payment would have occurred in May 2018 while the second potential earn-out payment would occur in May 2019. The acquisition date fair value of the contingent consideration of $416.3 million was recorded within Other long-term liabilities on our Consolidated Balance Sheets. For the period from the acquisition date to December 31, 2017, the fair value of the contingent consideration decreased by $99.3 million, primarily related to reductions in forecasted volumes and gross margin as a result of changes in producers’ drilling activity in the region since the acquisition date, bringing the total Permian Acquisition contingent consideration to $317.0 million at December 31, 2017, of which $6.8 million was a current liability.
The portion of the earn-out due in 2018 expired with no required payment. For the period from December 31, 2017 to December 31, 2018, the fair value of the contingent consideration decreased by $8.8 million, primarily attributable to lower actual and forecasted volumes for the remainder of the earn-out period, partially offset by a shorter discount period. At December 31, 2018, the fair value of the second potential earn-out payment of $308.2 million was recorded as a component of accounts payable and accrued liabilities, which are current liabilities on our Consolidated Balance Sheets. The contingent consideration earn-out period ended on February 28, 2019 and resulted in a $317.1 million payment in May 2019.
F-35
The following table shows the changes in the fair value of the contingent consideration related to the Permian Acquisition:
| Year Ended December 31, 2019 | Year Ended December 31, 2018 | March 1, 2017 to December 31, 2017 | ||||||||||
|---|---|---|---|---|---|---|---|---|---|---|---|---|
| Beginning of period | $ | 308.2 | $ | 317.0 | $ | 416.3 | ||||||
| Increase (decrease) in fair value, included in Other income (expense) | 8.9 | (8.8 | ) | (99.3 | ) | |||||||
| Earn-out payment | (317.1 | ) | — | — | ||||||||
| End of period | — | 308.2 | 317.0 | |||||||||
| Less: Current portion | — | (308.2 | ) | (6.8 | ) | |||||||
| Long-term balance at end of period | $ | — | $ | — | 310.2 |
See Note 18 – Fair Value Measurements for additional discussion of the fair value methodology.
Note 12 – Leases
We have non-cancellable operating leases primarily associated with our office facilities, rail assets, land, and storage and terminal assets. We have finance leases primarily associated with our tractors and vehicles. Our leases have remaining lease terms of 1 to 10 years, some of which include options to extend the lease term for up to 20 years.
The balances of right-of-use assets and liabilities of finance leases and operating leases, and their locations on our Consolidated Balance Sheets are as follows:
| Balance Sheet Location | December 31, 2019 | |||||
|---|---|---|---|---|---|---|
| Right-of-use assets | ||||||
| Operating leases, gross | Other long-term assets | $ | 42.0 | |||
| Finance leases, gross | Property, plant and equipment | 48.8 | ||||
| Lease liabilities | ||||||
| Current: | ||||||
| Operating leases | Accounts payable and accrued liabilities | $ | 7.8 | |||
| Finance leases | Current debt obligations | 12.2 | ||||
| Non-current: | ||||||
| Operating leases | Other long-term liabilities | $ | 47.2 | |||
| Finance leases | Long-term debt | 25.8 |
Operating lease costs and short-term lease costs are included in Operating expenses or General and administrative expense in our Consolidated Statements of Operations, depending on the nature of the leases. Finance lease costs are included in Depreciation and amortization expense and Interest income (expense) in our Consolidated Statements of Operations. The components of lease expense were as follows:
| Year Ended December 31, 2019 | ||||||
|---|---|---|---|---|---|---|
| Lease cost | ||||||
| Operating lease cost | $ | 9.9 | ||||
| Short-term lease cost | 30.0 | |||||
| Variable lease cost | 6.7 | |||||
| Finance lease cost | ||||||
| Amortization of right-of-use assets | 13.1 | |||||
| Interest expense | 1.6 | |||||
| Total lease cost | $ | 61.3 |
During the years ended December 31, 2018 and 2017, total operating leases expense incurred were $56.0 million and $49.6 million, which includes short-term leases for compressors and equipment.
Other supplemental information related to our leases are as follows:
| Year Ended December 31, 2019 | ||||||
|---|---|---|---|---|---|---|
| Cash paid for amounts included in the measurement of lease liabilities | ||||||
| Operating cash flows for operating leases | $ | 8.7 | ||||
| Operating cash flows for finance leases | 1.6 | |||||
| Financing cash flows for finance leases | 11.5 |
F-36
The weighted-average remaining lease terms for operating leases and finance leases are 7 years and 3 years, respectively. The weighted-average discount rates for operating leases and finance leases are 4.0% and 3.9%, respectively.
The following table presents the maturities of our lease liabilities under non-cancellable leases as of December 31, 2019:
| Operating Leases | Finance Leases | |||||||
|---|---|---|---|---|---|---|---|---|
| Future Minimum Lease Payments Beginning After December 31, | ||||||||
| 2019 | $ | 9.9 | $ | 13.4 | ||||
| 2020 | 10.4 | 11.7 | ||||||
| 2021 | 9.6 | 10.2 | ||||||
| 2022 | 8.0 | 4.7 | ||||||
| 2023 | 6.2 | 0.5 | ||||||
| Thereafter | 19.7 | — | ||||||
| Total undiscounted cash flows | 63.8 | 40.5 | ||||||
| Less imputed interest | (8.8 | ) | (2.5 | ) | ||||
| Total lease liabilities | $ | 55.0 | $ | 38.0 |
The following table presents future minimum payments under non-cancellable leases as of December 31, 2018:
| Leases | ||||
|---|---|---|---|---|
| 2019 | $ | 20.9 | ||
| 2020 | 20.2 | |||
| 2021 | 18.5 | |||
| 2022 | 16.5 | |||
| 2023 | 9.8 | |||
| Thereafter | 24.9 | |||
| Total payments | $ | 110.8 |
Note 13 – Preferred Stock
Preferred Stock and Detachable Warrants
Our Series A Preferred Stock (“Series A Preferred”) has a liquidation value of $1,000 per share and bears a cumulative 9.5% fixed dividend payable quarterly 45 days after the end of each fiscal quarter. The Series A Preferred has no mandatory redemption date, but is redeemable at our election in year six for a 10% premium to the liquidation preference and for a 5% premium to the liquidation preference thereafter. If the Series A Preferred is not redeemed by the end of year twelve, the investors have the right to convert the Series A Preferred into TRC common stock at an exercise price of $20.77, which represented a 10% premium over the ten-day volume weighted average price (“VWAP”) prior to the February 18, 2016 signing date ($18.88) of the Purchase Agreement underlying the first of two tranches of Series A Preferred sold to investors in a private placement in the first quarter of 2016. If the investors do not elect to convert their Series A Preferred into TRC common stock, Targa has a right after year twelve to force conversion, but only if the VWAP for the ten preceding trading days is greater than 120% of the conversion price. A change of control provision could result in forced redemption, at the option of the investor, if the Series A Preferred could not otherwise remain outstanding or be replaced with a “substantially equivalent security.” The change of control premium to the liquidation preference on the redemption is 10% in years four through six and 5% thereafter.
The Series A Preferred ranks senior to the common outstanding stock with respect to the payment of dividends and distributions in liquidation. The holders of Series A Preferred generally only have voting rights in certain circumstances, subject to certain exceptions, which include:
| • | the issuance or the increase by the Company of any specific class or series of stock that is senior to the Series A Preferred, |
|---|
| • | the issuance or the increase by any of the Company’s consolidated subsidiaries of any specific class or series of securities, |
|---|
| • | changes to the Certificates of Incorporation or Designations of the Series A Preferred that would materially and adversely affect the Preferred Stock holder, |
|---|
F-37
| • | the issuance of stock on parity with the Series A Preferred, subject to certain exceptions, if the Company has exceeded a stipulated fixed charge coverage ratio or an aggregate amount of net proceeds from all future issuances of Parity Stock, or would use the proceeds of such issuance to pay dividends, |
|---|
| • | the incurrence of indebtedness, other than indebtedness that complies with a stipulated fixed charge coverage ratio or under the TRC and TRP Credit Agreements (or replacement commercial bank facilities) in an aggregate amount up to $2.75 billion. |
|---|
The Series A Preferred does not qualify as a liability instrument because it is not mandatorily redeemable. However, as SEC Regulation S-X, Rule 5-02-27 does not permit a probability assessment for a change of control provision, our Series A Preferred must be presented as mezzanine equity between liabilities and shareholders’ equity on our Consolidated Balance Sheets because a change of control event, although not considered probable, could force the Company to redeem the Series A Preferred. A maximum of 46,466,057 common shares would be issued upon conversion of the Series A Preferred.
The Series A Preferred has detachable warrants (the “Warrants”) that have a seven-year term and were exercisable beginning on September 16, 2016. The Warrants were issued in two series: Series A Warrants exercisable into a maximum number of 13,550,004 shares of our common stock with an exercise price of $18.88 and 6,533,727 Series B Warrants with an exercise price of $25.11. The Warrants may be net settled in cash or shares of common stock at the Company’s option. The portion of proceeds allocated to the Series A and Series B Warrants was recorded as additional paid-in capital. All Warrants had been exercised as of the end of the first quarter of 2018. See Note 14 – Common Stock and Related Matters for further information regarding the exercise of Warrants.
Beneficial Conversion Feature
The BCF is defined under GAAP as a nondetachable conversion feature that is in the money at the issuance date, which required us to allocate a portion of the proceeds from the preferred offering equal to the intrinsic value of the BCF to additional paid-in capital. The intrinsic value of the BCF was calculated at the issuance date as the difference between the “accounting conversion price” and the market price of our common shares multiplied by the number of shares into which our Series A Preferred is convertible. The accounting conversion price of $17.02 per share is different from the $20.77 per share contractual conversion price. It was derived by dividing the proceeds allocated to the Series A Preferred by the number of common shares into which the Series A Preferred is convertible. We are recording the accretion of the $614.4 million Series A Preferred discount attributable to the BCF as a deemed dividend using the effective yield method over the twelve-year period prior to the effective date of the holders’ conversion right.
We have the right to redeem the Series A Preferred beginning after year five. As such, we can effectively mitigate or limit the Series A Preferred Holders’ ability to benefit from their conversion right after year twelve by paying either a $96.5 million (10%) redemption premium in year six or a $48.3 million (5%) redemption premium in years seven through twelve. In either case, the redemption premium would be significantly less than the $614.4 million BCF required to be recognized under GAAP. Upon exercise of our redemption rights, any previously recognized accretion of deemed dividends would be reversed in the period of redemption and reflected as income attributable to common shareholders in our Consolidated Statements of Operations and related per share amounts.
Preferred Stock Dividends
As of December 31, 2019, we have accrued cumulative preferred dividends of $22.9 million, which were paid on February 14, 2020. During the years ended December 31, 2019, 2018 and 2017, we paid $91.7 million, $91.7 million and $91.7 million of dividends at a rate of $23.75 per share each quarter to preferred shareholders, and recorded deemed dividends of $33.1 million, $29.2 million and $25.7 million attributable to accretion of the preferred discount resulting from the BCF accounting described above. Such accretion is included in the book value of the Series A Preferred Stock.
Note 14 — Common Stock and Related Matters
Public Offerings of Common Stock
On January 26, 2017, we completed a public offering of 9,200,000 shares of our common stock (including the shares sold pursuant to the underwriters’ overallotment option) at a price to the public of $57.65, providing net proceeds of $524.2 million. We used the net proceeds from this public offering to fund the cash portion of the Permian Acquisition purchase price due upon closing and for general corporate purposes.
F-38
On May 9, 2017, we entered into an equity distribution agreement under the May 2016 Shelf (the “May 2017 EDA”), pursuant to which we may sell through our sales agents, at our option, up to an aggregated amount of $750.0 million of our common stock(“2017 ATM Program”). For the year ended December 31, 2017, no shares of common stock were issued under the May 2017 EDA. For the year ended December 31, 2018, we issued 7,527,902 shares of common stock under the May 2017 EDA, receiving net proceeds of $364.9 million.
On June 1, 2017, we completed a public offering of 17,000,000 shares of our common stock at a price to the public of $46.10, providing net proceeds after underwriting discounts, commissions and other expenses of $777.3 million. We used the net proceeds from this public offering to fund a portion of the capital expenditures related to the construction of the Grand Prix NGL pipeline, repay outstanding borrowings under our credit facilities, redeem the Partnership’s 6⅜% Senior Notes, and for general corporate purposes.
On September 20, 2018, we entered into an equity distribution agreement under the May 2016 Shelf (the “September 2018 EDA”), pursuant to which we may sell through our sales agents, at our option, up to an aggregated amount of $750.0 million of our common stock (“2018 ATM Program”).
The May 2016 Shelf expired in May 2019. Accordingly, in May 2019, we filed (i) the May 2019 Shelf, (ii) a new prospectus supplement to continue the 2017 ATM Program and (iii) a new prospectus supplement to continue the 2018 ATM Program.
During 2019, no shares of common stock were issued under either the May 2017 EDA or the September 2018 EDA. As a result, we have $382.1 million and $750.0 million remaining under the May 2017 EDA and September 2018 EDA, respectively, as of December 31, 2019.
Warrants
19,983,843 Warrants were exercised and net settled for 11,336,856 shares of common stock in 2016, and the remaining 99,888 Warrants were exercised and net settled for 58,814 shares of common stock in the first quarter of 2018.
Common Stock Dividends
The following table details the dividends declared and/or paid by us to common shareholders for the years ended December 31, 2019, 2018 and 2017:
| Three Months Ended | Date Paid | Total Common Dividends Declared | Amount of Common Dividends Paid | Accrued Dividends (1) | Dividends Declared per Share of Common Stock | |||||||||||||
|---|---|---|---|---|---|---|---|---|---|---|---|---|---|---|---|---|---|---|
| (In millions, except per share amounts) | ||||||||||||||||||
| 2019 | ||||||||||||||||||
| December 31, 2019 | February 18, 2020 | $ | 216.0 | $ | 212.0 | $ | 4.0 | $ | 0.91000 | |||||||||
| September 30, 2019 | November 15, 2019 | 215.5 | 211.8 | 3.7 | 0.91000 | |||||||||||||
| June 30, 2019 | August 15, 2019 | 215.1 | 211.5 | 3.6 | 0.91000 | |||||||||||||
| March 31, 2019 | May 15, 2019 | 215.2 | 211.5 | 3.7 | 0.91000 | |||||||||||||
| 2018 | ||||||||||||||||||
| December 31, 2018 | February 15, 2019 | 215.2 | 211.2 | 4.0 | 0.91000 | |||||||||||||
| September 30, 2018 | November 15, 2018 | 212.5 | 208.6 | 3.9 | 0.91000 | |||||||||||||
| June 30, 2018 | August 15, 2018 | 208.9 | 205.2 | 3.7 | 0.91000 | |||||||||||||
| March 31, 2018 | May 16, 2018 | 203.1 | 199.7 | 3.4 | 0.91000 | |||||||||||||
| 2017 | ||||||||||||||||||
| December 31, 2017 | February 15, 2018 | $ | 202.4 | $ | 199.1 | $ | 3.3 | $ | 0.91000 | |||||||||
| September 30, 2017 | November 15, 2017 | 199.0 | 196.2 | 2.8 | 0.91000 | |||||||||||||
| June 30, 2017 | August 15, 2017 | 198.6 | 196.2 | 2.4 | 0.91000 | |||||||||||||
| March 31, 2017 | May 16, 2017 | 182.8 | 180.3 | 2.5 | 0.91000 | |||||||||||||
| (1) | Represents accrued dividends on restricted stock and restricted stock units that are payable upon vesting. |
|---|
F-39
Note 15 — Partnership Units and Related Matters
Distributions
We are entitled to receive all Partnership distributions from available cash on the Partnership’s common units after payment of preferred unit distributions each quarter.
The following details the distributions declared or paid by the Partnership during 2019, 2018 and 2017:
| Three Months Ended | Date Paid | Total Distributions | Distributions to Targa Resources Corp. | |||||||
|---|---|---|---|---|---|---|---|---|---|---|
| 2019 | ||||||||||
| December 31, 2019 | February 13, 2020 | $ | 241.9 | $ | 239.1 | |||||
| September 30, 2019 | November 13, 2019 | 242.1 | 239.3 | |||||||
| June 30, 2019 | August 13, 2019 | 242.4 | 239.6 | |||||||
| March 31, 2019 | April 5, 2019 | 437.8 | 435.0 | |||||||
| 2018 | ||||||||||
| December 31, 2018 | February 13, 2019 | 241.3 | 238.5 | |||||||
| September 30, 2018 | November 13, 2018 | 237.6 | 234.8 | |||||||
| June 30, 2018 | August 13, 2018 | 234.0 | 231.2 | |||||||
| March 31, 2018 | May 11, 2018 | 229.7 | 226.9 | |||||||
| 2017 | ||||||||||
| December 31, 2017 | February 12, 2018 | 228.5 | 225.7 | |||||||
| September 30, 2017 | November 10, 2017 | 225.4 | 222.6 | |||||||
| June 30, 2017 | August 10, 2017 | 225.4 | 222.6 | |||||||
| March 31, 2017 | May 11, 2017 | 209.6 | 206.8 |
Contributions
All capital contributions to the Partnership are allocated 98% to the limited partner and 2% to the general partner; however, no units will be issued for those contributions. For the years ended December 31, 2019, 2018 and 2017, we made total capital contributions to the Partnership of $200.0 million, $600.0 million and $1,720.0 million.
Preferred Units
The Partnership’s Preferred Units are listed on the NYSE under the symbol “NGLS/PA.”
Distributions on the Partnership’s 5,000,000 Preferred Units are cumulative from the date of original issue in October 2015 and are payable monthly in arrears on the 15th day of each month of each year, when, as and if declared by the board of directors of the Partnership’s general partner. Distributions on the Preferred Units will be payable out of amounts legally available at a rate equal to 9.0% per annum. On and after November 1, 2020, distributions on the Preferred Units will accumulate at an annual floating rate equal to the one-month LIBOR plus a spread of 7.71%.
The Preferred Units, with respect to anticipated monthly distributions, rank:
| • | senior to the Partnership’s common units and to each other class or series of Partnership interests or other equity securities established after the original issue date of the Preferred Units that is not expressly made senior to or pari passu with the Preferred Units as to the payment of distributions; |
|---|
| • | pari passu with any class or series of Partnership interests or other equity securities established after the original issue date of the Preferred Units that is not expressly made senior or subordinated to the Preferred Units as to the payment of distributions; |
|---|
| • | junior to all of the Partnership’s existing and future indebtedness (including (i) indebtedness outstanding under the TRP Revolver, (ii) the Partnership’s senior notes and (iii) indebtedness outstanding under the Securitization Facility and other liabilities with respect to assets available to satisfy claims against the Partnership; and |
|---|
| • | junior to each other class or series of Partnership interests or other equity securities established after the original issue date of the Preferred Units that is expressly made senior to the Preferred Units as to the payment of distributions. |
|---|
F-40
At any time on or after November 1, 2020, the Partnership may redeem the Preferred Units, in whole or in part, from any source of funds legally available for such purpose, by paying $25.00 per unit plus an amount equal to all accumulated and unpaid distributions thereon to the date of redemption, whether or not declared. In addition, the Partnership (or a third party with our prior written consent) may redeem the Preferred Units following certain changes of control, as described in our Partnership Agreement. If the Partnership does not (or a third party with our prior written consent does not) exercise this option, then the holders of the Preferred Units (“Preferred Unitholders”) have the option to convert the Preferred Units into a number of common units per Preferred Unit as set forth in the Partnership Agreement. If the Partnership exercises (or a third party with our prior written consent exercises) its redemption rights relating to any Preferred Units, the holders of those Preferred Units will not have the conversion right described above with respect to the Preferred Units called for redemption. The Preferred Unitholders have no voting rights except for certain exceptions set forth in the Partnership Agreement.
As of December 31, 2019, the Partnership has 5,000,000 Preferred Units outstanding. The Partnership paid $11.3 million of distributions each year to the Preferred Unitholders for 2019, 2018 and 2017. The Preferred Units are reported as noncontrolling interests in our financial statements.
In January and February 2020, the board of directors of the general partner of the Partnership declared a cash distribution of $0.1875 per Preferred Unit, resulting in approximately $0.9 million in distributions each month. The distributions declared in January were paid on February 18, 2020 and the distributions declared in February will be paid on March 16, 2020.
Note 16 — Earnings per Common Share
The following table sets forth a reconciliation of net income and weighted average shares outstanding (in millions) used in computing basic and diluted net income per common share:
| 2019 | 2018 | 2017 | ||||||||||
|---|---|---|---|---|---|---|---|---|---|---|---|---|
| Net income (loss) | $ | 41.2 | $ | 60.4 | $ | 104.2 | ||||||
| Less: Net income attributable to noncontrolling interests | 250.4 | 58.8 | 50.2 | |||||||||
| Less: Dividends on preferred stock | 124.8 | 120.9 | 117.4 | |||||||||
| Net income (loss) attributable to common shareholders for basic earnings per share | $ | (334.0 | ) | $ | (119.3 | ) | $ | (63.4 | ) | |||
| Weighted average shares outstanding - basic | 232.5 | 224.2 | 206.9 | |||||||||
| Net income (loss) available per common share - basic | $ | (1.44 | ) | $ | (0.53 | ) | $ | (0.31 | ) | |||
| Weighted average shares outstanding | 232.5 | 224.2 | 206.9 | |||||||||
| Weighted average shares outstanding - diluted | 232.5 | 224.2 | 206.9 | |||||||||
| Net income (loss) available per common share - diluted | $ | (1.44 | ) | $ | (0.53 | ) | $ | (0.31 | ) |
The following potential common stock equivalents are excluded from the determination of diluted earnings per share because the inclusion of such shares would have been anti-dilutive (in millions on a weighted-average basis):
| 2019 | 2018 | 2017 | |||||||
|---|---|---|---|---|---|---|---|---|---|
| Unvested restricted stock awards | 1.2 | 1.7 | 1.2 | ||||||
| Warrants to purchase common stock (1) | — | — | 0.1 | ||||||
| Series A Preferred Stock (2) | 46.5 | 46.5 | 46.5 |
| (1) | During the first quarter of 2018, the remaining Warrants were exercised and net settled by us for shares of common stock. |
|---|
| (2) | The Series A Preferred has no mandatory redemption date, but is redeemable at our election in year six for a 10% premium to the liquidation preference and for a 5% premium to the liquidation preference in year seven thereafter. If the Series A Preferred is not redeemed by the end of year twelve, the investors have the right to convert the Series A Preferred into TRC common stock. See Note 13 – Preferred Stock. |
|---|
F-41
Note 17 — Derivative Instruments and Hedging Activities
The primary purpose of our commodity risk management activities is to manage our exposure to commodity price risk and reduce volatility in our operating cash flow due to fluctuations in commodity prices. We have entered into derivative instruments to hedge the commodity price risks associated with a portion of our expected (i) natural gas, NGL, and condensate equity volumes in our Gathering and Processing operations that result from percent-of-proceeds processing arrangements, (ii) future commodity purchases and sales in our Logistics and Transportation segment and (iii) natural gas transportation basis risk in our Logistics and Transportation segment. The hedge positions associated with (i) and (ii) above will move favorably in periods of falling commodity prices and unfavorably in periods of rising commodity prices and are designated as cash flow hedges for accounting purposes.
The hedges generally match the NGL product composition and the NGL delivery points of our physical equity volumes. Our natural gas hedges are a mixture of specific gas delivery points and Henry Hub. The NGL hedges may be transacted as specific NGL hedges or as baskets of ethane, propane, normal butane, isobutane and natural gasoline based upon our expected equity NGL composition. We believe this approach avoids uncorrelated risks resulting from employing hedges on crude oil or other petroleum products as “proxy” hedges of NGL prices. Our natural gas and NGL hedges are settled using published index prices for delivery at various locations.
We hedge a portion of our condensate equity volumes using crude oil hedges that are based on the NYMEX futures contracts for West Texas Intermediate light, sweet crude, which approximates the prices received for condensate. This exposes us to a market differential risk if the NYMEX futures do not move in exact parity with the sales price of our underlying condensate equity volumes.
We also enter into derivative instruments to help manage other short-term commodity-related business risks. We have not designated these derivatives as hedges and record changes in fair value and cash settlements to revenues.
At December 31, 2019, the notional volumes of our commodity derivative contracts were:
| Commodity | Instrument | Unit | 2020 | 2021 | 2022 | 2023 | 2024 | ||||||||||
|---|---|---|---|---|---|---|---|---|---|---|---|---|---|---|---|---|---|
| Natural Gas | Swaps | MMBtu/d | 127,230 | 123,751 | 46,100 | - | - | ||||||||||
| Natural Gas | Basis Swaps | MMBtu/d | 364,275 | 344,292 | 210,000 | 200,000 | 40,000 | ||||||||||
| NGL | Swaps | Bbl/d | 23,105 | 11,196 | 6,036 | - | - | ||||||||||
| NGL | Futures | Bbl/d | 16,844 | - | - | - | - | ||||||||||
| Condensate | Swaps | Bbl/d | 5,471 | 3,654 | 1,610 | - | - |
Our derivative contracts are subject to netting arrangements that permit our contracting subsidiaries to net cash settle offsetting asset and liability positions with the same counterparty within the same Targa entity. We record derivative assets and liabilities on our Consolidated Balance Sheets on a gross basis, without considering the effect of master netting arrangements. The following schedules reflect the fair value of our derivative instruments and their location on our Consolidated Balance Sheets as well as pro forma reporting assuming that we reported derivatives subject to master netting agreements on a net basis:
| Fair Value as of December 31, 2019 | Fair Value as of December 31, 2018 | |||||||||||||||||
|---|---|---|---|---|---|---|---|---|---|---|---|---|---|---|---|---|---|---|
| Balance Sheet | Derivative | Derivative | Derivative | Derivative | ||||||||||||||
| Location | Assets | Liabilities | Assets | Liabilities | ||||||||||||||
| Derivatives designated as hedging instruments | ||||||||||||||||||
| Commodity contracts | Current | $ | 102.1 | $ | 11.6 | $ | 112.5 | $ | 18.9 | |||||||||
| Long-term | 33.7 | 6.4 | 31.6 | 1.5 | ||||||||||||||
| Total derivatives designated as hedging instruments | $ | 135.8 | $ | 18.0 | $ | 144.1 | $ | 20.4 | ||||||||||
| Derivatives not designated as hedging instruments | ||||||||||||||||||
| Commodity contracts | Current | $ | 1.2 | $ | 92.5 | $ | 2.8 | $ | 14.7 | |||||||||
| Long-term | 1.8 | 34.4 | 2.5 | 1.6 | ||||||||||||||
| Total derivatives not designated as hedging instruments | $ | 3.0 | $ | 126.9 | $ | 5.3 | $ | 16.3 | ||||||||||
| Total current position | $ | 103.3 | $ | 104.1 | $ | 115.3 | $ | 33.6 | ||||||||||
| Total long-term position | 35.5 | 40.8 | 34.1 | 3.1 | ||||||||||||||
| Total derivatives | $ | 138.8 | $ | 144.9 | $ | 149.4 | $ | 36.7 |
F-42
The pro forma impact of reporting derivatives on our Consolidated Balance Sheets on a net basis is as follows:
| Gross Presentation | Pro Forma Net Presentation | |||||||||||||||||||
|---|---|---|---|---|---|---|---|---|---|---|---|---|---|---|---|---|---|---|---|---|
| December 31, 2019 | Asset | Liability | Collateral | Asset | Liability | |||||||||||||||
| Current Position | ||||||||||||||||||||
| Counterparties with offsetting positions or collateral | $ | 99.8 | $ | (85.0 | ) | $ | (4.9 | ) | $ | 56.0 | $ | (46.1 | ) | |||||||
| Counterparties without offsetting positions - assets | 3.5 | - | - | 3.5 | - | |||||||||||||||
| Counterparties without offsetting positions - liabilities | - | (19.1 | ) | - | - | (19.1 | ) | |||||||||||||
| 103.3 | (104.1 | ) | (4.9 | ) | 59.5 | (65.2 | ) | |||||||||||||
| Long Term Position | ||||||||||||||||||||
| Counterparties with offsetting positions or collateral | 33.3 | (40.5 | ) | - | 18.1 | (25.3 | ) | |||||||||||||
| Counterparties without offsetting positions - assets | 2.2 | - | - | 2.2 | - | |||||||||||||||
| Counterparties without offsetting positions - liabilities | - | (0.3 | ) | - | - | (0.3 | ) | |||||||||||||
| 35.5 | (40.8 | ) | - | 20.3 | (25.6 | ) | ||||||||||||||
| Total Derivatives | ||||||||||||||||||||
| Counterparties with offsetting positions or collateral | 133.1 | (125.5 | ) | (4.9 | ) | 74.1 | (71.4 | ) | ||||||||||||
| Counterparties without offsetting positions - assets | 5.7 | - | - | 5.7 | - | |||||||||||||||
| Counterparties without offsetting positions - liabilities | - | (19.4 | ) | - | - | (19.4 | ) | |||||||||||||
| $ | 138.8 | $ | (144.9 | ) | $ | (4.9 | ) | $ | 79.8 | $ | (90.8 | ) | ||||||||
| Gross Presentation | Pro Forma Net Presentation | |||||||||||||||||||
| December 31, 2018 | Asset | Liability | Collateral | Asset | Liability | |||||||||||||||
| Current Position | ||||||||||||||||||||
| Counterparties with offsetting positions or collateral | $ | 100.0 | $ | (33.6 | ) | $ | (14.2 | ) | $ | 70.0 | $ | (17.8 | ) | |||||||
| Counterparties without offsetting positions - assets | 15.3 | - | - | 15.3 | - | |||||||||||||||
| Counterparties without offsetting positions - liabilities | - | - | - | - | - | |||||||||||||||
| 115.3 | (33.6 | ) | (14.2 | ) | 85.3 | (17.8 | ) | |||||||||||||
| Long Term Position | ||||||||||||||||||||
| Counterparties with offsetting positions or collateral | 8.9 | (3.1 | ) | - | 5.9 | (0.1 | ) | |||||||||||||
| Counterparties without offsetting positions - assets | 25.2 | - | - | 25.2 | - | |||||||||||||||
| Counterparties without offsetting positions - liabilities | - | - | - | - | - | |||||||||||||||
| 34.1 | (3.1 | ) | - | 31.1 | (0.1 | ) | ||||||||||||||
| Total Derivatives | ||||||||||||||||||||
| Counterparties with offsetting positions or collateral | 108.9 | (36.7 | ) | (14.2 | ) | 75.9 | (17.9 | ) | ||||||||||||
| Counterparties without offsetting positions - assets | 40.5 | - | - | 40.5 | - | |||||||||||||||
| Counterparties without offsetting positions - liabilities | - | - | - | - | - | |||||||||||||||
| $ | 149.4 | $ | (36.7 | ) | $ | (14.2 | ) | $ | 116.4 | $ | (17.9 | ) |
Our payment obligations in connection with a majority of these hedging transactions are secured by a first priority lien in the collateral securing the TRP Revolver that ranks equal in right of payment with liens granted in favor of the Partnership’s senior secured lenders. Some of our hedges are futures contracts executed through brokers that clear the hedges through an exchange. We maintain a margin deposit with the brokers in an amount sufficient enough to cover the fair value of our open futures positions. The margin deposit is considered collateral, which is located within other current assets on our Consolidated Balance Sheets and is not offset against the fair value of our derivative instruments.
The fair value of our derivative instruments, depending on the type of instrument, was determined by the use of present value methods or standard option valuation models with assumptions about commodity prices based on those observed in underlying markets. The estimated fair value of our derivative instruments was a net liability of $6.1 million as of December 31, 2019. The estimated fair value is net of an adjustment for credit risk based on the default probabilities as indicated by market quotes for the counterparties’ credit default swap rates. The credit risk adjustment was immaterial for all periods presented. Our futures contracts that are cleared through an exchange are margined daily and do not require any credit adjustment.
The following tables reflect amounts recorded in Other Comprehensive Income and amounts reclassified from OCI to revenue for the periods indicated:
| Derivatives in Cash Flow | Gain (Loss) Recognized in OCI on Derivatives (Effective Portion) | |||||||||||
|---|---|---|---|---|---|---|---|---|---|---|---|---|
| Hedging Relationships | 2019 | 2018 | 2017 | |||||||||
| Commodity contracts | $ | 135.6 | $ | 132.5 | $ | (28.8 | ) | |||||
| Gain (Loss) Reclassified from OCI into Income (Effective Portion) | ||||||||||||
| Location of Gain (Loss) | 2019 | 2018 | 2017 | |||||||||
| Revenues | 138.0 | (38.4 | ) | (44.6 | ) |
F-43
Based on valuations as of December 31, 2019, we expect to reclassify commodity hedge related deferred gains of $117.7 million included in accumulated other comprehensive income into earnings before income taxes through the end of 2022, with $90.9 million of gains to be reclassified over the next twelve months.
Our consolidated earnings are also affected by the use of the mark-to-market method of accounting for derivative instruments that do not qualify for hedge accounting or that have not been designated as hedges. The changes in fair value of these instruments are recorded on the balance sheet and through earnings rather than being deferred until the anticipated transaction settles. The use of mark-to-market accounting for financial instruments can cause non-cash earnings volatility due to changes in the underlying commodity price indices. For the year ended December 31, 2019, the unrealized mark-to-market losses are primarily attributable to unfavorable movements in natural gas forward basis prices.
| Derivatives Not Designated | Location of Gain Recognized in | Gain (Loss) Recognized in Income on Derivatives | ||||||||||||
|---|---|---|---|---|---|---|---|---|---|---|---|---|---|---|
| as Hedging Instruments | Income on Derivatives | 2019 | 2018 | 2017 | ||||||||||
| Commodity contracts | Revenue | $ | (142.1 | ) | $ | (32.5 | ) | $ | (5.1 | ) |
See Note 18 – Fair Value Measurements and Note 28 – Segment Information for additional disclosures related to derivative instruments and hedging activities.
Note 18 — Fair Value Measurements
Under GAAP, our Consolidated Balance Sheets reflect a mixture of measurement methods for financial assets and liabilities (“financial instruments”). Derivative financial instruments and contingent consideration related to business acquisitions are reported at fair value on our Consolidated Balance Sheets. Other financial instruments are reported at historical cost or amortized cost on our Consolidated Balance Sheets. The following are additional qualitative and quantitative disclosures regarding fair value measurements of financial instruments.
Fair Value of Derivative Financial Instruments
Our derivative instruments consist of financially settled commodity swaps, futures, option contracts and fixed-price forward commodity contracts with certain counterparties. We determine the fair value of our derivative contracts using present value methods or standard option valuation models with assumptions about commodity prices based on those observed in underlying markets. We have consistently applied these valuation techniques in all periods presented and we believe we have obtained the most accurate information available for the types of derivative contracts we hold.
The fair values of our derivative instruments are sensitive to changes in forward pricing on natural gas, NGLs and crude oil. The financial position of these derivatives at December 31, 2019, a net liability position of $6.1 million, reflects the present value, adjusted for counterparty credit risk, of the amount we expect to receive or pay in the future on our derivative contracts. If forward pricing on natural gas, NGLs and crude oil were to increase by 10%, the result would be a fair value reflecting a net liability of $114.2 million, ignoring an adjustment for counterparty credit risk. If forward pricing on natural gas, NGLs and crude oil were to decrease by 10%, the result would be a fair value reflecting a net asset of $102.1 million, ignoring an adjustment for counterparty credit risk.
F-44
Fair Value of Other Financial Instruments
Due to their cash or near-cash nature, the carrying value of other financial instruments included in working capital (i.e., cash and cash equivalents, accounts receivable, accounts payable) approximates their fair value. Long-term debt is primarily the other financial instrument for which carrying value could vary significantly from fair value. We determined the supplemental fair value disclosures for our long-term debt as follows:
| • | The TRC Revolver, TRP Revolver, and the Partnership’s accounts receivable securitization facility are based on carrying value, which approximates fair value as their interest rates are based on prevailing market rates; and |
|---|
| • | The Partnership’s senior unsecured notes are based on quoted market prices derived from trades of the debt. |
|---|
Contingent consideration liabilities related to business acquisitions are carried at fair value until the end of the related earn-out period.
Fair Value Hierarchy
We categorize the inputs to the fair value measurements of financial assets and liabilities at each balance sheet reporting date using a three-tier fair value hierarchy that prioritizes the significant inputs used in measuring fair value:
| • | Level 1 – observable inputs such as quoted prices in active markets; |
|---|
| • | Level 2 – inputs other than quoted prices in active markets that we can directly or indirectly observe to the extent that the markets are liquid for the relevant settlement periods; and |
|---|
| • | Level 3 – unobservable inputs in which little or no market data exists, therefore we must develop our own assumptions. |
|---|
The following table shows a breakdown by fair value hierarchy category for (1) financial instruments measurements included on our Consolidated Balance Sheets at fair value and (2) supplemental fair value disclosures for other financial instruments:
| December 31, 2019 | ||||||||||||||||||||
|---|---|---|---|---|---|---|---|---|---|---|---|---|---|---|---|---|---|---|---|---|
| Carrying | Fair Value | |||||||||||||||||||
| Value | Total | Level 1 | Level 2 | Level 3 | ||||||||||||||||
| Financial Instruments Recorded on Our Consolidated Balance Sheets at Fair Value: | ||||||||||||||||||||
| Assets from commodity derivative contracts (1) | $ | 136.5 | $ | 136.5 | $ | — | $ | 136.2 | $ | 0.3 | ||||||||||
| Liabilities from commodity derivative contracts (1) | 142.6 | 142.6 | — | 142.0 | 0.6 | |||||||||||||||
| TPL contingent consideration (2) | 2.3 | 2.3 | — | — | 2.3 | |||||||||||||||
| Financial Instruments Recorded on Our Consolidated Balance Sheets at Carrying Value: | ||||||||||||||||||||
| Cash and cash equivalents | 331.1 | 331.1 | — | — | — | |||||||||||||||
| TRC Revolver | 435.0 | 435.0 | — | 435.0 | — | |||||||||||||||
| TRP Revolver | — | — | — | — | — | |||||||||||||||
| Partnership's Senior unsecured notes | 7,028.5 | 7,376.9 | — | 7,376.9 | — | |||||||||||||||
| Partnership's accounts receivable securitization facility | 370.0 | 370.0 | — | 370.0 | — |
| December 31, 2018 | ||||||||||||||||||||
|---|---|---|---|---|---|---|---|---|---|---|---|---|---|---|---|---|---|---|---|---|
| Carrying | Fair Value | |||||||||||||||||||
| Value | Total | Level 1 | Level 2 | Level 3 | ||||||||||||||||
| Financial Instruments Recorded on Our Consolidated Balance Sheets at Fair Value: | ||||||||||||||||||||
| Assets from commodity derivative contracts (1) | $ | 144.4 | $ | 144.4 | $ | — | $ | 137.5 | $ | 6.9 | ||||||||||
| Liabilities from commodity derivative contracts (1) | 31.7 | 31.7 | — | 31.3 | 0.4 | |||||||||||||||
| Permian Acquisition contingent consideration (3) | 308.2 | 308.2 | — | — | 308.2 | |||||||||||||||
| TPL contingent consideration (2) | 2.4 | 2.4 | — | — | 2.4 | |||||||||||||||
| Financial Instruments Recorded on Our Consolidated Balance Sheets at Carrying Value: | ||||||||||||||||||||
| Cash and cash equivalents | 232.1 | 232.1 | — | — | — | |||||||||||||||
| TRC Revolver | 435.0 | 435.0 | — | 435.0 | — | |||||||||||||||
| TRP Revolver | 700.0 | 700.0 | — | 700.0 | — | |||||||||||||||
| Partnership's Senior unsecured notes | 5,277.9 | 5,088.9 | — | 5,088.9 | — | |||||||||||||||
| Partnership's accounts receivable securitization facility | 280.0 | 280.0 | — | 280.0 | — |
F-45
| (1) | The fair value of derivative contracts in this table is presented on a different basis than the Consolidated Balance Sheets presentation as disclosed in Note 17 – Derivative Instruments and Hedging Activities. The above fair values reflect the total value of each derivative contract taken as a whole, whereas the Consolidated Balance Sheets presentation is based on the individual maturity dates of estimated future settlements. As such, an individual contract could have both an asset and liability position when segregated into its current and long-term portions for Consolidated Balance Sheets classification purposes. |
|---|
| (2) | We have a contingent consideration liability for TPL’s previous acquisition of a gas gathering system and related assets, which is carried at fair value. |
|---|
| (3) | We had a contingent consideration liability related to the Permian Acquisition, which was carried at fair value. See Note 4 – Joint Ventures, Acquisitions and Divestitures. |
|---|
Additional Information Regarding Level 3 Fair Value Measurements Included on Our Consolidated Balance Sheets
We reported certain of our swaps and option contracts at fair value using Level 3 inputs due to such derivatives not having observable market prices or implied volatilities for substantially the full term of the derivative asset or liability. For valuations that include both observable and unobservable inputs, if the unobservable input is determined to be significant to the overall inputs, the entire valuation is categorized in Level 3. This includes derivatives valued using indicative price quotations whose contract length extends into unobservable periods.
The fair value of these swaps is determined using a discounted cash flow valuation technique based on a forward commodity basis curve. For these derivatives, the primary input to the valuation model is the forward commodity basis curve, which is based on observable or public data sources and extrapolated when observable prices are not available.
As of December 31, 2019, we had nine commodity swap and option contracts categorized as Level 3. The significant unobservable inputs used in the fair value measurements of our Level 3 derivatives are (i) the forward natural gas liquids pricing curves, for which a significant portion of the derivative’s term is beyond available forward pricing and (ii) implied volatilities, which are unobservable as a result of inactive natural gas liquids options trading. The change in the fair value of Level 3 derivatives associated with a 10% change in the forward basis curve where prices are not observable is immaterial.
The fair value of the Permian Acquisition contingent consideration was determined using a Monte Carlo simulation model. Significant inputs used in the fair value measurement include expected gross margin (calculated in accordance with the terms of the purchase and sale agreements), term of the earn-out period, risk adjusted discount rate and volatility associated with the underlying assets. A significant decrease in expected gross margin during the earn-out period, or significant increase in the discount rate or volatility would have resulted in a lower fair value estimate.
The fair value of the TPL contingent consideration was determined using a probability-based model measuring the likelihood of meeting certain volumetric measures. The inputs for both models are not observable; therefore, the entire valuations of the contingent considerations are categorized in Level 3. The Permian Acquisition contingent consideration earn-out period ended on February 28, 2019 and resulted in a $317.1 million payment in May 2019. See Note 9 – Accounts Payable and Accrued Liabilities for additional discussion of the Permian Acquisition contingent consideration. Changes in the fair value of these liabilities are included in Other income (expense) in our Consolidated Statements of Operations.
The following table summarizes the changes in fair value of our financial instruments classified as Level 3 in the fair value hierarchy:
| Commodity | |||||||||
|---|---|---|---|---|---|---|---|---|---|
| Derivative Contracts | Contingent | ||||||||
| Asset/(Liability) | Consideration | ||||||||
| Balance, December 31, 2018 | $ | 6.5 | $ | (310.6 | ) | ||||
| Change in fair value of TPL contingent consideration | — | 0.1 | |||||||
| Completion of Permian Acquisition contingent consideration earn-out period | — | 308.2 | |||||||
| New Level 3 derivative instruments | (0.7 | ) | — | ||||||
| Transfers out of Level 3 (1) | (6.5 | ) | — | ||||||
| Unrealized gain/(loss) included in OCI | 0.4 | — | |||||||
| Balance, December 31, 2019 | $ | (0.3 | ) | $ | (2.3 | ) |
| (1) | Transfers relate to long-term over-the-counter swaps for NGL products for which observable market prices became available for substantially their full term. |
|---|
F-46
Note 19 — Related Party Transactions
Transactions with Unconsolidated Affiliates
The following table summarizes transactions with unconsolidated affiliates:
| GCF | T2 Joint Ventures | Cayenne | GCX | Little Missouri 4 | Agua Blanca | Total | ||||||||||||||||||||||
|---|---|---|---|---|---|---|---|---|---|---|---|---|---|---|---|---|---|---|---|---|---|---|---|---|---|---|---|---|
| 2019: | ||||||||||||||||||||||||||||
| Revenues | $ | 0.3 | $ | 3.7 | $ | — | $ | 0.8 | $ | 6.3 | $ | — | $ | 11.0 | ||||||||||||||
| Product purchases | (7.9 | ) | — | (7.9 | ) | (24.7 | ) | — | — | (40.5 | ) | |||||||||||||||||
| Operating expenses | — | (2.0 | ) | (0.2 | ) | — | — | (1.2 | ) | (3.4 | ) | |||||||||||||||||
| General and administrative expenses | — | — | — | — | (0.3 | ) | — | (0.3 | ) | |||||||||||||||||||
| 2018: | ||||||||||||||||||||||||||||
| Revenues | $ | 0.3 | $ | 5.2 | $ | — | $ | 0.1 | $ | — | $ | — | $ | 5.6 | ||||||||||||||
| Product purchases | (5.1 | ) | (0.6 | ) | (7.2 | ) | (1.2 | ) | — | — | (14.1 | ) | ||||||||||||||||
| Operating expenses | — | (3.6 | ) | — | — | — | — | (3.6 | ) | |||||||||||||||||||
| 2017: | ||||||||||||||||||||||||||||
| Revenues | $ | 0.3 | $ | 2.1 | $ | — | $ | — | $ | — | $ | — | $ | 2.4 | ||||||||||||||
| Product purchases | (4.4 | ) | (1.1 | ) | — | — | — | — | (5.5 | ) | ||||||||||||||||||
| Operating expenses | — | (3.8 | ) | — | — | — | — | (3.8 | ) |
Relationship with Targa Resources Partners LP
We provide general and administrative and other services to the Partnership, associated with the Partnership’s existing assets and assets acquired from third parties. The Partnership Agreement between the Partnership and us, as general partner of the Partnership, governs the reimbursement of costs incurred on behalf of the Partnership.
The employees supporting the Partnership’s operations are employees of us. The Partnership reimburses us for the payment of certain operating expenses, including compensation and benefits of operating personnel assigned to the Partnership’s assets, and for the provision of various general and administrative services for the benefit of the Partnership. We perform centralized corporate functions for the Partnership, such as legal, accounting, treasury, insurance, risk management, health, safety and environmental, information technology, human resources, credit, payroll, internal audit, taxes, engineering and marketing. Since October 1, 2010, after the final conveyance of assets by us to the Partnership, substantially all of our general and administrative costs have been and will continue to be allocated to the Partnership, other than (1) costs attributable to our status as a separate reporting company and (2) until March 2018, our costs of providing management and support services to certain unaffiliated spun-off entities.
Relationship with Sajet Resources LLC
In December 2010, immediately prior to Targa’s initial public offering, Sajet Resources LLC (“Sajet”) was spun-off from Targa. At the time, Rene Joyce, James Whalen and Joe Bob Perkins, directors of Targa, were also directors of Sajet. Joe Bob Perkins, James Whalen, Michael Heim, Jeffrey McParland, Paul Chung, and Matthew Meloy, executive officers of Targa at the time, were also executive officers of Sajet. The current directors of Sajet are Paul Chung, Jennifer Kneale, Chris McEwan and Matthew Meloy. The current executive officers of Sajet are Joe Bob Perkins, Matthew Meloy, Robert Muraro, Jennifer Kneale, Paul Chung and Julie Boushka. The primary assets of Sajet are real property. Sajet also holds (i) an ownership interest in Floridian Natural Gas Storage Company, LLC through a December 2016 merger with Tesla Resources LLC and (ii) an ownership interest in Allied CNG Ventures LLC. Former holders of our pre-IPO common equity, including certain of our current and former executives, managers and directors collectively own an 18% interest in Sajet. We provided general and administrative services to Sajet and were reimbursed for these amounts at our actual cost. Fees for services provided to Sajet totaled less than $0.1 million in January and February of 2018 and $0.3 million in the year ended December 31, 2017.
In March 2018, we acquired the 82% interest in Sajet that was held by Warburg Pincus sponsored funds for $5.0 million in cash (the “Warburg Funds Transaction”) and extinguished Sajet’s third-party debt in exchange for a promissory note from Sajet of $9.9 million. Minority shareholders had the right to join the transaction and sell up to 100% of their membership interests in Sajet to us at substantially the same terms and price as the Warburg Funds Transaction (the “Tag-Along Rights”). Minority shareholders who currently hold, or formerly held, executive positions at Targa, and minority shareholders who are board members of Targa, agreed not to exercise their Tag-Along Rights resulting from the Warburg Funds Transaction. Certain minority shareholders chose to sell interests totaling 1.6% for approximately $0.1 million in April 2018.
F-47
We hold three outstanding promissory notes from Sajet in the amounts of $9.9 million, $0.5 million and $0.2 million. The interest rate on each of the promissory notes accrues at the prime rate plus six percent per annum. Since March 2018, Sajet has been accounted for on a consolidated basis in our consolidated financial statements.
Note 20 — Commitments
Future non-cancelable commitments related to certain contractual obligations are presented below for each of the next five fiscal years and in aggregate thereafter:
| In Aggregate | 2020 | 2021 | 2022 | 2023 | 2024 | Thereafter | |||||||||||||||||||||
|---|---|---|---|---|---|---|---|---|---|---|---|---|---|---|---|---|---|---|---|---|---|---|---|---|---|---|---|
| Land sites and rights of way (1) | $ | 150.4 | $ | 3.8 | $ | 4.0 | $ | 4.4 | $ | 4.3 | $ | 4.5 | $ | 129.4 |
| (1) | Land site lease and rights of way provides for surface and underground access for gathering, processing and distribution assets that are located on property not owned by us. These agreements expire at various dates, with varying terms, some of which are perpetual. |
|---|
Total expenses incurred under the above non-cancelable commitments were:
| 2019 | 2018 | 2017 | |||||||||
|---|---|---|---|---|---|---|---|---|---|---|---|
| Land sites and rights of way | $ | 6.1 | $ | 6.1 | $ | 5.2 |
Note 21 – Contingencies
Legal Proceedings
We and the Partnership are parties to various legal, administrative and regulatory proceedings that have arisen in the ordinary course of our business. We and the Partnership are also parties to various proceedings with governmental environmental agencies, including, but not limited to the Environmental Protection Agency, Texas Commission on Environmental Quality, Oklahoma Department of Environmental Quality, New Mexico Environment Department, Louisiana Department of Environmental Quality and North Dakota Department of Environmental Quality, which assert monetary sanctions for alleged violations of environmental regulations, including air emissions, discharges into the environment and reporting deficiencies, related to events that have arisen at certain of our facilities in the ordinary course of our business.
Note 22 – Significant Risks and Uncertainties
Nature of Our Operations in Midstream Energy Industry
We operate in the midstream energy industry. Our business activities include gathering, processing, transporting, fractionating and storage of natural gas, NGLs and crude oil. Our results of operations, cash flows and financial condition may be affected by changes in the commodity prices of these hydrocarbon products and changes in the relative price levels among these hydrocarbon products. In general, the prices of natural gas, NGLs, condensate and other hydrocarbon products are subject to fluctuations in response to changes in supply, market uncertainty and a variety of additional factors that are beyond our control.
Our profitability could be impacted by a decline in the volume of crude oil, natural gas, NGLs and condensate transported, gathered or processed at our facilities. A material decrease in natural gas or condensate production or condensate refining, as a result of depressed commodity prices, a decrease in exploration and development activities, or otherwise, could result in a decline in the volume of crude oil, natural gas, NGLs and condensate handled by our facilities.
A reduction in demand for NGL products by the petrochemical, refining or heating industries, whether because of (i) general economic conditions, (ii) reduced demand by consumers for the end products made with NGL products, (iii) increased competition from petroleum-based products due to the pricing differences, (iv) adverse weather conditions, (v) government regulations affecting commodity prices and production levels of hydrocarbons or the content of motor gasoline or (vi) other reasons, could also adversely affect our results of operations, cash flows and financial position.
Our principal market risks are exposure to changes in commodity prices, particularly to the prices of natural gas, NGLs and crude oil, and changes in interest rates.
F-48
Commodity Price Risk
A significant portion of our revenues are derived from percent-of-proceeds contracts under which we receive a portion of the proceeds from the sale of commodities as payment for services. The prices of natural gas, NGLs and crude oil are subject to fluctuations in response to changes in supply, demand, market uncertainty and a variety of additional factors beyond our control. In response to these price risks, we monitor NGL inventory levels in order to mitigate losses related to downward price exposure.
In an effort to reduce the variability of our cash flows, we have entered into derivative financial instruments to hedge the commodity price associated with a significant portion of our expected natural gas, NGL and condensate equity volumes, future commodity purchases and sales, and transportation basis risk. Historically, these transactions have included both swaps and purchased puts (or floors) and calls (or caps) to hedge additional expected equity commodity volumes without creating volumetric risk. We hedge a higher percentage of our expected equity volumes in the earlier future periods. With swaps, we typically receive an agreed upon fixed price for a specified notional quantity and pay the hedge counterparty a floating price for that same quantity based upon published index prices. Since we receive from our customers substantially the same floating index price from the sale of the underlying physical commodity, these transactions are designed to effectively lock-in the agreed fixed price in advance for the volumes hedged. In order to avoid having a greater volume hedged than actual equity volumes, we limit our use of swaps to hedge the prices of less than our expected equity volumes. Our commodity hedges may expose us to the risk of financial loss in certain circumstances.
We also enter into commodity price hedging transactions using futures contracts on futures exchanges. Exchange traded futures are subject to exchange margin requirements, so we may have to increase our cash deposit due to a rise in natural gas, NGL and crude oil prices.
Counterparty Risk – Credit and Concentration
Derivative Counterparty Risk
Where we are exposed to credit risk in our financial instrument transactions, management analyzes the counterparty’s financial condition prior to entering into an agreement, establishes credit and/or margin limits and monitors the appropriateness of these limits on an ongoing basis. Generally, management does not require collateral and does not anticipate nonperformance by our counterparties.
We have master netting provisions in the International Swap Dealers Association agreements with our derivative counterparties. These netting provisions allow us to net settle asset and liability positions with the same counterparties, which reduced our maximum loss due to counterparty credit risk by $21.0 million as of December 31, 2019. The range of losses attributable to our individual counterparties would be between $0.2 million and $21.8 million, depending on the counterparty in default.
The credit exposure related to commodity derivative instruments is represented by the fair value of contracts with a net positive fair value, representing expected future receipts, at the reporting date. At such times, these outstanding instruments expose us to losses in the event of nonperformance by the counterparties to the agreements. Should the creditworthiness of one or more of the counterparties decline, the ability to mitigate nonperformance risk is limited to a counterparty agreeing to either a voluntary termination and subsequent cash settlement or a novation of the derivative contract to a third party. In the event of a counterparty default, we may sustain a loss and our cash receipts could be negatively impacted.
Customer Credit Risk
We extend credit to customers and other parties in the normal course of business. We have established various procedures to manage our credit exposure, including initial credit approvals, credit limits and terms, letters of credit, and rights of offset. We also use prepayments and guarantees to limit credit risk to ensure that our established credit criteria are met. Our allowance for doubtful accounts was $0.0 million as of December 31, 2019 and $0.1 million as of December 31, 2018.
Significant Commercial Relationship
During the years ended December 31, 2019 and 2018, sales of commodities and fees from midstream services provided to Petredec (Europe) Limited comprised approximately 12% and 15% of our consolidated revenues. No customer comprised greater than 10% of our consolidated revenues in the year ended December 31, 2017.
Interest Rate Risk
We are exposed to changes in interest rates, primarily as a result of variable rate borrowings under the TRC Revolver, the TRP Revolver and the Securitization Facility.
F-49
Casualty or Other Risks
We maintain coverage in various insurance programs, which provides us with property damage, business interruption and other coverages which are customary for the nature and scope of our operations. Management believes that we have adequate insurance coverage, although insurance may not cover every type of interruption that might occur. As a result of insurance market conditions, premiums and deductibles may change overtime, and in some instances, certain insurance may become unavailable, or available for only reduced amounts of coverage. As a result, we may not be able to renew existing insurance policies or procure other desirable insurance on commercially reasonable terms, if at all.
If we were to incur a significant liability for which we were not fully insured, it could have a material impact on our consolidated financial position and results of operations. In addition, the proceeds of any such insurance may not be paid in a timely manner and may be insufficient if such an event were to occur. Any event that interrupts the revenues generated by us, or which causes us to make significant expenditures not covered by insurance, could reduce our ability to meet our financial obligations. Furthermore, even when a business interruption event is covered, it could affect interperiod results as we would not recognize the contingent gain until realized in a period following the incident.
Note 23 – Revenue
Fixed consideration allocated to remaining performance obligations
The following table includes the estimated minimum revenue expected to be recognized in the future related to performance obligations that are unsatisfied (or partially unsatisfied) at the end of the reporting period and is comprised of fixed consideration primarily attributable to contracts with minimum volume commitments and for which a guaranteed amount of revenue can be calculated. These contracts are comprised primarily of gathering and processing, fractionation, export, terminaling and storage agreements.
| 2020 | 2021 | 2022 and after | ||||||||||
|---|---|---|---|---|---|---|---|---|---|---|---|---|
| Fixed consideration to be recognized as of December 31, 2019 | $ | 495.1 | $ | 500.0 | $ | 3,209.8 |
In accordance with the optional exemptions that we elected to apply, the amounts presented in the table exclude variable consideration for which the allocation exception is met and consideration associated with performance obligations of short-term contracts. In addition, consideration from contracts for which we recognize revenue at the amount to which we have the right to invoice for services performed is also excluded from the table above, with the exception of any fixed consideration attributable to such contracts. The nature of the performance obligations for which the consideration has been excluded is consistent with the performance obligations described within our revenue recognition accounting policy and the estimated remaining duration of such contracts primarily ranges from 1 to 19 years. In addition, variability exists in the consideration excluded due to the unknown quantity and composition of volumes to be serviced or sold as well as fluctuations in the market price of commodities to be received as consideration or sold over the applicable remaining contract terms. Such variability is resolved at the end of each future month or quarter.
For additional information on our revenue recognition policy, see Note 3 – Significant Accounting Policies. For disclosures related to disaggregated revenue, see Note 28 – Segment Information.
Note 24 – Other Operating (Income) Expense
Other Operating (Income) Expense is comprised of the following:
| Year Ended December 31, | |||||||||||
|---|---|---|---|---|---|---|---|---|---|---|---|
| 2019 | 2018 | 2017 | |||||||||
| (Gain) loss on sale of disposition of business and assets | $ | 71.1 | $ | (0.1 | ) | $ | 15.9 | ||||
| Miscellaneous business tax | 0.2 | 3.2 | 0.8 | ||||||||
| Other | — | 0.4 | 0.7 | ||||||||
| $ | 71.3 | $ | 3.5 | $ | 17.4 |
F-50
The (Gain) loss on sale or disposal of business and assets is comprised of the following:
| Year Ended December 31, | |||||||||||
|---|---|---|---|---|---|---|---|---|---|---|---|
| 2019 | 2018 | 2017 | |||||||||
| Delaware crude gathering - held for sale | $ | 59.5 | $ | — | $ | — | |||||
| Sale of inland marine barge business | — | (48.1 | ) | — | |||||||
| Exchange of a portion of Versado gathering system | — | (44.4 | ) | — | |||||||
| Sale of storage and terminaling facilities | — | 59.1 | — | ||||||||
| Disposal of benzene treating unit | — | 20.5 | — | ||||||||
| Sale of Venice gathering system | — | — | 16.1 | ||||||||
| Other | 11.6 | 12.8 | (0.2 | ) | |||||||
| $ | 71.1 | $ | (0.1 | ) | $ | 15.9 |
Note 25 – Income Taxes
Components of the federal and state income tax provisions for the periods indicated are as follows:
| 2019 | 2018 | 2017 | |||||||||
|---|---|---|---|---|---|---|---|---|---|---|---|
| Current expense (benefit) | $ | — | $ | - | $ | (4.4 | ) | ||||
| Deferred expense (benefit) | (87.9 | ) | 5.5 | (392.7 | ) | ||||||
| Total income tax expense (benefit) | $ | (87.9 | ) | $ | 5.5 | $ | (397.1 | ) |
Our deferred income tax assets and liabilities at December 31, 2019 and 2018 consist of differences related to the timing of recognition of certain types of costs as follows:
| 2019 | 2018 | ||||||
|---|---|---|---|---|---|---|---|
| Deferred tax assets: | |||||||
| Net operating loss | $ | 1,235.6 | $ | 680.7 | |||
| Other | 2.3 | 2.3 | |||||
| Deferred tax assets before valuation allowance | 1,237.9 | 683.0 | |||||
| Valuation allowance | (2.3 | ) | (2.3 | ) | |||
| Deferred tax assets | $ | 1,235.6 | $ | 680.7 | |||
| Deferred tax liabilities: | |||||||
| Investments (1) | $ | (1,647.7 | ) | $ | (1,183.6 | ) | |
| Property, plant, and equipment | (15.6 | ) | (15.8 | ) | |||
| Other | (6.5 | ) | (6.5 | ) | |||
| Deferred tax liabilities | (1,669.8 | ) | (1,205.9 | ) | |||
| Net deferred tax asset (liability) | $ | (434.2 | ) | $ | (525.2 | ) | |
| Net deferred tax asset (liability) | |||||||
| Federal | $ | (363.5 | ) | $ | (429.1 | ) | |
| Foreign | 0.6 | 0.6 | |||||
| State | (71.3 | ) | (96.7 | ) | |||
| Long-term deferred tax liability, net | $ | (434.2 | ) | $ | (525.2 | ) |
| (1) | Our deferred tax liability attributable to investments reflects the differences between the book and tax carrying values of our investment in the Partnership. |
|---|
On December 22, 2017, the U.S. government enacted comprehensive tax legislation commonly referred to as the Tax Cuts and Jobs Act (the "Tax Act"), which significantly changed United States corporate income tax laws beginning, generally, in 2018. These changes included, among others, (1) a permanent reduction of the United States corporate income tax rate from a top marginal rate of 35% to a flat rate of 21%; (2) elimination of the corporate alternative minimum tax (“AMT”); (3) immediate deductions for certain new investments instead of deductions for depreciation expense over time, (4) limitation on the tax deduction for interest expense to 30% of adjusted taxable income; (5) limitation of the deduction for net operating losses to 80% of current year taxable income and elimination of net operating loss carrybacks; and (6) elimination of many business deductions and credits, including the domestic production activities deduction, and the deduction for entertainment expenditures.
F-51
The SEC staff issued Staff Accounting Bulletin No. 118 (“SAB 118”), which provides guidance on accounting for the tax effects of the Tax Act. SAB 118 provides a measurement period that should not extend beyond one year from the Tax Act enactment date for companies to complete the accounting under ASC 740. In accordance with SAB 118, a company must reflect the income tax effects of those aspects of the Tax Act for which the accounting under ASC 740 is complete. To the extent that a company's accounting for certain income tax effects of the Tax Act is incomplete but it is able to determine a reasonable estimate, it must record a provisional estimate in the financial statements. If a company cannot determine a provisional estimate to be included in the financial statements, it should continue to apply ASC 740 on the basis of the provisions of the tax laws that were in effect immediately before the enactment of the Tax Act. We included provisional impacts of the Tax Act in the fourth quarter of 2017. We completed the accounting for the 2017 provisional items in 2018 as outlined below:
| • | We reclassified $4.2 million of AMT credits from deferred tax assets to long term assets. We expect to receive this amount as a refund in 2019-2021. We received a refund of $2.1 million in 2019. |
|---|
| • | The Tax Act reduced the corporate tax rate to 21%, effective January 1, 2018. We recorded a provisional deferred tax benefit of $269.5 million for the year ended December 31, 2017. |
|---|
| • | In the year ended December 31, 2017, we recorded a provisional tax depreciation expense of $1.9 billion, which did not include full expensing of all qualifying capital expenditures. In the year ended December 31, 2018, we completed our analysis of capital expenditures that qualify for bonus expensing and recorded additional tax depreciation expense of $286.4 million. |
|---|
| • | Congress enacted several modifications to the compensation deduction limitation for covered employees under IRC Section 162(m). The modifications do not apply to compensation agreements entered into on or before November 2, 2017. Targa’s covered employees’ compensation is attributable to compensation agreements entered into on or before November 2, 2017. Consequently, we determined the Tax Act’s modifications do not impact Targa’s covered employees’ compensation agreements, and we have not recorded any adjustments. |
|---|
As of December 31, 2019, we have total net operating loss carryforwards of $5.1 billion, $1.7 billion of which will expire between 2036 and 2037. The remaining $3.4 billion net operating loss will not expire, but is limited to offset 80% of taxable income per year. Management believes it more likely than not that the deferred tax asset will be fully utilized.
Set forth below is the reconciliation between our income tax provision (benefit) computed at the United States statutory rate on income before income taxes and the income tax provision in our Consolidated Statements of Operations for the periods indicated:
| Income tax reconciliation: | 2019 | 2018 | 2017 | ||||||||
|---|---|---|---|---|---|---|---|---|---|---|---|
| Income (loss) before income taxes | $ | (46.7 | ) | $ | 65.9 | $ | (292.9 | ) | |||
| Less: Net income attributable to noncontrolling interest | (250.4 | ) | (58.8 | ) | (50.2 | ) | |||||
| Income attributable to TRC before income taxes | (297.1 | ) | 7.1 | (343.1 | ) | ||||||
| Federal statutory income tax rate | 21 | % | 21 | % | 35 | % | |||||
| Provision for federal income taxes | (62.4 | ) | 1.5 | (120.1 | ) | ||||||
| State income taxes, net of federal tax benefit | (5.8 | ) | 2.5 | (11.7 | ) | ||||||
| State rate re-measurement | (14.4 | ) | — | — | |||||||
| Permanent adjustments | (6.3 | ) | — | — | |||||||
| Tax reform rate change | — | — | (269.5 | ) | |||||||
| Other, net | 1.0 | 1.5 | 4.2 | ||||||||
| Income tax provision (benefit) | $ | (87.9 | ) | $ | 5.5 | $ | (397.1 | ) |
We have not identified any uncertain tax positions. We believe that our income tax filing positions and deductions will be sustained on audit and do not anticipate any adjustments that will result in a material adverse effect on our financial condition, results of operations or cash flow. Therefore, no reserves for uncertain income tax positions have been recorded.
F-52
Note 26 - Supplemental Cash Flow Information
| Year Ended December 31, | ||||||||||||||
|---|---|---|---|---|---|---|---|---|---|---|---|---|---|---|
| 2019 | 2018 | 2017 | ||||||||||||
| Cash: | ||||||||||||||
| Interest paid, net of capitalized interest (1) | $ | 287.7 | $ | 217.2 | $ | 212.2 | ||||||||
| Income taxes paid, net of refunds | (1.9 | ) | (0.5 | ) | (67.5 | ) | ||||||||
| Non-cash investing activities: | ||||||||||||||
| Deadstock commodity inventory transferred to property, plant and equipment | $ | 21.8 | $ | 49.0 | $ | 9.0 | ||||||||
| Impact of capital expenditure accruals on property, plant and equipment | (194.4 | ) | 216.2 | 205.4 | ||||||||||
| Transfers from materials and supplies inventory to property, plant and equipment | 25.1 | 12.7 | 3.6 | |||||||||||
| Contribution of property, plant and equipment to investments in unconsolidated affiliates | — | 16.0 | 1.0 | |||||||||||
| Change in ARO liability and property, plant and equipment due to revised cash flow estimate and additions | 6.7 | 1.8 | 3.9 | |||||||||||
| Property, plant and equipment received in asset exchange | — | 24.1 | — | |||||||||||
| Receivable for asset exchange | — | 15.0 | — | |||||||||||
| Asset received related to conveyance of ownership interest in investment in unconsolidated affiliate | — | 3.0 | — | |||||||||||
| Non-cash financing activities: | ||||||||||||||
| Accrued distributions to noncontrolling interests | $ | 91.7 | $ | — | $ | — | ||||||||
| Reduction of Owner's Equity related to accrued dividends on unvested equity awards under share compensation arrangements | 14.2 | 13.7 | 9.7 | |||||||||||
| Accretion of deemed dividends on Series A Preferred Stock | 33.1 | 29.2 | 25.7 | |||||||||||
| Transfer within additional paid-in capital for exercise of Warrants | — | 0.9 | — | |||||||||||
| Impact of accounting standard adoption recorded in retained earnings | — | 5.2 | 56.1 | |||||||||||
| Non-cash balance sheet movements related to assets held for sale (See Note 4 - Joint Ventures, Acquisitions and Divestitures): | ||||||||||||||
| Trade receivables | $ | 6.9 | $ | — | $ | — | ||||||||
| Intangible assets, net accumulated amortization and estimated loss on sale | 52.1 | — | — | |||||||||||
| Goodwill | 1.4 | — | — | |||||||||||
| Property, plant and equipment, net of accumulated depreciation and estimated loss on sale | 77.3 | — | — | |||||||||||
| Accounts payable and accrued liabilities | 6.2 | — | — | |||||||||||
| Other long-term obligations | 0.2 | — | — | |||||||||||
| Non-cash balance sheet movements related to the Permian Acquisition (See Note 4 - Joint Ventures, Acquisitions and Divestitures): | ||||||||||||||
| Contingent consideration recorded at the acquisition date | $ | — | $ | — | $ | 416.3 | ||||||||
| Non-cash balance sheet movements related to the purchase of noncontrolling interests in subsidiary (See Note 4 - Joint Ventures, Acquisitions and Divestitures): | ||||||||||||||
| Additional paid-in capital | $ | — | $ | — | $ | (13.9 | ) | |||||||
| Deferred tax liability | — | — | 13.9 | |||||||||||
| Lease liabilities arising from recognition of right-of-use assets: | ||||||||||||||
| Operating lease | $ | 6.9 | $ | — | $ | — | ||||||||
| Finance lease | 10.1 | — | — |
| (1) | Interest capitalized on major projects was $61.8 million, $46.3 million and $14.3 million for the years ended December 31, 2019, 2018 and 2017. |
|---|
Note 27 – Compensation Plans
2010 TRC Stock Incentive Plan
In December 2010, we adopted the Targa Resources Corp. 2010 Stock Incentive Plan for employees, consultants and non-employee directors of the Company. In May 2017, the 2010 TRC Plan was amended and restated (the “2010 TRC Plan”). Total authorized shares of common stock under the plan is 15,000,000, comprised of 5,000,000 shares originally available and an additional 10,000,000 shares that became available in May 2017. The 2010 TRC Plan allows for the grant of (i) incentive stock options qualified as such under U.S. federal income tax laws (“Incentive Options”), (ii) stock options that do not qualify as incentive options (“Non-statutory Options,” and together with Incentive Options, “Options”), (iii) stock appreciation rights (“SARs”) granted in conjunction with Options or Phantom Stock Awards, (iv) restricted stock awards (“Restricted Stock Awards”), (v) phantom stock awards (“Phantom Stock Awards”), (vi) bonus stock awards, (vii) performance unit awards, or (viii) any combination of such awards (collectively referred to as “Awards”).
Unless otherwise specified, the compensation costs for the awards listed below were recognized as expenses over related vesting periods based on the grant-date fair values, reduced by forfeitures incurred.
F-53
Restricted Stock Awards - Restricted stock entitles the recipient to cash dividends. Dividends on unvested restricted stock will be accrued when declared and recorded as short-term or long-term liabilities, dependent on the time remaining until payment of the dividends, and paid in cash when the award vests. The restricted stock awards will be included in the outstanding shares of our common stock upon issuance.
Director Grants – The committee awarded our common stock to our outside directors. In 2019, 2018 and 2017, we issued 25,344, 16,955 and 13,818 shares of director grants with the weighted average grant-date fair value of $42.83, $51.21 and $60.48. Starting from January 1, 2018, director grants are restricted stock awards that vest in one year. In prior years, directors were granted shares of common stock with no vesting requirement.
Restricted Stock Units Awards – Restricted Stock Units (“RSUs”) are similar to restricted stock, except that shares of common stock are not issued until the RSUs vest. The vesting periods vary from one year to six years. In 2019, 2018 and 2017, we issued 1,042,344, 1,393,812 and 1,193,942 shares of RSUs with the weighted average grant-date fair value of $39.95, $51.71 and $54.18. The 2019 and 2018 issuances include 85,547 and 275,076 shares of RSUs for our new retention program. These shares will vest in October 2022.
Restricted Stock in Lieu of Bonus – In 2019, 2018 and 2017, we issued 95,687, 112,438 and 84,221 shares of restricted stock awards in lieu of cash bonuses in the form of RSUs for our executives at the weighted average grant-date fair value of $42.83, $51.09 and $55.94. These awards will cliff vest over three years. Dividends on bonus awards issued after 2017 are paid quarterly.
The following table summarizes the restricted stock and RSUs under the 2010 TRC Plan in shares and in dollars for the year indicated.
| Number of shares | Weighted Average Grant-Date Fair Value | |||||||
|---|---|---|---|---|---|---|---|---|
| Outstanding at December 31, 2018 | 3,594,135 | $ | 45.31 | |||||
| Granted | 1,067,688 | 40.02 | ||||||
| Forfeited | (175,861 | ) | 51.90 | |||||
| Vested | (1,093,901 | ) | 28.31 | |||||
| Outstanding at December 31, 2019 | 3,392,061 | 48.79 |
Performance Share Units
During 2019, 2018 and 2017, we issued 261,245, 182,849 and 113,901 shares of performance share units (“PSUs”) to executive management and employees for the 2019, 2018 and 2017 compensation cycle that will vest/have vested in January 2022, January 2021 and January 2020. The PSUs granted under the 2010 TRC Plan are three-year equity-settled awards linked to the performance of shares of our common stock. The awards also include dividend equivalent rights (“DERs”) that are based on the notional dividends accumulated during the vesting period.
The vesting of the PSUs is dependent on the satisfaction of a combination of certain service-related conditions and the Company’s total shareholder return (“TSR”) relative to the TSR of the members of a specified comparator group of publicly-traded midstream companies (the “LTIP Peer Group”) measured over designated periods. The TSR performance factor is determined by the Committee at the end of the overall performance period based on relative performance over the designated weighting periods as follows: (i) 25% based on annual relative TSR for the first year; (ii) 25% based on annual relative TSR for the second year; (iii) 25% based on annual relative TSR for the third year; and (iv) the remaining 25% based on cumulative three-year relative TSR over the entirety of the performance period. With respect to each weighting period, the Committee determines the “guideline performance percentage,” which could range from 0% to 250%, based upon the Company’s relative TSR performance for the applicable period. The TSR performance factor will be calculated by averaging the guideline performance percentage for each weighting period, and the average percentage may then be decreased or increased by the Committee at its discretion. The grantee will become vested in a number of PSUs equal to the target number awarded multiplied by the TSR performance factor, and vested PSUs will be settled by the issuance of Company common stock. The value of dividend equivalent rights will be paid in cash when the awards vest.
F-54
Compensation cost for equity-settled PSUs was recognized as an expense over the performance period based on fair value at the grant date. The compensation cost will be reduced if forfeitures occur. Fair value was calculated using a simulated share price that incorporates peer ranking. DERs associated with equity-settled PSUs were accrued over the performance period as a reduction of owners’ equity. We evaluated the grant date fair value using a Monte Carlo simulation model and historical volatility assumption with an expected term of three years. The expected volatilities were 32% - 37% for PSUs granted in 2019, 29% - 53% for PSUs granted in 2018 and 55% - 61% for PSUs granted in 2017.
The following table summarizes the PSUs under the 2010 TRC Plan in shares and in dollars for the years indicated.
| Number of shares | Weighted Average Grant-Date Fair Value | |||||||
|---|---|---|---|---|---|---|---|---|
| Outstanding at December 31, 2018 | 296,750 | $ | 88.19 | |||||
| Granted | 261,245 | 64.46 | ||||||
| Forfeited | (29,276 | ) | 86.57 | |||||
| Outstanding at December 31, 2019 | 528,719 | 76.56 |
Cash-settled Awards
During 2019 and 2018, we issued 7,836 and 69,042 shares of cash-settled awards for our retention program. These awards are liability awards and vest each quarter for one year. The fair value of the awards is evaluated based on the average of TRC stock prices for the last ten trading days at the end of each quarter. All cash-settled awards vested in 2019. Payments for the cash-settled awards are classified within operating activities in the Consolidated Statements of Cash Flows. The following table summarizes the cash-settled restricted stock units for the year ended 2019.
| Number of shares | ||||
|---|---|---|---|---|
| Outstanding as of December 31, 2018 | 50,228 | |||
| Granted | 7,836 | |||
| Vested and paid | (54,313 | ) | ||
| Forfeited | (3,672 | ) | ||
| Outstanding as of December 31, 2019 | 79 |
We made $2.9 million in payments for the cash-settled restricted units during 2019 and no payments in 2018.
TRC Equity Compensation Plan
In connection with the TRC/TRP Merger, we adopted and assumed the Partnership’s Long-term Incentive Plan and outstanding awards thereunder, and amended and restated the plan and renamed it the Targa Resources Corp. Equity Compensation Plan (the “Plan”). We continued to maintain the Equity Compensation Plan during 2017. However, since the number of shares reserved under the Equity Compensation Plan had been substantially exhausted as of the end of 2016, we no longer made grants under the Plan, which terminated in February 2017.
The RSUs remaining under this Plan are the converted TRP awards and the RSUs made in lieu of cash bonus for our nonexecutives.
The following table summarizes the RSUs for the year ended December 31, 2019, under the Plan:
| Number of shares | Weighted Average Grant-Date Fair Value | |||||||
|---|---|---|---|---|---|---|---|---|
| Outstanding as of December 31, 2018 | 301,691 | $ | 27.10 | |||||
| Vested | (294,237 | ) | 26.48 | |||||
| Outstanding as of December 31, 2019 | 7,454 | 51.49 |
F-55
TRC Long Term Incentive Plan
The TRC LTIP is administered by the Compensation Committee of the Targa board of directors. Prior to the TRC/TRP Merger, the TRC LTIP provided for the grant of cash-settled performance units only. In connection with the TRC/TRP Merger, performance unit grant agreements were amended to convert TRP’s outstanding cash-settled performance unit obligation to cash-settled restricted stock units.
During 2018, the remaining 112,550 shares of cash-settled awards vested and we paid $6.9 million related to those awards.
The cash settled for the awards under TRC LTIP were $6.9 million and $4.1 million for 2018 and 2017.
Stock compensation expense under our plans totaled $61.8 million, $59.0 million, and $44.2 million for the years ended December 31, 2019, 2018, and 2017.
As of December 31, 2019, we have $97.7 million of unrecognized compensation expense associated with share-based awards and an approximate remaining weighted average vesting periods of 2.2 years related to our various compensation plans.
The fair values of share-based awards vested in 2019, 2018 and 2017 were $55.4 million, $18.8 million and $14.4 million. Cash dividends paid for the vested awards were $15.0 million, $3.5 million and $2.5 million for 2019, 2018 and 2017.
We recognized a $7.7 million windfall tax benefit for the year ended December 31, 2019, and $0.7 million and $3.1 million tax deficiencies as income tax expenses for the years ended December 31, 2018 and 2017.
Subsequent Events
In January 2020, the Compensation Committee of the Targa board of directors made the following awards under the 2010 TRC Plan.
| • | 29,472 shares of restricted stock to our outside directors that will vest in January 2021. |
|---|
| • | 283,015 shares of RSUs to executive management for the 2020 compensation cycle that will vest in January 2023. |
|---|
| • | 283,015 shares of PSUs to executive management for the 2020 compensation cycle that will vest in January 2023. |
|---|
| • | 81,336 shares of RSUs in lieu of cash bonus to one executive for the 2020 compensation cycle that will vest in January 2021. |
|---|
In January 2020, 25,344 shares of director grants vested with no shares withheld to satisfy tax withholding obligations.
In January 2020, 121,239 shares of 2017 PSUs vested with 30,804 shares withheld to satisfy tax withholding obligations.
In January 2020, total 111,808 shares of RSUs vested with 29,199 shares withheld to satisfy tax withholding obligations.
Targa 401(k) Plan
We have a 401(k) plan whereby we match 100% of up to 5% of an employee’s contribution (subject to certain limitations in the plan). We also contribute an amount equal to 3% of each employee’s eligible compensation to the plan as a retirement contribution and may make additional contributions at our sole discretion. All Targa contributions are made 100% in cash. We made contributions to the 401(k) plan totaling $23.7 million, $19.5 million and $16.5 million during 2019, 2018, and 2017.
F-56
Note 28 — Segment Information
We operate in two primary segments: (i) Gathering and Processing, and (ii) Logistics and Transportation (also referred to as the Downstream Business). Our reportable segments include operating segments that have been aggregated based on the nature of the products and services provided.
In the fourth quarter of 2019, we made the following changes to the presentation of our reportable segments:
| • | Renamed the Logistics and Marketing segment as Logistics and Transportation. The updated name better describes the business composition and activity of the segment given the recent completion of Grand Prix. The change in naming convention did not impact previously reported results for the segment. This segment is also referred to as the Downstream Business. |
|---|
| • | Due to changes in how our executive team evaluates segment performance, results of commodity derivative activities related to our equity volume hedges that are designated as accounting hedges are now reported in the Gathering and Processing segment. These hedge activities were previously reported in Other. Our prior period segment information has been updated to reflect the change. There was no impact to our Consolidated Statements of Operations. |
|---|
Our Gathering and Processing segment includes assets used in the gathering of natural gas produced from oil and gas wells and processing this raw natural gas into merchantable natural gas by extracting NGLs and removing impurities; and assets used for crude oil gathering and terminaling. The Gathering and Processing segment's assets are located in the Permian Basin of West Texas and Southeast New Mexico (including the Midland, Central and Delaware Basins); the Eagle Ford Shale in South Texas; the Barnett Shale in North Texas; the Anadarko, Ardmore, and Arkoma Basins in Oklahoma (including the SCOOP and STACK) and South Central Kansas; the Williston Basin in North Dakota (including the Bakken and Three Forks plays); and the onshore and near offshore regions of the Louisiana Gulf Coast and the Gulf of Mexico.
Our Logistics and Transportation segment includes the activities and assets necessary to convert mixed NGLs into NGL products and also includes other assets and value-added services such as transporting, storing, fractionating, terminaling and marketing of NGLs and NGL products, including services to LPG exporters; and certain natural gas supply and marketing activities in support of our other businesses. The associated assets are generally connected to and supplied in part by our Gathering and Processing segment and, except for pipelines and smaller terminals, are located predominantly in Mont Belvieu and Galena Park, Texas, and in Lake Charles, Louisiana.
Other contains the mark-to-market gains/losses related to derivative contracts that were not designated as cash flow hedges. Elimination of inter-segment transactions are reflected in the corporate and eliminations column.
Reportable segment information is shown in the following tables:
| Year Ended December 31, 2019 | ||||||||||||||||||||
|---|---|---|---|---|---|---|---|---|---|---|---|---|---|---|---|---|---|---|---|---|
| Gathering and Processing | Logistics and Transportation | Other | Corporate and Eliminations | Total | ||||||||||||||||
| Revenues | ||||||||||||||||||||
| Sales of commodities | $ | 1,101.6 | $ | 6,406.1 | $ | (113.9 | ) | $ | — | $ | 7,393.8 | |||||||||
| Fees from midstream services | 728.0 | 549.3 | — | — | 1,277.3 | |||||||||||||||
| 1,829.6 | 6,955.4 | (113.9 | ) | — | 8,671.1 | |||||||||||||||
| Intersegment revenues | ||||||||||||||||||||
| Sales of commodities | 2,628.4 | 132.2 | — | (2,760.6 | ) | — | ||||||||||||||
| Fees from midstream services | 7.4 | 28.7 | — | (36.1 | ) | — | ||||||||||||||
| 2,635.8 | 160.9 | — | (2,796.7 | ) | — | |||||||||||||||
| Revenues | $ | 4,465.4 | $ | 7,116.3 | $ | (113.9 | ) | $ | (2,796.7 | ) | $ | 8,671.1 | ||||||||
| Operating margin | $ | 1,006.4 | $ | 867.2 | $ | (113.9 | ) | $ | — | $ | 1,759.7 | |||||||||
| Other financial information: | ||||||||||||||||||||
| Total assets (1) | $ | 11,929.8 | $ | 6,741.8 | $ | 1.0 | $ | 142.5 | $ | 18,815.1 | ||||||||||
| Goodwill | $ | 45.2 | $ | — | $ | — | $ | — | $ | 45.2 | ||||||||||
| Capital expenditures | $ | 1,273.3 | $ | 1,412.2 | $ | — | $ | 23.0 | $ | 2,708.5 |
| (1) | Assets in the Corporate and Eliminations column primarily include tax-related assets, cash, prepaids and debt issuance costs for our revolving credit facilities. |
|---|
F-57
| Year Ended December 31, 2018 | ||||||||||||||||||||
|---|---|---|---|---|---|---|---|---|---|---|---|---|---|---|---|---|---|---|---|---|
| Gathering and Processing | Logistics and Transportation | Other | Corporate and Eliminations | Total | ||||||||||||||||
| Revenues | ||||||||||||||||||||
| Sales of commodities | $ | 1,228.2 | $ | 8,058.4 | $ | (7.9 | ) | $ | — | $ | 9,278.7 | |||||||||
| Fees from midstream services | 715.6 | 489.7 | — | — | 1,205.3 | |||||||||||||||
| 1,943.8 | 8,548.1 | (7.9 | ) | — | 10,484.0 | |||||||||||||||
| Intersegment revenues | ||||||||||||||||||||
| Sales of commodities | 3,636.0 | 317.1 | — | (3,953.1 | ) | — | ||||||||||||||
| Fees from midstream services | 7.2 | 30.8 | — | (38.0 | ) | — | ||||||||||||||
| 3,643.2 | 347.9 | — | (3,991.1 | ) | — | |||||||||||||||
| Revenues | $ | 5,587.0 | $ | 8,896.0 | $ | (7.9 | ) | $ | (3,991.1 | ) | $ | 10,484.0 | ||||||||
| Operating margin | $ | 939.2 | $ | 592.5 | $ | (7.9 | ) | $ | — | $ | 1,523.8 | |||||||||
| Other financial information: | ||||||||||||||||||||
| Total assets (1) | $ | 11,602.7 | $ | 5,180.6 | $ | 3.2 | $ | 151.7 | $ | 16,938.2 | ||||||||||
| Goodwill | $ | 46.6 | $ | — | $ | — | $ | — | $ | 46.6 | ||||||||||
| Capital expenditures | $ | 1,548.6 | $ | 1,767.0 | $ | — | $ | 12.1 | $ | 3,327.7 |
| (1) | Assets in the Corporate and Eliminations column primarily include tax-related assets, cash, prepaids and debt issuance costs for our revolving credit facilities. |
|---|
| Year Ended December 31, 2017 | ||||||||||||||||||||
|---|---|---|---|---|---|---|---|---|---|---|---|---|---|---|---|---|---|---|---|---|
| Gathering and Processing | Logistics and Transportation | Other | Corporate and Eliminations | Total | ||||||||||||||||
| Revenues | ||||||||||||||||||||
| Sales of commodities | $ | 774.0 | $ | 6,979.3 | $ | (2.2 | ) | $ | — | $ | 7,751.1 | |||||||||
| Fees from midstream services | 566.3 | 497.5 | — | — | 1,063.8 | |||||||||||||||
| 1,340.3 | 7,476.8 | (2.2 | ) | — | 8,814.9 | |||||||||||||||
| Intersegment revenues | ||||||||||||||||||||
| Sales of commodities | 3,154.2 | 321.9 | — | (3,476.1 | ) | — | ||||||||||||||
| Fees from midstream services | 6.9 | 28.0 | — | (34.9 | ) | — | ||||||||||||||
| 3,161.1 | 349.9 | — | (3,511.0 | ) | — | |||||||||||||||
| Revenues | $ | 4,501.4 | $ | 7,826.7 | $ | (2.2 | ) | $ | (3,511.0 | ) | $ | 8,814.9 | ||||||||
| Operating margin | $ | 776.4 | $ | 511.8 | $ | (2.2 | ) | $ | (0.1 | ) | $ | 1,285.9 | ||||||||
| Other financial information: | ||||||||||||||||||||
| Total assets (1) | $ | 10,789.0 | $ | 3,507.4 | $ | 0.1 | $ | 92.1 | $ | 14,388.6 | ||||||||||
| Goodwill | $ | 256.6 | $ | — | $ | — | $ | — | $ | 256.6 | ||||||||||
| Capital expenditures | $ | 1,008.9 | $ | 470.4 | $ | — | $ | 27.2 | $ | 1,506.5 | ||||||||||
| Business acquisitions | $ | 987.1 | $ | — | $ | — | $ | — | $ | 987.1 |
| (1) | Assets in the Corporate and Eliminations column primarily include tax-related assets, cash, prepaids and debt issuance costs for our revolving credit facilities. |
|---|
F-58
The following table shows our consolidated revenues by product and service for the periods presented:
| 2019 | 2018 | 2017 | ||||||||||
|---|---|---|---|---|---|---|---|---|---|---|---|---|
| Sales of commodities: | ||||||||||||
| Revenue recognized from contracts with customers: | ||||||||||||
| Natural gas | $ | 1,321.7 | $ | 1,810.0 | $ | 2,005.9 | ||||||
| NGL | 5,233.8 | 6,886.9 | 5,454.2 | |||||||||
| Condensate and crude oil | 716.1 | 457.9 | 196.0 | |||||||||
| Petroleum products | 126.3 | 196.1 | 144.7 | |||||||||
| 7,397.9 | 9,350.9 | 7,800.8 | ||||||||||
| Non-customer revenue: | ||||||||||||
| Derivative activities - Hedge | 138.0 | (39.7 | ) | (44.7 | ) | |||||||
| Derivative activities - Non-hedge (1) | (142.1 | ) | (32.5 | ) | (5.0 | ) | ||||||
| (4.1 | ) | (72.2 | ) | (49.7 | ) | |||||||
| Total sales of commodities | 7,393.8 | 9,278.7 | 7,751.1 | |||||||||
| Fees from midstream services: | ||||||||||||
| Revenue recognized from contracts with customers: | ||||||||||||
| Gathering and processing | 722.4 | 698.1 | 523.3 | |||||||||
| NGL transportation, fractionation and services | 169.4 | 154.6 | 170.7 | |||||||||
| Storage, terminaling and export | 356.4 | 313.0 | 300.8 | |||||||||
| Other | 29.1 | 39.6 | 69.0 | |||||||||
| Total fees from midstream services | 1,277.3 | 1,205.3 | 1,063.8 | |||||||||
| Total revenues | $ | 8,671.1 | $ | 10,484.0 | $ | 8,814.9 |
| (1) | Represents derivative activities that are not designated as hedging instruments under ASC 815. |
|---|
The following table shows a reconciliation of operating margin to net income (loss) for the periods presented:
| 2019 | 2018 | 2017 | |||||||||||||
|---|---|---|---|---|---|---|---|---|---|---|---|---|---|---|---|
| Reconciliation of reportable segment operating margin to income (loss) before income taxes: | |||||||||||||||
| Gathering and Processing operating margin | $ | 1,006.4 | $ | 939.2 | $ | 776.4 | |||||||||
| Logistics and Transportation operating margin | 867.2 | 592.5 | 511.8 | ||||||||||||
| Other operating margin | (113.9 | ) | (7.9 | ) | (2.2 | ) | |||||||||
| Depreciation and amortization expense | (971.6 | ) | (815.9 | ) | (809.5 | ) | |||||||||
| General and administrative expense | (280.7 | ) | (256.9 | ) | (203.4 | ) | |||||||||
| Impairment of property, plant and equipment | (243.2 | ) | — | (378.0 | ) | ||||||||||
| Impairment of goodwill | — | (210.0 | ) | — | |||||||||||
| Interest expense, net | (337.8 | ) | (185.8 | ) | (233.7 | ) | |||||||||
| Equity earnings (loss) | 39.0 | 7.3 | (17.0 | ) | |||||||||||
| Gain (loss) on sale or disposition of business and assets | (71.1 | ) | 0.1 | (15.9 | ) | ||||||||||
| Gain (loss) from sale of equity-method investment | 69.3 | — | — | ||||||||||||
| Gain (loss) from financing activities | (1.4 | ) | (2.0 | ) | (16.8 | ) | |||||||||
| Change in contingent considerations | (8.7 | ) | 8.8 | 99.6 | |||||||||||
| Other, net | (0.2 | ) | (3.5 | ) | (4.2 | ) | |||||||||
| Income (loss) before income taxes | $ | (46.7 | ) | $ | 65.9 | $ | (292.9 | ) |
F-59
Note 29 — Selected Quarterly Financial Data (Unaudited)
Our results of operations by quarter for the years ended December 31, 2019 and 2018 were as follows:
| First Quarter | Second Quarter | Third Quarter | Fourth Quarter | Total | |||||||||||||||
|---|---|---|---|---|---|---|---|---|---|---|---|---|---|---|---|---|---|---|---|
| 2019 | |||||||||||||||||||
| Revenues | $ | 2,299.4 | $ | 1,995.3 | $ | 1,902.5 | $ | 2,473.9 | $ | 8,671.1 | |||||||||
| Gross margin | 573.4 | 633.7 | 574.4 | 771.1 | 2,552.6 | ||||||||||||||
| Income (loss) from operations (1) | 61.3 | 113.7 | 41.6 | (23.7 | ) | 192.9 | |||||||||||||
| Net income (loss) | (24.7 | ) | 48.9 | 32.1 | (15.1 | ) | 41.2 | ||||||||||||
| Net income (loss) attributable to common shareholders | (69.7 | ) | (41.2 | ) | (78.6 | ) | (144.5 | ) | (334.0 | ) | |||||||||
| Net income (loss) per common share - basic | (0.30 | ) | (0.18 | ) | (0.34 | ) | (0.62 | ) | (1.44 | ) | |||||||||
| Net income (loss) per common share - diluted | (0.30 | ) | (0.18 | ) | (0.34 | ) | (0.62 | ) | (1.44 | ) | |||||||||
| 2018 | |||||||||||||||||||
| Revenues | $ | 2,455.6 | $ | 2,444.4 | $ | 2,986.4 | $ | 2,597.6 | $ | 10,484.0 | |||||||||
| Gross margin | 514.6 | 539.1 | 602.9 | 589.2 | 2,245.8 | ||||||||||||||
| Income (loss) from operations (2) | 86.3 | 155.4 | 76.7 | (80.9 | ) | 237.5 | |||||||||||||
| Net income (loss) | 38.9 | 121.1 | (11.2 | ) | (88.4 | ) | 60.4 | ||||||||||||
| Net income (loss) attributable to common shareholders | (7.0 | ) | 79.0 | (54.0 | ) | (137.3 | ) | (119.3 | ) | ||||||||||
| Net income (loss) per common share - basic | (0.03 | ) | 0.36 | (0.24 | ) | (0.60 | ) | (0.53 | ) | ||||||||||
| Net income (loss) per common share - diluted (3) | (0.03 | ) | 0.35 | (0.24 | ) | (0.60 | ) | (0.53 | ) |
| (1) | Includes a non-cash pre-tax impairment charge of $229.0 million in the fourth quarter of 2019. See Note 6 — Property, Plant and Equipment and Intangible Assets. |
|---|
| (2) | Includes a non-cash pre-tax impairment charge of $210.0 million in the fourth quarter of 2018. See Note 7 – Goodwill. |
|---|
| (3) | Includes dilutive effects of common stock equivalents in the second quarter of 2018. |
|---|
Note 30 — Condensed Parent Only Financial Statements
The condensed parent only financial statements represent the financial information required by Rule 5-04 of the Securities and Exchange Commission Regulation S-X for Targa Resources Corp.
In the condensed financial statements, Targa’s investments in consolidated subsidiaries are presented under the equity method of accounting. Under this method, the assets and liabilities of affiliates are not consolidated. The investments in net assets of the consolidated subsidiaries are recorded in the balance sheets. The income (loss) from operations of the consolidated subsidiaries is reported as equity in income (loss) of consolidated subsidiaries. Other comprehensive income has been adjusted for Targa’s share of the investees’ currently reported other comprehensive income.
F-60
A substantial amount of Targa’s operating, investing and financing activities are conducted by its affiliates. The condensed financial statements should be read in conjunction with Targa’s consolidated financial statements, which begin on page F-1 in this Annual Report.
| TARGA RESOURCES CORP. | |||||||||
|---|---|---|---|---|---|---|---|---|---|
| PARENT ONLY | |||||||||
| CONDENSED BALANCE SHEETS | |||||||||
| December 31, | |||||||||
| 2019 | 2018 | ||||||||
| ASSETS | |||||||||
| Investment in consolidated subsidiaries | $ | 5,643.4 | $ | 6,757.0 | |||||
| Deferred income taxes | 53.8 | 46.7 | |||||||
| Debt issuance costs | 4.0 | 5.1 | |||||||
| Other long-term assets | 9.8 | — | |||||||
| Total assets | $ | 5,711.0 | $ | 6,808.8 | |||||
| LIABILITIES, SERIES A PREFERRED STOCK AND OWNERS' EQUITY | |||||||||
| Accrued current liabilities | $ | 31.6 | $ | 36.8 | |||||
| Long-term debt | 435.0 | 435.0 | |||||||
| Other long-term liabilities | 44.8 | 11.9 | |||||||
| Contingencies | |||||||||
| Series A Preferred 9.5% Stock, net of discount | 278.8 | 245.7 | |||||||
| Targa Resources Corp. stockholders' equity | 4,920.8 | 6,079.4 | |||||||
| Total liabilities, Series A Preferred Stock and owners' equity | $ | 5,711.0 | $ | 6,808.8 |
| TARGA RESOURCES CORP. | ||||||||||||||
|---|---|---|---|---|---|---|---|---|---|---|---|---|---|---|
| PARENT ONLY | ||||||||||||||
| CONDENSED STATEMENTS OF OPERATIONS AND COMPREHENSIVE INCOME (LOSS) | ||||||||||||||
| Year Ended December 31, | ||||||||||||||
| 2019 | 2018 | 2017 | ||||||||||||
| Equity in net income (loss) of consolidated subsidiaries | $ | (186.2 | ) | $ | 27.4 | $ | 103.3 | |||||||
| General and administrative expense | (13.1 | ) | (16.1 | ) | (12.9 | ) | ||||||||
| Income (loss) from operations | (199.3 | ) | 11.3 | 90.4 | ||||||||||
| Other income (expense): | ||||||||||||||
| Loss on debt extinguishment | — | (0.7 | ) | (5.9 | ) | |||||||||
| Interest expense | (17.0 | ) | (15.8 | ) | (15.9 | ) | ||||||||
| Income (loss) before income taxes | (216.3 | ) | (5.2 | ) | 68.6 | |||||||||
| Deferred income tax (expense) benefit | 7.1 | 6.8 | (14.6 | ) | ||||||||||
| Net income (loss) attributable to Targa Resources Corp. | (209.2 | ) | 1.6 | 54.0 | ||||||||||
| Other comprehensive income (loss) | (1.8 | ) | 129.4 | 8.4 | ||||||||||
| Total comprehensive income (loss) | $ | (211.0 | ) | $ | 131.0 | $ | 62.4 | |||||||
| Dividends on Series A Preferred Stock | 91.7 | 91.7 | 91.7 | |||||||||||
| Deemed dividends on Series A Preferred Stock | 33.1 | 29.2 | 25.7 | |||||||||||
| Net income (loss) attributable to common shareholders | (334.0 | ) | (119.3 | ) | (63.4 | ) | ||||||||
| Net income (loss) attributable to Targa Resources Corp. | $ | (209.2 | ) | $ | 1.6 | $ | 54.0 |
F-61
| TARGA RESOURCES CORP. | |||||||||||||||
|---|---|---|---|---|---|---|---|---|---|---|---|---|---|---|---|
| PARENT ONLY | |||||||||||||||
| CONDENSED STATEMENTS OF CASH FLOWS | |||||||||||||||
| Year Ended December 31, | |||||||||||||||
| 2019 | 2018 | 2017 | |||||||||||||
| Net cash provided by operating activities | $ | 48.3 | $ | 55.2 | $ | 115.1 | |||||||||
| Cash flows from investing activities | |||||||||||||||
| Advances to consolidated subsidiaries | (222.5 | ) | (714.5 | ) | (1,656.9 | ) | |||||||||
| Distributions from consolidated subsidiaries (1) | 1,152.4 | 891.1 | 744.0 | ||||||||||||
| Net cash provided by (used in) investing activities | 929.9 | 176.6 | (912.9 | ) | |||||||||||
| Cash flows from financing activities | |||||||||||||||
| Proceeds from long-term debt borrowings | (450.0 | ) | 365.0 | 965.0 | |||||||||||
| Repayments of long-term debt | 450.0 | (365.0 | ) | (965.0 | ) | ||||||||||
| Costs incurred in connection with financing arrangements | — | (8.5 | ) | (16.0 | ) | ||||||||||
| Transaction costs incurred related to sale of ownership interests | (10.8 | ) | — | — | |||||||||||
| Proceeds from issuance of common stock, preferred stock and warrants | — | 689.0 | 1,660.4 | ||||||||||||
| Repurchase of common stock | (13.9 | ) | (4.0 | ) | (3.4 | ) | |||||||||
| Dividends paid to common and preferred shareholders | (953.5 | ) | (908.3 | ) | (843.2 | ) | |||||||||
| Net cash provided by (used in) financing activities | (978.2 | ) | (231.8 | ) | 797.8 | ||||||||||
| Net increase (decrease) in cash and cash equivalents | — | — | — | ||||||||||||
| Cash and cash equivalents - beginning of year | — | — | — | ||||||||||||
| Cash and cash equivalents - end of year | $ | — | $ | — | $ | — |
(1) Amounts reflect distributions from consolidated subsidiaries in excess of earnings. Total distributions from consolidated subsidiaries were $1,152.4 million, $918.5 million and $847.3 million for the years ended December 31, 2019, 2018 and 2017.
F-62
Previous: Item 16. Form 10-K Summary