 filings.tools
Item 11. Executive Compensation.
115K characters. Original on sec.gov · Markdown
Item 11. Executive Compensation.
COMPENSATION DISCUSSION AND ANALYSIS
EXECUTIVE COMPENSATION
2019 CD&A At-A-Glance
This year’s Compensation Discussion and Analysis (CD&A) reviews the objectives and elements of Targa’s executive compensation program and discusses the 2019 compensation earned by our Named Executive Officers (NEOs). It also explains the actions the Compensation Committee took based on its ongoing commitment to consider shareholder feedback and to ensure our senior leadership team remains focused on the seamless execution of our business strategy and delivering shareholder value over the long-term. During 2019 and early 2020, we:
| ✓Conducted a major shareholder outreach campaign, with a significant focus on executive compensation matters | •Reached out to each of our top 50 shareholders, representing more than 80% of shares outstanding |
| ✓Continued our senior leadership transition plan, which is part of our comprehensive, ongoing multi-year succession planning strategy overseen by our Board of Directors | •Announced the transitions of Mr. Perkins, 2019 CEO, to Executive Chairman (succeeding Mr. Whalen) and Mr. Meloy, 2019 President, to CEO (succeeding Mr. Perkins) |
| ✓Did not grant any special, one-time equity awards | •Reinforced that special, one-time equity award grants are not a regular feature of our program and are not expected to be a material feature of our program going forward |
| ✓Engaged a new independent compensation consulting firm | •Retained Pearl Meyer to gain further insight on current pay practices to ensure that our program effectively balances competitive market practices, investor expectations, best-practice governance standards and our business strategy |
| ✓Updated the compensation peer group to better align with market | •Reduced number of peer companies by consolidating to a simplified, single group |
| ✓Implemented a simplified, single, three-year performance period for long-term equity incentives | •PSUs are earned and vest at the end of a three-year performance period based on relative Total Shareholder Return (TSR) |
| ✓Set target payout under our long-term incentive plan at 55th percentile | •PSUs are not earned at target unless we beat the median of our performance peers |
| ✓Adopted a formal, comprehensive clawback policy that better aligns with best practices | •All performance-based incentive awards or payments (both short term cash and long-term equity) for our Section 16 officers may be subject to clawback in the event of restatement of financial results or other events that negatively impact our company |
| ✓Improved our compensation disclosure with respect to annual incentives | •Provided clearer, simplified, more transparent and shareholder-friendly communication about how annual incentives are determined |
| ✓Eliminated single-trigger equity vesting upon a change-in-control (CIC) for our NEOs | •All equity incentive awards to our NEOs starting in 2020 will have double-trigger vesting following a CIC |
More details about our shareholder outreach efforts, our 2019 business achievements and the resulting compensation actions taken by the Compensation Committee are in the following pages of our CD&A.
2019 Named Executive Officers
| Name | Position as of December 31, 2019 | |
| Joe Bob Perkins | Chief Executive Officer (CEO) | |
| Matthew J. Meloy | President | |
| Jennifer R. Kneale | Chief Financial Officer (CFO) | |
| Patrick J. McDonie | President – Gathering and Processing | |
| D. Scott Pryor | President – Logistics and Transportation | |
| Robert M. Muraro | Chief Commercial Officer |
Leadership Transition
As part of a leadership transition plan announced in July 2019, Matthew J. Meloy will become our Chief Executive Officer effective March 1, 2020 at which time Joe Bob Perkins, our former Chief Executive Officer, will become Executive Chairman of our Board of Directors.
Some of the changes discussed in this CD&A regarding compensation opportunities for 2020 reflect this leadership transition and continued work by the Committee to ensure that compensation opportunities truly reflect market median practice for each of our NEOs.
BOARD RESPONSIVENESS TO SHAREHOLDER FEEDBACK
We regularly meet with our shareholders to discuss business topics, seek feedback on our performance, and address other matters such as executive compensation. We increased the focus and intensity of our stockholder engagement as a result of our most recent say-on-pay vote, which yielded approximately 60% support for our executive compensation program. With a desire to broaden our perspective and improve our communications related to executive compensation programs and decisions, governance, sustainability and other related matters, we plan to engage in annual outreach with our largest shareholders specifically focused on those topics. As part of this annual outreach in 2019 we contacted our 50 largest stockholders, representing more than 80% of our outstanding shares as of June 30, 2019. We held discussions with 25 shareholders aggregating to more than 60% of our outstanding shares. These discussions typically included some combination of our lead independent director (who is also a member of the Compensation Committee), our CEO, CFO, and Senior Director of Finance and Investor Relations. Insights from these meetings were shared with our full Board. Through these exchanges, we gained greater appreciation for our shareholder’s views on how we are managing our programs, where we can strengthen our plan designs, and where we can be clearer in our disclosures about how certain aspects of our compensation programs work.
In the third quarter of 2019 the Compensation Committee retained Pearl Meyer, a leading independent compensation consulting firm, to gain further insight on current pay practices and to help ensure that our approach going forward effectively balances competitive market practices, stockholder expectations, best-practice governance standards, and our business strategy. Pearl Meyer was involved in our preparations for the shareholder outreach discussed above, and they were also involved in assessing the feedback gathered from those discussions.
The result of these efforts includes changes to our programs that more closely align with market best practices and reflect shareholder feedback. We executed on an aggressive, yet thoughtful, implementation timeline to respond to our stakeholders’ priorities, while mitigating any avoidable disruption to the business. We believe those efforts are well summarized in the table below, which includes an overview of feedback from our key stakeholders, and our response to that feedback:
| What We Heard | How We Responded |
| Concern regarding large one-time grant during 2018 | These types of awards are not part of our regular practice. No such one‐time awards were granted to any executive officer during 2019 and are not expected to be a material feature of our program going forward. |
| Annual incentives are discretionary and difficult to understand | In this CD&A, we have improved and simplified the description of how annual incentives work and have provided more clarity around the design, rigor and administration of the 2019 annual incentive plan. We have also applied formal weights to specific performance categories, with an emphasis on enterprise-wide financial performance, in order to improve transparency. |
| Including multiple annual performance periods in the assessment of performance for our long-term performance share unit (PSU) plan was viewed by some observers as partially short term | Starting with awards granted after January 1, 2020, PSUs under the long-term equity incentive plan will vest based on Total Shareholder Return (TSR) relative to a performance peer group at the end of a single three‐year performance measurement period. |
| There needs to be a sufficiently robust market-based clawback policy | Effective December 5, 2019, our Board adopted a market-based clawback policy such that all performance-based incentive awards or payments (both short term cash and long term equity) for our Section 16 officers may be subject to clawback in the event of a material restatement of financial results or conduct by a Section 16 officer that materially and negatively impacts our stock or financial performance |
| Using multiple peer groups for compensation comparisons seems overly complicated | For 2020, we developed a simplified Compensation Peer Group to more closely align with our industry and operations, and to provide a more focused market reference point with a better overall correlation to our organization. |
| Single-trigger vesting of equity upon a CIC is no longer typical market practice | Beginning with 2020 grants, all equity incentive awards to our NEOs will have double-trigger vesting in the context of a CIC |
2019 EXECUTIVE COMPENSATION PROGRAM SNAPSHOT
Compensation Philosophy and Guiding Principles
The philosophy underlying our executive compensation program is to employ the best leaders in our industry to ensure we execute on our business goals, promote both short-and long-term profitable growth of the Company and create long-term shareholder value. As such, our program is grounded in the following principles:
| • | Competition with Peers. Our executive compensation program should enable us to attract and retain key executives by providing a total compensation program that is competitive with the market in which we compete for executive talent, which encompasses not only diversified midstream companies but also other companies in the energy industry. |
|---|
| • | Accountability for Performance*.* Our executive compensation program should ensure an alignment between our strategic, operational and financial performance and the total compensation received by our NEOs. This includes providing compensation for performance that reflects individual and company performance both in absolute terms and relative to our Peer Group. |
|---|
| • | Alignment with Shareholder Interests*.* Our executive compensation program should ensure a balance between short-term and long-term compensation while emphasizing at-risk or variable compensation. Providing compensation that is based on our performance acts as a valuable means of supporting our strategic goals and business objectives and aligning the interests of our NEOs with those of our shareholders. |
|---|
Elements of Pay
Our compensation philosophy is supported by the following principal pay elements:
| Element | Key Characteristics | Grounding Principles | ||
| Competition | Accountability | Shareholder Alignment | ||
| Base Salary | •Annual fixed cash compensation •Critical factor in attracting and retaining qualified talent | ✓ | ||
| Annual Incentives | •Annual variable cash award •Awards are tied to achievement of key financial, operational, and strategic objectives •Based upon a rigorous, holistic evaluation of performance, ultimately subject to Compensation Committee business judgement | ✓ | ✓ | ✓ |
| Long-Term Incentives | •Provided through a combination of: •50% Performance share units (PSUs) •50% Restricted stock units (RSUs) •Promotes alignment with shareholders by tying a majority of NEO compensation to creation of long-term value and by encouraging NEOs to build meaningful equity ownership stakes | ✓ | ✓ | ✓ |
Pay Mix
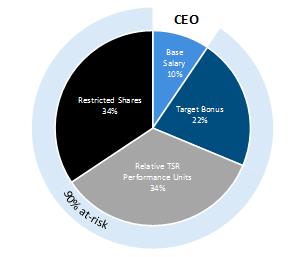
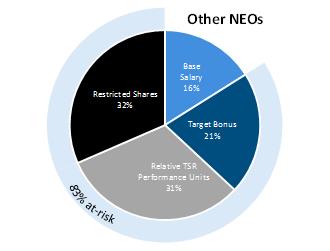
We remain committed to our emphasis on at-risk, incentive-based pay – with payouts tied to our performance against several strategic and financial objectives including relative TSR, and realizable pay heavily dependent upon our ability to grow shareholder value. The charts below show the mix of total direct compensation of our CEO and our other NEOs for 2019. These charts illustrate that a majority of NEO total direct compensation is at-risk (90% for our CEO and an average of 84% for our other NEOs).
| TARGET TOTAL DIRECT COMPENSATION MIX | |
 |  |
CEO Compensation at a Glance
Movement toward better alignment with market.
The chart below provides a five-year comparison of CEO actual total compensation to peer group median levels of CEO compensation. As shown, CEO compensation has historically been heavily equity-based, including bonuses typically taken in the form of equity. The pattern of CEO pay shown on the chart reflects in part the Compensation Committee’s efforts over time to better align compensation opportunities for our CEO with the market median.

The market median reference points shown on the chart reflect peer group compensation data provided to the Compensation Committee in each year by the Committee’s independent consultant.
The Compensation Committee generally desires to be competitive at the market median for total compensation opportunities. Changes to pay levels discussed in this CD&A reflect in part the Committee’s efforts to align NEO compensation more closely with the market median.
Good Governance Foundation
The following practices and policies in our executive compensation program promote sound compensation governance and align the interests of our shareholders and executives:
| What We Do | What We Don’t Do |
| ✓Compare total CEO compensation to industry peers ✓Pay a majority of NEO compensation in the form of long-term incentives ✓Tie performance-based units to relative TSR ✓Maintain a comprehensive clawback policy aligned with industry norms* ✓Complete an annual compensation risk assessment ✓Maintain executive and director share ownership guidelines ✓Retain an independent consultant to advise the Committee | •No employee contracts •No single-trigger change-in-control severance arrangements •No single-trigger change-in-control vesting for NEO equity awards* •No excise tax gross-ups •No perquisites or supplemental benefits not generally available to other employees •No hedging or purchasing of Company stock on margin •No executive compensation practices that promote excessive risk |
*New for 2020
Sustainability and ESG
As an energy infrastructure company focused on the transportation and storage of energy products, our operations are essential to the delivery of energy efficiently, safely, and reliably across the United States. At Targa, we have invested billions of dollars each year to build new and expanded assets to deliver energy products that sustain and enhance the quality of life of our citizenry.

We strive to conduct our business safely and with integrity, creating lasting benefits to our stakeholders, including our investors, lenders, customers, employees, business partners, regulators and the communities in which we live and work. The Company’s performance on sustainability factors played a role in 2019 compensation decisions and will continue to play a role in the Compensation Committee’s evaluation of annual incentive compensation.
Throughout our organization, from the top down, we are committed to maintaining and operating our assets safely, efficiently, and in an environmentally responsible manner. This is a commitment that starts with and is maintained by our Board of Directors, where the full Board of Directors is committed to holding the senior management team accountable for upholding commitments to continued efforts around sustainability and ESG, including through administration of the Company’s annual incentive program.
We invite you to review our Sustainability Report, which is available on the Company’s website at http://www.targaresources.com/sustainability/sustainability-report.
WHAT GUIDES OUR PROGRAM
The Decision Making Process
The Role of the Compensation Committee. The Compensation Committee oversees the executive compensation program for our NEOs. The Compensation Committee is comprised of independent, non-employee members of the Board. The Compensation Committee works very closely with its independent consultant and senior management to examine the effectiveness of the Company’s executive compensation program throughout the year. Details of the Compensation Committee’s authority and responsibilities are specified in the Compensation Committee’s charter, which may be accessed at our website, www.targaresources.com, by clicking “Investors,” and then “Corporate Governance.”
The Role of Senior Management. Members of our senior management team attend regular meetings where executive compensation, Company and individual performance, and competitive compensation levels and practices are discussed and evaluated. Only the Compensation Committee members are allowed to vote on decisions regarding NEO compensation.
The CEO and President review their recommendations pertaining to NEO pay with the Compensation Committee providing transparency and oversight. Decisions on non-NEO pay are made by the CEO and President. The CEO and President do not participate in the deliberations of the Compensation Committee regarding their own compensation. The members of the Compensation Committee make all final determinations regarding CEO and NEO compensation.
The Role of the Independent Consultant. The Compensation Committee has the authority to engage and retain an independent compensation consultant to provide independent counsel and advice. At least annually, the Compensation Committee formally conducts an evaluation as to the effectiveness of the independent compensation consultant and periodically requests proposals from other potential consulting firms to ensure the independent compensation consultant is meeting its needs. For 2019, the Compensation Committee continued its engagement with BDO USA, LLP (“BDO”) as its independent compensation consultant for matters related to executive and non-management director compensation. BDO’s engagement ended in July 2019, and then the Compensation Committee retained the services of Pearl Meyer as its independent compensation consultant in September 2019 for the remainder of 2019 and for 2020.
Pearl Meyer was engaged in part to support the Compensation Committee’s efforts to conduct a comprehensive analysis of the current executive compensation program, which was in direct response to shareholder feedback following the Company’s 2019 Annual Meeting of Stockholders. Pearl Meyer was selected as the independent consultant after an extensive review process conducted by the Compensation Committee.
The Compensation Committee assessed the independence of BDO in 2018 and Pearl Meyer in 2019, as required under NYSE listing rules. The Compensation Committee has also considered and assessed all relevant factors, including but not limited to those set forth in Rule 10C-1(b)(4)(i) through (vi) under the Exchange Act, that could give rise to a potential conflict of interest with respect to the compensation consultants described above. Based on this review, we are not aware of any conflicts of interest raised by the work performed by BDO or Pearl Meyer that would prevent the consultants from serving as an independent advisor to the Compensation Committee.
The Role of Market References in Setting Compensation
2019 Compensation Peer Group. For purposes of setting compensation levels for 2019, the Compensation Committee worked with its independent compensation consultant, BDO, to review market surveys for similarly-sized companies and the compensation peer group compiled from public filings data to provide a reference and framework for decisions about the base salary and target annual and long-term incentives to be provided to each NEO. The Compensation Committee considers this information carefully and generally desires to be competitive at the market median for total compensation opportunities. However, in setting pay levels of our NEOs, the Committee considers a variety of additional factors, including individual performance, competencies, skills, future potential, prior experience, scope of responsibility and accountability within the organization.
Consistent with our historic practices, the 2019 compensation peer group used a combination of three comparator groups: (1) midstream companies, (2) exploration and production companies (E&Ps), and (3) energy utilities. These types of companies provided relevant reference points because they have similar or related operations, compete in the same or similar markets, face similar regulatory challenges and require similar skills, knowledge and experience of their executive officers as we require of our NEOs.
| 2019 Compensation Peer Group Companies | ||
| Midstream Companies | E&Ps | Energy Utilities |
| Buckeye Partners, L.P. | Apache Corporation | Ameren Corporation |
| Enable Midstream Partners, L.P. | Cabot Oil & Gas Corporation | Atmos Energy Corporation |
| Enbridge Energy Partners, L.P. | Chesapeake Energy Corporation | CenterPoint Energy, Inc. |
| Energy Transfer Equity, L.P. | Cimarex Energy Company | DTE Energy Company |
| EnLink Midstream Partners, L.P. | Concho Resources, Inc. | Enbridge Inc. |
| Enterprise Products Partners L.P. | Continental Resources, Inc. | Entergy Corporation |
| Genesis Energy, L.P. | Devon Energy Corporation | EQT Corporation |
| Kinder Morgan, Inc. | Diamondback Energy, Inc. | MDU Resources Group, Inc. |
| Magellan Midstream Partners, L.P. | EOG Resources, Inc. | National Fuel Gas Company |
| NuStar Energy L.P. | Hess Corporation | NiSource Inc. |
| ONEOK, Inc. | Marathon Oil Corporation | Public Service Enterprise Group, Inc. |
| Plains GP Holdings, L.P. | Murphy Oil Corporation | Sempra Energy |
| Tallgrass Energy Partners, LP | Newfield Exploration Company | The Southern Company |
| Williams Companies, Inc. | Noble Energy, Inc. | TransCanada Corporation |
| Parsley Energy, Inc. | Xcel Energy Inc. | |
| Pioneer Natural Resources Company | ||
| QEP Resources, Inc. | ||
| Range Resources Corporation | ||
| SM Energy Company | ||
| Southwestern Energy Company | ||
| WPX Energy, Inc. |
2020 Compensation Peer Group. For purposes of setting compensation levels for 2020 and in connection with our goal to improve our compensation programs, during 2019 the Compensation Committee worked closely with Pearl Meyer and senior management to develop a new peer group. This revised compensation peer group is more closely aligned with the Company’s industry classification and provides a single comparator group with an industry composition that is better correlated to our organization.
The 2020 compensation peer group consists of a mix of 18 midstream companies and E&Ps.
| 2020 Compensation Peer Group | |
| Buckeye Partners, L.P. | Magellan Midstream Partners, L.P. |
| Cheniere Energy, Inc. | Marathon Oil Corporation |
| Concho Resources, Inc. | Noble Energy, Inc. |
| Crestwood Equity Partners, L.P. | NuStar Energy L.P. |
| Devon Energy Corporation | ONEOK, Inc. |
| Energy Transfer Equity, L.P. | Parsley Energy, Inc. |
| Enterprise Products Partners L.P. | Pioneer Natural Resources Company |
| EnLink Midstream Partners, L.P. | Plains All American Pipeline, L.P. |
| Kinder Morgan, Inc. | Williams Companies, Inc. |
| 2020 Peer Data ($M) – Key Measures (1) | |||
| Revenue | Assets | Total Enterprise Value | |
| 75th Percentile | $10,822 | $32,868 | $45,600 |
| 50th Percentile | $7,236 | $20,581 | $21,748 |
| 25th Percentile | $4,117 | $10,005 | $12,163 |
| Targa | $8,980 | $17,569 | $18,242 |
| Percentile Rank | 63rd | 60th | 41st |
| (1) | As presented to the Compensation Committee in September 2019. Source: S&P Capital IQ |
|---|
2019 Business Overview
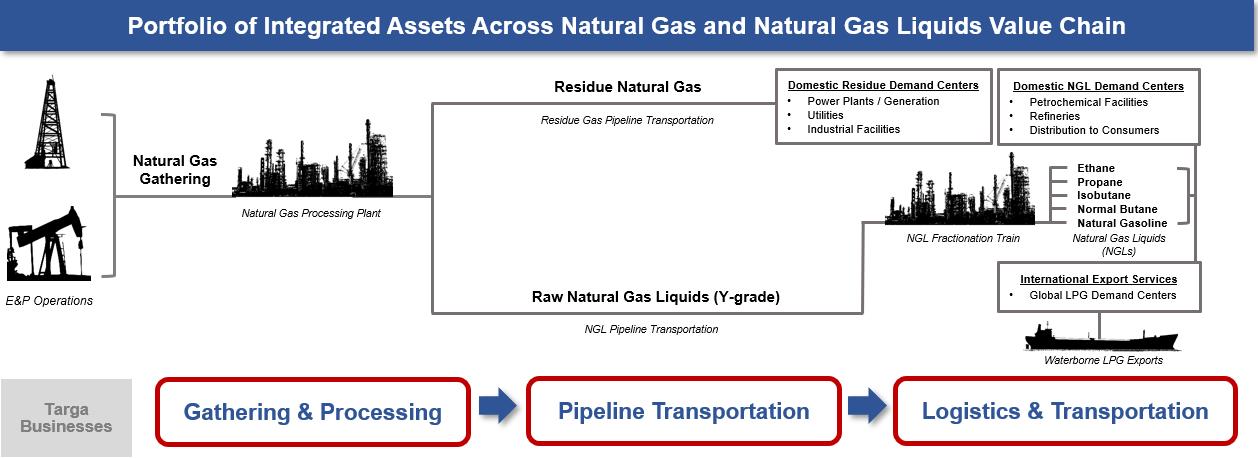
The transition of Targa into a fully integrated midstream company with scale and asset diversity is largely complete, with 2019 representing the key inflection point in our corporate life cycle. Since early 2017, we placed in-service approximately $4 billion of projects, including Grand Prix, one of the most strategic projects since our inception, which directly links much of our Gathering and Processing business with other parts of our Downstream business. Grand Prix had a gross cost of approximately $2 billion and is the single largest project in our history, placed in-service largely on-time and on-budget, with significant volumes flowing immediately.
As we look forward, the next phase for Targa is to optimize our existing asset base, and to continue to invest along our core value chain.
2019 EXECUTIVE COMPENSATION PROGRAM IN DETAIL
Base Salary
Base salary represents annual fixed compensation and is a standard element of compensation necessary to attract and retain executive leadership talent. In making base salary decisions, the Compensation Committee considers the CEO’s and President’s recommendations, as well as each NEO’s position and level of responsibility within the Company. The Compensation Committee takes into account factors such as relevant market data as well as individual performance and contributions.
For 2019, the Compensation Committee authorized base salary increases for all of the NEOs in order to align the total direct compensation of these individuals more closely with the total direct compensation provided to similarly situated executives at companies within our 2019 Peer Group, considering company size, and to reflect professional growth and the assumption of additional responsibilities. The 2019 base salary rates for our NEOs were as follows:
| NEO | Prior Salary | Base Salary Effective March 1, 2019 | Percent Increase (Approximate) |
| Joe Bob Perkins | $850,000 | $900,000 | 6% |
| Matthew J. Meloy | 525,000 | 600,000 | 14% |
| Jennifer R. Kneale | 350,000 | 400,000 | 14% |
| Patrick J. McDonie | 475,000 | 500,000 | 5% |
| D. Scott Pryor | 475,000 | 500,000 | 5% |
| Robert M. Muraro | 450,000 | 500,000 | 11% |
Changes in base salary for 2020 are largely reflective of change in role as part of our leadership transition, and a desire to ensure that total compensation opportunities for 2020 are better aligned with market median practice for each of our NEOs. The March 1, 2020 base salary rates for our current NEOs are as follows:
| NEO | Position as of March 1, 2020 | Base Salary Effective March 1, 2020 | Percent Increase/ (Decrease) |
| Matthew J. Meloy | CEO | $875,000 (1) | 46% |
| Joe Bob Perkins | Executive Chairman | 750,000 (2) | (17%) |
| Jennifer R. Kneale | CFO | 575,000 (3) | 44% |
| Patrick J. McDonie | President — G&P | 525,000 | 5% |
| D. Scott Pryor | President — Downstream | 525,000 | 5% |
| Robert M. Muraro | Chief Commercial Officer | 525,000 | 5% |
| (1) | Mr. Meloy’s base salary increase reflects the significant expansion of responsibilities that he will take on as the CEO following March 1, 2020. |
|---|
| (2) | Mr. Perkins’ base salary decrease reflects his transition to the Executive Chairman role effective March 1, 2020. |
|---|
| (3) | Ms. Kneale’s base salary increase reflects the multi-year transition of her compensation to a level closer to similarly situated officers in connection with her appointment as Chief Financial Officer on March 1, 2018 and reflects the continued expansion of her responsibilities. |
|---|
Annual Incentives
For 2019, our NEOs were eligible to receive annual incentive awards under the 2019 Annual Incentive Compensation Plan (the “2019 Bonus Plan”), which was approved by the Compensation Committee in January 2019. The funding of the bonus pool and the payment of individual bonuses to executive management, including our NEOs, are subject to the business judgement of the Compensation Committee (following recommendations from our CEO) and will generally be determined near or following the end of the year to which the bonus relates.
Target Bonus Amounts. Target bonus opportunities are expressed as a percentage of base salary and were established based on the NEO’s level of responsibility and ability to impact overall results. The Compensation Committee also considers market data in setting target bonus amounts. The 2019 target bonus opportunities were as follows:
| NEO | 2019 Target Bonus (as a % of Base Salary) | 2019 Target Bonus ($) | 2020 Target Bonus (as a % of Salary) | |
| Joe Bob Perkins | 230% | $2,070,000 | 125% | |
| Matthew J. Meloy | 200% | 1,200,000 | 200% | |
| Jennifer R. Kneale | 100% | 400,000 | 100% | |
| Patrick J. McDonie | 100% | 500,000 | 100% | |
| D. Scott Pryor | 100% | 500,000 | 100% | |
| Robert M. Muraro | 100% | 500,000 | 100% |
2019 Bonus Plan Funding Levels. Annual bonus awards are based upon a rigorous evaluation of results across a variety of financial, operational and strategic categories. Performance was measured against a combination of pre-established goals and key strategic business priorities within these categories and assessed based on a holistic evaluation by the Compensation Committee that reflects the complexity of our business and our desire to ensure that decision-making over the short-term remains focused on producing sustainable growth over the long term.
Success levels are evaluated based on past norms, expectations for growth, and unanticipated obstacles or opportunities that arise. Each of the categories in the plan are now given specific weightings: financial (60%), operational (30%), and sustainability (10%).
At the end of the performance year, the Compensation Committee determines the total amount to be allocated to the bonus pool based on its assessment of the Executive Management team’s achievements relative to the pre-established goals and our overall results for the year.
Evaluation of 2019 Performance
Our evaluation of performance in the annual incentive program includes consideration of performance on multiple factors within three general categories and with a safety category overlay:
| Category | What it includes | Why it is important |
| Financial Performance | •Adjusted EBITDA •Balance sheet management | Adjusted EBITDA and balance sheet management together emphasize the importance of profitable growth grounded in prudent fiscal management |
| Operational Performance | •Volume growth •Commercial execution •Capital discipline •Project execution | Stresses the importance of operational excellence and optimization of asset utilization through increasing volumes, while focused on commercial execution and capital discipline – key drivers of value creation |
| Sustainability | •Talent management and development •Environmental, social and governance (ESG) | Promotes focus on investment in human capital and on incorporating the interests of all key stakeholders in the execution of our business strategy to help ensure that annual performance leads to sustainable long-term growth |
| Safety | •A holistic scorecard including quantitative and qualitative evaluation of incident rates, severity, process improvement, etc. •Operates outside plan as a modifier that can reduce plan payout if performance is below expectations | Stresses critical nature of safe operations and reinforces philosophy that strong safety performance is an expectation and not a justification for increased incentive compensation |
The table below provides the more specific items within the first three general categories that our Compensation Committee utilized when setting and determining the 2019 bonuses.
| Category | Priorities/Goals | Achievements | Level of Performance |
| Financial Performance (60%) | EBITDA Goal: $1,300 million | •$1,436 million adjusted EBITDA achievement, despite 15% drop in natural gas and 33% drop in NGL prices during year •Highest EBITDA in Targa’s history | Far Exceeds |
| Balance Sheet Management: •Minimize external public equity needs •Maintain adequate liquidity to fund ongoing growth program | •Raised $1.7 billion of capital at accretive values (higher than comparable trading multiples) from (i) sale of a 45% interest in Badlands and (ii) sale of an equity method investment •No equity issued for 2019, self-funded for equity capital •Raised $2.5 billion from two senior notes offering at attractive terms in volatile market | Exceeds | |
| Operational Performance (30%) | Volume Growth Goal: •20% Permian •10% total Field G&P Grand Prix •Exceed initial expectations for volumes | •Permian: 29% increase in 2019 •Total Field G&P: 12% increase in 2019 •Grand Prix volumes for 2019 were substantially higher than initial expectations | Far Exceeds |
| Capital Spending Growth Capital: •$2.3 - $2.4 billion of growth capex •Improve oversight, process on efficiency of capital spending | •Growth capex of just under $2.3 billion •New planning/budgeting approach focused on capital allocation •Implemented new internal processes to provide top-down oversight on spending | Meets | |
| Commercial Execution: Focus on deals that leverage our integrated platform and increase our fee-based margin | •Successfully executed additional third-party transportation and fractionation contracts of significant size and value •Fee based margin increased from 70% in 2018 to 80% in 2019 | Exceeds | |
| Commercial Execution: Complete 2019 growth program safely and on time | •Placed in service over $4 billion of new projects within budget expectations in the aggregate with strong timing and budgetary execution despite regulatory and other challenges | Meets | |
| Sustainability (10%) | Talent management and development Environmental impact | •Maintained necessary staffing levels and held turnover at 12% flat despite tight labor market •Added over 150 additional headcount for new facilities •Completed Targa’s initial sustainability ESG report | Meets |
2019 Bonus Plan Payouts. Based on the assessment described above for 2019, the Compensation Committee arrived at an annual bonus pool equal to 1.6 times the target level under the 2019 Bonus Plan. The Compensation Committee considered the Company’s safety performance as part of their overall evaluation. Our safety performance for 2019 included improvements in process and communication and reduction in overall incident rate, but also included an increase in severity. As a result of their review of safety performance, the Compensation Committee did not apply a factor to the calculated 1.6 payout shown in the table below.
| Consolidated Performance | Payout Factor | Weight | Weighted Factor | ||
| Financial | Far Exceeds | 1.8 | 60% | 1.1 | |
| Operational | Exceeds | 1.4 | 30% | 0.4 | |
| Sustainability | Meets | 1.0 | 10% | 0.1 | |
| TOTAL CALCULATED PAYOUT | 1.60 |
Individual Performance Multiplier. The Compensation Committee also evaluated the executive group and each officer’s individual performance for the year and determined that there were no special circumstances that would be quantified applicable to any named executive officer’s performance for 2019. As a result, the Compensation Committee determined that a performance multiplier of 1.0x should be applied to each named executive officer for 2019 based on the officer’s individual performance and performance as part of the executive team.
Settlement of 2019 Bonus Awards. The following table reflects the actual awards received by our NEOs under the 2019 Bonus Plan:
| NEO | Target Bonus ($) | Individual Performance Factor | Company Performance Factor | Actual Bonus Paid (Cash) | Actual Bonus Paid (Shares)(1) |
| Joe Bob Perkins | $2,070,000 | 1.00 | 1.6 | $ ⸻ | $3,312,000 |
| Matthew J. Meloy | 1,200,000 | 1.00 | 1.6 | 1,920,000 | ⸻ |
| Jennifer R. Kneale | 400,000 | 1.00 | 1.6 | 640,000 | ⸻ |
| Patrick J. McDonie | 500,000 | 1.00 | 1.6 | 800,000 | ⸻ |
| D. Scott Pryor | 500,000 | 1.00 | 1.6 | 800,000 | ⸻ |
| Robert M. Muraro | 500,000 | 1.00 | 1.6 | 800,000 | ⸻ |
| (1) | Mr. Perkins took 100% of this approved 2019 bonus in the form of restricted stock units that vest one year from the date of grant. |
|---|
2020 Target Bonus Opportunities. The table below summarizes target bonus opportunities for our NEOs for 2020.
| NEO | Position as of March 1, 2020 | 2020 Target Bonus (as a % of Base Salary) | 2020 Target Bonus ($) |
| Matthew J. Meloy | CEO | 200% | $1,750,000 |
| Joe Bob Perkins | Executive Chairman | 125% | 937,500 |
| Jennifer R. Kneale | CFO | 100% | 575,000 |
| Patrick J. McDonie | President — G&P | 100% | 525,000 |
| D. Scott Pryor | President — Downstream | 100% | 525,000 |
| Robert M. Muraro | Chief Commercial Officer | 100% | 525,000 |
Long-Term Equity Incentives
Equity compensation directly aligns the interests of the NEOs with those of our stockholders. In 2019, the Company granted equity compensation under our Stock Incentive Plan as follows:
| Type of Equity Award | Weight | Description |
| Performance Share Units (PSUs) | 50% | Vest at the end of three years contingent on the achievement of the Company’s total shareholder return (TSR) relative to the TSR of a specified comparator group of publicly-traded midstream companies (the “LTIP Peer Group”) measured over designated periods |
| Restricted Stock Units (RSUs) | 50% | Vest in full at the end of a three-year period based solely on continued service; RSUs help to secure and retain executives and instill an ownership mentality |
Target long-term equity incentive awards are expressed as a total dollar value based on a percentage of the NEO’s base salary. For awards granted in 2019, the specified percentage of each NEO’s base salary used for purposes of determining the amount of long-term equity incentive awards granted and the corresponding dollar values are set forth in the following table:
| NEO | Target Award (as a % of Base Salary) | Target Award ($ Value) | Number of RSUs Granted (#) | Number of PSUs Granted (#) |
| Joe Bob Perkins | 725% | $6,525,000 | 79,496 | 79,496 |
| Matthew J. Meloy | 500% | 3,000,000 | 36,550 | 36,550 |
| Jennifer R. Kneale | 400% | 1,600,000 | 19,493 | 19,493 |
| Patrick J. McDonie | 325% | 1,625,000 | 19,798 | 19,798 |
| D. Scott Pryor | 325% | 1,625,000 | 19,798 | 19,798 |
| Robert M. Muraro | 325% | 1,625,000 | 19,798 | 19,798 |
The number of shares subject to each award is determined by dividing the total dollar value allocated to the award by the ten-day average closing price of the shares measured over a period prior to the date of grant.
2019 PSU Plan Design
PSUs vest dependent on the satisfaction of certain service-related conditions and the Company’s TSR relative to the TSR of the members of the LTIP Peer Group measured over designated periods. For the 2019 PSUs, the LTIP Peer Group was composed of the following companies as of the date of grant:
| 2019 LTIP Peer Group | |
| Buckeye Partners, L.P. | NuStar Energy, L.P. |
| Crestwood Equity Partners LP | ONEOK, Inc. |
| DCP Midstream Partners L.P. | Plains GP Holdings, L.P. |
| Enable Midstream Partners L.P. | Tallgrass Energy, L.P. |
| EnLink Midstream Partners L.P. | Williams Companies, Inc. |
| Genesis Energy, L.P. |
The LTIP Peer Group is a subset of the midstream companies included in the 2019 compensation peer group. The LTIP Peer Group is designed to include only those midstream oil & gas companies closest in size to the Company for purpose of the TSR comparison. The Compensation Committee has the ability to modify the LTIP Peer Group in the event a company listed above ceases to be publicly traded or another significant event occurs and a company is determined to no longer be one of the Company’s peers. The Compensation Committee made a modification to the 2019 LTIP Peer Group due to an acquisition of one of the peer companies that occurred during 2019.
The overall performance period for the 2019 PSUs begins on January 1, 2019 and ends on December 31, 2021. The TSR performance factor is determined by the Compensation Committee at the end of the overall performance period based on relative TSR performance over the designated weighting periods as follows:
| Weighting Period | Percent of Award |
| Annual relative TSR for Year 1 | 25% |
| Annual relative TSR for Year 2 | 25% |
| Annual relative TSR for Year 3 | 25% |
| Cumulative relative TSR over the three-year performance period | 25% |
| 100% |
With respect to each weighting period, the Compensation Committee determines the “guideline performance percentage,” which could range from 0% to 250%, based upon the Company’s relative TSR performance for the applicable period compared to the LTIP Peer Group as follows:
| Relative TSR Attainment | Guideline Performance Percentage* (% of target) |
| Below 25th percentile | 0% |
| 25th percentile | 50% |
| 50th Percentile | 100% |
| 75th percentile or higher | 250% |
- Payout for performance between threshold and target or between target and maximum will be calculated using straight line interpolation.
Overall TSR performance results will be calculated by averaging the guideline performance percentage for each weighting period. The average performance percentage may then be decreased or increased by the Compensation Committee in order to address factors such as changes to the performance peers, anomalies in trading during the selected trading days or other business performance matters. For these purposes, TSR performance is typically calculated as follows, using a 10-day average stock price at the beginning and following the end of each performance period:
| TSR = | Average closing price at end of period + dividends paid over period |
| Average closing price at beginning of period |
Provided the NEO remains continuously employed through the end of 2021, then vesting will occur, as soon as practicable following December 31, 2021, when the Compensation Committee determines applicable performance levels. The NEO will receive PSUs equal to the target number awarded multiplied by the final Compensation Committee determined TSR performance factor. Vested PSUs will be settled by the issuance of Company common stock.
In addition, at the time the PSUs are settled, the NEOs would also receive a cash payment equal to the amount of cash dividends accrued with respect to a share of common stock over the three-year period, times the number of shares earned.
2017 – 2019 PSU Plan Payout
The PSUs granted to our NEOs in 2017 were structured similarly to the 2019 PSUs described above and had an aggregate performance period that ended on December 31, 2019. On January 16, 2020, our Compensation Committee determined that the overall vesting percentage that was earned for the 2017 PSUs was 120% of target grant amounts, and the corresponding shares became vested.
| Performance Period | Targa Percentile Rank | Weight | Percent of Target Earned |
| Year 1 TSR | 45th | 25% | 92% |
| Year 2 TSR | 56th | 25% | 130% |
| Year 3 TSR | 56th | 25% | 130% |
| Cumulative 3 year TSR | 56th | 25% | 130% |
| Weighted Average | 120% |
Due to the fact that vesting did not occur until our Compensation Committee determined the achievement of applicable performance goals at the beginning of 2020, these awards were still deemed to be “outstanding” as of December 31, 2019 for purposes of the compensation tables that follow this CD&A.
2020 – 2022 PSU Plan Design
In January 2020 we granted PSU awards to our NEOs that contained certain differences from the PSUs granted in prior years. The 2020 PSUs will measure performance over a single three-year performance period. We also made a change to our performance peer group, with TSR measured relative to the companies that make up the Alerian US Midstream Index (AMUS), using the following payout schedule:
| Relative TSR Attainment vs. Companies in the Alerian US Midstream Index | Guideline Performance Percentage (% of target) |
| Below 25th percentile | 0% |
| 25th percentile | 50% |
| 55th percentile | 100% |
| 75th percentile or higher | 250% |
As shown in the table, we also shifted our target payout to 55th percentile to ensure that a target payout requires performance above the median of our performance peers. Payout for performance between threshold and target or between target and maximum will be calculated using straight line interpolation.
OTHER EXECUTIVE COMPENSATION PRACTICES AND POLICIES
Stock Ownership Guidelines
In May 2017, our Compensation Committee adopted Stock Ownership Guidelines for our independent directors and officers. We believe that our Stock Ownership Guidelines align the interests of our named executive officers and independent directors with the interests of our stockholders. The guidelines below were established with advice from the Compensation Consultant and are believed to follow market standards.
| Ownership Requirement | |
| Chief Executive Officer | 5.0 x base salary |
| Other NEOs | 3.0 x base salary |
| Nonemployee Directors | 5.0 x annual cash retainer |
The CEO, executive officers and directors have five years from the date first subject to the guidelines to meet the applicable ownership levels. Stock owned directly by an officer or independent director as well as unvested restricted stock units will count for purposes of determining stock ownership levels.
Anti-Hedging and Anti-Margining Policy
All of our officers, employees and directors are subject to our Insider Trading Policy, which, among other things, prohibits officers, employees and directors from engaging in certain short-term or speculative transactions involving our securities. Specifically, the policy provides that officers, employees and directors may not engage in the following transactions: (i) the purchase of our common stock on margin, (ii) short sales of our common stock, or (iii) the purchase or sale of options of any kind, whether puts or calls, or other derivative securities, relating to our common stock.
Recoupment Clawback Policy
In December 2019, our Board adopted an executive compensation clawback policy which provides that performance-based incentive compensation paid to our officers who are subject to Section 16 of the Exchange Act may be recovered by us in the event of a restatement of the Company's financial results or under certain other circumstances, such as an officer’s misconduct that results in an adverse impact on the Company’s financial performance. In connection with such events, the Compensation Committee will have the right to require the reimbursement or forfeiture of any performance-based incentive payments, including payments under the annual incentive plan and performance-based PSUs, paid to the officer to the extent permitted by applicable law. The clawback policy will apply to all performance-based incentive compensation granted following the adoption of the clawback policy.
In addition, the Company will take action to modify the clawback policy to comply with Section 954 of the Dodd-Frank Wall Street Reform and Consumer Protection Act of 2010 should the SEC determine and implement final rules. Furthermore, restricted stock, restricted stock unit and performance share unit agreements covering awards made to our named executive officers and other
applicable employees include language providing that any compensation, payments or benefits provided under such an award (including profits realized from the sale of earned shares) are subject to clawback to the extent required by applicable law.
Compensation Risk Assessment
The Compensation Committee reviews the relationship between our risk management policies and compensation policies and practices each year and, for 2019, has concluded that we do not have any compensation policies or practices that expose us to excessive or unnecessary risks that are reasonably likely to have a material adverse effect on us. Because our Compensation Committee retains the sole discretion for determining the actual amount paid to executives pursuant to our annual incentive bonus program, our Compensation Committee is able to assess the actual behavior of our executives as it relates to risk-taking in awarding bonus amounts. In addition, the performance objectives applicable to our annual bonus program consist of diverse company-wide and business unit goals, including commercial, operational and financial goals to support our business plan and priorities, which we believe lessens the potential incentive to focus on meeting certain short-term goals at the expense of longer-term risk. Further, our use of long-term equity incentive compensation for 2019 with three-year vesting periods in combination with meaningful ownership requirements serves our executive compensation program’s goal of aligning the interests of executives and shareholders, thereby reducing the incentives to unnecessary risk-taking.
Retirement, Health and Welfare, and Other Benefits
Employees are eligible to participate in a section 401(k) tax-qualified, defined contribution plan (the “401(k) Plan”), which helps employees save for retirement through a tax-advantaged combination of employee and company contributions and directly manage their retirement plan assets through a variety of investment options. Under the plan, participants may elect to defer up to 30% of their eligible compensation on a pre-tax basis (or on a post-tax basis via a Roth contribution), subject to certain limitations under the Internal Revenue Code of 1986, as amended (the “Code”). In addition, we make the following contributions to the 401(k) Plan for the benefit of our employees, including our NEOs: (i) 3% of the employee’s eligible compensation, and (ii) an amount equal to the employee’s contributions to the 401(k) Plan up to 5% of the employee’s eligible compensation. In addition, we may also make discretionary contributions to the 401(k) Plan for the benefit of employees depending on our performance. Company contributions to the 401(k) Plan may be subject to certain limitations under the Code for certain employees. We do not maintain a defined benefit pension plan or a nonqualified deferred compensation plan for our NEOs or other employees.
All full-time employees, including our NEOs, may participate in our health and welfare benefit programs, including medical, life insurance, dental coverage and disability insurance. It is the Compensation Committee’s policy not to pay for perquisites for any of our NEOs, other than minimal parking subsidies.
Change in Control and Severance Benefits
Our ability to build the exceptional leadership team we have today was due in large part to our having the full complement of compensation tools available to us and the flexibility to use them. This includes the ability to leverage change in control and severance benefits.
The Compensation Committee believes that together, our change in control and severance benefits, which are guided by our governance practices and policies, are well-aligned with those of our peers. More importantly, they foster stability and focus within the senior leadership team by helping to ensure that personal concerns regarding job security do not get in the way of mergers, reorganizations or other transactions that may be in the best interest of shareholders.
Please see “Executive Compensation—Potential Payments Upon Termination or Change in Control” below for further information.
Accounting Considerations
We account for the equity compensation expense for our employees, including our named executive officers, under the rules of Financial Accounting Standards Board (“FASB”), Accounting Standards Codification (“ASC”) Topic 718, which requires us to record an expense for each award of long-term equity incentive compensation over the vesting period of the award based on the fair value at the grant date. Accounting rules also require us to record cash compensation as an expense at the time the obligation is accrued.
Tax Considerations
We consider the impact of various tax rules in implementing our compensation program. Section 162(m) of the Code (“Section 162(m)”) generally limits the deductibility by a corporation of compensation in excess of $1,000,000 paid to certain executive officers. Due to the fact that our executive officers provide services to both us and to certain non-corporate subsidiaries, we have
historically designed incentive awards that are not subject to the deduction limitations of Section 162(m). However, during the 2019 year, new proposed regulations were published with respect to Section 162(m) that will alter the way that compensation is allocated between services to us and our subsidiaries, and certain compensation granted to our covered executive officers may become subject to the deductibility restrictions of 162(m). Our Compensation Committee believes that its primary responsibility is to provide a compensation program that is consistent with its compensation philosophy and supports the achievement of its compensation objectives. Therefore the Compensation Committee has retained the authority to grant appropriate compensation items or awards to our service providers notwithstanding an adverse tax or accounting treatment for that compensation.
Compensation Committee Report
Messrs. Davis, Crisp and Evans are the current members of our Compensation Committee. In fulfilling its oversight responsibilities, the Compensation Committee has reviewed and discussed with management the Compensation Discussion and Analysis contained in our Annual Report on Form 10-K for the year ended December 31, 2019 and in our proxy statement. Based on these reviews and discussions, the Compensation Committee recommended to our Board of Directors that the Compensation Discussion and Analysis be included in our Annual Report on Form 10-K for the year ended December 31, 2019 and in our proxy statement for filing with the SEC.
The information contained in this report shall not be deemed to be “soliciting material” or to be “filed” with the SEC, nor shall such information be incorporated by reference into any future filings with the SEC, or subject to the liabilities of Section 18 of the Exchange Act, except to the extent that we specifically incorporate it by reference into a document filed under the Securities Act of 1933, as amended (the “Securities Act”), or the Exchange Act.
The Compensation Committee
| Waters S. Davis, IV, | Charles R. Crisp, | Robert B. Evans, |
| Chairman | Committee Member | Committee Member |
EXECUTIVE COMPENSATION
Summary Compensation Table for 2019
The following Summary Compensation Table sets forth the compensation of our named executive officers for 2019, 2018 and 2017. Additional details regarding the applicable elements of compensation in the Summary Compensation Table are provided in the footnotes following the table.
| Name and Principal Position | Year | Salary | Bonus (1) | Stock Awards ($) (2) (3) | All Other Compensation (4) | Total |
| Joe Bob Perkins | 2019 | $ 891,667 | — | $ 11,545,172 | $ 23,710 | $12,460,549 |
| Chief Executive Officer | 2018 | 833,333 | — | 12,624,959 | 23,310 | 13,481,602 |
| 2017 | 745,833 | — | 4,552,878 | 23,184 | 5,321,895 | |
| Matthew J. Meloy | 2019 | $ 587,500 | $ 1,920,000 | $ 3,921,450 | $ 23,710 | $ 6,452,660 |
| President | 2018 | 516,667 | 1,115,625 | 3,914,716 | 23,037 | 5,570,045 |
| 2017 | 472,500 | 418,800 | 4,901,220 | 22,814 | 5,815,334 | |
| Jennifer R. Kneale | 2019 | $ 391,667 | $ 640,000 | $ 2,091,404 | $ 23,274 | $ 3,146,345 |
| Chief Financial Officer | 2018 | 332,500 | 446,250 | 1,166,427 | 22,535 | 1,967,712 |
| Patrick J. McDonie | 2019 | $ 495,833 | $ 800,000 | $ 2,124,127 | $ 23,492 | $ 3,443,452 |
| President – Gathering and Processing | 2018 | 466,667 | 807,500 | 1,803,674 | 22,928 | 3,100,769 |
| 2017 | 422,633 | 221,000 | 3,977,300 | 22,685 | 4,643,618 | |
| D. Scott Pryor | 2019 | $ 495,833 | $ 800,000 | $ 2,124,127 | $ 23,492 | $ 3,443,452 |
| President - Logistics and Marketing | 2018 | 466,667 | 807,500 | 1,803,674 | 22,928 | 3,100,769 |
| 2017 | 419,167 | 221,000 | 3,969,916 | 22,630 | 4,632,713 | |
| Robert M. Muraro | 2019 | $ 491,667 | $ 800,000 | $ 2,124,127 | $ 23,492 | $ 3,439,286 |
| Chief Commercial Officer | 2018 | 433,333 | 765,000 | 1,666,299 | 22,764 | 2,887,396 |
| 2017 | 331,667 | 168,000 | 6,037,998 | 22,234 | 6,559,899 | |
| (1) | For 2019, amounts reported in the “Bonus” column represents the portion of the bonus awarded pursuant to our 2019 Bonus Plan that was paid to the named executive officers in cash. The Compensation Committee approved settlement of the 2019 bonuses in a combination of cash and restricted stock unit awards. Specifically, the Compensation Committee determined that 100% of our Chief Executive Officer’s total bonus would be settled in the form of restricted stock unit awards, resulting in the Chief Executive Officer receiving restricted stock unit awards with a grant date value corresponding to approximately 160% of his target bonus amounts under the 2019 Bonus Plan. The Compensation Committee also determined that each other named executive officer’s total bonus amount would be settled in cash. The restricted stock unit awards granted to the Chief Executive Officer will vest in full one year after the date of award, subject to continued employment of the Chief Executive Officer through that date. These awards were granted on January 16, 2020 and will therefore be reported as equity award compensation in the Summary Compensation Table for 2020 in accordance with SEC rules. Please see “Compensation Discussion and Analysis—Components of Executive Compensation Program for Fiscal 2019—Annual Incentive Bonus.” As discussed above, payments pursuant to our Bonus Plan are discretionary and not based on specific objective performance measures. |
|---|
| (2) | Amounts reported in the “Stock Awards” column for 2019 represent the aggregate grant date fair value of restricted stock unit and performance share unit awards granted under our Stock Incentive Plan in 2019 (including restricted stock unit awards granted on January 17, 2019 in connection with 100% of the bonus for the Chief Executive Officer under the 2018 Bonus Plan that we granted in the form of restricted stock units) computed in accordance with FASB ASC Topic 718, disregarding the estimate of forfeitures. Assumptions used in the calculation of these amounts are included in Note 27—Compensation Plans to our “Consolidated Financial Statements” included in our Annual Report on Form 10-K for fiscal year 2019. Detailed information about the value attributable to specific awards is reported in the table under “—Grants of Plan-Based Awards for 2019” below. The grant date fair value of each restricted stock unit subject to the restricted stock unit awards granted on January 17, 2019, assuming vesting will occur, is $42.83. The grant date fair value of each performance share unit subject to the performance share unit awards granted on January 17, 2019, assuming vesting will occur, is $64.46, which is the per unit fair value determined using a Monte Carlo Simulation valuation methodology in accordance with FASB ASC Topic 718. Assuming, instead, a payout percentage for these performance unit awards of 250%, which is the maximum payout percentage under the awards, the aggregate grant date fair value of the equity-settled performance unit awards granted on January 17, 2019 for each named executive officer is as follows: Mr. Perkins – $12,810,780; Mr. Meloy – $5,890,033; Ms. Kneale – $3,141,297; Mr. McDonie – $3,190,448; Mr. Pryor – $3,190,448; and Mr. Muraro – $3,190,448. For 2018, the Compensation Committee provided that bonuses to our named executive officers under the 2018 Bonus Plan would be (i) 100% restricted stock unit awards equal to the Chief Executive Officer’s total bonus amount and (ii) cash equal to each of |
|---|
| the other named executive officer’s total bonus amount. The restricted stock unit award will vest in full three years after the date of award, subject to continued employment of the Chief Executive Officer through that date. Because this award was granted on January 17, 2019, it is reported as compensation in the Summary Compensation Table for 2019 in accordance with SEC rules. For 2017, the Compensation Committee provided that bonuses to our named executive officers under the 2017 Bonus Plan would be (i) 100% restricted stock unit awards equal to the Chief Executive Officer’s total bonus amount and (ii) a combination of cash equal to 50% of each of the other named executive officer’s total bonus amount and restricted stock unit awards equal to each other named executive officer’s total bonus amount. These restricted stock unit awards will vest in full three years after the date of award, subject to continued employment of the officers through that date. Because these awards were granted on January 17, 2018, they are reported as compensation in the Summary Compensation Table for 2018 in accordance with SEC rules. |
|---|
| (3) | On January 12, 2018, the Compensation Committee awarded a special performance/retention award to Mr. Perkins. The special performance/retention award consisting of 80,000 units was granted in the form of restricted stock units that vested 50% on December 31, 2018 and 50% on December 31, 2019. |
|---|
| (4) | For 2019, “All Other Compensation” includes (i) the aggregate value of all employer-provided contributions to our 401(k) plan and (ii) the dollar value of life insurance premiums paid by the Company with respect to life insurance for the benefit of each named executive officer. |
|---|
| Name | 401(k) and Profit Sharing Plan | Dollar Value of Life Insurance Premiums | Total |
| Joe Bob Perkins | $ 22,400 | $ 1,310 | $ 23,710 |
| Matthew J. Meloy | 22,400 | 1,310 | 23,710 |
| Jennifer R. Kneale | 22,400 | 874 | 23,274 |
| Patrick J. McDonie | 22,400 | 1,092 | 23,492 |
| D. Scott Pryor | 22,400 | 1,092 | 23,492 |
| Robert M. Muraro | 22,400 | 1,092 | 23,492 |
Grants of Plan-Based Awards for 2019
The following table and the footnotes thereto provide information regarding grants of plan-based equity awards made to the named executive officers during 2019:
| Name | Grant Date | Estimated Future Payouts Under Performance Share Unit Awards | Equity Awards: Number of Units | Grant Date Fair Value of Equity Awards (3) | ||
| Threshold (#) | Target (#) | Maximum (#) | ||||
| Mr. Perkins | 01/17/19 (1) | 39,748 | 79,496 | 198,740 | 79,496 | $ 8,529,126 |
| 01/17/19 (2) | 70,419 | 3,016,046 | ||||
| Mr. Meloy | 01/17/19 (1) | 18,275 | 36,550 | 91,375 | 36,550 | 3,921,450 |
| Ms. Kneale | 01/17/19 (1) | 9,747 | 19,493 | 48,733 | 19,493 | 2,091,404 |
| Mr. McDonie | 01/17/19 (1) | 9,899 | 19,798 | 49,495 | 19,798 | 2,142,127 |
| Mr. Pryor | 01/17/19 (1) | 9,899 | 19,798 | 49,495 | 19,798 | 2,124,127 |
| Mr. Muraro | 01/17/19 (1) | 9,899 | 19,798 | 49,495 | 19,798 | 2,124,127 |
| (1) | The grants on January 17, 2019 are the annual long-term equity incentive awards for 2019 granted to our named executive officers in the form of restricted stock unit and performance share unit awards granted under our Stock Incentive Plan. For a detailed description of how performance achievements will be determined for performance share units, see “Compensation Discussion and Analysis – 2019 Components of Executive Compensation Program In Detail – 2019 PSU Plan Design.” |
|---|
| (2) | The grant on January 17, 2019 is a restricted stock unit award granted to Mr. Perkins in lieu of 100% of the cash payments under the 2018 Bonus Plan. The restricted stock unit awards that will be granted to Mr. Perkins with respect to the 2019 Bonus Plan were not granted until January 2020, therefore are not reflected within this table. |
|---|
| (3) | The value within the “Grant Date Fair Value of Equity Awards” column was determined by multiplying the shares awarded by the grant date fair value per share computed in accordance with FASB ASC Topic 718: $42.83 for the January 17, 2019 restricted stock unit awards; and $64.46 for the January 17, 2019 performance share units. |
|---|
Narrative Disclosure to Summary Compensation Table and Grants of Plan Based Awards Table
A discussion of 2019 salaries, bonuses, incentive plans and awards is set forth in “Compensation Discussion and Analysis,” including a discussion of the material terms and conditions of the 2019 restricted stock unit and performance share unit awards under our Stock Incentive Plan. Further discussion regarding restricted stock units granted in January 2019 in lieu of a cash payment under our 2018 Bonus Plan are described in our proxy statement for our 2019 annual meeting of stockholders, filed with the Securities and Exchange Commission on March 29, 2019.
Outstanding Equity Awards at 201****9 Fiscal Year-End
The following table and the footnotes related thereto provide information regarding equity-based awards outstanding as of December 31, 2019 for each of our named executive officers. None of our named executive officers held any outstanding stock option awards as of December 31, 2019.
| Stock Awards | ||||
| Name | Number of Shares That Have Not Vested (1) | Market Value of Shares That Have Not Vested (2) | Performance Share Units: Number of Unearned Units That Have Not Vested (3) | Performance Share Units: Market or Payout Value of Unearned Units That Have Not Vested (4) |
| Joe Bob Perkins | 307,042 | $ 12,536,525 | 139,891 | $ 5,711,750 |
| Matthew J. Meloy | 148,136 | 6,048,393 | 69,814 | 2,850,506 |
| Jennifer R. Kneale | 77,572 | 3,167,265 | 30,154 | 1,231,188 |
| Patrick J. McDonie | 99,029 | 4,043,354 | 35,107 | 1,433,422 |
| D. Scott Pryor | 98,897 | 4,037,965 | 35,107 | 1,433,422 |
| Robert M. Muraro | 136,956 | 5,591,913 | 34,385 | 1,403,942 |
| (1) | Represents the following shares of restricted stock units (and earned performance units) under our Stock Incentive Plan held by our named executive officers: |
|---|
| Joe Bob Perkins | Matthew J. Meloy | Jennifer R. Kneale | Patrick J. McDonie | D. Scott Pryor | Robert M. Muraro | |
| January 6, 2016 Award (a) | — | — | 10,000 | — | — | — |
| January 20, 2017 Award (b) | 25,742 | 10,190 | — | 6,929 | 6,929 | 7,500 |
| January 20, 2017 Award (c) | — | 50,000 | 30,000 | 45,000 | 45,000 | 60,000 |
| January 20, 2017 Award (d) | 30,891 | 12,228 | — | 8,315 | 8,315 | 9,000 |
| February 28, 2017 Award (e) | 7,676 | 4,383 | 720 | 2,610 | 2,478 | 974 |
| July 23, 2017 Award (f) | — | — | — | — | — | 25,000 |
| August 1, 2017 Award (g) | — | — | 7,080 | — | — | — |
| January 17, 2018 Award (h) | 46,987 | 26,383 | 7,915 | 11,935 | 11,935 | 11,307 |
| January 17, 2018 Award (i) | 45,831 | 8,402 | 2,364 | 4,442 | 4,442 | 3,377 |
| January 17, 2019 Award (j) | 79,496 | 36,550 | 19,493 | 19,798 | 19,798 | 19,798 |
| January 17, 2019 Award (k) | 70,419 | — | — | — | — | — |
| Total | 307,042 | 148,136 | 77,572 | 99,029 | 98,897 | 136,956 |
| (a) | The restricted stock units awarded January 6, 2016 vest: (i) 50% on January 6, 2020 and 50% on January 6, 2021, contingent upon continuous employment through the end of the vesting period. The underlying shares of stock are not issued until vesting at the end of the vesting period. |
|---|
| (b) | The restricted stock units awarded January 20, 2017 are subject to the following vesting schedule: 100% of the restricted stock units vest on January 20, 2020, contingent upon continuous employment or the satisfaction of certain other service-related conditions upon the executive’s retirement, in either case, through the end of the vesting period. The underlying shares of stock are not issued until vesting at the end of the vesting period. |
|---|
| (c) | The restricted stock units awarded January 20, 2017 as a retention grant vest (i) 30% on January 20, 2021, (ii) 30% on January 20, 2022 and (iii) 40% on January 20, 2023, contingent upon continuous employment through the end of the performance period. The underlying shares of stock are not issued until vesting at the end of the vesting period. |
|---|
| (d) | The awards in this row originally related to performance share units granted in 2017, but for which the performance period ended on December 31, 2019. Because the awards were no longer subject to performance conditions, but would not be deemed “vested” until the Compensation Committee determined performance levels in early 2020, they are still deemed to be outstanding for purposes of this table, subject only to time-based vesting requirements. The target awards were multiplied by 120%, the actual adjustment factor applied to the awards upon determination of performance levels in 2020. |
|---|
| (e) | The restricted stock units awarded February 28, 2017 in partial settlement of awards under the 2016 Bonus Plan are subject to the following vesting schedule: 100% of the restricted stock units vest February 28, 2020, contingent upon continuous employment or the satisfaction of certain other service-related conditions upon the executive’s retirement, in either case, through the end of the vesting period. The underlying shares of stock are not issued until vesting at the end of the vesting period. |
|---|
| (f) | The restricted stock units awarded July 23, 2017 as a retention grant vest on July 23, 2020, contingent upon continuous employment through the end of the performance period. The underlying shares of stock are not issued until vesting at the end of the vesting period. |
|---|
| (g) | The restricted stock units awarded August 1, 2017 are subject to the following vesting schedule: 100% of the restricted stock units vest on August 1, 2020, contingent upon continuous employment or the satisfaction of certain other service-related conditions upon the executive’s retirement, in either case, through the end of the vesting period. The underlying shares of stock are not issued until vesting at the end of the vesting period. |
|---|
| (h) | The restricted stock units awarded January 17, 2018 are subject to the following vesting schedule: 100% of the restricted stock units vest on January 17, 2021, contingent upon continuous employment or the satisfaction of certain other service-related conditions upon the executive’s retirement, in either case, through the end of the vesting period. The underlying shares of stock are not issued until vesting at the end of the vesting period. |
|---|
| (i) | The restricted stock units awarded January 17, 2018 in settlement (with respect to our Chief Executive Officer) and in partial settlement (with respect to the other named executive officers) of awards under the 2017 Bonus Plan are subject to the following vesting schedule: 100% of the restricted stock units vest January 17, 2021, contingent upon continuous employment or the satisfaction of certain other service-related conditions upon the executive’s retirement, in either case, through the end of the vesting period. The underlying shares of stock are not issued until vesting at the end of the vesting period. |
|---|
| (j) | The restricted stock units awarded January 17, 2019 are subject to the following vesting schedule: 100% of the restricted stock units vest on January 17, 2022, contingent upon continuous employment or the satisfaction of certain other service-related conditions upon the executive’s retirement, in either case, through the end of the vesting period. The underlying shares of stock are not issued until vesting at the end of the vesting period. |
|---|
| (k) | The restricted stock units awarded January 17, 2019 in settlement of an award under the 2018 Bonus Plan are subject to the following vesting schedule: 100% of the restricted stock units vest January 17, 2022, contingent upon continuous employment or the satisfaction of certain other service-related conditions upon the executive’s retirement, in either case, through the end of the vesting period. The underlying shares of stock are not issued until vesting at the end of the vesting period. |
|---|
The treatment of the outstanding restricted stock unit awards upon certain terminations of employment (including retirement) or the occurrence of a change in control is described below under “—Potential Payments Upon Termination or Change in Control.”
| (2) | The dollar amounts shown are determined by multiplying the number of shares of restricted stock units reported in the table by the closing price of a share of our common stock on December 31, 2019 ($40.83), which was the last trading day of fiscal 2019. The amounts do not include any related dividends accrued with respect to the awards. |
|---|
| (3) | Represents the following performance share units linked to the performance of the Company’s common stock held by our named executive officers: |
|---|
| January 17, 2018 Award | January 17, 2019 Award | |||
|---|---|---|---|---|
| Awards Granted | (a) Adjusted for Performance Factor (TSR) | Awards Granted | (b) Adjusted for Performance Factor (TSR) | |
| Joe Bob Perkins | 46,987 | 54,035 | 79,496 | 85,856 |
| Matthew J. Meloy | 26,383 | 30,340 | 36,550 | 39,474 |
| Jennifer R. Kneale | 7,915 | 9,102 | 19,493 | 21,052 |
| Patrick J. McDonie | 11,935 | 13,725 | 19,798 | 21,382 |
| D. Scott Pryor | 11,935 | 13,725 | 19,798 | 21,382 |
| Robert R. Muraro | 11,307 | 13,003 | 19,798 | 21,382 |
| (a) | Reflects the target number of performance share units granted to the named executive officers on January 17, 2018 multiplied by a performance percentage of 115%, which in accordance with SEC rules is the next higher performance level under the award that exceeds 2019 performance. Vesting of these awards is contingent upon continuous employment or the satisfaction of certain other service-related conditions upon the executive’s retirement, in either case, through the end of the performance period, which ends December 31, 2020, and the Company’s performance over the applicable performance period measured against a peer group of companies. The underlying shares of stock are not issued until vesting levels have been determined by the Compensation Committee. |
|---|
| (b) | Reflects the target number of performance share units granted to the named executive officers on January 17, 2019 multiplied by a performance percentage of 108%, which in accordance with SEC rules is the next higher performance level under the award that exceeds 2019 performance. Vesting of these awards is contingent upon continuous employment or the satisfaction of certain other service-related conditions upon the executive’s retirement, in either case, through the end of the performance period, which ends December 31, 2021, and the Company’s performance over the applicable performance period measured against a peer group of companies. The underlying shares of stock are not issued until vesting levels have been determined by the Compensation Committee. |
|---|
The treatment of the outstanding performance share unit awards upon certain terminations of employment (including retirement) or the occurrence of a change in control is described below under “—Potential Payments Upon Termination or Change in Control.”
| (4) | The dollar amounts shown are determined by multiplying the number of shares of performance share units reported in the table by the closing price of a share of our common stock on December 31, 2019 ($40.83), which was the last trading day of fiscal 2019. The amounts do not include any related dividends accrued with respect to the awards. |
|---|
Option Exercises and Stock Vested in 201****9
The following table provides the amount realized during 2019 by each named executive officer upon the vesting of restricted stock and restricted stock units. None of our named executive officers exercised any option awards during the 2019 year and, currently, there are no options outstanding under any of our plans.
| Stock Awards | |||
| Name | Number of Shares Acquired on Vesting (#) | Value Realized on Vesting (1) ($) | |
| Joe Bob Perkins | 170,804 | 7,230,851 | |
| Matthew J. Meloy | 47,799 | 2,038,507 | |
| Jennifer R. Kneale | 7,905 | 307,220 | |
| Patrick J. McDonie | 36,174 | 1,542,182 | |
| D. Scott Pryor | 39,068 | 1,669,658 | |
| Robert M. Muraro | 10,779 | 417,761 |
| (1) | Computed with respect to the restricted stock awards granted under our Stock Incentive Plan by multiplying the number of shares of stock vesting by the closing price of a share of common stock on the January 19, 2019 vesting date ($43.50), the February 28, 2019 vesting date ($40.24), the August 1, 2019 vesting date ($37.37) and the December 31, 2019 vesting date ($40.83) and does not include associated dividends accrued during the vesting period. |
|---|
Pension Benefits
Other than our 401(k) Plan, we do not have any plan that provides for payments or other benefits at, following, or in connection with, retirement.
Non-Qualified Deferred Compensation
We do not have any plan that provides for the deferral of compensation on a basis that is not tax qualified.
Potential Payments Upon Termination or Change in Control
Aggregate Payments
The table below reflects the aggregate amount of payments and benefits that we believe our named executive officers would have received under the Change in Control Program (described below) and Stock Incentive Plan upon certain specified termination of employment and/or a change in control events, in each case, had such event occurred on December 31, 2019. Details regarding individual plans and arrangements follow the table. The amounts below constitute estimates of the amounts that would be paid to our named executive officers upon each designated event, and do not include any amounts accrued through fiscal 2019 year-end that would be paid in the normal course of continued employment, such as accrued but unpaid salary and benefits generally available to all salaried employees. The actual amounts to be paid are dependent on various factors, which may or may not exist at the time a named executive officer is actually terminated and/or a change in control actually occurs. Therefore, such amounts and disclosures should be considered “forward-looking statements.”
| Name | Change in Control (No Termination) | Qualifying Termination Following Change in Control | Termination by us without Cause | Termination for Death or Disability |
| Joe Bob Perkins | $ 20,280,865 | $ 29,234,591 | — | $ 20,280,865 |
| Matthew J. Meloy | 10,423,248 | 15,881,403 | — | 10,423,248 |
| Jennifer R. Kneale | 5,214,049 | 7,614,049 | — | 5,214,049 |
| Patrick J. McDonie | 6,497,469 | 9,560,031 | — | 6,497,469 |
| D. Scott Pryor | 6,490,759 | 9,548,914 | — | 6,490,759 |
| Robert R. Muraro | 8,395,350 | 11,453,505 | — | 8,395,350 |
Executive Officer Change in Control Severance Program
We adopted the Change in Control Program on and effective as of January 12, 2012. Each of our named executive officers was an eligible participant in the Change in Control Program during the 2019 calendar year.
The Change in Control Program is administered by our Senior Vice President—Human Resources. The Change in Control Program provides that if, in connection with or within 18 months after a “Change in Control,” a participant suffers a “Qualifying Termination,” then the individual will receive a severance payment, paid in a single lump sum cash payment within 60 days following the date of termination, equal to three times (i) the participant’s annual salary as of the date of the Change in Control or the date of termination, whichever is greater, and (ii) the amount of the participant’s annual salary multiplied by the participant’s most recent “target” bonus percentage specified by the Compensation Committee prior to the Change in Control. In addition, the participant (and his eligible dependents, as applicable) will receive the continuation of their medical and dental benefits until the earlier to occur of (a) three years from the date of termination, or (b) the date the participant becomes eligible for coverage under another employer’s plan.
For purposes of the Change in Control Program, the following terms will generally have the meanings set forth below:
Cause means discharge of the participant by us on the following grounds: (i) the participant’s gross negligence or willful misconduct in the performance of his duties, (ii) the participant’s conviction of a felony or other crime involving moral turpitude, (iii) the participant’s willful refusal, after 15 days’ written notice, to perform his material lawful duties or responsibilities, (iv) the participant’s willful and material breach of any corporate policy or code of conduct, or (v) the participant’s willfully engaging in conduct that is known or should be known to be materially injurious to us or our subsidiaries.
Change in Control means any of the following events: (i) any person (other than the Partnership) becomes the beneficial owner of more than 20% of the voting interest in us or in the General Partner, (ii) any sale, lease, exchange or other transfer (in one transaction or a series of related transactions) of all or substantially all of the assets of the Company or the General Partner (other than to the Partnership or its affiliates), (iii) a transaction resulting in a person other than Targa Resources GP LLC or an affiliate being the General Partner of the Partnership, (iv) the consummation of any merger, consolidation or reorganization involving us or the General Partner in which less than 51% of the total voting power of outstanding stock of the surviving or resulting entity is beneficially owned by the stockholders of the Company or the General Partner, immediately prior to the consummation of the transaction, or (v) a majority of the members of the Board of Directors or the board of directors of the General Partner is replaced during any 12-month period by directors whose appointment or election is not endorsed by a majority of the members of the applicable Board of Directors before the date of the appointment or election.
Good Reason means: (i) a material reduction in the participant’s authority, duties or responsibilities, (ii) a material reduction in the participant’s base compensation, or (iii) a material change in the geographical location at which the participant must perform services. The individual must provide notice to us of the alleged Good Reason event within 90 days of its occurrence and we have the opportunity to remedy the alleged Good Reason event within 30 days from receipt of the notice of such allegation.
Qualifying Termination means (i) an involuntary termination of the individual’s employment by us without Cause or (ii) a voluntary resignation of the individual’s employment for Good Reason.
All payments due under the Change in Control Program will be conditioned on the execution and non-revocation of a release for our benefit and the benefit of our related entities and agents. The Change in Control Program will supersede any other severance program for eligible participants in the event of a Change in Control, but will not affect accelerated vesting of any equity awards under the terms of the plans governing such awards.
If amounts payable to a named executive officer under the Change in Control Program, together with any other amounts that are payable by us as a result of a Change in Control (collectively, the “Payments”), exceed the amount allowed under section 280G of the Code for such individual, thereby subjecting the individual to an excise tax under section 4999 of the Code, then, depending on which method produces the largest net after-tax benefit for the recipient, the Payments shall either be: (i) reduced to the level at which no excise tax applies or (ii) paid in full, which would subject the individual to the excise tax.
The following table reflects payments that would have been made to each of the named executive officers under the Change in Control Program in the event there was a Change in Control and the officer incurred a Qualifying Termination, in each case as of December 31, 2019.
| Name | Qualifying Termination Following Change in Control (1) |
| Joe Bob Perkins | $8,953,726 |
| Matthew J. Meloy | 5,458,155 |
| Jennifer R. Kneale | 2,400,000 |
| Patrick J. McDonie | 3,062,562 |
| D. Scott Pryor | 3,058,155 |
| Robert R. Muraro | 3,058,155 |
| (1) | Includes 3 years’ worth of continued participation in our medical and dental plans, calculated based on the monthly employer-paid portion of the premiums for our medical and dental plans as of December 31, 2019 for each named executive officer and the officer’s eligible dependents in the following amounts: (a) Mr. Perkins – $43,726, (b) Mr. Meloy – $58,155, (c) Ms. Kneale– 0, (d) Mr. McDonie – $62,562, (e) Mr. Pryor – $58,155, and (f) Mr. Muraro—$58,155. |
|---|
Stock Incentive Plan
Our named executive officers held outstanding restricted stock units under our form of restricted stock unit agreement (the “Stock Agreement”), and performance share units under our form of performance share unit agreement (the “Performance Agreement”) and the Stock Incentive Plan as of December 31, 2019. If a “Change in Control” occurs and the named executive officer has (i) remained continuously employed by us from the date of grant to the date upon which such Change in Control occurs or (ii) retired following the date of grant and either performed consulting services for us or refrained from working for one of our competitors or in a similar role for another company (however, directorships at non-competitors are permitted), through the date of the Change in Control, then, in either case, (a) the restricted stock units granted to the officer under the Stock Agreement, and related dividends then credited to the officer, will fully vest on the date upon which such Change in Control occurs, and (b) the performance share units granted to the officer under the Performance Agreement and related dividends credited to the officer will vest based on a performance factor as of the date of the Change in Control determined by the Compensation Committee. The 2019 performance share units have four separate performance periods: (1) the 2019 calendar year, (2) the 2020 calendar year, (3) the 2021 calendar year, and (4) the entirety of the performance period between January 1, 2019 and December 31, 2021. Upon a Change in Control transaction, the Compensation Committee will take into account the average of the performance level achieved for each of the four performance periods, using the actual performance level achieved with respect to any completed period, and a deemed performance percentage of 100% for any performance period that has not been completed. The average percentage may then be decreased or increased by the Compensation Committee in its discretion. The Performance Agreements governing awards granted in 2017 and 2018 vest under the same performance schedules as described above with respect to the 2019 awards, with appropriate adjustments for the years at issue.
Restricted stock units and performance share units granted to a named executive officer under the Stock Agreement and Performance Agreement, and related dividends then credited to the officer, will also fully vest if the named executive officer’s employment is terminated by reason of death or a “Disability” (as defined below). If a named executive officer’s employment with us is terminated for any reason other than death or Disability, then the officer’s unvested restricted stock units and performance share units are forfeited to us for no consideration, except that (other than with respect to retention grants for Mr. Perkins, Mr. Meloy, Ms. Kneale, Mr. McDonie, Mr. Pryor and Mr. Muraro), if a named executive officer retires or otherwise has a voluntary resignation, the officer’s awards will continue to vest on the original vesting schedule if, from the date of the officer’s retirement or termination through the applicable vesting date, the named executive officer has either performed consulting services for us or refrained from working for one of our competitors or in a similar role for another company (however, directorships at non-competitors are permitted).
The following terms generally have the following meanings for purposes of the Stock Incentive Plan, Stock Agreements and Performance Agreements:
Affiliate means an entity or organization which, directly or indirectly, controls, is controlled by, or is under common control with, us.
Change in Control means the occurrence of one of the following events: (i) any person or group acquires or gains ownership or control (including, without limitation, the power to vote), by way of merger, consolidation, recapitalization, reorganization or otherwise, of more than 50% of the outstanding shares of our voting stock or more than 50% of the combined voting power of the equity interests in the Partnership or the General Partner, (ii) any person, including a group as contemplated by section 13(d)(3) of the Exchange Act, acquires in any twelve-month period (in one transaction or a series of related transactions) ownership, directly or indirectly, of 30% or more of the outstanding shares of our voting stock or of the combined voting power of the equity interests in the Partnership or the General Partner, (iii) the completion of a liquidation or dissolution of us or the approval by the limited partners of the Partnership, in one or a series of transactions, of a plan of complete liquidation of the Partnership, (iv) the sale or other disposition by us of all or substantially all of our assets in one or more transactions to any person other than an Affiliate, (v) the sale or disposition by either the Partnership or the General Partner of all or substantially all of its assets in one or more transactions to any person other than to an Affiliate, (vi) a transaction resulting in a person other than Targa Resources GP LLC or an Affiliate being the General Partner of the Partnership, or (vii) as a result of or in connection with a contested election of directors, the persons who were our directors before such election shall cease to constitute a majority of our Board of Directors.
Disability means a disability that entitles the named executive officer to disability benefits under our long-term disability plan.
The following table reflects amounts that would have been received by each of the named executive officers under the Stock Incentive Plan and related Stock Agreements and Performance Agreements in the event there was a Change in Control or their employment was terminated due to death or Disability, each as of December 31, 2019. The amounts reported below assume that the price per share of our common stock was $40.83, which was the closing price per share of our common stock on December 31, 2019 (the last trading day of fiscal 2019). No amounts are reported assuming retirement as of December 31, 2019, since additional conditions must be met following a named executive officer’s retirement in order for any restricted stock awards or restricted stock units to become vested.
| Name | Change in Control | Termination for Death or Disability | ||
| Joe Bob Perkins | $ 20,280,865 | (1) | $20,280,865 | (1) |
| Matthew J. Meloy | 10,423,248 | (2) | 10,423,248 | (2) |
| Jennifer R. Kneale | 5,214,049 | (3) | 5,214,049 | (3) |
| Patrick J. McDonie | 6,497,469 | (4) | 6,497,469 | (4) |
| D. Scott Pryor | 6,490,759 | (5) | 6,490,759 | (5) |
| Robert R. Muraro | 8,395,350 | (6) | 8,395,350 | (6) |
| (1) | Of the amount reported under each of the “Change in Control” column and the “Termination for Death or Disability” column: |
|---|
(a) $1,051,046, and $281,103, respectively, relate to restricted stock units and related dividend rights granted on January 20, 2017, which are scheduled to vest on January 20, 2020;
(b) $1,261,280, and $337,330, respectively, relate to performance share units and related dividend rights granted on January 17, 2017, where the performance period ended on December 31, 2019; however, the awards deemed “earned” were still deemed to be outstanding as of December 31, 2019, therefore a Change in Control or termination due to death or Disability could accelerate the time at which the awards could be settled with the executive;
(c) $313,411, and $76,837, respectively, relate to restricted stock units and related dividend rights granted on February 28, 2017, in partial settlement of an award under the 2016 Bonus Plan, which are scheduled to vest on February 28, 2020;
(d) $1,918,479, and $342,065, respectively, relate to restricted stock units and related dividend rights granted on January 17, 2018, which are scheduled to vest January 17, 2021;
(e) $1,871,280, and $0, respectively, relate to restricted stock units and related dividend rights granted on January 17, 2018, in settlement of an award under the 2017 Bonus Plan, which are scheduled to vest January 17, 2021;
(f) $2,206,249, and $393,375, respectively, relate to performance share units and related dividend rights granted on January 17, 2018, which have an aggregate performance period that will end on December 31, 2020;
(g) $3,245,822, and $289,365, respectively, relate to restricted stock units and related dividend rights granted on January 17, 2019, which are scheduled to vest January 17, 2022;
(h) $2,875,208, and $0, respectively, relate to the restricted stock units and related dividend rights granted on January 17, 2019, in settlement of an award under the 2018 Bonus Plan, which are scheduled to vest January 17, 2022; and
(i) $3,505,500, and $312,515, respectively, relate to performance share units and related dividend rights granted on January 17, 2019, which have an aggregate performance period that will end on December 31, 2021.
| (2) | Of the amount reported under each of the “Change in Control” column and the “Termination for Death or Disability” column: |
|---|
(a) $416,058, and $111,275, respectively, relate to restricted stock units and related dividend rights granted on January 20, 2017, which are scheduled to vest on January 20, 2020;
(b) $499,269, and $133,530, respectively, relate to performance share units and related dividend rights granted on January 17, 2017, where the performance period ended on December 31, 2019; however, the awards deemed “earned” were still deemed to be outstanding as of 12/31/2019, therefore a Change in Control or termination due to death or Disability could accelerate the time at which the awards could be settled with the executive;
(c) $2,041,500, and $546,000, respectively, relate to restricted stock units awarded January 20, 2017 as a retention grant which vest (i) 30% on January 20, 2021, (ii) 30% on January 20, 2022 and (iii) 40% on January 20, 2023, contingent upon continuous employment;
(d) $178,958, and $43,874, respectively, relate to restricted stock units and related dividend rights granted on February 28, 2017, in partial settlement of an award under the 2016 Bonus Plan, which are scheduled to vest on February 28, 2020;
(e) $1,077,218, and $192,068 respectively, relate to restricted stock units and related dividend rights granted on January 17, 2018, which are scheduled to vest January 17, 2021;
(f) $343,054, and $0, respectively, relate to restricted stock units and related dividend rights granted on January 17, 2018, in partial settlement of an award under the 2017 Bonus Plan, which are scheduled to vest January 17, 2021;
(g) $1,238,782, and $220,875, respectively, relate to performance share units and related dividend rights granted on January 17, 2018, which have an aggregate performance period that will end on December 31, 2020;
(h) $1,492,337, and $133,042, respectively, relate to restricted stock units and related dividend rights granted on January 17, 2019, which are scheduled to vest January 17, 2022; and
(i) $1,611,723, and $143,685, respectively, relate to performance share units and related dividend rights granted on January 17, 2019, which have an aggregate performance period that will end on December 31, 2021.
| (3) | Of the amount reported under each of the “Change in Control” column and the “Termination for Death or Disability” column: |
|---|
(a) $408,300, and $145,600, respectively, relate to restricted stock units and related dividend rights granted on January 6, 2016, which are scheduled to vest (i) 50% on January 6, 2020 and (ii) 50% on January 6, 2021;
(b) $1,224,900, and $327,600, respectively, relate to restricted stock units awarded January 20, 2017 as a retention grant which vest (i) 30% on January 20, 2021, (ii) 30% on January 20, 2022 and (iii) 40% on January 20, 2023, contingent upon continuous employment;
(c) $29,398, and $7,207, respectively, relate to restricted stock units and related dividend rights granted on February 28, 2017, in partial settlement of an award under the 2016 Bonus Plan, which are scheduled to vest on February 28, 2020;
(d) $289,076, and $63,720, respectively, relate to restricted stock units and related dividend rights granted on August 1, 2017, which are scheduled to vest August 1, 2020;
(e) $323,169, and $57,621, respectively, relate to restricted stock units and related dividend rights granted on January 17, 2018, which are scheduled to vest January 17, 2021;
(f) $96,522, and $0, respectively, relate to restricted stock units and related dividend rights granted on January 17, 2018, in partial settlement of an award under the 2017 Bonus Plan which are scheduled to vest January 17, 2021;
(g) $371,635, and $66,265, respectively, relate to performance share units and related dividend rights granted on January 17, 2018, which have an aggregate performance period that will end on December 31, 2020;
(h) $795,899, and $70,955, respectively, relate to restricted stock units and related dividend rights granted on January 17, 2019, which are scheduled to vest January 17, 2022; and
(i) $859,553, and $76,629, respectively, relate to performance share units and related dividend rights granted on January 17, 2019, December 31, 2021.
| (4) | Of the amount reported under each of the “Change in Control” column and the “Termination for Death or Disability” column: |
|---|
(a) $282,911, and $75,665, respectively, relate to restricted stock units and related dividend rights granted on January 20, 2017, which are scheduled to vest on January 20, 2020;
(b) $339,501, and $90,798, respectively, relate to performance share units and related dividend rights granted on January 17, 2017, where the performance period ended on December 31, 2019; however, the awards deemed “earned” were still deemed to be outstanding as of 12/31/2019, therefore a Change in Control or termination due to death or Disability could accelerate the time at which the awards could be settled with the executive;
(c) $1,837,350, and $491,400, respectively, relate to restricted stock units awarded January 20, 2017 as a retention grant which vest (i) 30% on January 20, 2021, (ii) 30% on January 20, 2022 and (iii) 40% on January 20, 2023, contingent upon continuous employment;
(d) $106,566, and $26,126, respectively, relate to restricted stock units and related dividend rights granted on February 28, 2017, in partial settlement of an award under the 2016 Bonus Plan, which are scheduled to vest on February 28, 2020;
(e) $487,306, and $86,887, respectively, relate to restricted stock units and related dividend rights granted on January 17, 2018, which are scheduled to vest January 17, 2021;
(f) $181,367, and $0, respectively, relate to restricted stock units and related dividend rights granted on January 17, 2018, in partial settlement of an award under the 2017 Bonus Plan, which are scheduled to vest January 17, 2021;
(g) $560,402, and $99,920, respectively, relate to performance share units and related dividend rights granted on January 17, 2018, which have an aggregate performance period that will end on December 31, 2020;
(h) $808,352, and $72,065, respectively, relate to restricted stock units and related dividend rights granted on January 17, 2019, which are scheduled to vest January 17, 2022; and
(i) $873,021, and $77,830, respectively, relate to performance share units and related dividend rights granted on January 17, 2019, which have an aggregate performance period that will end on December 31, 2021.
| (5) | Of the amount reported under each of the “Change in Control” column and the “Termination for Death or Disability” column: |
|---|
(a) $282,911, and $75,665, respectively, relate to restricted stock units and related dividend rights granted on January 20, 2017, which are scheduled to vest on January 20, 2020;
(b) $339, 501, and $90,800, respectively, relate to performance share units and related dividend rights granted on January 17, 2017, where the performance period ended on December 31, 2019; however, the awards deemed “earned” were still deemed to be outstanding as of 12/31/2019, therefore a Change in Control or termination due to death or Disability could accelerate the time at which the awards could be settled with the executive;
(c) $1,837,350, and $491,400, respectively, relate to restricted stock units awarded January 20, 2017 as a retention grant which vest (i) 30% on January 20, 2021, (ii) 30% on January 20, 2022 and (iii) 40% on January 20, 2023, contingent upon continuous employment;
(d) $101,177, and $24,805, respectively, relate to restricted stock units and related dividend rights granted on February 28, 2017, in partial settlement of an award under the 2016 Bonus Plan, which are scheduled to vest on February 28, 2020;
(e) $487,306, and $86,887, respectively, relate to restricted stock units and related dividend rights granted on January 17, 2018, which are scheduled to vest January 17, 2021;
(f) $181,367, and $0, respectively, relate to restricted stock units and related dividend rights granted on January 17, 2018, in partial settlement of an award under the 2017 Bonus Plan, which are scheduled to vest January 17, 2021;
(g) $560,402, and $99,920, respectively, relate to performance share units and related dividend rights granted on January 17, 2018, which have an aggregate performance period that will end on December 31, 2020;
(h) $808,352, and $72,065, respectively, relate to the restricted stock units and related dividend rights granted on January 17, 2019, which are scheduled to vest January 17, 2022; and
(i) $873,021, and $77,830, respectively, relate to performance share units and related dividend rights granted on January 17, 2019, December 31, 2021.
| (6) | Of the amount reported under each of the “Change in Control” column and the “Termination for Death or Disability” column: |
|---|
(a) $306,225, and $81,900, respectively, relate to restricted stock units and related dividend rights granted on January 20, 2017, which are scheduled to vest on January 20, 2020;
(b) $367,470, and $98,280, respectively, relate to performance share units and related dividend rights granted on January 17, 2017, where the performance period ended on December 31, 2019; however, the awards deemed “earned” were still deemed to be outstanding as of 12/31/2019, therefore a Change in Control or termination due to death or Disability could accelerate the time at which the awards could be settled with the executive;
(c) $2,449,800, and $655,200, respectively, relate to restricted stock units awarded January 20, 2017 as a retention grant which vest (i) 30% on January 20, 2021, (ii) 30% on January 20, 2022 and (iii) 40% on January 20, 2023, contingent upon continuous employment;
(d) $39,768, and $9,750, respectively, relate to restricted stock units and related dividend rights granted on February 28, 2017, in partial settlement of an award under the 2016 Bonus Plan, which are scheduled to vest on February 28, 2020;
(e) $1,020,750, and $227,500, respectively, relate to the restricted stock units awarded July 23, 2017 as a retention grant, which are scheduled to vest July 23, 2020, contingent upon continuous employment;
(f) $461,665, and $82,314, respectively, relate to restricted stock units and related dividend rights granted on January 17, 2018, which are scheduled to vest January 17, 2021;
(g) $137,883, and $0, respectively, relate to restricted stock units and related dividend rights granted on January 17, 2018, in partial settlement of an award under the 2017 Bonus Plan, which are scheduled to vest January 17, 2021;
(h) $530,915, and $94,662, respectively, relate to performance share units and related dividend rights granted on January 17, 2018, which have an aggregate performance period that will end on December 31, 2020;
(i) $808,352, and $72,065, respectively, relate to restricted stock units and related dividend rights granted on January 17, 2019, which are scheduled to vest January 17, 2022; and
(j) $873,021, and $77,830, respectively, relate to performance share units and related dividend rights granted on January 17, 2019, December 31, 2021.
Director Compensation
The following table sets forth the compensation earned by our non-employee directors for 2019:
| Name | Fees Earned or Paid in Cash | Stock Awards (1) | Total Compensation |
| Charles R. Crisp | $ 145,000 | $ 135,685 | $280,685 |
| Ershel C. Redd Jr. | 107,500 | 135,685 | 243,185 |
| Chris Tong | 114,375 | 135,685 | 250,060 |
| Laura C. Fulton | 122,500 | 135,685 | 258,185 |
| Waters S. Davis, IV | 130,000 | 135,685 | 265,685 |
| Rene R. Joyce | 107,500 | 135,685 | 243,185 |
| Robert B. Evans | 125,000 | 135,685 | 260,685 |
| Beth A. Bowman | 113,125 | 135,685 | 248,810 |
| (1) | Amounts reported in the “Stock Awards” column represent the aggregate grant date fair value of restricted shares of our common stock with a one-year vesting period awarded to the non-employee directors under our Stock Incentive Plan, computed in accordance with FASB ASC Topic 718, disregarding the estimate of forfeitures. For a discussion of the assumptions and methodologies used to value the awards reported in this column, see the discussion contained in the Notes to Consolidated Financial Statements at Note 27 – Compensation Plans included in our Annual Report on Form 10-K for the year ended December 31, 2019. On January 17, 2019, each director received 3,168 restricted shares of our common stock in connection with their 2019 service on our Board of Directors, and the grant date fair value of each share of common stock computed in accordance with FASB ASC Topic 718 was $42.83. As of December 31, 2019, each of the directors still held the outstanding restricted shares granted to them in 2019, and none of our non-employee directors held any outstanding stock options. |
|---|
Narrative to Director Compensation Table
For 2019, all non-employee directors received a cash retainer of $100,000. The lead director and the Chairman of the Audit Committee each received an additional annual retainer of $20,000, the Chairman of the Compensation Committee received an additional annual retainer of $15,000 and the Chairman of the Nominating and Governance Committee and the Chairman of the Risk Management Committee each received an additional retainer of $10,000. Each committee member received an additional annual retainer of $7,500 for each committee on which they served. Payment of non-employee director retainers are made quarterly. All non-employee directors are reimbursed for out-of-pocket expenses incurred in attending Board of Director and committee meetings.
A director who is also an employee receives no additional compensation for services as a director. Accordingly, Messrs. Whalen and Perkins have been omitted from the table. Because Mr. Perkins is a named executive officer for 2019, the Summary Compensation Table reflects the total compensation he received for services performed for us and our affiliates. Mr. Whalen, who serves as Executive Chairman of the Board is an executive officer who does not receive any additional compensation for services provided as a director. Due to the fact that Mr. Whalen is not a named executive officers his employee compensation is omitted from the table above and the Summary Compensation Table herein.
Director Long-term Equity Incentives. We granted equity awards in January 2019 to our non-employee directors serving at that time under the Stock Incentive Plan. Each of these directors received an award of 3,168 restricted shares of our common stock with a one-year vesting period. These grants reflect our intent to provide our directors with a target value of approximately $130,000 in annual long-term incentive awards. The awards are intended to align the long-term interests of our directors with those of our shareholders.
Changes for 20****20
Director Compensation. For 2020, the annual cash retainer was increased to $115,000, the equity compensation portion of the retainer was increased to $150,000 and the retainer provided to directors for each committee on which they serve was eliminated. The lead director retainer was increased to $25,000 per year, the Audit Committee chair retainer was increased to $25,000 per year, the Compensation Committee chair retainer was increased to $20,000 per year, the Nominating and Governance Committee chair retainer was increased to $15,000 per year and the Risk Management Committee chair retainer was increased to $15,000 per year.
Director Long-term Equity Incentives. In January 2020, each of our non-employee directors received an award of 3,684 restricted shares of our common stock under the Stock Incentive Plan with a one-year vesting period, which reflects our desire to increase the target value of the annual awards to approximately $150,000 per year.
Pay Ratio Disclosures
As required by Section 953(b) of the Dodd-Frank Wall Street Reform and Consumer Protection Act, and Item 402(u) of Regulation S-K, we are providing the following information about the relationship of the annual total compensation of our employees and the annual total compensation of Joe Bob Perkins, our Chief Executive Officer (our “CEO”).
For 2019, our last completed fiscal year:
| • | The median of the annual total compensation of all employees of our company (other than the CEO) was $114,112, |
|---|
| • | The annual total compensation of Mr. Perkins was $12,460,549. |
|---|
| • | Based on this information, for 2019 the ratio of the annual total compensation of our CEO to the median of the annual total compensation of all employees (“CEO Pay Ratio”) was reasonably estimated to be 109 to 1. |
|---|
To calculate the CEO Pay Ratio we must identify the median of the annual total compensation of all our employees, as well as to determine the annual total compensation of our median employee and our CEO. To these ends, we took the following steps:
| • | We determined that, as of December 31, 2019, our employee population consisted of approximately 2,680 individuals. This population consisted of our full-time and part-time employees, as we do not have temporary or seasonal workers. |
|---|
| • | We used a consistently applied compensation measure to identify our median employee of comparing the amount of salary or wages, bonuses, company contributions under our 401(k) plan, and the grant date fair value of equity awards determined under FASB ASC Topic 718. We identified our median employee by consistently applying this compensation measure to all of our employees included in our analysis. For individuals hired after January 1, 2019 that were included in the employee population, we calculated these compensation elements on an annualized basis. We did not make any cost of living adjustments in identifying the median employee |
|---|
| • | We combined all of the elements of the median employee’s compensation for the 2019 year in accordance with the requirements of Item 402(c)(2)(x) of Regulation S-K, resulting in annual total compensation of $114,112. |
|---|
| • | With respect to the annual total compensation of our CEO, we used the amount reported in the “Total” column of our 2019 Summary Compensation Table included in Item 11 of Part III of this Annual Report. |
|---|
Previous: Item 10. Directors, Executive Officers and Corporate Governance. · Next: Item 12. Security Ownership of Certain Beneficial Owners and Management and Related Stockholder Matters.