 filings.tools
Travelers Companies 10-K 2019-12-31
Filed 2020-02-13. 22 sections, 1038K characters. Original on sec.gov · Markdown · JSON
Cover and table of contents
UNITED STATES SECURITIES AND EXCHANGE COMMISSION
Washington, D.C. 20549
FORM 10-K
| ☒ | ANNUAL REPORT PURSUANT TO SECTION 13 OR 15(d) OF THE SECURITIES EXCHANGE ACT OF 1934 |
For the fiscal year ended December 31, 2019
or
| ☐ | TRANSITION REPORT PURSUANT TO SECTION 13 OR 15(d) OF THE SECURITIES EXCHANGE ACT OF 1934 |
For the transition period from to
Commission file number 001-10898
The Travelers Companies, Inc.
(Exact name of registrant as specified in its charter)
| Minnesota | 41-0518860 |
| (State or other jurisdiction of incorporation or organization) | (I.R.S. Employer Identification No.) |
485 Lexington Avenue
New York**,** NY 10017
(Address of principal executive offices) (Zip code)
(917) 778-6000
(Registrant’s telephone number, including area code)
Securities registered pursuant to Section 12(b) of the Act:
| Title of each class | Trading Symbol(s) | Name of each exchange on which registered | ||
| Common stock, without par value | TRV | New York Stock Exchange |
Securities registered pursuant to Section 12(g) of the Act: None
Indicate by check mark if the registrant is a well-known seasoned issuer (as defined in Rule 405 of the Securities Act). Yes x No ¨
Indicate by check mark if the registrant is not required to file reports pursuant to Section 13 or Section 15(d) of the Act. Yes ☐ No x
Indicate by check mark whether the registrant (1) has filed all reports required to be filed by Section 13 or 15(d) of the Securities Exchange Act of 1934 during the preceding 12 months (or for such shorter period that the registrant was required to file such reports), and (2) has been subject to such filing requirements for the past 90 days.Yes x No ¨
Indicate by check mark whether the registrant has submitted electronically every Interactive Data File required to be submitted pursuant to Rule 405 of Regulation S-T (§232.405 of this chapter) during the preceding 12 months (or for such shorter period that the registrant was required to submit such files). Yes x No ¨
Indicate by check mark whether the registrant is a large accelerated filer, an accelerated filer, a non-accelerated filer, a smaller reporting company, or an emerging growth company. See the definitions of “large accelerated filer,” “accelerated filer,” “smaller reporting company,” and “emerging growth company” in Rule 12b-2 of the Act:
| Large accelerated filer | x | Accelerated filer | ¨ |
| Non-accelerated filer | ¨ | Smaller reporting company | ☐ |
| Emerging growth company | ☐ |
If an emerging growth company, indicate by check mark if the registrant has elected not to use the extended transition period for complying with any new or revised financial accounting standards provided pursuant to Section 13(a) of the Exchange Act. ¨
Indicate by check mark whether the registrant is a shell company (as defined in Rule 12b-2 of the Act). Yes ☐ No x
As of June 28, 2019, the aggregate market value of the registrant's voting and non-voting common equity held by non-affiliates was $38,824,535,607.
As of February 7, 2020, 255,030,905 shares of the registrant's common stock (without par value) were outstanding.
DOCUMENTS INCORPORATED BY REFERENCE
Portions of the Registrant's Proxy Statement relating to the 2020 Annual Meeting of Shareholders are incorporated by reference into Part III of this report.
The Travelers Companies, Inc.
Annual Report on Form 10-K
For Fiscal Year Ended December 31, 2019
TABLE OF CONTENTS
PART I
Item 1. BUSINESS
The Travelers Companies, Inc. (together with its consolidated subsidiaries, the Company) is a holding company principally engaged, through its subsidiaries, in providing a wide range of commercial and personal property and casualty insurance products and services to businesses, government units, associations and individuals. The Company is incorporated as a general business corporation under the laws of the State of Minnesota and is one of the oldest insurance organizations in the United States, dating back to 1853. The principal executive offices of the Company are located at 485 Lexington Avenue, New York, New York 10017, and its telephone number is (917) 778-6000. The Company also maintains executive offices in Hartford, Connecticut, and St. Paul, Minnesota. The term “TRV” in this document refers to The Travelers Companies, Inc., the parent holding company excluding subsidiaries.
PROPERTY AND CASUALTY INSURANCE OPERATIONS
The property and casualty insurance industry is highly competitive in the areas of price, service, product offerings, agent relationships and methods of distribution. Distribution methods include the use of local independent agents, national agent partners, agency aggregators and carrier-based agencies, as well as direct to consumer, affinity and emerging partner platforms. According to A.M. Best, there are approximately 1,130 property and casualty groups in the United States, comprising approximately 2,600 property and casualty companies. Of those groups, the top 150 accounted for approximately 93% of the consolidated industry’s total net written premiums in 2018. The Company competes with both foreign and domestic insurers. In addition, several property and casualty insurers writing commercial lines of business, including the Company, offer products for alternative forms of risk protection in addition to traditional insurance products. These products include large deductible programs and various forms of self-insurance, some of which utilize captive insurance companies and risk retention groups. The Company’s competitive position in the marketplace is based on many factors, including the following:
| • | ability to profitably price business, retain existing customers and obtain new business; |
| • | premiums charged, contract terms and conditions, products and services offered (including the ability to design customized programs); |
| • | agent, broker and policyholder relationships; |
| • | ability to keep pace relative to competitors with changes in technology and information systems; |
| • | ability to use data and analytics to make decisions; |
| • | speed of claims payment; |
| • | ability to provide a positive customer experience; |
| • | ability to provide products and services in a cost effective manner; |
| • | ability to provide new products and services to meet changing customer needs; |
| • | ability to adapt to changes in business models, technology, customer preferences or regulation impacting the markets in which the Company operates; |
| • | perceived overall financial strength and corresponding ratings assigned by independent rating agencies; |
| • | reputation, experience and qualifications of employees; |
| • | geographic scope of business; and |
| • | local presence. |
In addition, the marketplace is affected by the available capacity of the insurance industry, as measured by statutory capital and surplus, and the availability of reinsurance from both traditional sources, such as reinsurance companies and capital markets (through catastrophe bonds), and non-traditional sources, such as hedge funds and pension plans. Industry capacity as measured by statutory capital and surplus expands and contracts primarily in conjunction with profit levels generated by the industry, less amounts returned to shareholders through dividends and share repurchases. Capital raised by debt and equity offerings may also increase statutory capital and surplus.
Pricing and Underwriting
Pricing of the Company’s property and casualty insurance products is generally developed based upon an estimation of expected losses, the expenses associated with producing, issuing and servicing business and managing claims, the time value of money related to the expected loss and expense cash flows, and a reasonable profit margin that considers the capital needed to support the Company’s business. The Company has a disciplined approach to underwriting and risk management that emphasizes product returns and profitable growth over the long-term rather than premium volume or market share. The Company’s insurance subsidiaries are subject to state laws and regulations regarding rate and policy form approvals. The applicable state laws and regulations establish standards in certain lines of business to ensure that rates are not excessive, inadequate, unfairly discriminatory,
or used to engage in unfair price competition. The Company’s ability to increase rates and the relative timing of the process are dependent upon each respective state’s requirements, as well as the competitive market environment.
Geographic Distribution
The following table shows the geographic distribution of the Company’s consolidated direct written premiums for the year ended December 31, 2019:
| Location | % of Total | ||
| Domestic: | |||
| California | 10.0 | % | |
| New York | 9.6 | ||
| Texas | 8.0 | ||
| Pennsylvania | 4.4 | ||
| Florida | 4.1 | ||
| New Jersey | 3.9 | ||
| Illinois | 3.8 | ||
| Georgia | 3.5 | ||
| All other domestic (1) | 46.3 | ||
| Total Domestic | 93.6 | ||
| International: | |||
| Canada | 4.3 | ||
| All other international (1) | 2.1 | ||
| Total International | 6.4 | ||
| Consolidated total | 100.0 | % |
| (1) | No other single state or country accounted for 3.0% or more of the Company’s consolidated direct written premiums written in 2019. |
Catastrophe Exposure
The Company’s property and casualty insurance operations expose it to claims arising out of catastrophes. The Company uses various analyses and methods, including proprietary and third-party computer modeling processes, to continually monitor and analyze underwriting risks of business in natural catastrophe-prone areas and target risk areas for conventional terrorist attacks (defined as attacks other than nuclear, biological, chemical or radiological events). The Company relies, in part, upon these analyses to make underwriting decisions designed to manage its exposure on catastrophe-exposed business. For example, as a result of these analyses, the Company has at various times limited the writing of new property and homeowners business in some markets and has selectively taken underwriting actions on new and existing business. These underwriting actions on new and existing business include tightening underwriting standards, selective price increases and changes to policy terms specific to hurricane-, tornado-, wind-, wildfire- and hail-prone areas. See “Item 7—Management’s Discussion and Analysis of Financial Condition and Results of Operations—Catastrophe Modeling” and “—Changing Climate Conditions.” The Company also utilizes reinsurance to manage its aggregate exposures to catastrophes. See “—Reinsurance.”
BUSINESS INSURANCE
Business Insurance offers a broad array of property and casualty insurance and insurance-related services to its customers, primarily in the United States, as well as in Canada, the United Kingdom, the Republic of Ireland a
Showing the first 8K of 157K characters. Open the full section
Item 1A. RISK FACTORS
You should carefully consider the following risks and all of the other information set forth in this report, including without limitation our consolidated financial statements and the notes thereto and "Item 7—Management's Discussion and Analysis of Financial Condition and Results of Operations—Critical Accounting Estimates."
High levels of catastrophe losses, including as a result of factors such as increased concentrations of insured exposures in catastrophe-prone areas, could materially and adversely affect our results of operations, our financial position and/or liquidity, and could adversely impact our ratings, our ability to raise capital and the availability and cost of reinsurance. Our property and casualty insurance operations expose us to claims arising out of catastrophes. Catastrophes can be caused by various natural events, including, among others, hurricanes, tornadoes and other windstorms, earthquakes, hail, wildfires, severe winter weather, floods, tsunamis, volcanic eruptions, solar flares and other naturally-occurring events. Catastrophes can also be man-made, such as terrorist attacks and other intentionally destructive acts including those involving nuclear, biological, chemical and radiological events, cyber events, explosions and destruction of infrastructure. The geographic distribution of our business subjects us to catastrophe exposures in the United States and Canada, which include, but are not limited to: hurricanes from Maine through Texas; severe wind and hail storms, including tornadoes, throughout the Central, Mid-Atlantic, Southcentral and Southeastern regions of the United States; winter storms, particularly in the Northern and Central regions of the United States and in Canada; earthquakes in California, the New Madrid region and the Pacific Northwest region of North America; wildfires, particularly in western states and Canada; and terrorism in major cities in the United States. In addition to our operations in the United States and Canada, our international operations subject us to catastrophe exposures in the United Kingdom and the Republic of Ireland as well as to a variety of worldwide catastrophe exposures through our Lloyd’s operations.
The incidence and severity of catastrophes are inherently unpredictable, and it is possible that both the frequency and severity of natural and man-made catastrophic events could increase. Severe weather events over the last two decades have underscored the unpredictability of future climate trends, and changing climate conditions could add to the frequency and severity of natural disasters and create additional uncertainty as to future trends and exposures. The insurance industry experienced increased catastrophe losses due to a number of potential causal factors, including, in addition to weather/climate variability, more people living in high-risk areas, population growth in areas with weaker enforcement of building codes, urban expansion and an increase in the average size of a house. For example, hurricane activity has impacted areas further inland than previously experienced by us, and demographic changes have resulted in larger populations in coastal areas which historically have been subject to severe storms and related storm surge, thus expanding our potential for losses from hurricanes. Additionally, both the frequency and severity of tornado and hail storms in the United States have been more volatile during the last decade. The frequency and severity of wildfire losses have been elevated in more recent years, due in part to record droughts in California that some climate studies suggest are likely to increase over time. Demographic changes in areas prone to wildfires have also expanded our potential for losses from wildfires.
All of the catastrophe modeling tools that we use, or that we rely on from outside parties, to evaluate certain of our catastrophe exposures are based on assumptions and judgments that are subject to error and mis-estimation. As a result, these models may produce estimates that are materially different than actual results. In addition, compared to models for hurricanes, models for earthquakes are less reliable due to there being a more limited number of significant historical events to analyze, while models for tornadoes and hail storms are newer and may be less reliable due to the highly random geographic nature and size of these events. Accordingly, these models may have greater difficulty predicting risks and estimating losses. Further, changes in climate conditions could cause our underlying modeling data to be less predictive, thus limiting our ability to effectively evaluate and manage catastrophe risk. As compared to natural catastrophes, modeling for man-made catastrophes, such as terrorism and cyber events, is even more difficult and less reliable, and for some events (both natural and man-made), models are either in early stages of development and, therefore, not widely adopted, or are not available. See "We may be adversely affected if our pricing and capital models provide materially different indications than actual results" below as well as "Item 7—Management's Discussion and Analysis of Financial Condition and Results of Operations—Catastrophe Modeling" and "—Changing Climate Conditions."
The extent of losses from a catastrophe is a function of the total amount of insured exposure affected by the event, the severity of the event and the coverage provided, which can be both property and casualty coverages. Increases in the value and geographic concentration of insured property, the number of policyholders exposed to certain events and the effects of inflation could increase the severity of claims resulting from a catastrophe. For example, the specific geographic location impacted by tornadoes is
inherently random and unpredictable and the specific location impacted by a tornado may or may not be highly populated and may or may not have a high concentration of our insured exposures. Similarly, the potential for losses from a cyber event can be magnified to the extent that the event impacts platforms, systems or vulnerabilities shared by a large number of policyholders.
States have from time to time passed legislation, and regulators have taken action, that have the effect of limiting the ability of insurers to manage catastrophe risk, such as legislation restricting insurers from reducing exposures or withdrawing from catastrophe-prone areas or mandating that insurers participate in residual markets. Participation in residual market mechanisms has resulted in, and may in the future result in, significant losses or assessments to insurers, including us, and, in certain states, those losses or assessments may not be commensurate with our direct catastrophe exposure in those states. If our competitors leave those states having residual market mechanisms, remaining insurers, including us, may be subject to significant increases in losses or assessments following a catastrophe. In addition, following catastrophes, there are sometimes legislative and administrative initiatives and court decisions that seek to expand insurance coverage for catastrophe claims beyond the original intent of the policies, seek to prevent the application of deductibles included in the policies or seek to limit the exercise of certain rights available to insurers under the policies. Also, our ability to adjust terms, including deductible levels, or to increase pricing to the extent necessary to offset rising costs related to catastrophes, particularly in the Personal Insurance segment, requires approval of regulatory authorities of certain states. Our ability or our willingness to manage our catastrophe exposure by raising prices, modifying underwriting terms or reducing exposure to certain geographies may be limited due to considerations of public policy, the evolving political environment and/or changes in the general economic climate. Furthermore
Showing the first 8K of 115K characters. Open the full section
Item 1B. UNRESOLVED STAFF COMMENTS
NONE.
Item 2. PROPERTIES
The Company leases its principal executive offices in New York, New York, as well as approximately 171 field and claim offices throughout the United States under leases or subleases with third parties. The Company also leases offices outside the United States, including in Canada, the United Kingdom and the Republic of Ireland. The Company owns six buildings in Hartford, Connecticut. The Company also owns buildings located in other areas of Connecticut; Norcross, Georgia; St. Paul, Minnesota; and Omaha, Nebraska. The Company owns a building in London, England, which houses a portion of Business Insurance’s operations in the United Kingdom.
In the opinion of the Company’s management, the Company’s properties are adequate and suitable for its business as presently conducted and are adequately maintained.
Item 3. LEGAL PROCEEDINGS
The information required with respect to this item can be found under "Contingencies" in note 16 of notes to the consolidated financial statements in this annual report and is incorporated by reference into this Item 3.
Item 4. MINE SAFETY DISCLOSURES
NONE.
INFORMATION ABOUT OUR EXECUTIVE OFFICERS
Information about the Company's executive officers is incorporated by reference from Part III—Item 10 of this annual report.
PART II
Item 5. MARKET FOR REGISTRANT'S COMMON EQUITY, RELATED SHAREHOLDER MATTERS AND ISSUER PURCHASES OF EQUITY SECURITIES
The Company’s common stock is traded on the New York Stock Exchange under the symbol “TRV.” The number of holders of record of the Company’s common stock was 38,014 as of February 7, 2020. This is not the actual number of beneficial owners of the Company’s common stock as some shares are held in “street name” by brokers and others on behalf of individual owners.
For information regarding dividends paid to shareholders in 2019, 2018 and 2017, and the declaration and payment of future dividends, see "Item 7—Management's Discussion and Analysis of Financial Condition and Results of Operations—Liquidity and Capital Resources—Financing Activities—Dividends."
SHAREHOLDER RETURN PERFORMANCE GRAPH
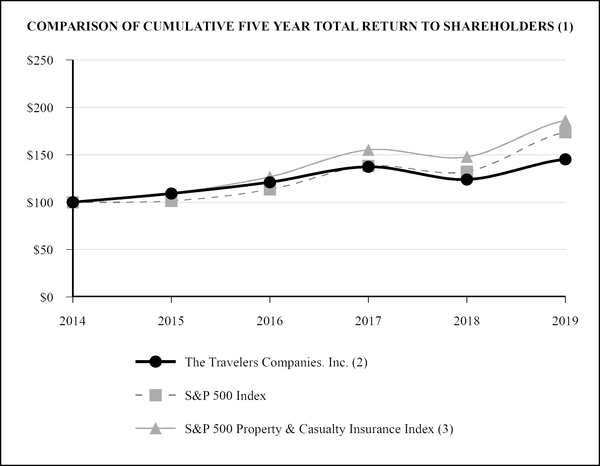
The following graph shows a five-year comparison of the cumulative total return to shareholders for the Company’s common stock and the common stock of companies included in the S&P 500 Index and the S&P 500 Property & Casualty Insurance Index, which the Company believes is the most appropriate comparative index.
| As of December 31, | ||||||||||||||||||||||||
| 2014 | 2015 | 2016 | 2017 | 2018 | 2019 | |||||||||||||||||||
| The Travelers Companies, Inc. | $ | 100.00 | $ | 109.09 | $ | 121.04 | $ | 137.23 | $ | 123.99 | $ | 145.08 | ||||||||||||
| S&P 500 Index | 100.00 | 101.38 | 113.51 | 138.29 | 132.23 | 173.86 | ||||||||||||||||||
| S&P 500 Property & Casualty Insurance Index | 100.00 | 109.53 | 126.73 | 155.10 | 147.83 | 186.07 |
| (1) | The cumulative total return to shareholders is a concept used to compare the performance of a company's stock over time. Cumulative total return to shareholders is calculated as the net stock price change for the specified time period plus the cumulative amount of dividends (assuming dividend reinvestment on the respective dividend payment dates) divided by the stock price at the beginning of the time period. |
| (2) | Assumes $100 invested in common shares of The Travelers Companies, Inc. on December 31, 2014. |
| (3) | Companies in the S&P 500 Property & Casualty Insurance Index as of December 31, 2019 were the following: The Travelers Companies, Inc., Chubb Limited, Cincinnati Financial Corporation, The Progressive Corporation, The Allstate Corporation, Loews Corporation (CNA) and WR Berkley Corporation. Returns of each of the companies included in this index have been weighted according to their respective market capitalizations. |
A long-term perspective is particularly important in the property and casualty insurance industry, where the periodic occurrences of significant catastrophes have historically produced results that can vary significantly year-to-year. Accordingly, the Company manages with a long-term perspective. From January 1, 2007, the year prior to the financial crisis, through December 31, 2019, the Company's cumulative return to shareholders was 251% as compared to 200% for the S&P 500 Index and 165% for the S&P 500 Property & Casualty Insurance Index.
ISSUER PURCHASES OF EQUITY SECURITIES
The table below sets forth information regarding repurchases by the Company of its common stock during the periods indicated.
| Period Beginning | Period Ending | Total number of shares purchased | Average price paid per share | Total number of shares purchased as part of publicly announced plans or programs | Approximate dollar value of shares that may yet be purchased under the plans or programs (in millions) | |||||||||||
| Oct. 1, 2019 | Oct. 31, 2019 | 228,316 | $ | 130.64 | 226,015 | $ | 2,132 | |||||||||
| Nov. 1, 2019 | Nov. 30, 2019 | 1,351,821 | $ | 133.77 | 1,350,490 | $ | 1,951 | |||||||||
| Dec. 1, 2019 | Dec. 31, 2019 | 1,219,658 | $ | 135.67 | 1,215,288 | $ | 1,786 | |||||||||
| Total | 2,799,795 | $ | 134.34 | 2,791,793 | $ | 1,786 |
The Company’s Board of Directors has approved common share repurchase authorizations under which repurchases may be made from time to time in the open market, pursuant to pre-set trading plans meeting the requirements of Rule 10b5-1 under the Securities Exchange Act of 1934, in private transactions or otherwise. The authorizations do not have a stated expiration date. The most recent authorization was approved by the Board of Directors in April 2017 and added $5.0 billion of repurchase capacity to the $709 million capacity remaining at that date. The timing and actual number of shares to be repurchased in the future will depend on a variety of factors, including the Company’s financial position, earnings, share price, catastrophe losses, maintaining capital levels commensurate with the Company’s desired ratings from independent rating agencies, changes in levels of written premiums, funding of the Company’s qualified pension plan, capital requirements of the Company’s operating subsidiaries, legal requirements, regulatory constraints, other investment opportunities (including mergers and acquisitions and related financings), market conditions and other factors.
The Company acquired 8,002 shares for a total cost of approximately $1.1 million during the three months ended December 31, 2019 that were not part of the publicly announced share repurchase authorization. These shares consisted of shares retained to cover payroll withholding taxes in connection with the vesting of restricted stock unit awards and performance share awards, and shares used by employees to cover the price of certain stock options that were exercised.
For additional information regarding the Company's share repurchases, see "Item 7—Management's Discussion and Analysis of Financial Condition and Results of Operations—Liquidity and Capital Resources."
Information relating to compensation plans under which the Company's equity securities are authorized for issuance is set forth in "Part III—Item 12" of this Report.
Item 6. SELECTED FINANCIAL DATA
| At and for the year ended December 31, | ||||||||||||||||||||
| (in millions, except per share amounts) | 2019 | 2018 | 2017 | 2016 | 2015 | |||||||||||||||
| Total revenues | $ | 31,581 | $ | 30,282 | $ | 28,902 | $ | 27,625 | $ | 26,815 | ||||||||||
| Net income | $ | 2,622 | $ | 2,523 | $ | 2,056 | $ | 3,014 | $ | 3,439 | ||||||||||
| Total investments | $ | 77,884 | $ | 72,278 | $ | 72,502 | $ | 70,488 | $ | 70,470 | ||||||||||
| Total assets | 110,122 | 104,233 | 103,483 | 100,245 | 100,184 | |||||||||||||||
| Claims and claim adjustment expense reserves | 51,849 | 50,668 | 49,650 | 47,949 | 48,295 | |||||||||||||||
| Total long-term debt | 5,958 | 5,964 | 5,971 | 5,887 | 5,844 | |||||||||||||||
| Total liabilities | 84,179 | 81,339 | 79,752 | 77,024 | 76,586 | |||||||||||||||
| Total shareholders' equity | 25,943 | 22,894 | 23,731 | 23,221 | 23,598 | |||||||||||||||
| Net income per share | ||||||||||||||||||||
| Basic | $ | 10.01 | $ | 9.37 | $ | 7.39 | $ | 10.39 | $ | 10.99 | ||||||||||
| Diluted | $ | 9.92 | $ | 9.28 | $ | 7.33 | $ | 10.28 | $ | 10.88 | ||||||||||
| Year-end common shares outstanding | 255.5 | 263.6 | 271.4 | 279.6 | 295.9 | |||||||||||||||
| Per common share amounts | ||||||||||||||||||||
| Cash dividends | $ | 3.23 | $ | 3.03 | $ | 2.83 | $ | 2.62 | $ | 2.38 | ||||||||||
| Book value | $ | 101.55 | $ | 86.84 | $ | 87.46 | $ | 83.05 | $ | 79.75 |
Item 7. MANAGEMENT’S DISCUSSION AND ANALYSIS OF FINANCIAL CONDITION AND RESULTS OF OPERATIONS
The following is a discussion and analysis of the Company’s financial condition and results of operations for the years ended December 31, 2019 and 2018, including year-to-year comparisons between 2019 and 2018. Year-to-year comparisons between 2018 and 2017 have been omitted from this Form 10-K, but may be found in "Management's Discussion and Analysis of Financial Condition and Results of Operations" in Part II, Item 7 of the Company's Annual Report on Form 10-K for the year ended December 31, 2018.
FINANCIAL HIGHLIGHTS
2019 Consolidated Results of Operations
| • | Net income of $2.62 billion, or $10.01 per share basic and $9.92 per share diluted |
| • | Net earned premiums of $28.27 billion |
| • | Catastrophe losses of $886 million ($699 million after-tax) |
| • | Net unfavorable prior year reserve development of $60 million ($47 million after-tax) |
| • | Combined ratio of 96.5% |
| • | Net investment income of $2.47 billion ($2.10 billion after-tax) |
- Operating cash flows of $5.21 billion
2019 Consolidated Financial Condition
| • | Total investments of $77.88 billion; fixed maturities and short-term securities comprise 94% of total investments |
| • | Total assets of $110.12 billion |
| • | Total debt of $6.56 billion, resulting in a debt-to-total capital ratio of 20.2% (21.7% excluding net unrealized investment gains, net of tax, included in shareholders' equity) |
| • | Repurchased 11.2 million common shares for total cost of $1.55 billion and paid $844 million of dividends to shareholders |
| • | Shareholders’ equity of $25.94 billion |
| • | Net unrealized investment gains of $2.85 billion ($2.25 billion after-tax) |
| • | Book value per common share of $101.55 |
| • | Holding company liquidity of $1.43 billion |
CONSOLIDATED OVERVIEW
Consolidated Results of Operations
| (for the year ended December 31, in millions except per share amounts) | 2019 | 2018 | 2017 | |||||||||
| Revenues | ||||||||||||
| Premiums | $ | 28,272 | $ | 27,059 | $ | 25,683 | ||||||
| Net investment income | 2,468 | 2,474 | 2,397 | |||||||||
| Fee income | 459 | 432 | 447 | |||||||||
| Net realized investment gains | 113 | 114 | 216 | |||||||||
| Other revenues | 269 | 203 | 159 | |||||||||
| Total revenues | 31,581 | 30,282 | 28,902 | |||||||||
| Claims and expenses | ||||||||||||
| Claims and claim adjustment expenses | 19,133 | 18,291 | 17,467 | |||||||||
| Amortization of deferred acquisition costs | 4,601 | 4,381 | 4,166 | |||||||||
| General and administrative expenses | 4,365 | 4,297 | 4,170 | |||||||||
| Interest expense | 344 | 352 | 369 | |||||||||
| Total claims and expenses | 28,443 | 27,321 | 26,172 | |||||||||
| Income before income taxes | 3,138 | 2,961 | 2,730 | |||||||||
| Income tax expense(1) | 516 | 438 | 674 | |||||||||
| Net income | $ | 2,622 | $ | 2,523 | $ | 2,056 | ||||||
| Net income per share | ||||||||||||
| Basic | $ | 10.01 | $ | 9.37 | $ | 7.39 | ||||||
| Diluted | $ | 9.92 | $ | 9.28 | $ | 7.33 | ||||||
| Combined ratio | ||||||||||||
| Loss and loss adjustment expense ratio | 66.9 | % | 66.8 | % | 67.2 | % | ||||||
| Underwriting expense ratio | 29.6 | 30.1 | 30.7 | |||||||||
| Combined ratio | 96.5 | % | 96.9 | % | 97.9 | % |
| (1) | On December 22, 2017, the U.S. enacted the Tax Cuts and Jobs Act of 2017 (TCJA) which, among other changes, reduced the U.S. Federal tax rate from 35% to 21% beginning on January 1, 2018 and imposed a tax on undistributed and previously untaxed post-1986 foreign earnings and profits (accumulated foreign earnings). Total income tax expense for 2017 included a net charge of $129 million to reflect the estimated impact of the changes in tax law and tax rates included in TCJA at the date of enactment, primarily reflecting the revaluation of the Company’s deferred tax assets and liabilities at the new statutory federal tax rate of 21%, and the recognition of tax imposed on the accumulated foreign earnings. |
The following discussions of the Company’s net income and segment income are presented on an after-tax basis. Discussions of the components of net income and segment income are presented on a pre-tax basis, unless otherwise noted. Discussions of earnings per common share are presented on a diluted basis.
Overview
Diluted net income per share of $9.92 in 2019 increased by 7% over diluted net income per share of $9.28 in 2018. Net income of $2.62 billion in 2019 increased by 4% over net income of $2.52 billion in 2018. The higher rate of increase in diluted net income per share reflected the impact of share repurchases in recent periods. The increase in income before income taxes primarily reflected the pre-tax impacts of (i) significantly lower catastrophe losses, partially offset by (ii) net unfavorable prior year reserve development in 2019 compared to net favorable prior year reserve development in 2018 and (iii) lower underwriting margins excluding catastrophe losses and prior year reserve development ("underlying underwriting margins"). Catastrophe losses in 2019 and 2018 were $886 million and $1.72 billion, respectively. Net unfavorable prior year reserve development in 2019 was $60 million, compared to net favorable prior year reserve development of $517 million in 2018. Underlying underwriting margins in each of the Company's business segments were lower than in 2018. Income tax expense in 2019 was higher than in 2018, primarily
reflecting the impacts of (i) the increase in income before income taxes and (ii) the reduction in income tax expense in 2018 resulting from the Company's $200 million voluntary contribution to its qualified domestic pension plan, which provided a 35% tax benefit rather than a 21% tax benefit.
The Company has insurance operations in Canada, the United Kingdom, the Republic of Ireland and throughout other parts of the world as a corporate member of Lloyd’s, as well as in Brazil and Colombia, primarily through joint ventures. Because these operations are conducted in local currencies other than the U.S. dollar, the Company is subject to changes in foreign currency exchange rates. For the years ended December 31, 2019 and 2018, changes in foreign currency exchange rates impacted reported line items in the statement of income by insignificant amounts. The impact of these changes was not material to the Company’s net income or segment income for the periods reported.
Revenues
Earned Premiums
Earned premiums in 2019 were $28.27 billion, $1.21 billion or 4% higher than in 2018. In Business Insurance, earned premiums in 2019 increased by 4% over 2018. In Bond & Specialty Insurance, earned premiums in 2019 increased by 6% over 2018. In Personal Insurance, earned premiums in 2019 increased by 5% over 2018. Factors contributing to the increases in earned premiums in each segment in 2019 as compared with 2018 are discussed in more detail in the
Showing the first 8K of 267K characters. Open the full section
Item 7A. QUANTITATIVE AND QUALITATIVE DISCLOSURES ABOUT MARKET RISK
MARKET RISK
Market risk is the risk of loss arising from adverse changes in market rates and prices, such as interest rates (inclusive of credit spreads), foreign currency exchange rates and other relevant market rate or price changes. Market risk is directly influenced by the volatility and liquidity in the markets in which the related underlying assets are traded. The following is a discussion of the Company's primary market risk exposures and how those exposures are managed as of December 31, 2019. The Company's market risk sensitive instruments, including derivatives, are primarily entered into for purposes other than trading.
The carrying value of the Company's investment portfolio at December 31, 2019 and 2018 was $77.88 billion and $72.28 billion, respectively, of which 87% and 88% was invested in fixed maturity securities, respectively. At December 31, 2019 and 2018, approximately 6.6% and 6.7%, respectively, of the Company's invested assets were denominated in foreign currencies. The Company's exposure to equity price risk is not significant. The Company has no direct commodity risk and is not a party to any credit default swaps.
The primary market risks to the investment portfolio are interest rate risk and credit risk associated with investments in fixed maturity securities. The portfolio duration is primarily managed through cash market transactions and treasury futures transactions. For additional information regarding the Company’s investments, see notes 3 and 4 of notes to the consolidated financial statements as well as the “Investment Portfolio” and “Outlook” sections of “Item 7—Management’s Discussion and Analysis of Financial Condition and Results of Operations.”
The primary market risk for all of the Company’s debt is interest rate risk at the time of refinancing. The Company monitors the interest rate environment and evaluates refinancing opportunities as maturity dates approach. For additional information regarding the Company’s debt, see note 8 of notes to the consolidated financial statements as well as the “Liquidity and Capital Resources” section of “Item 7—Management’s Discussion and Analysis of Financial Condition and Results of Operations.”
The Company’s foreign exchange market risk exposure is concentrated in the Company’s invested assets, insurance reserves and shareholders’ equity denominated in foreign currencies. Cash flows from the Company’s foreign operations are the primary source of funds for the purchase of investments denominated in foreign currencies. The Company purchases these investments primarily to fund insurance reserves and other liabilities denominated in the same currency, effectively reducing its foreign currency exchange rate exposure. Invested assets denominated in the Canadian dollar comprised approximately 4.2% and 4.1% of the total invested assets at December 31, 2019 and 2018, respectively. Invested assets denominated in the British Pound Sterling comprised approximately 1.7% and 1.9% of total invested assets at December 31, 2019 and 2018, respectively. Invested assets denominated in other currencies at December 31, 2019 and 2018 were not material.
There were no other significant changes in the Company's primary market risk exposures or in how those exposures were managed for the year ended December 31, 2019 compared to the year ended December 31, 2018. The Company does not currently anticipate significant changes in its primary market risk exposures or in how those exposures are managed in future reporting periods based upon what is known or expected to be in effect in future reporting periods.
SENSITIVITY ANALYSIS
Sensitivity analysis is defined as the measurement of potential loss in future earnings, fair values or cash flows of market sensitive instruments resulting from one or more selected hypothetical changes in interest rates and other market rates or prices over a selected period of time. In the Company’s sensitivity analysis model, a hypothetical change in market rates is selected that is expected to reflect reasonably possible near-term changes in those rates. “Near-term” means a period of time going forward up to one year from the date of the consolidated financial statements. Actual results may differ from the hypothetical change in market rates assumed in this disclosure, especially since this sensitivity analysis does not reflect the results of any actions that would be taken by the Company to mitigate such hypothetical losses in fair value.
Interest Rate Risk
In this sensitivity analysis model, the Company uses fair values to measure its potential loss. The sensitivity analysis model includes the following financial instruments entered into for purposes other than trading: fixed maturities, non-redeemable preferred stocks, mortgage loans, short-term securities and debt and derivative financial instruments. The primary market risk to the Company's market sensitive instruments is interest rate risk (inclusive of credit spreads). The sensitivity analysis model uses various basis point changes in interest rates to measure the hypothetical change in fair value of financial instruments included in the model.
For invested assets with primary exposure to interest rate risk, estimates of portfolio duration and convexity are used to model the loss of fair value that would be expected to result from a parallel increase in interest rates. Durations on invested assets are adjusted for call, put and interest rate reset features. Durations on tax-exempt securities are adjusted for the fact that the yields on such securities do not normally move in lockstep with changes in the U.S. Treasury curve. Fixed maturity portfolio durations are calculated on a market value-weighted basis, including accrued interest, using holdings as of December 31, 2019 and 2018.
For debt, the change in fair value is determined by calculating hypothetical December 31, 2019 and 2018 ending prices based on yields adjusted to reflect a 100 basis point change, comparing such hypothetical ending prices to actual ending prices, and multiplying the difference by the par or securities outstanding.
The sensitivity analysis model used by the Company produces a loss in fair value of market sensitive instruments of approximately $2.07 billion and $2.31 billion based on a 100 basis point increase in interest rates at December 31, 2019 and 2018, respectively.
The loss estimates do not take into account the impact of possible interventions that the Company might reasonably undertake in order to mitigate or avoid losses that would result from emerging interest rate trends. In addition, the loss value only reflects the impact of an interest rate increase on the fair value of the Company's financial instruments.
Foreign Currency Exchange Rate Risk
The Company uses fair values of investment securities to measure its potential loss from foreign denominated investments. A hypothetical 10% reduction in value of foreign denominated investments is used to estimate the impact on the market value of the foreign denominated holdings. The Company's analysis indicates that a hypothetical 10% reduction in the value of foreign denominated investments would be expected to produce a loss in fair value of approximately $515 million and $487 million at December 31, 2019 and 2018, respectively.
Item 8. FINANCIAL STATEMENTS AND SUPPLEMENTARY DATA
INDEX TO CONSOLIDATED FINANCIAL STATEMENTS AND SCHEDULES
Report of Independent Registered Public Accounting Firm
To the Shareholders and Board of Directors
The Travelers Companies, Inc.:
Opinion on the Consolidated Financial Statements
We have audited the accompanying consolidated balance sheet of The Travelers Companies, Inc. and subsidiaries (the Company) as of December 31, 2019 and 2018, the related consolidated statements of income, comprehensive income, changes in shareholders’ equity, and cash flows for each of the years in the three‑year period ended December 31, 2019, and the related notes and financial statement schedules as listed in the accompanying index to consolidated financial statements and schedules (collectively, the consolidated financial statements). In our opinion, the consolidated financial statements present fairly, in all material respects, the financial position of the Company as of December 31, 2019 and 2018, and the results of its operations and its cash flows for each of the years in the three‑year period ended December 31, 2019, in conformity with U.S. generally accepted accounting principles.
We also have audited, in accordance with the standards of the Public Company Accounting Oversight Board (United States) (PCAOB), the Company’s internal control over financial reporting as of December 31, 2019, based on criteria established in Internal Control—Integrated Framework (2013) issued by the Committee of Sponsoring Organizations of the Treadway Commission, and our report dated February 13, 2020 expressed an unqualified opinion on the effectiveness of the Company’s internal control over financial reporting.
Basis for Opinion
These consolidated financial statements are the responsibility of the Company’s management. Our responsibility is to express an opinion on these consolidated financial statements based on our audits. We are a public accounting firm registered with the PCAOB and are required to be independent with respect to the Company in accordance with the U.S. federal securities laws and the applicable rules and regulations of the Securities and Exchange Commission and the PCAOB.
We conducted our audits in accordance with the standards of the PCAOB. Those standards require that we plan and perform the audit to obtain reasonable assurance about whether the consolidated financial statements are free of material misstatement, whether due to error or fraud. Our audits included performing procedures to assess the risks of material misstatement of the consolidated financial statements, whether due to error or fraud, and performing procedures that respond to those risks. Such procedures included examining, on a test basis, evidence regarding the amounts and disclosures in the consolidated financial statements. Our audits also included evaluating the accounting principles used and significant estimates made by management, as well as evaluating the overall presentation of the consolidated financial statements. We believe that our audits provide a reasonable basis for our opinion.
Critical Audit Matter
The critical audit matter communicated below is a matter arising from the current period audit of the consolidated financial statements that was communicated or required to be communicated to the audit committee and that: (1) relates to accounts or disclosures that are material to the consolidated financial statements and (2) involved our especially challenging, subjective, or complex judgment. The communication of a critical audit matter does not alter in any way our opinion on the consolidated financial statements, taken as a whole, and we are not, by communicating the critical audit matter below, providing a separate opinion on the critical audit matter or on the accounts or disclosures to which it relates.
Evaluation of the estimate of claims and claim adjustment expense reserves
As discussed in Notes 1 and 7 to the consolidated financial statements, the Company’s claims and claim adjustment expense reserves balance at December 31, 2019 was $51.8 billion. The claims and claim adjustment expense reserves represent the Company’s estimate of the ultimate liability for unpaid claims, which is comprised of claims that have been reported and claims that have been incurred but not reported.
We identified the evaluation of the estimate of claims and claim adjustment expense reserves as a critical audit matter. The process of evaluating the estimate of claims and claim adjustment expense reserves involves significant auditor judgment due to the inherent uncertainty in the ultimate amounts and timing of claim payments, which may be affected by a number of internal and external considerations, such as:
| • | Changes in claims handling procedures; |
| • | Economic inflation and changes in the tort environment; and |
| • | Legislative changes, among others. |
Evaluating the impact of these considerations on the ultimate costs of claims and claim adjustment expenses requires specialized skills and knowledge.
The primary procedures we performed to address this critical audit matter included the following. We tested certain internal controls over the Company’s reserving process for claims and claim adjustment expense reserves, including controls related to the actuarial analyses and the determination of the Company’s estimate of the claims and claim adjustment expense reserves. We involved actuarial professionals with specialized skills and knowledge who assisted in:
| • | Assessing the assumptions and methodologies underlying the Company’s reserve estimate by participating in quarterly discussions with the Company’s actuaries; |
| • | Evaluating the Company’s estimates by performing independent analyses of net and gross claims and claim adjustment expense reserves for certain lines of business; |
| • | Assessing the Company's internally prepared actuarial analyses in comparison to the Company's internal experience and related industry trends for selected other lines of business; and |
| | | | ---
Showing the first 8K of 408K characters. Open the full section
Item 9. CHANGES IN AND DISAGREEMENTS WITH ACCOUNTANTS ON ACCOUNTING AND FINANCIAL DISCLOSURE
Not Applicable.
Item 9A. CONTROLS AND PROCEDURES
The Company maintains disclosure controls and procedures (as that term is defined in Rules 13a-15(e) and 15d-15(e) under the Securities Exchange Act of 1934, as amended (Exchange Act)) that are designed to ensure that information required to be disclosed in the Company’s reports under the Exchange Act is recorded, processed, summarized and reported within the time periods specified in the SEC’s rules and forms, and that such information is accumulated and communicated to the Company’s management, including its Chief Executive Officer and Chief Financial Officer, as appropriate, to allow timely decisions regarding required disclosures. Any controls and procedures, no matter how well designed and operated, can provide only reasonable assurance of achieving the desired control objectives. The Company’s management, with the participation of the Company’s Chief Executive Officer and Chief Financial Officer, has evaluated the effectiveness of the design and operation of the Company’s disclosure controls and procedures as of December 31, 2019. Based upon that evaluation, the Company’s Chief Executive Officer and Chief Financial Officer concluded that, as of December 31, 2019, the design and operation of the Company’s disclosure controls and procedures were effective to accomplish their objectives at the reasonable assurance level.
In addition, there was no change in the Company’s internal control over financial reporting (as that term is defined in Rules 13a-15(f) and 15d-15(f) under the Exchange Act) that occurred during the quarter ended December 31, 2019 that has materially affected, or is reasonably likely to materially affect, the Company’s internal control over financial reporting.
The Company regularly seeks to identify, develop and implement improvements to its technology systems and business processes, some of which may affect its internal control over financial reporting. These changes may include such activities as implementing new, more efficient systems, updating existing systems or platforms, automating manual processes or utilizing technology developed by third parties. These systems changes are often phased in over multiple periods in order to limit the implementation risk in any one period, and as each change is implemented the Company monitors its effectiveness as part of its internal control over financial reporting.
Management's Report on Internal Control Over Financial Reporting
Management of the Company is responsible for establishing and maintaining adequate internal control over financial reporting. The Company’s internal control over financial reporting is designed to provide reasonable assurances regarding the reliability of financial reporting and the preparation of the consolidated financial statements of the Company in accordance with U.S. generally accepted accounting principles. The Company’s accounting policies and internal controls over financial reporting, established and maintained by management, are under the general oversight of the Company’s Audit Committee.
The Company’s internal control over financial reporting includes those policies and procedures that:
| • | pertain to the maintenance of records that, in reasonable detail, accurately and fairly reflect the transactions and dispositions of the assets of the Company; |
| • | provide reasonable assurance that transactions are recorded as necessary to permit preparation of financial statements in accordance with U.S. generally accepted accounting principles, and that receipts and expenditures are being made only in accordance with authorizations of the Company’s management and directors; and |
| • | provide reasonable assurance regarding prevention or timely detection of unauthorized acquisition, use or disposition of assets that could have a material effect on the financial statements. |
Because of its inherent limitations, internal control over financial reporting may not prevent or detect misstatements. Also, projections of any evaluation of effectiveness to future periods are subject to the risk that controls may become inadequate because of changes in conditions, or that the degree of compliance with the policies or procedures may deteriorate.
Management has assessed the Company’s internal control over financial reporting as of December 31, 2019. The standard measures adopted by management in making its evaluation are the measures in the Internal Control ‑ Integrated Framework (2013) published by the Committee of Sponsoring Organizations of the Treadway Commission.
Based upon its assessment, management has concluded that the Company’s internal control over financial reporting was effective at December 31, 2019, and that there were no material weaknesses in the Company’s internal control over financial reporting as of that date.
KPMG LLP, an independent registered public accounting firm, which has audited and reported on the consolidated financial statements contained in this Form 10-K, has issued its report on the effectiveness of the Company’s internal control over financial reporting which follows this report.
Report of Independent Registered Public Accounting Firm
To the Shareholders and Board of Directors
The Travelers Companies, Inc.:
Opinion on Internal Control Over Financial Reporting
We have audited The Travelers Companies, Inc. and subsidiaries’ (the Company) internal control over financial reporting as of December 31, 2019, based on criteria established in Internal Control - Integrated Framework (2013) issued by the Committee of Sponsoring Organizations of the Treadway Commission. In our opinion, the Company maintained, in all material respects, effective internal control over financial reporting as of December 31, 2019, based on criteria established in Internal Control - Integrated Framework (2013) issued by the Committee of Sponsoring Organizations of the Treadway Commission.
We also have audited, in accordance with the standards of the Public Company Accounting Oversight Board (United States) (PCAOB), the consolidated balance sheet of the Company as of December 31, 2019 and 2018, the related consolidated statements of income, comprehensive income, changes in shareholders’ equity, and cash flows for each of the years in the three-year period ended December 31, 2019, and the related notes and financial statement schedules as listed in the index to consolidated financial statements and schedules (collectively, the consolidated financial statements), and our report dated February 13, 2020 expressed an unqualified opinion on those consolidated financial statements.
Basis for Opinion
The Company’s management is responsible for maintaining effective internal control over financial reporting and for its assessment of the effectiveness of internal control over financial reporting, included in the accompanying Management’s Report on Internal Control Over Financial Reporting. Our responsibility is to express an opinion on the Company’s internal control over financial reporting based on our audit. We are a public accounting firm registered with the PCAOB and are required to be independent with respect to the Company in accordance with the U.S. federal securities laws and the applicable rules and regulations of the Securities and Exchange Commission and the PCAOB.
We conducted our audit in accordance with the standards of the PCAOB. Those standards require that we plan and perform the audit to obtain reasonable assurance about whether effective internal control over financial reporting was maintained in all material respects. Our audit of internal control over financial reporting included obtaining an understanding of internal control over financial reporting, assessing the risk that a material weakness exists, and testing and evaluating the design and operating effectiveness of internal control based on the assessed risk. Our audit also included performing such other procedures as we considered necessary in the circumstances. We believe that our audit provides a reasonable basis for our opinion.
Definition and Limitations of Internal Control Over Financial Reporting
A company’s internal control over financial reporting is a process designed to provide reasonable assurance regarding the reliability of financial reporting and the preparation of financial statements for external purposes in accordance with generally accepted accounting principles. A company’s internal control over financial reporting includes those policies and procedures that (1) pertain to the maintenance of records that, in reasonable detail, accurately and fairly reflect the transactions and dispositions of the assets of the company; (2) provide reasonable assurance that transactions are recorded as necessary to permit preparation of financial statements in accordance with generally accepted accounting principles, and that receipts and expenditures of the company are being made only in accordance with authorizations of management and directors of the company; and (3) provide reasonable assurance regarding prevention or timely detection of unauthorized acquisition, use, or disposition of the company’s assets that could have a material effect on the financial statements.
Because of its inherent limitations, internal control over financial reporting may not prevent or detect misstatements. Also, projections of any evaluation of effectiveness to future periods are subject to the risk that controls may become inadequate because of changes in conditions, or that the degree of compliance with the policies or procedures may deteriorate.
| /s/ KPMG LLP |
| KPMG LLP |
New York, New York
February 13, 2020
Item 9B. OTHER INFORMATION
Executive Ownership and Sales. All of the Company’s executive officers are subject to the Company’s executive stock ownership policy. For a summary of this policy as currently in effect, see “Compensation Discussion and Analysis - Additional Compensation Information - Stock Ownership Guidelines, Anti-Hedging and Pledging Policies, and Other Trading Restrictions” in the Company’s proxy statement filed with the SEC on April 5, 2019 (Proxy Statement). From time to time, some of the Company’s executives may determine that it is advisable to diversify their investments for personal financial planning reasons, or may seek liquidity for other reasons, and may, in compliance with the stock ownership policy, sell shares of common stock of the Company on the open market, in private transactions or to the Company. To effect such sales, from time to time, some of the Company’s executives may enter into trading plans designed to comply with the Company’s Securities Trading Policy and the provisions of Rule 10b5-1 under the Securities Exchange Act of 1934. The trading plans will not reduce any of the executives’ ownership of the Company’s shares below the applicable executive stock ownership guidelines. The Company does not undertake any obligation to report Rule 10b5-1 plans that may be adopted by any employee or director of the Company in the future, or to report any modifications or termination of any publicly announced plan. As of the date of this report, none of the Company's named executive officers (i.e. an executive officer included in the compensation disclosures in the Proxy Statement) has entered into a Rule 105b-1 trading plan that remains in effect.
PART III
Item 10. DIRECTORS, EXECUTIVE OFFICERS AND CORPORATE GOVERNANCE
Executive Officers of the Company
Set forth below is information concerning the Company’s executive officers as of February 13, 2020.
| Name | Age | Office | |||
| Alan D. Schnitzer | 54 | Chairman of the Board of Directors and Chief Executive Officer | |||
| William H. Heyman | 71 | Vice Chairman | |||
| Avrohom J. Kess | 51 | Vice Chairman and Chief Legal Officer | |||
| Daniel S. Frey | 55 | Executive Vice President and Chief Financial Officer | |||
| Diane D. Bengston | 64 | Executive Vice President and Chief Human Resources Officer | |||
| Andy F. Bessette | 66 | Executive Vice President and Chief Administrative Officer | |||
| Michael F. Klein | 52 | Executive Vice President and President, Personal Insurance | |||
| Thomas M. Kunkel | 61 | Executive Vice President and President, Bond & Specialty Insurance | |||
| Mojgan M. Lefebvre | 54 | Executive Vice President and Chief Technology and Operations Officer | |||
| Maria Olivo | 55 | Executive Vice President, Strategic Development and President, International | |||
| Gregory C. Toczydlowski | 53 | Executive Vice President and President, Business Insurance |
Alan D. Schnitzer, 54, has been Chairman of the Board of Directors since August 2017 and Chief Executive Officer and Director since December 2015. He previously served as Vice Chairman and Chief Executive Officer, Business and International Insurance from July 2014. Mr. Schnitzer was Vice Chairman - Financial, Professional & International Insurance and Field Management; Chief Legal Officer from May 2012 until July 2014 and Vice Chairman and Chief Legal Officer and Executive Vice President - Financial, Professional and International Insurance from May 2008 until May 2012. He was Vice Chairman and Chief Legal Officer from April 2007 until May 2008. Prior to joining the Company, he was a partner at the law firm of Simpson Thacher & Bartlett LLP.
William H. Heyman, 71, has been Vice Chairman since August 2019. Prior to that, Mr. Heyman was Vice Chairman and Chief Investment Officer since May 2005. He previously served as Executive Vice President and Chief Investment Officer from May 2002. Mr. Heyman held various positions with Citigroup from 1995 until 2002, including the position of chairman of Citigroup Investments from 2000 until 2002. Prior to joining Citigroup in 1995, Mr. Heyman was, successively: a managing director of Salomon Brothers; Director of the Division of Market Regulation of the U.S. Securities and Exchange Commission; and a managing director of Smith Barney.
Avrohom J. Kess, 51, has been Vice Chairman and Chief Legal Officer since December 2016. Prior to that, Mr. Kess was a partner, member of the Corporate Department and Head of the Public Company Advisory Practice at the law firm of Simpson Thacher & Bartlett LLP, which he joined in 1995.
Daniel S. Frey, 55, has been Executive Vice President and Chief Financial Officer since September 2018. Mr. Frey has held various financial management roles since joining a predecessor to the Company in 2003, including Senior Vice President and Chief Financial Officer, Personal Insurance from September 2014, Senior Vice President Finance, Business Insurance from August 2010 and Senior Vice President and Chief Financial Officer, Claim Services from June 2006. Prior to that, Mr. Frey held the position of Chief Financial Officer at Spalding Sports Worldwide from 1999 to 2003 and held various financial management positions at Duracell International, Inc. from 1994 to 1999. Mr. Frey began his career at Deloitte in 1986.
Diane D. Bengston, 64, has been Executive Vice President and Chief Human Resources Officer since March 2018. Prior to that, she was Executive Vice President, Enterprise Human Resources from October 2016. Ms. Bengston previously held various management positions since 1979 with the Company and a predecessor, including leading Enterprise Diversity and Inclusion and Talent Management.
Andy F. Bessette, 66, has been Executive Vice President and Chief Administrative Officer since January 2002. Mr. Bessette previously held various management positions with predecessors of the Company since 1980, including Vice President, Corporate Real Estate and Services at Travelers Property Casualty Corp.
Michael F. Klein, 52, has been Executive Vice President and President, Personal Insurance since July 2015, and was also Head of Enterprise Business Intelligence & Analytics from May 2016 to May 2018. He previously served as Executive Vice President and Co-President, Business Insurance from July 2014, Executive Vice President, Middle Market from November 2012, President of Middle Market from March 2010, President of Commercial Accounts from September 2007, and Senior Vice President, Industry and Product Group from June 2006. Prior to that, Mr. Klein held various positions with the Company since 1990.
Thomas M. Kunkel, 61, has been Executive Vice President and President of Bond & Specialty Insurance since May 2015. He previously served as President of the Bond & Financial Products organization from 2005. Prior to that, Mr. Kunkel held various positions with the Company or its predecessors since 1984, including Regional Chief Underwriting Officer for Bond's Construction Surety business, head of Bond's field management organization, and head of Bond's Commercial Surety business.
Mojgan M. Lefebvre, 54, has been Executive Vice President and Chief Technology and Operations Officer since May 2019. Prior to that, Ms. Lefebvre was Executive Vice President and Chief Information Officer, Enterprise Operations and eBusiness since joining the Company in September 2018. Ms. Lefebvre previously held various information technology roles at Liberty Mutual, where she was most recently Senior Vice President and Chief Information Officer for the Global Risk Solutions business, from 2010 to 2018, at bioMerieux from 2007 to 2010 and at TeleTech Holdings from 2004 to 2007.
Maria Olivo, 55, has been Executive Vice President, Strategic Development and President, International since October 2018. Prior to that, she was Executive Vice President, Strategic Development and Corporate Treasurer since July 2010. She previously served as Executive Vice President and Treasurer from June 2009 and Executive Vice President, Market Development from October 2007. Prior to that Ms. Olivo held various positions with the Company or its predecessors since 2002, including leading Corporate Development, Investor Relations and Corporate Communications. Ms. Olivo was deputy head of Strategic Investments at Swiss Re Capital Partners from April 2000 until June 2002. Prior to joining Swiss Re Capital Partners, she was a director in Salomon Smith Barney’s Investment Bank.
Gregory C. Toczydlowski, 53, has been Executive Vice President and President of Business Insurance since June 2016. He previously served as Executive Vice President and President, Small Commercial and Business Insurance Technology and Operations from July 2015 and Executive Vice President and President of Personal Insurance from July 2009. Prior to that, Mr. Toczydlowski held various positions with the Company or its predecessors since 1990, including Chief Operating Officer of Personal Insurance and Chief Financial Officer for the independent agency distribution channel within Personal Insurance.
Code of Ethics
The Company has adopted a Code of Business Conduct and Ethics (Code of Ethics) that applies to all employees, including executive officers, and to directors. The Code of Ethics is available on the Corporate Governance page of the Company’s website at www.travelers.com. If the Company ever were to amend or waive any provision of its Code of Ethics that applies to the Company’s principal executive officer, principal financial officer, principal accounting officer or any person performing similar functions, the Company intends to satisfy its disclosure obligations, if any, with respect to any such waiver or amendment by posting such information on its website set forth above rather than by filing a Current Report on Form 8-K.
Other
The following sections of the Company’s definitive Proxy Statement relating to its 2020 Annual Meeting of Shareholders, which will be filed with the SEC no later than 120 days after the end of the Company’s fiscal year on December 31, 2019 (the Proxy Statement), are incorporated herein by reference: “Nominees for Election of Directors,” “Governance of Your Company - Specific Considerations Regarding the 2020 Nominees,” “Governance of Your Company - Committees of the Board and Meetings - Audit Committee” and, if included in the Proxy Statement, “Share Ownership Information - Delinquent Section 16(a) Reports.”
Item 11. EXECUTIVE COMPENSATION
The following sections of the Proxy Statement are incorporated herein by reference: “Compensation Discussion and Analysis,” “Compensation Committee Report,” “Summary Compensation Table,” “Grants of Plan-Based Awards in 2019,” “Narrative Supplement to Summary Compensation Table and Grants of Plan-Based Awards in 2019,” “Option Exercises and Stock Vested in 2019,” “Outstanding Equity Awards at December 31, 2019,” “Post-Employment Compensation,” “Potential Payments to Named Executive Officers Upon Termination of Employment or Change in Control,” “Non-Employee Director Compensation,” “Governance of Your Company - Risk Management and Compensation” and “CEO Pay Ratio.”
Item 12. SECURITY OWNERSHIP OF CERTAIN BENEFICIAL OWNERS AND MANAGEMENT AND RELATED SHAREHOLDER MATTERS
The “Share Ownership Information - 5% Owners” and “Share Ownership Information - Directors and Executive Officers” sections of the Proxy Statement are incorporated herein by reference.
EQUITY COMPENSATION PLAN INFORMATION
The following table sets forth information as of December 31, 2019 regarding the Company’s equity compensation plans. The only plan pursuant to which the Company may currently make additional equity grants is The Travelers Companies, Inc. Amended and Restated 2014 Stock Incentive Plan (the 2014 Incentive Plan).
| Plan Category | Number of securities to be issued upon exercise of outstanding options, warrants and rights (a) | Weighted average exercise price of outstanding options, warrants and rights (b) | Number of securities remaining available for future issuance under equity compensation plans (excluding securities reflected in column (a)) (c) | ||||||
| Equity compensation plans approved by security holders (1) | 12,007,879 | (2) | $113.80 per share | (3) | 8,273,774 | (4) |
| (1) | In addition to the 2014 Incentive Plan, also included are The Travelers Companies, Inc. Amended and Restated 2004 Stock Incentive Plan, as amended (the 2004 Incentive Plan), which was replaced by the 2014 Incentive Plan, and certain plans for employees in the United Kingdom and the Republic of Ireland and The Travelers Deferred Compensation Plan for Non-Employee Directors. Shares delivered under these plans are issued pursuant to the 2004 Incentive Plan and the 2014 Incentive Plan. |
| (2) | Total includes (i) 9,143,777 stock options, (ii) 1,034,334 performance shares and dividend equivalents accrued thereon (assuming issuance of 100% of performance shares granted), (iii) 1,572,135 restricted stock units, (iv) 235,477 director deferred stock awards and dividend equivalents accrued thereon and (v) 22,156 common stock units credited to the deferred compensation accounts of certain non-employee directors in lieu of cash compensation, at the election of such directors. |
| (3) | The weighted average exercise prices for both the 2004 Incentive Plan and the 2014 Incentive Plan relate only to stock options. The calculation of the weighted average exercise price does not include outstanding equity awards that are received or exercised for no consideration and also does not include common stock units credited to the deferred compensation accounts of certain non-employee directors at fair market value in lieu of cash compensation at the election of such directors. |
| (4) | These shares are available for grant as of December 31, 2019 under the 2014 Incentive Plan pursuant to which the Compensation Committee of the Board of Directors may make various stock-based awards including nonqualified stock options, incentive stock options, stock appreciation rights, restricted stock, restricted stock units, deferred stock, deferred stock units, performance awards and other stock-based or stock-denominated awards with respect to the Company’s common stock. This includes 10 million shares initially authorized for issuance under the 2014 Incentive Plan and an additional 3.1 million shares, 2.5 million shares and 4.4 million shares authorized by shareholders in May 2019, May 2017 and May 2016, respectively, and shares subject to awards under the 2004 Incentive |
Plan and the 2014 Incentive Plan that expired, were cancelled, forfeited, settled in cash or otherwise terminated without the issuance of shares.
Item 13. CERTAIN RELATIONSHIPS AND RELATED TRANSACTIONS, AND DIRECTOR INDEPENDENCE
The “Governance of Your Company—Transactions with Related Persons,” “Nominees for Election of Directors” and “Governance of Your Company—Directors Independence and Independence Determinations” sections of the Proxy Statement are incorporated herein by reference.
Item 14. PRINCIPAL ACCOUNTANT FEES AND SERVICES
The “Audit and Non-Audit Fees” section of the Proxy Statement is incorporated herein by reference.
PART IV
Item 15. EXHIBITS AND FINANCIAL STATEMENT SCHEDULES
Documents filed as a part of the report:
| (1) | Financial Statements and Schedules. See Index to Consolidated Financial Statements and Schedules on page 120 hereof. |
(2) Exhibits:
| † | Filed herewith. |
- Management contract or compensatory plan in which directors and/or executive officers are eligible to participate.
The total amount of securities authorized pursuant to any instrument defining rights of holders of long-term debt of the Company does not exceed 10% of the total assets of the Company and its consolidated subsidiaries. Therefore, the Company is not filing any instruments evidencing long-term debt. However, the Company will furnish copies of any such instrument to the Securities and Exchange Commission upon request.
Copies of any of the exhibits referred to above will be furnished to security holders who make written request therefor to The Travelers Companies, Inc., 385 Washington Street, Saint Paul, MN, 55102, Attention: Corporate Secretary.
The agreements and other documents filed as exhibits to this report are not intended to provide factual information or other disclosure other than the terms of the agreements or other documents themselves, and you should not rely on them for that purpose. In particular, any representations and warranties made by the Company in these agreements or other documents were made solely within the specific context of the relevant agreement or document and may not describe the actual state of affairs at the date they were made or at any other time.
Item 16. FORM 10-K SUMMARY
None.
SIGNATURES
Pursuant to the requirements of Section 13 or 15(d) of the Securities Exchange Act of 1934, The Travelers Companies, Inc. has duly caused this report to be signed on its behalf by the undersigned, thereunto duly authorized.
| THE TRAVELERS COMPANIES, INC. (Registrant) | |||
| Date: | February 13, 2020 | By | /s/ CHRISTINE K. KALLA |
| Christine K. Kalla Executive Vice President and General Counsel (Authorized Signatory) |
Pursuant to the requirements of the Securities Exchange Act of 1934, this report has been signed below by the following persons on behalf of The Travelers Companies, Inc. and in the capacities and on the dates indicated.
| Date | |||
| By | /s/ ALAN D. SCHNITZER | Director, Chairman and Chief Executive Officer (Principal Executive Officer) | February 13, 2020 |
| Alan D. Schnitzer | |||
| By | /s/ DANIEL S. FREY | Executive Vice President and Chief Financial Officer (Principal Financial Officer) | February 13, 2020 |
| Daniel S. Frey | |||
| By | /s/ DOUGLAS K. RUSSELL | Senior Vice President and Corporate Controller (Principal Accounting Officer) | February 13, 2020 |
| Douglas K. Russell | |||
| By | * | Director | February 13, 2020 |
| Alan L. Beller | |||
| By | * | Director | February 13, 2020 |
| Janet M. Dolan | |||
| By | * | Director | February 13, 2020 |
| Patricia L. Higgins | |||
| By | * | Director | February 13, 2020 |
| William J. Kane | |||
| By | * | Director | February 13, 2020 |
| Clarence Otis Jr. | |||
| By | * | Director | February 13, 2020 |
| Philip T. Ruegger III | |||
| By | * | Director | February 13, 2020 |
| Todd C. Schermerhorn | |||
| By | * | Director | February 13, 2020 |
| Donald J. Shepard | |||
| By | * | Director | February 13, 2020 |
| Laurie J. Thomsen | |||
| *By | /s/ CHRISTINE K. KALLA | February 13, 2020 | |
| Christine K. Kalla, Attorney-in-fact |
FINANCIAL STATEMENT SCHEDULES
SCHEDULE II
THE TRAVELERS COMPANIES, INC.
(Parent Company Only)
CONDENSED FINANCIAL INFORMATION OF REGISTRANT
(in millions)
CONDENSED STATEMENT OF INCOME
| For the year ended December 31, | 2019 | 2018 | 2017 | |||||||||
| Revenues | ||||||||||||
| Net investment income | $ | 41 | $ | 32 | $ | 24 | ||||||
| Net realized investment gains (losses) (1) | 33 | (13 | ) | 66 | ||||||||
| Total revenues | 74 | 19 | 90 | |||||||||
| Expenses | ||||||||||||
| Interest | 297 | 304 | 321 | |||||||||
| Other | 21 | 20 | 25 | |||||||||
| Total expenses | 318 | 324 | 346 | |||||||||
| Loss before income taxes and net income of subsidiaries | (244 | ) | (305 | ) | (256 | ) | ||||||
| Income tax benefit | (77 | ) | (114 | ) | (130 | ) | ||||||
| Loss before net income of subsidiaries | (167 | ) | (191 | ) | (126 | ) | ||||||
| Net income of subsidiaries | 2,789 | 2,714 | 2,190 | |||||||||
| Net income | $ | 2,622 | $ | 2,523 | $ | 2,064 |
(1) The parent company had no other-than-temporary impairment gains or losses recognized in net realized investment gains (losses) or in other comprehensive income during the years ended December 31, 2019, 2018 and 2017.
The condensed financial statements should be read in conjunction with the notes to the condensed financial information of the registrant, as well as the consolidated financial statements and notes thereto.
See the Report of Independent Registered Public Accounting Firm.
SCHEDULE II
THE TRAVELERS COMPANIES, INC.
(Parent Company Only)
CONDENSED FINANCIAL INFORMATION OF REGISTRANT
(in millions)
CONDENSED STATEMENT OF COMPREHENSIVE INCOME
| For the year ended December 31, | 2019 | 2018 | 2017 | |||||||||
| Net income | $ | 2,622 | $ | 2,523 | $ | 2,064 | ||||||
| Other comprehensive income (loss)—parent company: | ||||||||||||
| Changes in net unrealized gains on investment securities having no credit losses recognized in the consolidated statement of income | 4 | — | (44 | ) | ||||||||
| Net changes in benefit plan assets and obligations | 35 | (53 | ) | 22 | ||||||||
| Other comprehensive income (loss) before income taxes and other comprehensive income (loss) of subsidiaries | 39 | (53 | ) | (22 | ) | |||||||
| Income tax expense (benefit) | 12 | (17 | ) | 2 | ||||||||
| Other comprehensive income (loss), net of taxes, before other comprehensive income (loss) of subsidiaries | 27 | (36 | ) | (24 | ) | |||||||
| Other comprehensive income (loss) of subsidiaries | 2,472 | (1,434 | ) | 436 | ||||||||
| Other comprehensive income (loss) | 2,499 | (1,470 | ) | 412 | ||||||||
| Comprehensive income | $ | 5,121 | $ | 1,053 | $ | 2,476 |
The condensed financial statements should be read in conjunction with the notes to the condensed financial information of the registrant, as well as the consolidated financial statements and notes thereto.
See the Report of Independent Registered Public Accounting Firm.
SCHEDULE II
THE TRAVELERS COMPANIES, INC.
(Parent Company Only)
CONDENSED FINANCIAL INFORMATION OF REGISTRANT
(in millions)
CONDENSED BALANCE SHEET
| At December 31, | 2019 | 2018 | ||||||
| Assets | ||||||||
| Fixed maturities | $ | 91 | $ | 84 | ||||
| Equity securities | 209 | 171 | ||||||
| Short-term securities | 1,390 | 1,371 | ||||||
| Investment in subsidiaries | 30,028 | 26,993 | ||||||
| Other assets | 336 | 649 | ||||||
| Total assets | $ | 32,054 | $ | 29,268 | ||||
| Liabilities | ||||||||
| Debt | $ | 5,865 | $ | 5,871 | ||||
| Other liabilities | 239 | 496 | ||||||
| Total liabilities | 6,104 | 6,367 | ||||||
| Shareholders’ equity | ||||||||
| Common stock (1,750.0 shares authorized; 255.5 and 263.7 shares issued, 255.5 and 263.6 shares outstanding) | 23,469 | 23,144 | ||||||
| Retained earnings | 36,984 | 35,211 | ||||||
| Accumulated other comprehensive income (loss) | 640 | (1,859 | ) | |||||
| Treasury stock, at cost (522.1 and 510.9 shares) | (35,143 | ) | (33,595 | ) | ||||
| Total shareholders’ equity | 25,950 | 22,901 | ||||||
| Total liabilities and shareholders’ equity | $ | 32,054 | $ | 29,268 |
The condensed financial statements should be read in conjunction with the notes to the condensed financial information of the registrant, as well as the consolidated financial statements and notes thereto.
See the Report of Independent Registered Public Accounting Firm.
SCHEDULE II
THE TRAVELERS COMPANIES, INC.
(Parent Company Only)
CONDENSED FINANCIAL INFORMATION OF REGISTRANT
(in millions)
CONDENSED STATEMENT OF CASH FLOWS
| For the year ended December 31, | 2019 | 2018 | 2017 | |||||||||
| Cash flows from operating activities | ||||||||||||
| Net income | $ | 2,622 | $ | 2,523 | $ | 2,064 | ||||||
| Adjustments to reconcile net income to net cash provided by operating activities: | ||||||||||||
| Equity in net income of subsidiaries | (2,789 | ) | (2,714 | ) | (2,190 | ) | ||||||
| Dividends received from consolidated subsidiaries | 2,459 | 2,258 | 2,289 | |||||||||
| Deferred federal income tax expense (benefit) | (2 | ) | 28 | 40 | ||||||||
| Change in income taxes payable | 3 | 100 | 3 | |||||||||
| Other | (79 | ) | (35 | ) | (174 | ) | ||||||
| Net cash provided by operating activities | 2,214 | 2,160 | 2,032 | |||||||||
| Cash flows from investing activities | ||||||||||||
| Net sales (purchases) of short-term securities | (19 | ) | (141 | ) | 397 | |||||||
| Other investments, net | (8 | ) | (7 | ) | (34 | ) | ||||||
| Acquisition, net of cash acquired | — | — | (477 | ) | ||||||||
| Net cash used in investing activities | (27 | ) | (148 | ) | (114 | ) | ||||||
| Cash flows from financing activities | ||||||||||||
| Treasury stock acquired—share repurchase authorization | (1,500 | ) | (1,270 | ) | (1,378 | ) | ||||||
| Treasury stock acquired—net employee share-based compensation | (48 | ) | (51 | ) | (62 | ) | ||||||
| Dividends paid to shareholders | (844 | ) | (814 | ) | (785 | ) | ||||||
| Payment of debt | (500 | ) | (600 | ) | (657 | ) | ||||||
| Issuance of debt | 492 | 591 | 789 | |||||||||
| Issuance of common stock—employee share options | 213 | 132 | 173 | |||||||||
| Net cash used in financing activities | (2,187 | ) | (2,012 | ) | (1,920 | ) | ||||||
| Net decrease in cash | — | — | (2 | ) | ||||||||
| Cash at beginning of year | — | — | 2 | |||||||||
| Cash at end of year | $ | — | $ | — | $ | — | ||||||
| Supplemental disclosure of cash flow information | ||||||||||||
| Cash received during the year for taxes | $ | 78 | $ | 283 | $ | 173 | ||||||
| Cash paid during the year for interest | $ | 291 | $ | 300 | $ | 320 |
The condensed financial statements should be read in conjunction with the notes to the condensed financial information of the registrant, as well as the consolidated financial statements and notes thereto.
See the Report of Independent Registered Public Accounting Firm.
SCHEDULE II
THE TRAVELERS COMPANIES, INC.
(Parent Company Only)
NOTES TO THE CONDENSED FINANCIAL INFORMATION OF REGISTRANT
| 1. | GUARANTEES |
The Travelers Companies, Inc. (TRV) fully and unconditionally guarantees the payment of all principal, premiums, if any, and interest on certain debt obligations of its subsidiaries TPC and TIGHI. The guarantees pertain to the $200 million 7.75% notes due 2026 and the $500 million 6.375% notes due 2033.
TRV also has contingent obligations for guarantees in connection with the selling of businesses to third parties, certain insurance obligations of a subsidiary and various indemnifications including indemnifications to service providers in the normal course of business. The guarantees and indemnification clauses are often standard contractual terms and include indemnifications for breaches of representations and warranties and in some cases obligations arising from certain liabilities. The terms of these provisions vary in duration and nature.
Certain of the guarantees and indemnifications described above have no stated or notional amounts or limitation to the maximum potential future payments. Accordingly, TRV is unable to provide an estimate of the maximum potential payments for such arrangements, and the likelihood for any payment under these guarantees is remote.
SCHEDULE III
THE TRAVELERS COMPANIES, INC. AND SUBSIDIARIES
Supplementary Insurance Information
2017-2019
(in millions)
| Segment | Deferred Acquisition Costs | Claims and Claim Adjustment Expense Reserves | Unearned Premiums | Earned Premiums | Net Investment Income (1) | Claims and Claim Adjustment Expenses | Amortization of Deferred Acquisition Costs | Other Operating Expenses (2) | Net Written Premiums | |||||||||||||||||||||||||||
| 2019 | ||||||||||||||||||||||||||||||||||||
| Business Insurance | $ | 1,161 | $ | 42,252 | $ | 7,540 | $ | 15,300 | $ | 1,816 | $ | 10,963 | $ | 2,503 | $ | 2,627 | $ | 15,629 | ||||||||||||||||||
| Bond & Specialty Insurance | 309 | 3,316 | 1,845 | 2,565 | 233 | 1,094 | 478 | 483 | 2,739 | |||||||||||||||||||||||||||
| Personal Insurance | 803 | 6,268 | 5,219 | 10,407 | 419 | 7,076 | 1,620 | 1,220 | 10,783 | |||||||||||||||||||||||||||
| Total—Reportable Segments | 2,273 | 51,836 | 14,604 | 28,272 | 2,468 | 19,133 | 4,601 | 4,330 | 29,151 | |||||||||||||||||||||||||||
| Other | — | 13 | — | — | — | — | — | 379 | — | |||||||||||||||||||||||||||
| Consolidated | $ | 2,273 | $ | 51,849 | $ | 14,604 | $ | 28,272 | $ | 2,468 | $ | 19,133 | $ | 4,601 | $ | 4,709 | $ | 29,151 | ||||||||||||||||||
| 2018 | ||||||||||||||||||||||||||||||||||||
| Business Insurance | $ | 1,102 | $ | 41,132 | $ | 7,112 | $ | 14,722 | $ | 1,833 | $ | 10,171 | $ | 2,388 | $ | 2,623 | $ | 14,956 | ||||||||||||||||||
| Bond & Specialty Insurance | 277 | 3,255 | 1,619 | 2,420 | 233 | 772 | 454 | 459 | 2,528 | |||||||||||||||||||||||||||
| Personal Insurance | 741 | 6,266 | 4,824 | 9,917 | 408 | 7,348 | 1,539 | 1,185 | 10,224 | |||||||||||||||||||||||||||
| Total—Reportable Segments | 2,120 | 50,653 | 13,555 | 27,059 | 2,474 | 18,291 | 4,381 | 4,267 | 27,708 | |||||||||||||||||||||||||||
| Other | — | 15 | — | — | — | — | — | 382 | — | |||||||||||||||||||||||||||
| Consolidated | $ | 2,120 | $ | 50,668 | $ | 13,555 | $ | 27,059 | $ | 2,474 | $ | 18,291 | $ | 4,381 | $ | 4,649 | $ | 27,708 | ||||||||||||||||||
| 2017 | ||||||||||||||||||||||||||||||||||||
| Business Insurance | $ | 1,060 | $ | 40,352 | $ | 6,857 | $ | 14,146 | $ | 1,786 | $ | 9,521 | $ | 2,286 | $ | 2,563 | $ | 14,270 | ||||||||||||||||||
| Bond & Specialty Insurance | 258 | 3,421 | 1,515 | 2,307 | 228 | 899 | 432 | 464 | 2,359 | |||||||||||||||||||||||||||
| Personal Insurance | 707 | 5,860 | 4,543 | 9,230 | 383 | 7,047 | 1,448 | 1,111 | 9,590 | |||||||||||||||||||||||||||
| Total—Reportable Segments | 2,025 | 49,633 | 12,915 | 25,683 | 2,397 | 17,467 | 4,166 | 4,138 | 26,219 | |||||||||||||||||||||||||||
| Other | — | 17 | — | — | — | — | — | 401 | — | |||||||||||||||||||||||||||
| Consolidated | $ | 2,025 | $ | 49,650 | $ | 12,915 | $ | 25,683 | $ | 2,397 | $ | 17,467 | $ | 4,166 | $ | 4,539 | $ | 26,219 |
| (1) | See note 2 of notes to the consolidated financial statements for discussion of the method used to allocate net investment income and invested assets to the identified segments. |
| (2) | Expense allocations are determined in accordance with prescribed statutory accounting practices. These practices make a reasonable allocation of all expenses to those product lines with which they are associated. |
See the Report of Independent Registered Public Accounting Firm.
SCHEDULE V
THE TRAVELERS COMPANIES, INC. AND SUBSIDIARIES
Valuation and Qualifying Accounts
(in millions)
| Balance at beginning of period | Charged to costs and expenses | Charged to other accounts | Deductions (1) | Balance at end of period | ||||||||||||||||
| 2019 | ||||||||||||||||||||
| Reinsurance recoverables | $ | 110 | $ | — | $ | — | $ | 18 | $ | 92 | ||||||||||
| Allowance for uncollectible: | ||||||||||||||||||||
| Premiums receivable from underwriting activities | $ | 54 | $ | 59 | $ | — | $ | 58 | $ | 55 | ||||||||||
| Deductibles | $ | 24 | $ | (2 | ) | $ | — | $ | — | $ | 22 | |||||||||
| 2018 | ||||||||||||||||||||
| Reinsurance recoverables | $ | 111 | $ | — | $ | — | $ | 1 | $ | 110 | ||||||||||
| Allowance for uncollectible: | ||||||||||||||||||||
| Premiums receivable from underwriting activities | $ | 58 | $ | 50 | $ | — | $ | 54 | $ | 54 | ||||||||||
| Deductibles | $ | 26 | $ | (1 | ) | $ | — | $ | 1 | $ | 24 | |||||||||
| 2017 | ||||||||||||||||||||
| Reinsurance recoverables | $ | 116 | $ | — | $ | — | $ | 5 | $ | 111 | ||||||||||
| Allowance for uncollectible: | ||||||||||||||||||||
| Premiums receivable from underwriting activities | $ | 61 | $ | 38 | $ | — | $ | 41 | $ | 58 | ||||||||||
| Deductibles | $ | 34 | $ | (2 | ) | $ | — | $ | 6 | $ | 26 |
| (1) | Credited to the related asset account. |
See the Report of Independent Registered Public Accounting Firm.
SCHEDULE VI
THE TRAVELERS COMPANIES, INC. AND SUBSIDIARIES
Supplementary Information Concerning Property-Casualty Insurance Operations (1)
2017-2019
(in millions)
| Claims and Claim Adjustment Expenses Incurred Related to: | Amortization of Deferred Acquisition Costs | Paid Claims and Claim Adjustment Expenses | ||||||||||||||||||||||||||||||||||||||||||
| Affiliation with Registrant(2) | Deferred Acquisition Costs | Claims and Claim Adjustment Expense Reserves | Discount From Reserves for Unpaid Claims(3) | Unearned Premiums | Earned Premiums | Net Investment Income | Current Year | Prior Year | Net Written Premiums | |||||||||||||||||||||||||||||||||||
| 2019 | $ | 2,273 | $ | 51,836 | $ | 1,155 | $ | 14,604 | $ | 28,272 | $ | 2,468 | $ | 18,854 | $ | 164 | $ | 4,601 | $ | 17,794 | $ | 29,151 | ||||||||||||||||||||||
| 2018 | $ | 2,120 | $ | 50,653 | $ | 1,158 | $ | 13,555 | $ | 27,059 | $ | 2,474 | $ | 18,614 | $ | (406 | ) | $ | 4,381 | $ | 17,060 | $ | 27,708 | |||||||||||||||||||||
| 2017 | $ | 2,025 | $ | 49,633 | $ | 1,102 | $ | 12,915 | $ | 25,683 | $ | 2,397 | $ | 17,846 | $ | (458 | ) | $ | 4,166 | $ | 16,043 | $ | 26,219 |
| (1) | Excludes accident and health insurance business. |
| (2) | Consolidated property-casualty insurance operations. |
| (3) | For a discussion of types of reserves discounted and discount rates used, see note 7 of notes to the consolidated financial statements. |
See the Report of Independent Registered Public Accounting Firm.