 filings.tools
Item 3. LEGAL PROCEEDINGS
99K characters. Original on sec.gov · Markdown
Item 3. LEGAL PROCEEDINGS
| --- | --- |
For a description of our material pending legal proceedings, please see Note 16, Commitments and Contingencies, to the consolidated financial statements included elsewhere in this Annual Report on Form 10-K.
In addition, the following matters are being disclosed pursuant to Item 103 of Regulation S-K because they relate to environmental regulations and aggregate civil penalties could potentially exceed $100,000.
The Bay Area Air Quality Management District (the “BAAQMD”) has issued notices of violation to us relating to air permitting for the Fremont Factory, but has not initiated formal proceedings. We dispute certain of these allegations and are working to resolve them with the BAAQMD. Further, we assert that there has been no related adverse community or environmental impact. While we cannot predict the outcome of this matter, including the final amount of any penalties, it is not expected to have a material adverse impact on our business.
We have also received an information request from the U.S. Environmental Protection Agency (the “EPA”) under Section 114(a) of the Clean Air Act of 1963, as amended (the “Clean Air Act”). The EPA is reviewing the compliance of our Fremont Factory operations with applicable requirements under the Clean Air Act, and we are working with the EPA in responding to this request. While the outcome of this matter cannot be determined at this time, it is not currently expected to have a material adverse impact on our business.
| I****TEM 4. | MINE SAFETY DISCLOSURES |
|---|
Not applicable.
PART II
| I****TEM 5. | MARKET FOR REGISTRANT’S COMMON EQUITY, RELATED STOCKHOLDER MATTERS AND ISSUER PURCHASES OF EQUITY SECURITIES |
|---|
Market Information
Our common stock has traded on The NASDAQ Global Select Market under the symbol “TSLA” since it began trading on June 29, 2010. Our initial public offering was priced at $17.00 per share on June 28, 2010.
Holders
As of February 7, 2020, there were 1,685 holders of record of our common stock. A substantially greater number of holders of our common stock are “street name” or beneficial holders, whose shares are held by banks, brokers and other financial institutions.
Dividend Policy
We have never declared or paid cash dividends on our common stock. We currently do not anticipate paying any cash dividends in the foreseeable future. Any future determination to declare cash dividends will be made at the discretion of our board of directors, subject to applicable laws, and will depend on our financial condition, results of operations, capital requirements, general business conditions and other factors that our board of directors may deem relevant.
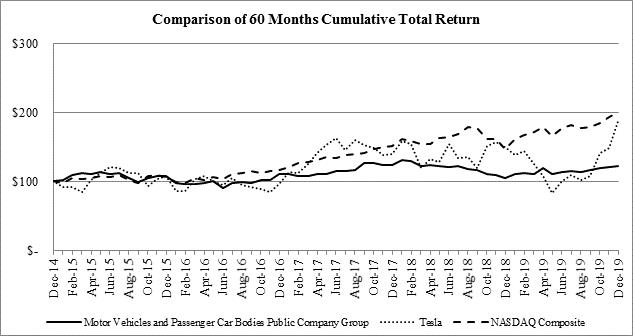
Stock Performance Graph
This performance graph shall not be deemed “filed” for purposes of Section 18 of the Securities Exchange Act of 1934, as amended (the “Exchange Act”), or incorporated by reference into any filing of Tesla, Inc. under the Securities Act of 1933, as amended (the “Securities Act”), or the Exchange Act, except as shall be expressly set forth by specific reference in such filing.
The following graph shows a comparison, from January 1, 2015 through December 31, 2019, of the cumulative total return on our common stock, The NASDAQ Composite Index and a group of all public companies sharing the same SIC code as us, which is SIC code 3711, “Motor Vehicles and Passenger Car Bodies” (Motor Vehicles and Passenger Car Bodies Public Company Group). Such returns are based on historical results and are not intended to suggest future performance. Data for The NASDAQ Composite Index and the Motor Vehicles and Passenger Car Bodies Public Company Group assumes an investment of $100 on January 1, 2015 and reinvestment of dividends. We have never declared or paid cash dividends on our common stock nor do we anticipate paying any such cash dividends in the foreseeable future.
Unregistered Sales of Equity Securities
None.
Purchases of Equity Securities by the Issuer and Affiliated Purchasers
None.
| I****TEM 6. | SELECTED CONSOLIDATED FINANCIAL DATA |
|---|
The following selected consolidated financial data should be read in conjunction with “Management’s Discussion and Analysis of Financial Condition and Results of Operations” and the consolidated financial statements and the related notes included elsewhere in this Annual Report on Form 10-K and from the historical consolidated financial statements not included herein to fully understand factors that may affect the comparability of the information presented below (in millions, except per share data).
| Year Ended December 31, | ||||||||||||||||||||
|---|---|---|---|---|---|---|---|---|---|---|---|---|---|---|---|---|---|---|---|---|
| 2019 (3) | 2018 (2) | 2017 | 2016 (1) | 2015 | ||||||||||||||||
| Consolidated Statements of Operations Data: | ||||||||||||||||||||
| Total revenues | $ | 24,578 | $ | 21,461 | $ | 11,759 | $ | 7,000 | $ | 4,046 | ||||||||||
| Gross profit | $ | 4,069 | $ | 4,042 | $ | 2,223 | $ | 1,599 | $ | 924 | ||||||||||
| Loss from operations | $ | (69 | ) | $ | (388 | ) | $ | (1,632 | ) | $ | (667 | ) | $ | (717 | ) | |||||
| Net loss attributable to common stockholders | $ | (862 | ) | $ | (976 | ) | $ | (1,962 | ) | $ | (675 | ) | $ | (889 | ) | |||||
| Net loss per share of common stock attributable to common stockholders, basic and diluted | $ | (4.92 | ) | $ | (5.72 | ) | $ | (11.83 | ) | $ | (4.68 | ) | $ | (6.93 | ) | |||||
| Weighted average shares used in computing net loss per share of common stock, basic and diluted | 177 | 171 | 166 | 144 | 128 |
| As of December 31, | ||||||||||||||||||||
|---|---|---|---|---|---|---|---|---|---|---|---|---|---|---|---|---|---|---|---|---|
| 2019 (3) | 2018 (2) | 2017 | 2016 (1) | 2015 | ||||||||||||||||
| Consolidated Balance Sheet Data: | ||||||||||||||||||||
| Working (deficit) capital | $ | 1,436 | $ | (1,686 | ) | $ | (1,104 | ) | $ | 433 | $ | (29 | ) | |||||||
| Total assets | 34,309 | 29,740 | 28,655 | 22,664 | 8,068 | |||||||||||||||
| Total long-term obligations | 15,532 | 13,434 | 15,348 | 10,923 | 4,126 |
| (1) | We acquired SolarCity Corporation (“SolarCity”) on November 21, 2016. SolarCity’s financial results have been included in our financial results from the acquisition date as previously reported in our Annual Report on Form 10-K for the year ended December 31, 2016. |
|---|
| (2) | We adopted ASC 606 in 2018. Prior periods have not been revised. See Note 2, Summary of Significant Accounting Policies, of the notes to the consolidated financial statements included elsewhere in this Annual Report on Form 10-K for further details. |
|---|
| (3) | Includes the impact of the adoption of the new lease accounting standard in 2019. Prior periods have not been revised. See Note 2, Summary of Significant Accounting Policies, of the notes to the consolidated financial statements included elsewhere in this Annual Report on Form 10-K for further details. |
|---|
| I****TEM 7. | MANAGEMENT’S DISCUSSION AND ANALYSIS OF FINANCIAL CONDITION AND RESULTS OF OPERATIONS |
|---|
The following discussion and analysis should be read in conjunction with the consolidated financial statements and the related notes included elsewhere in this Annual Report on Form 10-K. For discussion related to changes in financial condition and the results of operations for fiscal year 2017-related items, refer to Part II, Item 7. Management's Discussion and Analysis of Financial Condition and Results of Operations in our Annual Report on Form 10-K for fiscal year 2018, which was filed with the Securities and Exchange Commission on February 19, 2019.
Overview and 2019 Highlights
Our mission is to accelerate the world’s transition to sustainable energy. We design, develop, manufacture, lease and sell high-performance fully electric vehicles, solar energy generation systems and energy storage products. We also offer maintenance, installation, operation and other services related to our products.
Automotive
During 2019, we achieved annual vehicle delivery and production records of 367,656 and 365,232 total vehicles, respectively. We also laid the groundwork for our next phase of growth with the commencement of Model 3 production at Gigafactory Shanghai; preparations at the Fremont Factory for Model Y production, which commenced in the first quarter of 2020; the selection of Berlin, Germany as the site for our next factory for the European market; and the unveiling of Cybertruck. We also continued to enhance our user experience through improved Autopilot and FSD features, including the introduction of a new powerful on-board FSD computer and a new Smart Summon feature, and the expansion of a unique set of in-car entertainment options.
Energy Generation and Storage
We revamped key aspects of our solar operations in 2019 by streamlining traditionally complex ordering, permitting, installation and back-end service processes to enhance the customer experience, especially for retrofit solar installations. Our solar deployments grew approximately 48% and 26%, quarter-over-quarter, in the second half of the year. We also deployed 1.65 GWh of energy storage in 2019, more than the aggregate of all prior years. Finally, we further evolved our product offerings by launching the third generation of the Solar Roof, for which we are expanding both our manufacturing and installation capabilities, and Megapack, our largest utility-scale energy storage product to date.
Management Opportunities, Challenges and Risks and 2020 Outlook
Automotive—Production
A key focus in 2020 will be our efforts towards establishing and expanding capacity for vehicle production at volume across three continents. At the Fremont Factory, we commenced Model Y production earlier than anticipated, and combined with Model 3, we have installed annual production capacity for 400,000 vehicles. We expect to further increase this capacity to 500,000 vehicles through the installation of additional equipment.
At Gigafactory Shanghai, we have installed annual production capacity for 150,000 Model 3 vehicles that we believe we will eventually be able to push to actual rates of production in excess of such number, subject to local production of battery packs, which we began ramping there later than other processes. We have commenced construction of the next phase of Gigafactory Shanghai to add Model Y manufacturing capacity at least equivalent to that for Model 3. To finance our construction and expansion, in December 2019 our local subsidiary entered into a RMB 9.0 billion (or the equivalent amount in U.S. dollars) fixed asset term facility and a RMB 2.25 billion (or the equivalent amount in U.S. dollars) working capital revolving facility, part of which was used to repay a RMB 3.5 billion bridge loan entered into in March 2019. We are supplementing such financing with limited direct capital expenditures.
Finally, we have selected Germany as the site of our next factory for manufacturing vehicles for the European market, due to its strong manufacturing and engineering presence. However, the construction of and ramp at Gigafactory Berlin, as well as at Gigafactory Shanghai, are subject to a number of uncertainties inherent in all new manufacturing operations, including ongoing compliance with regulatory requirements, maintenance of operational licenses and approvals for additional expansion, potential supply chain constraints, hiring, training and retention of qualified employees, and the pace of bringing production equipment and processes online with the capability to manufacture high-quality units at scale. Ultimately, achieving increased total vehicle production cost-effectively across all of our manufacturing operations will require that we timely address any bottlenecks that may arise as we ramp, establish and maintain sustained supplier capacity, and successfully utilize manufacturing processes at the maximum output rates that we have planned for them.
Automotive—Demand and Sales
As the automotive industry continues to validate and grow the market for electric vehicles, we are generating demand and new customers even without traditional marketing and with relatively low marketing costs, and in 2019 our orders shifted to originating mostly from new customers without prior reservations. Production at Gigafactory Shanghai allows us to offer Model 3 in China at competitive local pricing and more quickly, which should drive further demand and opportunity in the world’s largest market for mid-sized premium sedans, and we expect a similar impact in China for Model Y when we commence production there of this offering in the popular compact SUV segment.
Moreover, the significant interest generated by our unveiling of Cybertruck demonstrated our brand visibility, innovation and viability across an increasing range of vehicle segments. Meanwhile, we are making our existing vehicles incrementally more compelling, including through a planned software update for FSD-enabled vehicles to react to traffic lights and stop signs and navigate city intersections, and additional functionality of both in-vehicle software and the Tesla mobile app.
On the other hand, we may be impacted by trade and environmental policies, political uncertainty and economic cycles involving geographic regions where we have significant operations, which are inherently unpredictable. Sales of vehicles in the automotive industry also tend to be cyclical in many markets, which may expose us to increased volatility. Specifically, it is uncertain as to how such macroeconomic factors will impact us as a company that has been experiencing growth and increasing market share in an industry that has globally been experiencing a recent decline in sales. Finally, we make certain adjustments to our prices from time to time in the ordinary course of business, including as we introduce new vehicles and variants and optimize the pricing among them. Such pricing changes may impact our vehicles’ resale values, and in turn our operating results. For example, if price reductions result in an increase to our estimates of the volume of vehicles that may potentially be returned to us under pre-existing resale value guarantees provided to customers and partners for certain financing programs, our gross profits may be reduced.
Automotive—Deliveries and Customer Infrastructure
We continue to optimize our manufacturing and global delivery patterns to address higher volumes of our predominantly single-factory production at the Fremont Factory. We expect to alleviate any related issues through local production at Gigafactory Shanghai and eventually at Gigafactory Berlin.
We also continue to expand and invest in our servicing and charging locations and capabilities to keep pace with our customer vehicle fleet and ensure a convenient and efficient customer experience. However, if our customer vehicles, particularly in the rapidly growing Model 3 fleet, experience unexpected reliability issues, it could outpace and overburden our servicing capabilities and parts inventory.
Energy Generation and Storage Demand, Production and Deployment
We expect to continue to grow our retrofit solar system deployments as we execute our new strategy, including through compelling financing options such as a subscription-based offering, which is currently available in California.
We are focused on training our personnel and third party partners to ramp installations of our Solar Roof, and are also hiring rapidly for its ongoing manufacturing ramp at Gigafactory New York. We expect such ramp will support our significant operations and our compliance with minimum hiring and cumulative investment targets under our agreement with the SUNY Foundation related to the construction and use of Gigafactory New York. However, if our expectations as to the costs and timelines of our investment and operations at Buffalo or our production ramp of the Solar Roof prove incorrect, we may incur additional expenses or substantial payments to the SUNY Foundation.
Finally, with the introduction of our 3 MWh Megapack, we now offer an even greater variety of scalable energy storage products with a wide range of markets and applications, and expect this product to drive additional interest from global project developers and utilities.
Trends in Cash Flow, Capital Expenditures and Operating Expenses
Our capital expenditures are difficult to project beyond the short term, given the number and breadth of our core projects at any given time. For example, the curve of any new product ramp, such as for Model Y and the Solar Roof, is inherently subject to uncertainty of timing, and if we are able to meet various milestones along such ramp more quickly than expected, our capital expenditures may be accelerated. We also continuously evaluate, and as appropriate adjust, our capital expenditures based on, among other things: our manufacturing plans for our various products, which we may rebalance from time to time based on the mix of demand among them and other contingent factors; the pace and prioritization of current projects under development; and the addition of any new projects. Moreover, we are generally increasing the capital efficiency of our projects with experience, and we may find that our actual capital expenditures on new projects are different than previously expected.
Subject to the above, considering the expected pace of the manufacturing ramps for our products, construction and expansion of our factories, and pipeline of announced projects under development, and consistent with our current strategy of using partners to manufacture battery cells, as well as considering all other infrastructure growth, we currently expect our average annual capital expenditures in 2020 and the two succeeding fiscal years to be $2.5 billion to $3.5 billion.
We expect operating expenses as a percentage of revenue to continue to decrease in the future as we focus on increasing operational efficiency and process automation, as well as from increases in expected overall revenues from our expanding sales. In particular, our efforts to scale down and optimize our cost structure relative to the size of our business have already manifested in total operating expenses decreasing from $4.4 billion to $4.1 billion from fiscal year 2018 to fiscal year 2019, including restructuring and other charges. Meanwhile, our total revenues increased from $21.5 billion to $24.6 billion in the same period.
In March 2018, our stockholders approved the 2018 CEO Performance Award, with vesting contingent on achieving market capitalization and operational milestones. We will incur significant non-cash stock-based compensation expense for each tranche under this award after the related operational milestone initially becomes probable of being met, and if later than the grant date, we will also have to record a cumulative catch-up expense at such time. Such catch-up expense may be material depending on the length of time elapsed from the grant date. For example, in the fourth quarter of 2019, as the result of an additional operational milestone becoming probable of achievement, we recorded a cumulative catch-up expense of $72 million for service provided from the grant date. Moreover, as the expense for a tranche is recorded over the longer of (i) the expected achievement period of the relevant operational milestone and (ii) only if the related market capitalization milestone has not been achieved, its expected achievement period, the achievement of a market capitalization milestone earlier than expected may accelerate the rate at which such expense is recognized. Upon vesting of a tranche, all remaining associated expense will be recognized immediately. See Note 14, Equity Incentive Plans—2018 CEO Performance Award, to the consolidated financial statements included elsewhere in this Annual Report on Form 10-K for further details regarding the stock-based compensation relating to the 2018 CEO Performance Award.
Critical Accounting Policies and Estimates
The consolidated financial statements are prepared in accordance with accounting principles generally accepted in the U.S. (“GAAP”). The preparation of the consolidated financial statements requires us to make estimates and assumptions that affect the reported amounts of assets, liabilities, revenues, costs and expenses and related disclosures. We base our estimates on historical experience, as appropriate, and on various other assumptions that we believe to be reasonable under the circumstances. Changes in the accounting estimates are reasonably likely to occur from period to period. Accordingly, actual results could differ significantly from the estimates made by our management. We evaluate our estimates and assumptions on an ongoing basis. To the extent that there are material differences between these estimates and actual results, our future financial statement presentation, financial condition, results of operations and cash flows will be affected. We believe that the following critical accounting policies involve a greater degree of judgment and complexity than our other accounting policies. Accordingly, these are the policies we believe are the most critical to understanding and evaluating the consolidated financial condition and results of operations.
Revenue Recognition
Adoption of new revenue standard
On January 1, 2018, we adopted ASC 606, Revenue from Contracts with Customers, (“new revenue standard”) using the modified retrospective method. The new revenue standard had a material impact in our consolidated financial statements. For further discussion, refer to Note 2, Summary of Significant Accounting Policies, to the consolidated financial statements included elsewhere in this Annual Report on Form 10-K.
Automotive Segment
Automotive Sales Revenue
Automotive Sales without Resale Value Guarantee
Automotive sales revenue includes revenues related to deliveries of new vehicles and pay-per-use charges, and specific other features and services that meet the definition of a performance obligation under the new revenue standard, including access to our Supercharger network, internet connectivity, Autopilot, FSD features and over-the-air software updates. We recognize revenue on automotive sales upon delivery to the customer, which is when the control of a vehicle transfers. Payments are typically received at the point control transfers or in accordance with payment terms customary to the business. Other features and services such as access to our Supercharger network, internet connectivity and over-the-air software updates are provisioned upon control transfer of a vehicle and recognized over time on a straight-line basis as we have a stand-ready obligation to deliver such services to the customer. We recognize revenue related to these other features and services over the performance period, which is generally the expected ownership life of the vehicle or the eight-year life of the vehicle. Revenue related to Autopilot and FSD features is recognized when functionality is delivered to the customer. For our obligations related to automotive sales, we estimate standalone selling price by considering costs used to develop and deliver the service, third-party pricing of similar options and other information that may be available.
At the time of revenue recognition, we reduce the transaction price and record a sales return reserve against revenue for estimated variable consideration related to future product returns based on historical experience. In addition, any fees that are paid or payable by us to a customer’s lender when we arrange the financing are recognized as an offset against automotive sales revenue.
Costs to obtain a contract mainly relate to commissions paid to our sales personnel for the sale of vehicles. Commissions are not paid on other obligations such as access to our Supercharger network, internet connectivity, Autopilot, FSD features and over-the-air software updates. As our contract costs related to automotive sales are typically fulfilled within one year, the costs to obtain a contract are expensed as incurred. Amounts billed to customers related to shipping and handling are classified as automotive revenue, and we have elected to recognize the cost for freight and shipping when control over vehicles, parts, or accessories have transferred to the customer as an expense in cost of revenues. Our policy is to exclude taxes collected from a customer from the transaction price of automotive contracts.
Automotive Sales with Resale Value Guarantee or a Buyback Option
We offer resale value guarantees or similar buy-back terms to certain international customers who purchase vehicles and who finance their vehicles through one of our specified commercial banking partners. We also offer resale value guarantees in connection with automotive sales to certain leasing partners. Under these programs, we receive full payment for the vehicle sales price at the time of delivery and our counterparty has the option of selling their vehicle back to us during the guarantee period, which currently is generally at the end of the term of the applicable loan or financing program, for a pre-determined resale value.
With the exception of two programs which are discussed within the Automotive Leasing section, we recognize revenue when control transfers upon delivery to customers in accordance with the new revenue standard as a sale with a right of return as we do not believe the customer has a significant economic incentive to exercise the resale value guarantee provided to them. The process to determine whether there is a significant economic incentive includes a comparison of a vehicle’s estimated market value at the time the option is exercisable with the guaranteed resale value to determine the customer’s economic incentive to exercise. The performance obligations and the pattern of recognizing automotive sales with resale value guarantees are consistent with automotive sales without resale value guarantees with the exception of our estimate for sales return reserve. Sales return reserves for automotive sales with resale value guarantees are estimated based on historical experience plus consideration for expected future market values. On a quarterly basis, we assess the estimated market values of vehicles under our buyback options program to determine whether there have been changes to the likelihood of future product returns. As we accumulate more data related to the buyback values of our vehicles or as market conditions change, there may be material changes to their estimated values. The two programs that are still being recorded as operating leases are discussed in further detail below in Vehicle Sales to Leasing Partners with a Resale Value Guarantee and a Buyback Option and Vehicle Sales to Customers with a Resale Value Guarantee where Exercise is Probable.
Prior to the adoption of the new revenue standard, all transactions with resale value guarantees were recorded as operating leases. The amount of sale proceeds equal to the resale value guarantee was deferred until the guarantee expired or was exercised. For certain transactions that were considered interest bearing collateralized borrowings as required under ASC 840, Leases prior to January 1, 2019, we also accrued interest expense based on our borrowing rate. The remaining sale proceeds were deferred and recognized on a straight-line basis over the stated guarantee period to automotive leasing revenue. The guarantee period expired at the earlier of the end of the guarantee period or the pay-off of the initial loan. We capitalized the cost of these vehicles on the consolidated balance sheet as operating lease vehicles, net, and depreciated their value, less estimated residual value, to cost of automotive leasing revenue over the same period.
In cases where our counterparty retained ownership of the vehicle at the end of the guarantee period, the resale value guarantee liability and any remaining deferred revenue balances related to the vehicle were settled to automotive leasing revenue, and the net book value of the leased vehicle was expensed to cost of automotive leasing revenue. If our counterparty returned the vehicle to us during the guarantee period, we purchased the vehicle from our counterparty in an amount equal to the resale value guarantee and settled any remaining deferred balances to automotive leasing revenue, and we reclassified the net book value of the vehicle on the consolidated balance sheet to used vehicle inventory.
Automotive Regulatory Credits
In connection with the production and delivery of our zero emission vehicles in global markets, we have earned and will continue to earn various tradable automotive regulatory credits. We have sold these credits, and will continue to sell future credits, to automotive companies and other regulated entities who can use the credits to comply with emission standards and other regulatory requirements. For example, under California’s Zero Emission Vehicle Regulation and those of states that have adopted California’s standard, vehicle manufacturers are required to earn or purchase credits, referred to as ZEV credits, for compliance with their annual regulatory requirements. These laws provide that automakers may bank or sell to other regulated parties their excess credits if they earn more credits than the minimum quantity required by those laws. We also earn other types of saleable regulatory credits in the United States and abroad, including greenhouse gas, fuel economy and clean fuels credits. Payments for regulatory credits are typically received at the point control transfers to the customer, or in accordance with payment terms customary to the business. We recognize revenue on the sale of automotive regulatory credits at the time control of the regulatory credits is transferred to the purchasing party as automotive revenue in the consolidated statement of operations.
Automotive Leasing Revenue
Automotive leasing revenue includes revenue recognized under lease accounting guidance for our direct leasing programs as well as the two programs with resale value guarantees which continue to qualify for operating lease treatment. Prior to the adoption of the new revenue standard, all programs with resale value guarantees were accounted for as operating leases.
Direct Vehicle Leasing Program
We have outstanding leases under our direct vehicle leasing programs in the U.S., Canada and in certain countries in Europe. As of December 31, 2019, the direct vehicle leasing program is offered for all new Model S, Model X and Model 3 vehicles in the U.S. and new Model S and Model X vehicles in Canada. Qualifying customers are permitted to lease a vehicle directly from Tesla for up to 48 months. At the end of the lease term, customers are required to return the vehicles to us or for Model S and Model X leases, may opt to purchase the vehicles for a pre-determined residual value. We account for these leasing transactions as operating leases. We record leasing revenues to automotive leasing revenue on a straight-line basis over the contractual term, and we record the depreciation of these vehicles to cost of automotive leasing revenue.
We capitalize shipping costs and initial direct costs such as the incremental cost of referral fees and sales commissions from the origination of automotive lease agreements as an element of operating lease vehicles, net, and subsequently amortize these costs over the term of the related lease agreement. Our policy is to exclude taxes collected from a customer from the transaction price of automotive contracts.
Vehicle Sales to Leasing Partners with a Resale Value Guarantee and a Buyback Option
We offer buyback options in connection with automotive sales with resale value guarantees with certain leasing partner sales in the United States. These transactions entail a transfer of leases, which we have originated with an end-customer, to our leasing partner. As control of the vehicles has not been transferred in accordance with the new revenue standard, these transactions were accounted for as interest bearing collateralized borrowings in accordance with ASC 840, Leases, prior to January 1, 2019. Under this program, cash is received for the full price of the vehicle and the collateralized borrowing value is generally recorded within resale value guarantees and the customer upfront down payment is recorded within deferred revenue. We amortize the deferred revenue amount to automotive leasing revenue on a straight-line basis over the option period and accrue interest expense based on our borrowing rate. We capitalize vehicles under this program to operating lease vehicles, net, on the consolidated balance sheets, and we record depreciation from these vehicles to cost of automotive leasing revenue during the period the vehicle is under a lease arrangement. Cash received for these vehicles, net of revenue recognized during the period, is classified as collateralized lease (repayments) borrowings within cash flows from financing activities in the consolidated statements of cash flows. With the adoption of ASC 842 on January 1, 2019, all new agreements under this program are accounted for as operating leases under ASC 842 and there was no material change in the timing and amount of revenue recognized over the term. Consequently, any cash flows for new agreements are classified as operating cash activities on the consolidated statements of cash flows.
At the end of the lease term, we settle our liability in cash by either purchasing the vehicle from the leasing partner for the buyback option amount or paying a shortfall to the option amount the leasing partner may realize on the sale of the vehicle. Any remaining balances within deferred revenue and resale value guarantee will be settled to automotive leasing revenue. The end customers can extend the lease for a period of up to 6 months. In cases where the leasing partner retains ownership of the vehicle after the end of our option period, we expense the net value of the leased vehicle to cost of automotive leasing revenue.
Vehicle Sales to Customers with a Resale Value Guarantee where Exercise is Probable
For certain international programs where we have offered resale value guarantees to certain customers who purchased vehicles and where we expect the customer has a significant economic incentive to exercise the resale value guarantee provided to them, we continue to recognize these transactions as operating leases. The process to determine whether there is a significant economic incentive includes a comparison of a vehicle’s estimated market value at the time the option is exercisable with the guaranteed resale value to determine the customer’s economic incentive to exercise. We have not sold any vehicles under this program since the first half of 2017 and all current period activity relates to the exercise or cancellation of active transactions. The amount of sale proceeds equal to the resale value guarantee is deferred until the guarantee expires or is exercised. The remaining sale proceeds are deferred and recognized on a straight-line basis over the stated guarantee period to automotive leasing revenue. The guarantee period expires at the earlier of the end of the guarantee period or the pay-off of the initial loan. We capitalize the cost of these vehicles on the consolidated balance sheet as operating lease vehicles, net, and depreciate their value, less salvage value, to cost of automotive leasing revenue over the same period.
In cases where a customer retains ownership of a vehicle at the end of the guarantee period, the resale value guarantee liability and any remaining deferred revenue balances related to the vehicle are settled to automotive leasing revenue, and the net book value of the leased vehicle is expensed to cost of automotive leasing revenue. If a customer returns the vehicle to us during the guarantee period, we purchase the vehicle from the customer in an amount equal to the resale value guarantee and settle any remaining deferred balances to automotive leasing revenue, and we reclassify the net book value of the vehicle on the consolidated balance sheets to used vehicle inventory.
Energy Generation and Storage Segment
Energy Generation and Storage Sales
Energy generation and storage sales revenue consists of the sale of solar energy systems and energy storage systems to residential, small commercial, and large commercial and utility grade customers, including solar subscription-based arrangements. Upon adoption of ASC 842, energy generation and storage sales revenue includes agreements for solar energy systems and PPAs that commence after January 1, 2019, as these are now accounted for under the new revenue standard. Sales of solar energy systems to residential and small scale commercial customers consist of the engineering, design, and installation of the system. Post-installation, residential and small scale commercial customers receive a proprietary monitoring system that captures and displays historical energy generation data. Residential and small scale commercial customers pay the full purchase price of the solar energy system upfront. Revenue for the design and installation obligation is recognized when control transfers, which is when we install a solar energy system and the system passes inspection by the utility or the authority having jurisdiction. Revenue for the monitoring service is recognized ratably as a stand-ready obligation over the warranty period of the solar energy system. Sales of energy storage systems to residential and small scale commercial customers consist of the installation of the energy storage system and revenue is recognized when control transfers, which is when the product has been delivered or, if we are performing installation, when installed and commissioned. Payment for such storage systems is made upon invoice or in accordance with payment terms customary to the business.
For large commercial and utility grade solar energy system and energy storage system sales which consist of the engineering, design, and installation of the system, customers make milestone payments that are consistent with contract-specific phases of a project. Revenue from such contracts is recognized over time using the percentage of completion method based on cost incurred as a percentage of total estimated contract costs for energy storage system sales and as a percentage of total estimated labor hours for solar energy system sales. Certain large-scale commercial and utility grade solar energy system and energy storage system sales also include operations and maintenance service which are negotiated with the design and installation contracts and are thus considered to be a combined contract with the design and installation service. For certain large commercial and utility grade solar energy systems and energy storage systems where the percentage of completion method does not apply, revenue is recognized when control transfers, which is when the product has been delivered to the customer and commissioned for energy storage systems and when the project has received permission to operate from the utility for solar energy systems. Operations and maintenance service revenue is recognized ratably over the respective contract term for solar energy system sales and upon delivery of the service for energy storage system sales. Customer payments for such services are usually paid annually or quarterly in advance.
In instances where there are multiple performance obligations in a single contract, we allocate the consideration to the various obligations in the contract based on the relative standalone selling price method. Standalone selling prices are estimated based on estimated costs plus margin or using market data for comparable products. Costs incurred on the sale of residential installations before the solar energy systems are completed are included as work in process within inventory in the consolidated balance sheets. However, any fees that are paid or payable by us to a solar loan lender would be recognized as an offset against revenue. Costs to obtain a contract relate mainly to commissions paid to our sales personnel related to the sale of solar energy systems and energy storage systems. As our contract costs related to solar energy system and energy storage system sales are typically fulfilled within one year, the costs to obtain a contract are expensed as incurred.
As part of our solar energy system and energy storage system contracts, we may provide the customer with performance guarantees that warrant that the underlying system will meet or exceed the minimum energy generation or retention requirements specified in the contract. In certain instances, we may receive a bonus payment if the system performs above a specified level. Conversely, if a solar energy system or energy storage system does not meet the performance guarantee requirements, we may be required to pay liquidated damages. Other forms of variable consideration related to our large commercial and utility grade solar energy system and energy storage system contracts include variable customer payments that will be made based on our energy market participation activities. Such guarantees and variable customer payments represent a form of variable consideration and are estimated at contract inception at their most likely amount and updated at the end of each reporting period as additional performance data becomes available. Such estimates are included in the transaction price only to the extent that it is probable a significant reversal of revenue will not occur.
We record as deferred revenue any non-refundable amounts that are collected from customers related to fees charged for prepayments and remote monitoring service and operations and maintenance service, which is recognized as revenue ratably over the respective customer contract term.
Energy Generation and Storage Leasing
For revenue arrangements where we are the lessor under operating lease agreements for energy generation and storage products, we record lease revenue from minimum lease payments, including upfront rebates and incentives earned from such systems, on a straight-line basis over the life of the lease term, assuming all other revenue recognition criteria have been met. The difference between the payments received and the revenue recognized is recorded as deferred revenue on the consolidated balance sheet.
For solar energy systems where customers purchase electricity from us under PPAs prior to January 1, 2019, we have determined that these agreements should be accounted for as operating leases pursuant to ASC 840. Revenue is recognized based on the amount of electricity delivered at rates specified under the contracts, assuming all other revenue recognition criteria are met.
We record as deferred revenue any amounts that are collected from customers, including lease prepayments, in excess of revenue recognized and operations and maintenance service, which is recognized as revenue ratably over the respective customer contract term. Deferred revenue also includes the portion of rebates and incentives received from utility companies and various local and state government agencies, which is recognized as revenue over the lease term.
We capitalize initial direct costs from the execution of agreements for solar energy systems and PPAs, which include the referral fees and sales commissions, as an element of solar energy systems, net, and subsequently amortize these costs over the term of the related agreements.
Inventory Valuation
Inventories are stated at the lower of cost or net realizable value. Cost is computed using standard cost for vehicles and energy storage products, which approximates actual cost on a first-in, first-out basis. In addition, cost for solar energy systems is recorded using actual cost. We record inventory write-downs for excess or obsolete inventories based upon assumptions about current and future demand forecasts. If our inventory on-hand is in excess of our future demand forecast, the excess amounts are written-off.
We also review our inventory to determine whether its carrying value exceeds the net amount realizable upon the ultimate sale of the inventory. This requires us to determine the estimated selling price of our vehicles less the estimated cost to convert the inventory on-hand into a finished product. Once inventory is written-down, a new, lower cost basis for that inventory is established and subsequent changes in facts and circumstances do not result in the restoration or increase in that newly established cost basis.
Should our estimates of future selling prices or production costs change, additional and potentially material increases to this reserve may be required. A small change in our estimates may result in a material charge to our reported financial results.
Warranties
We provide a manufacturer’s warranty on all new and used vehicles and production powertrain components and systems we sell. In addition, we also provide a warranty on the installation and components of the energy generation and storage systems we sell for periods typically between 10 to 25 years. We accrue a warranty reserve for the products sold by us, which includes our best estimate of the projected costs to repair or replace items under warranties and recalls when identified. These estimates are based on actual claims incurred to date and an estimate of the nature, frequency and costs of future claims. These estimates are inherently uncertain given our relatively short history of sales, and changes to our historical or projected warranty experience may cause material changes to the warranty reserve in the future. The warranty reserve does not include projected warranty costs associated with our vehicles subject to lease accounting and our solar energy systems under lease contracts or PPAs, as the costs to repair these warranty claims are expensed as incurred. The portion of the warranty reserve expected to be incurred within the next 12 months is included within accrued liabilities and other, while the remaining balance is included within other long-term liabilities on the consolidated balance sheets. Warranty expense is recorded as a component of cost of revenues in the consolidated statements of operations.
Stock-Based Compensation
We use the fair value method of accounting for our stock options and restricted stock units (“RSUs”) granted to employees and our employee stock purchase plan (the “ESPP”) to measure the cost of employee services received in exchange for the stock-based awards. The fair value of stock option awards with only service and/or performance conditions and ESPP is estimated on the grant or offering date using the Black-Scholes option-pricing model. The Black-Scholes option-pricing model requires inputs such as the risk-free interest rate, expected term and expected volatility. These inputs are subjective and generally require significant judgment. The fair value of RSUs is measured on the grant date based on the closing fair market value of our common stock. The resulting cost is recognized over the period during which an employee is required to provide service in exchange for the awards, usually the vesting period, which is generally four years for stock options and RSUs and six months for the ESPP. Stock-based compensation expense is recognized on a straight-line basis, net of actual forfeitures in the period.
For performance-based awards, stock-based compensation expense is recognized over the expected performance achievement period of individual performance milestones when the achievement of each individual performance milestone becomes probable. For performance-based awards with a vesting schedule based entirely on the attainment of both performance and market conditions, stock-based compensation expense associated with each tranche is recognized over the longer of (i) the expected achievement period for the operational milestone for such tranche and (ii) the expected achievement period for the related market capitalization milestone determined on the grant date, beginning at the point in time when the relevant operational milestone is considered probable of being met. If such operational milestone becomes probable any time after the grant date, we will recognize a cumulative catch-up expense from the grant date to that point in time. If the related market capitalization milestone is achieved earlier than its expected achievement period and the achievement of the related operational milestone, then the stock-based compensation expense will be recognized over the expected achievement period for the operational milestone, which may accelerate the rate at which such expense is recognized. If additional operational milestones become probable, stock-based compensation expense will be recorded in the period it becomes probable including cumulative catch-up expense for the service provided since the grant date. The fair value of such awards is estimated on the grant date using Monte Carlo simulations.
As we accumulate additional employee stock-based awards data over time and as we incorporate market data related to our common stock, we may calculate significantly different volatilities and expected lives, which could materially impact the valuation of our stock-based awards and the stock-based compensation expense that we will recognize in future periods. Stock-based compensation expense is recorded in cost of revenues, research and development expense and selling, general and administrative expense in the consolidated statements of operations.
Income Taxes
We are subject to federal and state taxes in the U.S. and in many foreign jurisdictions. Significant judgment is required in determining our provision for income taxes, our deferred tax assets and liabilities and any valuation allowance recorded against our net deferred tax assets. We make these estimates and judgments about our future taxable income that are based on assumptions that are consistent with our future plans. Tax laws, regulations, and administrative practices may be subject to change due to economic or political conditions including fundamental changes to the tax laws applicable to corporate multinationals. The U.S., many countries in the European Union and a number of other countries are actively considering changes in this regard. As of December 31, 2019, we had recorded a full valuation allowance on our net U.S. deferred tax assets because we expect that it is more likely than not that our U.S. deferred tax assets will not be realized in the foreseeable future. Should the actual amounts differ from our estimates, the amount of our valuation allowance could be materially impacted.
Furthermore, significant judgment is required in evaluating our tax positions. In the ordinary course of business, there are many transactions and calculations for which the ultimate tax settlement is uncertain. As a result, we recognize the effect of this uncertainty on our tax attributes based on our estimates of the eventual outcome. These effects are recognized when, despite our belief that our tax return positions are supportable, we believe that it is more likely than not that those positions may not be fully sustained upon review by tax authorities. We are required to file income tax returns in the U.S. and various foreign jurisdictions, which requires us to interpret the applicable tax laws and regulations in effect in such jurisdictions. Such returns are subject to audit by the various federal, state and foreign taxing authorities, who may disagree with respect to our tax positions. We believe that our consideration is adequate for all open audit years based on our assessment of many factors, including past experience and interpretations of tax law. We review and update our estimates in light of changing facts and circumstances, such as the closing of a tax audit, the lapse of a statute of limitations or a change in estimate. To the extent that the final tax outcome of these matters differs from our expectations, such differences may impact income tax expense in the period in which such determination is made. The eventual impact on our income tax expense depends in part if we still have a valuation allowance recorded against our deferred tax assets in the period that such determination is made.
Principles of Consolidation
The consolidated financial statements reflect our accounts and operations and those of our subsidiaries in which we have a controlling financial interest. In accordance with the provisions of ASC 810, Consolidation, we consolidate any variable interest entity (“VIE”) of which we are the primary beneficiary. We form VIEs with our financing fund investors in the ordinary course of business in order to facilitate the funding and monetization of certain attributes associated with our solar energy systems and leases under our direct vehicle leasing programs. The typical condition for a controlling financial interest ownership is holding a majority of the voting interests of an entity; however, a controlling financial interest may also exist in entities, such as VIEs, through arrangements that do not involve controlling voting interests. ASC 810 requires a variable interest holder to consolidate a VIE if that party has the power to direct the activities of the VIE that most significantly impact the VIE’s economic performance and the obligation to absorb losses of the VIE that could potentially be significant to the VIE or the right to receive benefits from the VIE that could potentially be significant to the VIE. We do not consolidate a VIE in which we have a majority ownership interest when we are not considered the primary beneficiary. We have determined that we are the primary beneficiary of all the VIEs. We evaluate our relationships with all the VIEs on an ongoing basis to ensure that we continue to be the primary beneficiary. All intercompany transactions and balances have been eliminated upon consolidation.
Noncontrolling Interests and Redeemable Noncontrolling Interests
Noncontrolling interests and redeemable noncontrolling interests represent third-party interests in the net assets under certain funding arrangements, or funds, that we enter into to finance the costs of solar energy systems and vehicles under operating leases. We have determined that the contractual provisions of the funds represent substantive profit sharing arrangements. We have further determined that the appropriate methodology for calculating the noncontrolling interest and redeemable noncontrolling interest balances that reflects the substantive profit sharing arrangements is a balance sheet approach using the hypothetical liquidation at book value (“HLBV”) method. We, therefore, determine the amount of the noncontrolling interests and redeemable noncontrolling interests in the net assets of the funds at each balance sheet date using the HLBV method, which is presented on the consolidated balance sheet as noncontrolling interests in subsidiaries and redeemable noncontrolling interests in subsidiaries. Under the HLBV method, the amounts reported as noncontrolling interests and redeemable noncontrolling interests in the consolidated balance sheet represent the amounts the third-parties would hypothetically receive at each balance sheet date under the liquidation provisions of the funds, assuming the net assets of the funds were liquidated at their recorded amounts determined in accordance with GAAP and with tax laws effective at the balance sheet date and distributed to the third-parties. The third-parties’ interests in the results of operations of the funds are determined as the difference in the noncontrolling interest and redeemable noncontrolling interest balances in the consolidated balance sheets between the start and end of each reporting period, after taking into account any capital transactions between the funds and the third-parties. However, the redeemable noncontrolling interest balance is at least equal to the redemption amount. The redeemable noncontrolling interest balance is presented as temporary equity in the mezzanine section of the consolidated balance sheet since these third-parties have the right to redeem their interests in the funds for cash or other assets.
Results of Operations
Revenues
| Year Ended December 31, | 2019 vs. 2018 Change | 2018 vs. 2017 Change | ||||||||||||||||||||||||||
|---|---|---|---|---|---|---|---|---|---|---|---|---|---|---|---|---|---|---|---|---|---|---|---|---|---|---|---|---|
| (Dollars in millions) | 2019 | 2018 | 2017 | $ | % | $ | % | |||||||||||||||||||||
| Automotive sales | $ | 19,952 | $ | 17,632 | $ | 8,535 | $ | 2,320 | 13 | % | $ | 9,097 | 107 | % | ||||||||||||||
| Automotive leasing | 869 | 883 | 1,107 | (14 | ) | -2 | % | (224 | ) | -20 | % | |||||||||||||||||
| Total automotive revenues | 20,821 | 18,515 | 9,642 | 2,306 | 12 | % | 8,873 | 92 | % | |||||||||||||||||||
| Services and other | 2,226 | 1,391 | 1,001 | 835 | 60 | % | 390 | 39 | % | |||||||||||||||||||
| Total automotive & services and other segment revenue | 23,047 | 19,906 | 10,643 | 3,141 | 16 | % | 9,263 | 87 | % | |||||||||||||||||||
| Energy generation and storage segment revenue | 1,531 | 1,555 | 1,116 | (24 | ) | -2 | % | 439 | 39 | % | ||||||||||||||||||
| Total revenues | $ | 24,578 | $ | 21,461 | $ | 11,759 | $ | 3,117 | 15 | % | $ | 9,702 | 83 | % |
Automotive & Services and Other Segment
Automotive sales revenue includes revenues related to cash sales of new Model S, Model X and Model 3 vehicles, including access to our Supercharger network, internet connectivity, Autopilot and FSD features and over-the-air software updates, as well as sales of regulatory credits to other automotive manufacturers. Cash deliveries are vehicles that are not subject to lease accounting.
Automotive leasing revenue includes the amortization of revenue for Model S, Model X and Model 3 vehicles under direct lease agreements as well as those sold with resale value guarantees accounted for as operating leases under lease accounting. We began offering direct leasing for Model 3 vehicles in the second quarter of 2019.
Services and other revenue consists of non-warranty after-sales vehicle services, sales of used vehicles, retail merchandise, sales by our acquired subsidiaries to third party customers, and vehicle insurance revenue.
2019 Compared to 2018
Automotive sales revenue increased $2.32 billion, or 13%, in the year ended December 31, 2019 as compared to the year ended December 31, 2018, primarily due to an increase of 137,969 Model 3 cash deliveries from production scaling and an increase of $175 million in sales of regulatory credits to $594 million. The increase was partially offset by a decrease of 30,487 Model S and Model X cash deliveries. The deliveries in the year ended December 31, 2019 were at lower average selling prices than the prior year due to price adjustments we made to our vehicle offerings and the introduction of lower end Model 3 trims in 2019. Due to the price adjustments, we estimated that there is a greater likelihood that customers will exercise their buyback options that were provided prior to such adjustments. As a result, along with the estimated variable consideration related to normal future product returns for vehicles sold under the buyback options program, we adjusted our sales return reserve on vehicles previously sold under our buyback options program resulting in a reduction of automotive sales revenues of $555 million. Refer to Note 2, Summary of Significant Accounting Policies, to the consolidated statements included elsewhere in this Annual Report on Form 10-K.
Automotive leasing revenue decreased $14 million, or 2%, in the year ended December 31, 2019 as compared to the year ended December 31, 2018. The decrease was primarily due to a decrease in cumulative vehicles under our resale value guarantee leasing programs which are accounted for as operating leases. The decrease was partially offset by an increase in cumulative vehicles under our direct vehicle leasing program, partially due to the introduction of Model 3 direct leasing in the second quarter of 2019.
Services and other revenue increased $835 million, or 60%, in the year ended December 31, 2019 as compared to the year ended December 31, 2018. The increase was primarily due to an increase in used vehicle sales from an increased volume of trade-in vehicles, partially offset by lower average selling prices for traded-in Tesla vehicles due to price adjustments we made to our vehicle offerings in 2019. Additionally, there was an increase in non-warranty maintenance services revenue as our fleet continues to grow.
Energy Generation and Storage Segment
Energy generation and storage revenue includes sales and leasing of solar energy generation and energy storage products, services related to such products, and sales of solar energy systems incentives.
2019 Compared to 2018
Energy generation and storage revenue decreased by $24 million, or 2%, in the year ended December 31, 2019 as compared to the year ended December 31, 2018, primarily due to decreases in deployments of solar cash and loan jobs partially offset increases in deployments of Powerwall, Powerpack, and Megapack.
Cost of Revenues and Gross Margin
| Year Ended December 31, | 2019 vs. 2018 Change | 2018 vs. 2017 Change | ||||||||||||||||||||||||||
|---|---|---|---|---|---|---|---|---|---|---|---|---|---|---|---|---|---|---|---|---|---|---|---|---|---|---|---|---|
| (Dollars in millions) | 2019 | 2018 | 2017 | $ | % | $ | % | |||||||||||||||||||||
| Cost of revenues | ||||||||||||||||||||||||||||
| Automotive sales | $ | 15,939 | $ | 13,686 | $ | 6,725 | $ | 2,253 | 16 | % | $ | 6,961 | 104 | % | ||||||||||||||
| Automotive leasing | 459 | 488 | 708 | (29 | ) | -6 | % | (220 | ) | -31 | % | |||||||||||||||||
| Total automotive cost of revenues | 16,398 | 14,174 | 7,433 | 2,224 | 16 | % | 6,741 | 91 | % | |||||||||||||||||||
| Services and other | 2,770 | 1,880 | 1,229 | 890 | 47 | % | 651 | 53 | % | |||||||||||||||||||
| Total automotive & services and other segment cost of revenues | 19,168 | 16,054 | 8,662 | 3,114 | 19 | % | 7,392 | 85 | % | |||||||||||||||||||
| Energy generation and storage segment | 1,341 | 1,365 | 874 | (24 | ) | -2 | % | 491 | 56 | % | ||||||||||||||||||
| Total cost of revenues | $ | 20,509 | $ | 17,419 | $ | 9,536 | $ | 3,090 | 18 | % | $ | 7,883 | 83 | % | ||||||||||||||
| Gross profit total automotive | $ | 4,423 | $ | 4,341 | $ | 2,209 | ||||||||||||||||||||||
| Gross margin total automotive | 21 | % | 23 | % | 23 | % | ||||||||||||||||||||||
| Gross profit total automotive & services and other segment | $ | 3,879 | $ | 3,852 | $ | 1,981 | ||||||||||||||||||||||
| Gross margin total automotive & services and other segment | 17 | % | 19 | % | 19 | % | ||||||||||||||||||||||
| Gross profit energy generation and storage segment | $ | 190 | $ | 190 | $ | 242 | ||||||||||||||||||||||
| Gross margin energy generation and storage segment | 12 | % | 12 | % | 22 | % | ||||||||||||||||||||||
| Total gross profit | $ | 4,069 | $ | 4,042 | $ | 2,223 | ||||||||||||||||||||||
| Total gross margin | 17 | % | 19 | % | 19 | % |
Automotive & Services and Other Segment
Cost of automotive sales revenue includes direct parts, material and labor costs, manufacturing overhead, including depreciation costs of tooling and machinery, shipping and logistic costs, vehicle connectivity costs, allocations of electricity and infrastructure costs related to our Supercharger network, and reserves for estimated warranty expenses. Cost of automotive sales revenues also includes adjustments to warranty expense and charges to write down the carrying value of our inventory when it exceeds its estimated net realizable value and to provide for obsolete and on-hand inventory in excess of forecasted demand.
Cost of automotive leasing revenue includes primarily the amortization of operating lease vehicles over the lease term, as well as warranty expenses recognized as incurred. Cost of automotive leasing revenue also includes vehicle connectivity costs and allocations of electricity and infrastructure costs related to our Supercharger network for vehicles under our leasing programs.
Costs of services and other revenue includes costs associated with providing non-warranty after-sales services, costs to acquire and certify used vehicles, costs for retail merchandise, and costs to provide vehicle insurance. Cost of services and other revenue also includes direct parts, material and labor costs, manufacturing overhead associated with the sales by our acquired subsidiaries to third party customers.
2019 Compared to 2018
Cost of automotive sales revenue increased $2.25 billion, or 16%, in the year ended December 31, 2019 as compared to the year ended December 31, 2018, primarily due to an increase of 137,969 Model 3 cash deliveries and higher average Model S and Model X costs per unit compared to the prior year due to the discontinuation of lower end trims in 2019. The increases were partially offset by a decrease of 30,487 Model S and Model X cash deliveries and a decrease in average Model 3 costs per unit compared to the prior year primarily due to lower end trims introduced in 2019 and temporary under-utilization of manufacturing capacity at lower production volumes in the first half of 2018. Additionally, due to price adjustments we made to our vehicle offerings in 2019, we estimated that there is a greater likelihood that customers will exercise their buyback options that were provided prior to such adjustments. If customers elect to exercise the buyback options, we expect to be able to subsequently resell the returned vehicles, which resulted in a reduction of automotive cost of sales of $451 million for the year ended December 31, 2019. Refer to Note 2, Summary of Significant Accounting Policies, to the consolidated statements included elsewhere in this Annual Report on Form 10-K.
Cost of automotive leasing revenue decreased $29 million, or 6%, in the year ended December 31, 2019 compared to the year ended December 31, 2018. The decrease was primarily due to a decrease in cumulative vehicles under our resale value guarantee leasing programs which are accounted for as operating leases. The decrease was partially offset by an increase in cumulative vehicles under our direct vehicle leasing program, partially due to the introduction of Model 3 leasing in the second quarter of 2019.
Cost of services and other revenue increased $890 million, or 47%, in the year ended December 31, 2019 as compared to the year ended December 31, 2018. The increase was primarily due to the costs of used vehicle sales from the increased volumes of trade-in vehicles. Additionally, there were increases in the costs of our new service centers, additional service personnel in existing and new service centers, Mobile Service capabilities, parts distribution centers and investment in new body shops to provide maintenance services to our rapidly growing fleet of vehicles.
Gross margin for total automotive decreased from 23% to 21% in the year ended December 31, 2019 as compared to the year ended December 31, 2018, primarily due to lower Model S and Model X margins from lower selling prices due to price adjustments we made to our vehicle offerings in 2019, a higher proportion of Model 3 as a percentage of our total automotive sales compared to the prior period. Additionally, the price adjustments also resulted in a reduction in gross automotive sales profit of $104 million from the adjustment of our sales return reserve on vehicles previously sold under our buyback options program. The decrease was partially offset by improvement of Model 3 margins compared to the prior year as we achieved additional manufacturing efficiencies in the production of Model 3 and an increase of $175 million in sales of regulatory credits.
Gross margin for total automotive & services and other segment decreased from 19% to 17% in the year ended December 31, 2019 as compared to the year ended December 31, 2018, primarily due to the automotive gross margin impacts discussed above and a higher proportion of services and other within the segment, which operates at lower gross margins than our automotive business.
Energy Generation and Storage Segment
Cost of energy generation and storage revenue includes direct and indirect material and labor costs, warehouse rent, freight, warranty expense, other overhead costs and amortization of certain acquired intangible assets. In addition, where arrangements are accounted for as operating leases, the cost of revenue is primarily comprised of depreciation of the cost of leased solar energy systems, maintenance costs associated with those systems and amortization of any initial direct costs.
2019 Compared to 2018
Cost of energy generation and storage revenue decreased by $24 million , or 2%, in the year ended December 31, 2019 as compared to the year ended December 31, 2018. The decrease was primarily due to a decrease in deployments of solar cash and loan jobs, partially offset by increases in deployments of Powerwall, Powerpack, and Megapack.
Gross margin for energy generation and storage remained relatively consistent at 12% in the year ended December 31, 2019 as compared to the year ended December 31, 2018. Energy storage gross margins improved in the current year as a result of lower materials costs, partially offset by lower gross margins in our cash and loan solar business driven by higher costs from temporary manufacturing under-utilization of our Solar Roof ramp.
Research and Development Expense
| Year Ended December 31, | 2019 vs. 2018 Change | 2018 vs. 2017 Change | ||||||||||||||||||||||||||
|---|---|---|---|---|---|---|---|---|---|---|---|---|---|---|---|---|---|---|---|---|---|---|---|---|---|---|---|---|
| (Dollars in millions) | 2019 | 2018 | 2017 | $ | % | $ | % | |||||||||||||||||||||
| Research and development | $ | 1,343 | $ | 1,460 | $ | 1,378 | $ | (117 | ) | -8 | % | $ | 82 | 6 | % | |||||||||||||
| As a percentage of revenues | 5 | % | 7 | % | 12 | % |
Research and development (“R&D”) expenses consist primarily of personnel costs for our teams in engineering and research, manufacturing engineering and manufacturing test organizations, prototyping expense, contract and professional services and amortized equipment expense.
R&D expenses as a percentage of revenue decreased from 7% to 5% in the year ended December 31, 2019 as compared to the year ended December 31, 2018. The decrease was primarily from an increase in overall revenues from our expanding sales, as well as from our focus on increasing operational efficiency and process automation, our efforts to scale down and optimize our cost structure relative to the size of our business.
R&D expenses decreased $117 million, or 8%, in the year ended December 31, 2019 compared to the year ended December 31, 2018. The decrease was primarily due to a $95 million decrease in employee and labor related expenses from cost efficiency initiatives and a $26 million decrease in professional and outside service expenses.
Selling, General and Administrative Expense
| Year Ended December 31, | 2019 vs. 2018 Change | 2018 vs. 2017 Change | ||||||||||||||||||||||||||
|---|---|---|---|---|---|---|---|---|---|---|---|---|---|---|---|---|---|---|---|---|---|---|---|---|---|---|---|---|
| (Dollars in millions) | 2019 | 2018 | 2017 | $ | % | $ | % | |||||||||||||||||||||
| Selling, general and administrative | $ | 2,646 | $ | 2,835 | $ | 2,477 | $ | (189 | ) | -7 | % | $ | 358 | 14 | % | |||||||||||||
| As a percentage of revenues | 11 | % | 13 | % | 21 | % |
Selling, general and administrative (“SG&A”) expenses generally consist of personnel and facilities costs related to our stores, marketing, sales, executive, finance, human resources, information technology and legal organizations, as well as fees for professional and contract services and litigation settlements.
SG&A expenses as a percentage of revenue decreased from 13% to 11% in year ended December 31, 2019 as compared to the year ended December 31, 2018. The decrease was primarily from an increase in overall revenues from our expanding sales, as well as from our focus on increasing operational efficiency and process automation, our efforts to scale down and optimize our cost structure relative to the size of our business.
SG&A expenses decreased $189 million, or 7%, in the year ended December 31, 2019 as compared to the year ended December 31, 2018. The decrease was primarily due to a $302 million decrease in employee and labor related expenses from decreased headcount and cost efficiency initiatives, partially offset by a $112 million increase in stock-based compensation expense. The increase in stock-based compensation expense was primarily related to the 2018 CEO Performance Award as we recorded a $72 million cumulative catch-up expense for the service provided from the grant date when an additional operational milestone was considered probable of being met in the fourth quarter of 2019. Additionally, the expense period was shorter in the prior year as it commenced upon the grant approval date of March 21, 2018.
Restructuring and other
| Year Ended December 31, | 2019 vs. 2018 Change | 2018 vs. 2017 Change | ||||||||||||||||||||||||
|---|---|---|---|---|---|---|---|---|---|---|---|---|---|---|---|---|---|---|---|---|---|---|---|---|---|---|
| (Dollars in millions) | 2019 | 2018 | 2017 | $ | % | $ | % | |||||||||||||||||||
| Restructuring and other | $ | 149 | $ | 135 | $ | — | $ | 14 | 10% | $ | 135 | N/A | ||||||||||||||
| As a percentage of revenues | 1 | % | 1 | % | 0 | % |
During the year ended December 31, 2019, we carried out certain restructuring actions in order to reduce costs and improve efficiency. As a result, we recognized $50 million of costs primarily related to employee termination expenses and losses from closing certain stores impacting both segments. We recognized $47 million in impairment related to the IPR&D intangible asset as we abandoned further development efforts (refer to Note 4, Goodwill and Intangible Assets for details) and $15 million for the related equipment within the energy generation and storage segment. We also incurred a loss of $37 million for closing operations in certain facilities. On the statement of cash flows, the amounts were presented in the captions in which such amounts would have been recorded absent the impairment charges. The employee termination expenses were substantially paid by December 31, 2019, while the remaining amounts were non-cash.
During the year ended December 31, 2018, we carried-out certain restructuring actions in order to reduce costs and improve efficiency and recognized $37 million of employee termination expenses and estimated losses from sub-leasing a certain facility. The employee termination cash expenses of $27 million were substantially paid by the end of 2018, while the remaining amounts were non-cash. Also included within restructuring and other activities was $55 million of expenses (materially all of which were non-cash) from restructuring the energy generation and storage segment, which comprised of disposals of certain tangible assets, the shortening of the useful life of a trade name intangible asset and a contract termination penalty. In addition, we concluded that a small portion of the IPR&D asset is not commercially feasible. Consequently, we recognized an impairment loss of $13 million. We recognized settlement and legal expenses of $30 million in the year ended December 31, 2018 for the settlement with the SEC relating to a take-private proposal for Tesla. These expenses were substantially paid by the end of 2018.
Interest Expense
| Year Ended December 31, | 2019 vs. 2018 Change | 2018 vs. 2017 Change | ||||||||||||||||||||||||||
|---|---|---|---|---|---|---|---|---|---|---|---|---|---|---|---|---|---|---|---|---|---|---|---|---|---|---|---|---|
| (Dollars in millions) | 2019 | 2018 | 2017 | $ | % | $ | % | |||||||||||||||||||||
| Interest expense | $ | 685 | $ | 663 | $ | 471 | $ | 22 | 3 | % | $ | 192 | 41 | % | ||||||||||||||
| As a percentage of revenues | 3 | % | 3 | % | 4 | % |
Interest expense increased by $22 million, or 3%, in the year ended December 31, 2019 as compared to the year ended December 31, 2018. The increase was primarily due to an increase in our average outstanding indebtedness at relatively consistent weighted average interest rates as compared to the year ended December 31, 2018.
Other Income (Expense), Net
| Year Ended December 31, | 2019 vs. 2018 Change | 2018 vs. 2017 Change | ||||||||||||||||||||||||
|---|---|---|---|---|---|---|---|---|---|---|---|---|---|---|---|---|---|---|---|---|---|---|---|---|---|---|
| (Dollars in millions) | 2019 | 2018 | 2017 | $ | % | $ | % | |||||||||||||||||||
| Other income (expense), net | $ | 45 | $ | 22 | $ | (125 | ) | $ | 23 | 105% | $ | 147 | Not meaningful | |||||||||||||
| As a percentage of revenues | 0 | % | 0 | % | -1 | % |
Other income (expense), net, consists primarily of foreign exchange gains and losses related to our foreign currency-denominated monetary assets and liabilities and changes in the fair values of our fixed-for-floating interest rate swaps. We expect our foreign exchange gains and losses will vary depending upon movements in the underlying exchange rates.
Other income (expense), net, increased by $23 million, or 105%, in the year ended December 31, 2019 as compared to the year ended December 31, 2018. The change was primarily due to favorable fluctuations in foreign currency exchange rates, offset by losses from interest rate swaps related to our debt facilities year-over-year.
Provision for Income Taxes
| Year Ended December 31, | 2019 vs. 2018 Change | 2018 vs. 2017 Change | ||||||||||||||||||||||||||
|---|---|---|---|---|---|---|---|---|---|---|---|---|---|---|---|---|---|---|---|---|---|---|---|---|---|---|---|---|
| (Dollars in millions) | 2019 | 2018 | 2017 | $ | % | $ | % | |||||||||||||||||||||
| Provision for income taxes | $ | 110 | $ | 58 | $ | 32 | $ | 52 | 90 | % | $ | 26 | 81 | % | ||||||||||||||
| Effective tax rate | -17 | % | -6 | % | -1 | % |
Our provision for income taxes increased by $52 million, or 90%, in the year ended December 31, 2019 as compared to the year ended December 31, 2018, primarily due to the increase in taxable profits in certain foreign jurisdictions year-over-year.
Net Income (Loss) Attributable to Noncontrolling Interests and Redeemable Noncontrolling Interests
| Year Ended December 31, | 2019 vs. 2018 Change | 2018 vs. 2017 Change | ||||||||||||||||||||||||
|---|---|---|---|---|---|---|---|---|---|---|---|---|---|---|---|---|---|---|---|---|---|---|---|---|---|---|
| (Dollars in millions) | 2019 | 2018 | 2017 | $ | % | $ | % | |||||||||||||||||||
| Net income (loss) attributable to noncontrolling interests and redeemable noncontrolling interests in subsidiaries | $ | 87 | $ | (87 | ) | $ | (279 | ) | $ | 174 | Not meaningful | $ | 192 | -69 | % |
Our net income (loss) attributable to noncontrolling interests and redeemable noncontrolling interests was related to financing fund arrangements.
Net income (loss) attributable to noncontrolling interests and redeemable noncontrolling interests changed unfavorably by $174 million in the year ended December 31, 2019 as compared to the year ended December 31, 2018. The change was primarily due to lower activities in our financing fund arrangements.
Liquidity and Capital Resources
As of December 31, 2019, we had $6.27 billion of cash and cash equivalents. Balances held in foreign currencies had a U.S. dollar equivalent of $1.26 billion and consisted primarily of Chinese yuan, euros and Canadian dollars. Our sources of cash are predominantly from our deliveries of vehicles, sales and installations of our energy storage products and solar energy systems, proceeds from debt facilities, proceeds from financing funds and proceeds from equity offerings.
Our sources of liquidity and cash flows enable us to fund ongoing operations, research and development projects for new products, establishment and/or increases of Model 3 and Model Y production capacity at the Fremont Factory and at Gigafactory Shanghai, the continued expansion of Gigafactory Nevada, the construction of Gigafactory Berlin, the manufacturing ramp of the Solar Roof at Gigafactory New York, and the continued expansion of our retail and service locations, body shops, Mobile Service fleet and Supercharger network.
As discussed in and subject to the considerations referenced in Part II, Item 7, Management's Discussion and Analysis of Financial Condition and Results of Operations—Management Opportunities, Challenges and Risks and 2020 Outlook—Trends in Cash Flow, Capital Expenditures and Operating Expenses in this Annual Report on Form 10-K, considering the expected pace of the manufacturing ramps for our products, construction and expansion of our factories, and pipeline of projects under development, and consistent with our current strategy of using a partner to manufacture battery cells, as well as considering all other infrastructure growth, we currently expect our average annual capital expenditures in 2020 and the two succeeding fiscal years to be $2.5 billion to $3.5 billion.
We expect that the cash we generate from our core operations will generally be sufficient to cover our future capital expenditures and to pay down our near-term debt obligations, although we may choose to seek alternative financing sources. For example, we expect that much of our investment in Gigafactory Shanghai will continue to be funded through indebtedness arranged through local financial institutions in China, such as the RMB 9.0 billion (or the equivalent amount in U.S. dollars) fixed asset term facility and RMB 2.25 billion (or the equivalent amount in U.S. dollars) working capital revolving facility that our local subsidiary entered into in December 2019, and we expect the same with respect to Gigafactory Berlin. As always, we continually evaluate our capital expenditure needs and may decide it is best to raise additional capital to fund the rapid growth of our business, to further strengthen our balance sheet, or for general corporate purposes.
We have an agreement to spend or incur $5.0 billion in combined capital, operational expenses, costs of goods sold and other costs in the State of New York during the 10-year period following full production at Gigafactory New York. We anticipate meeting these obligations through our operations at this facility and other operations within the State of New York, and we do not believe that we face a significant risk of default.
We expect that our current sources of liquidity together with our projection of cash flows from operating activities will provide us with adequate liquidity over at least the next 12 months. A large portion of our future expenditures is to fund our growth, and we can adjust our capital and operating expenditures by operating segment, including future expansion of our product offerings, retail and service locations, body shops, Mobile Service fleet, and Supercharger network. We may need or want to raise additional funds in the future, and these funds may not be available to us when we need or want them, or at all. If we cannot raise additional funds when we need or want them, our operations and prospects could be negatively affected.
In addition, we had $3.03 billion of unused committed amounts under our credit facilities and financing funds as of December 31, 2019, some of which are subject to satisfying specified conditions prior to draw-down (such as pledging to our lenders sufficient amounts of qualified receivables, inventories, leased vehicles and our interests in those leases, solar energy systems and the associated customer contracts, our interests in financing funds or various other assets; and contributing or selling qualified solar energy systems and the associated customer contracts or qualified leased vehicles and our interests in those leases into the financing funds). Upon the draw-down of any unused committed amounts, there are no restrictions on use of available funds for general corporate purposes. For details regarding our indebtedness and financing funds, refer to Note 12, Debt, and Note 17, Variable Interest Entity Arrangements, to the consolidated financial statements included elsewhere in this Annual Report on Form 10-K.
Summary of Cash Flows
| Year Ended December 31, | ||||||||||||
|---|---|---|---|---|---|---|---|---|---|---|---|---|
| (Dollars in millions) | 2019 | 2018 | 2017 | |||||||||
| Net cash provided by (used in) operating activities | $ | 2,405 | $ | 2,098 | $ | (61 | ) | |||||
| Net cash used in investing activities | $ | (1,436 | ) | $ | (2,337 | ) | $ | (4,196 | ) | |||
| Net cash provided by financing activities | $ | 1,529 | $ | 574 | $ | 4,415 |
Cash Flows from Operating Activities
Our cash flows from operating activities are significantly affected by our cash investments to support the growth of our business in areas such as research and development and selling, general and administrative and working capital, especially inventory, which includes vehicles in transit. Our operating cash inflows include cash from vehicle sales, customer lease payments, customer deposits, cash from sales of regulatory credits and energy generation and storage products. These cash inflows are offset by our payments to suppliers for production materials and parts used in our manufacturing process, operating expenses, operating lease payments and interest payments on our financings.
Net cash provided by operating activities increased by $307 million to $2.41 billion during the year ended December 31, 2019 from $2.10 billion during the year ended December 31, 2018. This favorable change was primarily due to the increase in net income, excluding non-cash expenses and gains, of $902 million, partially offset by the increase in net operating assets and liabilities of $407 million and $188 million of the repayment of our 0.25% Convertible Senior Notes due in 2019 which was classified as an operating activity, as this represented an interest payment on the discounted convertible notes. The increase in net operating assets and liabilities was mainly driven by a smaller increase in accounts payable and accrued liabilities in 2019 as compared to 2018, as we were ramping for Model 3 production in 2018 and a larger increase in operating lease vehicles in 2019 as compared to 2018 as we began offering Model 3 leasing in 2019. The increase in net operating assets and liabilities was partially offset by a smaller increase in inventory and a larger increase in deferred revenue in 2019 as compared to 2018.
Cash Flows from Investing Activities
Cash flows from investing activities and their variability across each period related primarily to capital expenditures, which were $1.33 billion during 2019, mainly for Gigafactory Shanghai construction, Model 3 production, and Model Y preparations, and $2.10 billion during 2018, mainly for Model 3 production. Design, acquisition and installation of solar energy systems amounted to $105 million and $218 million for the years ended December 31, 2019 and 2018, respectively.
Cash Flows from Financing Activities
Cash flows from financing activities during the year ended December 31, 2019 consisted primarily of $1.82 billion from the issuance of the 2.00% Convertible Senior Notes due in 2024 (“2024 Notes”), net of transaction costs, and $848 million from the issuance of common stock, net of underwriting discounts, in registered public offerings, $736 million of net borrowings under loan agreements entered into by certain Chinese subsidiaries, $394 million of net borrowings for automotive asset-backed notes, and $174 million from the issuance of warrants in connection with the offering of the 2024 Notes. These cash inflows were partially offset by a $732 million portion of the repayment of our 0.25% Convertible Senior Notes due in 2019 that was classified as financing activity, a $566 million repayment of our 1.625% Convertible Senior Notes due in 2019, a purchase of convertible note hedges of $476 million in connection with the offering of the 2024 Notes, and collateralized lease repayments of $389 million. See Note 12, Debt, and Note 2, Summary of Significant Accounting Policies, to the consolidated financial statements included elsewhere in this Annual Report on Form 10-K for further details regarding our debt obligations and collateralized borrowings, respectively.
Cash flows from financing activities during the year ended December 31, 2018 consisted primarily of $1.18 billion of net borrowings under automobile asset-backed notes, $431 million of net borrowings under the senior secured asset-based revolving credit agreement (the “Credit Agreement”), $334 million from the issuance of solar asset-backed notes and $296 million of proceeds from exercises of stock options and other stock issuances. These cash inflows were partially offset by net repayments of $582 million under our vehicle lease-backed loan and security agreements (the “Warehouse Agreements”), collateralized lease repayments of $559 million, repayments of $230 million of the 2.75% Convertible Senior Notes due on November 1, 2018, and repayments of $210 million under the revolving aggregation credit facility.
Contractual Obligations
We are party to contractual obligations involving commitments to make payments to third parties, including certain debt financing arrangements and leases, primarily for stores, service centers, certain manufacturing and corporate offices. These also include, as part of our normal business practices, contracts with suppliers for purchases of certain raw materials, components and services to facilitate adequate supply of these materials and services and capacity reservation contracts. The following table sets forth, as of December 31, 2019, certain significant obligations that will affect our future liquidity (in millions):
| Year Ended December 31, | ||||||||||||||||||||||||||||
|---|---|---|---|---|---|---|---|---|---|---|---|---|---|---|---|---|---|---|---|---|---|---|---|---|---|---|---|---|
| Total | 2020 | 2021 | 2022 | 2023 | 2024 | Thereafter | ||||||||||||||||||||||
| Operating lease obligations, including imputed interest | $ | 1,459 | $ | 296 | $ | 262 | $ | 210 | $ | 173 | $ | 146 | $ | 372 | ||||||||||||||
| Finance lease obligations, including imputed interest | 1,795 | 474 | 478 | 600 | 225 | 5 | 13 | |||||||||||||||||||||
| Purchase obligations (1) | 16,292 | 5,729 | 2,946 | 3,645 | 3,948 | 24 | — | |||||||||||||||||||||
| Debt, including scheduled interest (2) | 14,031 | 1,774 | 2,594 | 2,287 | 1,993 | 2,575 | 2,808 | |||||||||||||||||||||
| Total | $ | 33,577 | $ | 8,273 | $ | 6,280 | $ | 6,742 | $ | 6,339 | $ | 2,750 | $ | 3,193 |
| (1) | These amounts represent (i) purchase orders of $2.50 billion issued under binding and enforceable agreements with all vendors as of December 31, 2019 and (ii) $13.79 billion in other estimable purchase obligations pursuant to such agreements, primarily relating to the purchase of lithium-ion cells produced by Panasonic at Gigafactory Nevada, including any additional amounts we may have to pay vendors if we do not meet certain minimum purchase obligations. In cases where no purchase orders were outstanding under binding and enforceable agreements as of December 31, 2019, we have included estimated amounts based on our best estimates and assumptions or discussions with the relevant vendors as of such date or, where applicable, on amounts or assumptions included in such agreements for purposes of discussion or reference. In certain cases, such estimated amounts were subject to contingent events. Furthermore, these amounts do not include future payments for purchase obligations that were recorded in accounts payable or accrued liabilities as of December 31, 2019. |
|---|
| (2) | Debt, including scheduled interest, includes our non-recourse indebtedness of $5.29 billion. Non-recourse debt refers to debt that is recourse to only assets of our subsidiaries. Short-term scheduled interest payments and amortization of convertible senior note conversion features, debt discounts and deferred financing costs for the year ended December 31, 2020 is $375 million. Long-term scheduled interest payments and amortization of convertible senior note conversion features, debt discounts and deferred financing costs for the years thereafter is $1.86 billion. |
|---|
The table above excludes unrecognized tax benefits of $247 million because if recognized, they would be an adjustment to our deferred tax assets.
We offer resale value guarantees or similar buyback terms to certain customers who purchase and finance their vehicles through one of our specified commercial banking partners and certain leasing partners (refer to Automotive Sales with Resale Value Guarantee or a Buyback Option in Note 2, Significant Accounting Policies, to the consolidated financial statements included elsewhere in this Annual Report on Form 10-K). The maximum amount we could be required to pay under these programs, should customers exercise their resale value guarantees or buyback options, would be $1.70 billion over the next five years, of which $226 million is within a 12-month period from December 31, 2019. We have not included this in the table above as it is unknown how many customers will exercise their options. Additionally, we plan to resell any vehicles which are returned to us and therefore, the actual exposure to us is deemed to be limited.
Off-Balance Sheet Arrangements
During the periods presented, we did not have relationships with unconsolidated entities or financial partnerships, such as entities often referred to as structured finance or special purpose entities, which were established for the purpose of facilitating off-balance sheet arrangements or other contractually narrow or limited purposes.
Recent Accounting Pronouncements
See Note 2, Summary of Significant Accounting Policies, to the consolidated financial statements included elsewhere in this Annual Report on Form 10-K.
Previous: Item 2. PROPERTIES · Next: Item 7A. QUANTITATIVE AND QUALITATIVE DISCLOSURES ABOUT MARKET RISK