 filings.tools
Tyson Foods 10-K 2021-10-02
Filed 2021-11-15. 22 sections, 542K characters. Original on sec.gov · Markdown · JSON
Cover and table of contents
UNITED STATES
SECURITIES AND EXCHANGE COMMISSION
Washington, D.C. 20549
FORM 10-K
| ☒ | Annual Report Pursuant to Section 13 or 15(d) of the Securities Exchange Act of 1934 | ||||||||||
| For the fiscal year ended | October 2, 2021 | ||||||||||
| ☐ | Transition Report Pursuant to Section 13 or 15(d) of the Securities Exchange Act of 1934 | ||||||||||
| For the transition period from to |
001-14704
(Commission File Number)
______________________________________________
TYSON FOODS, INC.
(Exact name of registrant as specified in its charter)
______________________________________________
| Delaware | 71-0225165 | ||||||||||||||||||||||
| (State or other jurisdiction of incorporation or organization) | (I.R.S. Employer Identification No.) | ||||||||||||||||||||||
| 2200 West Don Tyson Parkway, | |||||||||||||||||||||||
| Springdale, | Arkansas | 72762-6999 | |||||||||||||||||||||
| (Address of principal executive offices) | (Zip Code) | ||||||||||||||||||||||
| (479) | 290-4000 | ||||||||||||||||||||||
| (Registrant’s telephone number, including area code) |
Securities Registered Pursuant to Section 12(b) of the Act:
| Title of Each Class | Trading Symbol | Name of Each Exchange on Which Registered | ||||||||||||
| Class A Common Stock | Par Value | $0.10 | TSN | New York Stock Exchange | ||||||||||
Securities Registered Pursuant to Section 12(g) of the Act: Not Applicable
Indicate by check mark if the registrant is a well-known seasoned issuer, as defined in Rule 405 of the Securities Act. Yes ☒ No ☐
Indicate by check mark if the registrant is not required to file reports pursuant to Section 13 or Section 15(d) of the Act. Yes ☐ No ☒
Indicate by check mark whether the registrant (1) has filed all reports required to be filed by Section 13 or 15(d) of the Securities Exchange Act of 1934 during the preceding 12 months (or for such shorter period that the registrant was required to file such reports), and (2) has been subject to such filing requirements for the past 90 days. Yes ☒ No ☐
Indicate by check mark whether the registrant has submitted electronically every Interactive Data File required to be submitted pursuant to Rule 405 of Regulation S-T (§232.405 of this chapter) during the preceding 12 months (or for such shorter period that the registrant was required to submit such files). Yes ☒ No ☐
Indicate by check mark whether the registrant is a large accelerated filer, an accelerated filer, a non-accelerated filer, a smaller reporting company or an emerging growth company. See definitions of “large accelerated filer,” “accelerated filer,” “smaller reporting company,” and "emerging growth company" in Rule 12b-2 of the Exchange Act.
| Large Accelerated Filer | ☒ | Accelerated Filer | ☐ | |||||||||||||||||
| Non-Accelerated Filer | ☐ | Smaller Reporting Company | ☐ | |||||||||||||||||
| Emerging Growth Company | ☐ |
If an emerging growth company, indicate by check mark if the registrant has elected not to use the extended transition period for complying with any new or revised financial accounting standards provided pursuant to Section 13(a) of the Exchange Act. ☐
Indicate by check mark whether the registrant has filed a report on and attestation to its management’s assessment of the effectiveness of its internal control over financial reporting under Section 404(b) of the Sarbanes-Oxley Act (15 U.S.C. 7262(b)) by the registered public accounting firm that prepared or issued its audit report. ☒
Indicate by check mark whether the registrant is a shell company (as defined in Rule 12b-2 of the Exchange Act). Yes ☐ No ☒
On April 3, 2021, the aggregate market value of the registrant’s Class A Common Stock, $0.10 par value ("Class A stock"), and Class B Common Stock, $0.10 par value ("Class B stock"), held by non-affiliates of the registrant was $21,593,988,086 and $775,279, respectively. Class B stock is not publicly listed for trade on any exchange or market system. However, Class B stock is convertible into Class A stock on a share-for-share basis, so the market value was calculated based on the market price of Class A stock.
Indicate the number of shares outstanding of each of the issuer’s classes of common stock, as of October 30, 2021.
| Class | Outstanding Shares | |||||||
| Class A Common Stock, $0.10 Par Value ("Class A stock") | 294,770,832 | |||||||
| Class B Common Stock, $0.10 Par Value ("Class B stock") | 70,010,355 |
INCORPORATION BY REFERENCE
Portions of the registrant’s definitive Proxy Statement for the registrant’s Annual Meeting of Shareholders to be held February 10, 2022, are incorporated by reference into Part III of this Annual Report on Form 10-K.
PART I
Item 1. BUSINESS
GENERAL
Tyson Foods, Inc. and its subsidiaries (collectively, the “Company,” “we,” “us,” “our,” “Tyson Foods” or “Tyson”) (NYSE: TSN) is one of the world’s largest food companies and a recognized leader in protein. Founded in 1935 by John W. Tyson and grown under three generations of family leadership, the Company has a broad portfolio of products and brands including Tyson®, Jimmy Dean®, Hillshire Farm®, Ball Park®, Wright®, Aidells®, ibp® and State Fair®. Tyson Foods innovates continually to make protein more sustainable, tailor food for everywhere it’s available and raise the world’s expectations for how much good food can do. Headquartered in Springdale, Arkansas, the Company had approximately 137,000 employees (“team members”) on October 2, 2021. Through our Core Values, Tyson Foods is a company of people engaged in the production of food, seeking to pursue trust and integrity, and committed to creating value for our shareholders, our customers, our team members and our communities. We strive to be honorable and operate with integrity, be faith-friendly and inclusive, serve as stewards of the resources entrusted to us and provide a safe work environment. Some of the key factors influencing our business are customer demand for our products; the ability to maintain and grow relationships with customers and introduce new and innovative products to the marketplace; accessibility of international markets; market prices for our products; the cost and availability of live cattle and hogs, raw materials and feed ingredients; availability of team members to operate our production facilities; and operating efficiencies of our facilities.
We operate a fully vertically-integrated chicken production process with the majority of our production certified as no antibiotic ever (sometimes referred to as “NAE”). Our integrated operations consist of breeding stock, contract farmers, feed production, processing, further-processing, marketing and transportation of chicken and related specialty products, including animal and pet food ingredients. Through our wholly-owned subsidiary, Cobb-Vantress, Inc., we are one of the leading poultry breeding stock suppliers in the world. Investing in breeding stock research and development allows us to breed into our flocks the characteristics found to be most desirable.
We also process live fed cattle and hogs and fabricate dressed beef and pork carcasses into primal and sub-primal meat cuts, case-ready beef and pork and fully-cooked meats. In addition, we derive value from specialty products such as hides and variety meats sold to further processors and others.
We produce a wide range of fresh, value-added, frozen and refrigerated food products. Our products are marketed and sold primarily by our sales staff to grocery retailers, grocery wholesalers, meat distributors, warehouse club stores, military commissaries, industrial food processing companies, chain restaurants or their distributors, live markets, international export companies and domestic distributors who serve restaurants, foodservice operations such as plant and school cafeterias, convenience stores, hospitals and other vendors. Additionally, sales to the military and a portion of sales to international markets are made through independent brokers and trading companies.
As part of our commitment to innovation and growth, we have a subsidiary focused on investing in companies developing breakthrough technologies, business models and products to sustainably feed a growing world population. Tyson New Ventures, LLC is used to broaden our exposure to innovative, new forms of protein and ways of sustainably producing food to complement the Company's continuing investments in innovation in our core Beef, Pork, Chicken and Prepared Foods businesses.
FINANCIAL INFORMATION OF SEGMENTS
We operate in four reportable segments: Beef, Pork, Chicken and Prepared Foods. International/Other primarily includes our foreign operations in Australia, China, Malaysia, Mexico, the Netherlands, South Korea and Thailand, third-party merger and integration costs and corporate overhead related to Tyson New Ventures, LLC. The contribution of each segment to net sales and operating income (loss), and the identifiable assets attributable to each segment, are set forth in Part II, Item 8, Notes to Consolidated Financial Statements, Note 18: Segment Reporting.
DESCRIPTION OF SEGMENTS
Beef
Beef includes our operations related to processing live fed cattle and fabricating dressed beef carcasses into primal and sub-primal meat cuts and case-ready products. Products are marketed domestically to food retailers, foodservice distributors, restaurant operators, hotel chains and noncommercial foodservice establishments such as schools, healthcare facilities, the military and other food processors, as well as to international export markets. This segment also includes sales from specialty products such as hides and variety meats, as well as logistics operations to move products through the supply chain.
Pork
Pork includes our operations related to processing live market hogs and fabricating pork carcasses into primal and sub-primal cuts and case-ready products. Products are marketed domestically to food retailers, foodservice distributors, restaurant operators, hotel chains and noncommercial foodservice establishments such as schools, healthcare facilities, the military and other food processors, as well as to international export markets. This segment also includes our live swine group, related specialty product processing activities and logistics operations to move products through the supply chain.
Chicken
Chicken includes our domestic operations related to raising and processing live chickens into, and purchasing raw materials for fresh, frozen and value-added chicken products, as well as sales from specialty products. Our value-added chicken products primarily include breaded chicken strips, nuggets, patties and other ready-to-fix or fully cooked chicken parts. Products are marketed domestically to food retailers, foodservice distributors, restaurant operators, hotel chains and noncommercial foodservice establishments such as schools, convenience stores, healthcare facilities, the military and other food processors, as well as to international export markets. This segment also includes logistics operations to move products through our domestic supply chain and the global operations of our chicken breeding stock subsidiary.
Prepared Foods
Prepared Foods includes our operations related to manufacturing and marketing frozen and refrigerated food products and logistics operations to move products through the supply chain. This segment includes brands such as Jimmy Dean®, Hillshire Farm®, Ball Park®, Wright®, State Fair®, as well as artisanal brands Aidells® and Gallo Salame®. Products primarily include ready-to-eat sandwiches, sandwich components such as flame-grilled hamburgers and Philly steaks, pepperoni, bacon, breakfast sausage, turkey, lunchmeat, hot dogs, flour and corn tortilla products, appetizers, snacks, prepared meals, ethnic foods, side dishes, meat dishes, breadsticks and processed meats. Products are marketed domestically to food retailers, foodservice distributors, restaurant operators, hotel chains and noncommercial foodservice establishments such as schools, convenience stores, healthcare facilities, the military and other food processors, as well as to international export markets.
RAW MATERIALS AND SOURCES OF SUPPLY
Beef
The primary raw materials used in our beef operations are live cattle. We do not have facilities of our own to raise cattle but employ cattle buyers located throughout cattle producing areas who visit independent feed yards and public auctions to buy live cattle on the open spot market. These buyers are trained to select high quality animals, and we continually measure their performance. We also enter into various risk-sharing and procurement arrangements with producers to secure a supply of livestock for our facilities. Although we generally expect adequate supply of live cattle in the regions we operate, there may be periods of imbalance in supply and demand.
Pork
The primary raw materials used in our pork operations are live hogs. The majority of our live hog supply is obtained through various procurement relationships with independent producers. We employ hog buyers who make purchase agreements of various time durations as well as purchase hogs on a daily basis, generally a few days before the animals are processed. These buyers are trained to select high quality animals, and we continually measure their performance. We believe the supply of live hogs is adequate for our present needs. Additionally, we raise a small number of weanling swine to sell to independent finishers and supply a minimal amount of market hogs and live swine for our own processing needs. Although we generally expect adequate supply of live hogs in the regions we operate, there may be periods of imbalance in supply and demand.
Chicken
The primary raw materials used in our domestic chicken operations are corn and soybean meal used as feed and live chickens raised primarily by independent contract farmers. Our vertically-integrated chicken process begins with the grandparent breeder flocks and ends with broilers for processing. Breeder flocks (i.e., grandparents) are raised to maturity in grandparent growing and laying farms where fertile eggs are produced. Fertile eggs are incubated at the grandparent hatchery and produce pullets (i.e., parents). Pullets are raised to 20 weeks of age, sent to breeder houses, and the resulting eggs are sent to our hatcheries. Once chicks have hatched, they are sent to broiler farms. There, contract farmers care for and raise the chicks according to our standards, with advice from our technical service personnel, until the broilers reach the desired processing weight. Adult chickens are transported to processing facilities where they are harvested and converted into finished products, which are then sent to distribution centers and delivered to customers.
We operate feed mills to produce scientifically-formulated feeds. In fiscal 2021, corn, soybean meal and other feed ingredients were major production costs, representing roughly 59% of our cost of growing a live chicken domestically. In addition to feed ingredients to grow the chickens, we use cooking ingredients, packaging materials and cryogenic agents. We believe our sources of supply for these materials are adequate for our present needs, and we do not anticipate any difficulty in acquiring these materials in the future.
While we produce nearly all our inventory of breeder chickens and live broilers, we also purchase ice-packed or deboned chicken to meet production and sales requirements.
Prepared Foods
The primary raw materials used in our prepared foods operations are commodity-based raw materials, including beef, pork, chicken, turkey, flour, vegetables, cheese, eggs, seasonings and other cooking ingredients. Some of these raw materials are provided by our other segments, while others may be purchased from numerous suppliers and manufacturers. We believe the sources of supply of raw materials are adequate for our present needs.
SEASONAL DEMAND
Demand for beef, chicken and certain prepared foods products, such as hot dogs and smoked sausage, generally increases during the spring and summer months and generally decreases during the winter months. Pork and certain other prepared foods products, such as prepared meals, meat dishes, appetizers and breakfast sausage, generally experience increased demand during the winter months, primarily due to the holiday season, while demand generally decreases during the spring and summer months.
CUSTOMERS
Walmart Inc. accounted for 18.3% of our fiscal 2021 consolidated sales. Sales to Walmart Inc. were included in all of our segments. Any extended discontinuance of sales to this customer could, if not replaced, have a material impact on our operations. No other single customer or customer group represented more than 10% of fiscal 2021 consolidated sales.
COMPETITION
Our food products compete with those of other food producers and processors and certain prepared food manufacturers. Additionally, our food products compete in markets around the world. We seek to achieve a leading market position for our products via our principal marketing and competitive strategy, which includes:
-
identifying target markets for value-added products;
-
concentrating production, sales and marketing efforts to appeal to and enhance demand from those markets; and
-
utilizing our national distribution systems and customer support services.
Past efforts indicate customer demand can be increased and sustained through application of our marketing strategy, as supported by our distribution systems. The principal competitive elements are price, product safety and quality, brand identification, innovation, breadth and depth of product offerings, availability of products, customer service and credit terms.
FOREIGN OPERATIONS
We sold products in approximately 140 countries in fiscal 2021. Major sales markets include Australia, Canada, Central America, Chile, China, the European Union, the United Kingdom, Japan, Mexico, Malaysia, the Middle East, South Korea, Taiwan and Thailand. We have the following foreign operations:
-
Cobb-Vantress, a chicken breeding stock subsidiary, has business interests in Argentina, Brazil, China, Colombia, the Dominican Republic, India, the Netherlands, New Zealand, Peru, the Philippines, Spain, Turkey, and the United Kingdom.
-
Tyson Asia-Pacific, consists of vertically-integrated chicken production operations in Thailand, multi-protein further-processing operations in Malaysia, a beef production operation in Australia, and joint venture interests in two non-consolidated poultry businesses in Malaysia.
-
Tyson China-Korea, with locations in China and South Korea, consists of vertically-integrated chicken production operations, multi-protein further-processing operations, and a joint venture interest in a non-consolidated chicken processing business. Tyson China also sells beef, pork, and prepared foods products imported from Tyson production facilities in the United States and other global operations.
-
Tyson Europe, sells chicken products throughout the United Kingdom and Europe produced from our other global operations and co-packer arrangements, and has a chicken further processing operation in the Netherlands.
-
Vibra Agroindustrial S.A., a joint venture in Brazil in which we have a minority interest, is a vertically-integrated chicken processing business.
-
Godrej Tyson Foods, a joint venture in India in which we have a minority interest, is primarily a chicken processing business.
-
Tyson Mexico Trading Company, a Mexican subsidiary, sells chicken products primarily from our U.S. operations and co-packer arrangements.
We continue to evaluate growth opportunities in foreign locations. Additional information regarding export sales and long-lived assets located in foreign locations is set forth in Part II, Item 8, Notes to Consolidated Financial Statements, Note 18: Segment Reporting.
RESEARCH AND DEVELOPMENT
We conduct continuous research and development activities to improve product development, to automate manual processes in our processing facilities and grow-out operations, and to improve chicken breeding stock. With regards to our domestic food products we have two primary research and development locations, our Discovery Center in Springdale, Arkansas, and an Innovation Center located in Downers Grove, Illinois. The centers include more than 80,000 square feet of United States Department of Agriculture (“USDA”) pilot plant space, two consumer sensory and focus group areas, two packaging labs and 25 research kitchens. The centers enable us to bring new market-leading retail and foodservice products to the customer quickly and efficiently. Additionally, we have a Manufacturing Automation Center in Springdale, Arkansas, designed to grow the development of new manufacturing solutions and to enhance team member training on new technology. Further, we have research and development capabilities located in several international locations where we operate.
ENVIRONMENTAL REGULATION AND FOOD SAFETY
Environmental Regulation
Our facilities for processing beef, pork, chicken, turkey and prepared foods, milling feed and housing live chickens and swine are subject to a variety of international, federal, state and local environmental laws and regulations, which include provisions relating to the discharge of materials into the environment and generally provide for protection of the environment.
We believe we are in substantial compliance with such applicable laws and regulations and are not aware of any violations of such laws and regulations likely to result in material penalties or material increases in compliance costs. The cost of compliance with such laws and regulations has not had a material adverse effect on our capital expenditures, earnings or competitive position, and except as described below, is not anticipated to have a material adverse effect in the future.
Food Safety
We work to ensure our products meet high standards of food safety and quality. In addition to our own internal Food Safety and Quality Assurance oversight and review, our beef, pork, chicken, and prepared foods products are subject to inspection, primarily by the USDA and the United States Food and Drug Administration (“FDA”). We also participate in the USDA's Hazard Analysis and Critical Control Points (“HACCP”) program or FDA's Hazard Analysis and Risk-Based Prevention Controls (“HARPC”) program as applicable and are subject to the Sanitation Standard Operating Procedures and the Public Health Security and Bioterrorism Preparedness and Response Act of 2002. Additionally, our foreign operations are subject to various other food safety and quality assurance oversight and review.
Greenhouse Gas Emissions
Congress, the United States Environmental Protection Agency, some states and non-U.S. governments continue to consider various options to control greenhouse gas emissions. It is unclear at this time what options, if any, will be finalized, and whether such options would have a direct impact on the Company. Although we have not incurred significant costs or capital expenditures, due to continuing uncertainty surrounding this issue it is premature to speculate on the specific nature of impacts that imposition of greenhouse gas emission controls would have on us and whether such impacts would have a material adverse effect.
Tyson closely monitors developments in this area, and voluntarily sets goals to reduce greenhouse gas emissions in accordance with the Science Based Targets initiative (SBTi) criteria. We continue to evaluate the plans and associated costs of achieving our greenhouse gas emission reduction goals.
Sustainability
We have aligned our business priorities with our sustainability strategy by empowering people, conserving natural resources and innovating smart, responsible agriculture. We strive to empower people by being a transparent people-first business that values inclusion and equal opportunity, investing in communities, fighting hunger and empowering our team. We aim to conserve natural resources by conserving water, reducing greenhouse gas emissions, minimizing manufacturing and food waste and designing and using packaging that is reusable, recyclable or compostable. Additionally, we undertake efforts to innovate smart, responsible agriculture by cultivating a food system that prioritizes sustainable agriculture in our global supply chain through land stewardship, animal welfare, education, transparency and traceability.
We have also partnered with World Resources Institute to assess water risk and develop a water stewardship strategy, completed construction of Tyson Foods Center for Sustainable Broiler Research, announced our global forest protection standard following deforestation risk assessment and achieved a 7.7% reduction in water use against a 2015 baseline year. Additionally, we established sustainability governance and oversight through the Governance and Nominating Committee of our Board of Directors. This Committee advises the Board on matters relating to corporate responsibility and sustainability, including environmental, social and governance matters affecting the Company. It also oversees the Company’s key programs and oversees and reviews, at least annually, the Company’s integration of sustainability principles into our business strategy and decision making.
HUMAN CAPITAL MANAGEMENT
Employees and Labor Relations
As of October 2, 2021, we employed approximately 137,000 team members. Approximately 120,000 team members were employed in the United States, of whom approximately 114,000 were employed at production facilities, and approximately 17,000 team members were employed in other countries, primarily in Thailand and China. For fiscal 2021, our domestic workforce experienced a 3% decrease in retention rate from fiscal 2020. Approximately 33,000 team members in the United States were subject to collective bargaining agreements with various labor unions, with approximately 8% of those team members at locations either under negotiation for contract renewal or included under agreements expiring in fiscal 2022. The remaining agreements expire over the next several years. Approximately 5,000 team members in other countries were subject to collective bargaining agreements. We believe our overall relations with our workforce are good.
Health and Safety
We maintain a safety culture grounded on the premise of eliminating workplace incidents, risks and hazards. We created and implemented processes to help eliminate safety events by reducing their frequency and severity. We also review and monitor our safety performance closely. Our goal is to reduce Occupational Safety and Health Administration (“OSHA”) recordable incidents by 10% year over year. During fiscal 2021, our recordable incident rate declined 1% compared to fiscal 2020. As an expansion of our We Care workplace safety program and continued efforts to boost the overall health and wellness of our workforce, we continue to pilot health clinics near our production facilities, giving team members and their families easier access to high-quality healthcare. In response to the global novel coronavirus pandemic (“COVID-19” or “pandemic”) and its related variants, we implemented and continue to implement various safety measures in all of our facilities. To protect our team members, their families and our communities, we require our team members in the U.S. to be fully vaccinated against COVID-19. We also expanded our medical team with the addition of a Chief Medical Officer position and created over 200 nurse and administrative support staff positions to assist our efforts to protect frontline team members during the COVID-19 pandemic while also enhancing our culture of health, safety and wellness. In addition, we partnered with third-party experts to assist in our efforts to educate our U.S. team members about COVID-19 vaccines, provide our U.S. team members, their families and members of their household access to COVID-19 vaccines and case assessment of team members and their families affected by the pandemic.
Diversity, Equity and Inclusion
We embrace the diversity of our team members, customers, stakeholders and consumers, including their unique backgrounds, experiences, perspectives and talents. Everyone is valued and appreciated for their distinct contributions to the growth and sustainability of our business. We strive to cultivate a culture and vision that supports diversity, equity and inclusion in our community and enhances our ability to recruit, develop and retain diverse talent at every level. In fiscal 2021, we appointed our first Chief Equity, Inclusion and Diversity Officer and established a company-wide Diversity, Equity and Inclusion Council. We worked to build a highly engaged team by improving the recruitment, retention and advancement of diverse team members year over year. In fiscal 2021, we reorganized our Business Resource Groups (or “BRGs”) and added three new BRGs: African Ancestry Alliance, Asians & Allies and LatinX. In fiscal 2021, to support organizations working to combat racial hate crimes and protect the civil and human rights of Asian American and Pacific Islanders, we committed to awarding a series of grants to several national non-profit organizations, including Asian Americans Advancing Justice, Asian Americans Advancing Justice–Chicago and the National Association of Asian American Professionals.
Consistent with our commitment to diversity, we implemented a goal to have at least 80% of our candidate slates for domestic team member positions at the director level and above be diverse. In fiscal 2021, we exceeded our goal, with approximately 92% of our candidate slates for such domestic positions diverse as of October 2, 2021. As of October 2, 2021, our domestic workforce identified as approximately 39% gender diverse, approximately 32% white, approximately 28% Hispanic or LatinX, approximately 25% Black or African American, and approximately 10% Asian American and Pacific Islander. In addition, as of October 2, 2021, approximately 31% of our domestic team members in management roles identified as women and approximately 30% identified as ethnically diverse.
Talent and Development
Our talent strategy is focused on attracting the best talent, recognizing and rewarding their performance, while continually developing, engaging and retaining them. We focus on the team member experience, removing barriers to engagement, further modernizing the human relations process, focusing on hourly team member retention and continually improving equity and effectiveness of all talent practices. Consistent with this focus, in fiscal 2021, we conducted our first-ever worldwide engagement survey that included frontline team members for the purpose of evaluating our internal performance and how we compared to other companies in various areas. In addition, through our Upward Academy Program, we offer English as a second language, financial literacy and digital literacy training to all team members. As of October 2, 2021, the program is operating at 44 Company locations. To complement Upward Academy, we have also launched Upward Pathways, a frontline career development program that helps team members further hone professional skills and creates opportunities for our team members to advance to higher-paying, more senior-level positions within the Company through job skills training and workforce certifications at no cost. We have a goal to be the employer of choice within our markets and peer groups and strive to grow and develop the different capabilities and skills that we need for the future, while maintaining a robust pipeline of talent throughout the organization.
MARKETING AND DISTRIBUTION
Our principal marketing objective is to be the preferred provider of beef, pork, chicken and prepared foods products for our customers and consumers. We build the Tyson®, Jimmy Dean®, Hillshire Farm®, Ball Park®, Wright®, Aidells®, ibp® and State Fair® brands while supporting strong regional and emerging brands primarily through distinctive brand and product advertising, promotion, and public relations efforts focused toward key consumer targets with specific needs. We identify growth and business opportunities through consumer and customer insights derived via leading research and analytic capabilities. We utilize our national distribution system and customer support services to achieve the leading market position for our products and brands.
We have the ability to produce and ship fresh, frozen and refrigerated products worldwide. Domestically, our distribution system extends to a broad network of food distributors and is supported by our owned or leased cold storage warehouses, public cold storage facilities and our transportation system. Our distribution centers accumulate fresh and frozen products so we can fill and consolidate partial-truckload orders into full truckloads, thereby decreasing shipping costs while increasing customer service. In addition, we provide our customers a wide selection of products that do not require large volume orders. Our distribution system enables us to supply large or small quantities of products to meet customer requirements anywhere in the continental United States. Internationally, we utilize both rail and truck refrigerated transportation to domestic ports, where consolidations take place to transport to foreign destinations.
PATENTS AND TRADEMARKS
We have filed a number of patent applications relating to our processes and products that either have been granted or are in the process of review. Because we do a significant amount of brand name and product line advertising to promote our products, we consider the protection of our trademarks to be important to our marketing efforts and have registered and applied for the registration of a number of trademarks. We also have developed non-public proprietary information regarding our production processes and other product-related matters. We utilize internal procedures and safeguards to protect the confidentiality of such information and, where appropriate, seek patent and/or other protection for the technology we utilize.
INDUSTRY PRACTICES
Our agreements with customers are generally short-term, primarily due to the nature of our products, industry practices and fluctuations in supply, demand and price for such products. In certain instances where we are selling further processed products to large customers, we may enter into written agreements whereby we will act as the exclusive or preferred supplier to the customer, with pricing terms that are either fixed or variable.
AVAILABILITY OF SEC FILINGS AND CORPORATE GOVERNANCE DOCUMENTS ON INTERNET WEBSITE
We maintain an internet website for investors at http://ir.tyson.com. On this website, we make available, free of charge, annual reports on Form 10-K, quarterly reports on Form 10-Q, current reports on Form 8-K, iXBRL (inline eXtensible Business Reporting Language) reports, and all amendments to any of those reports, as soon as reasonably practicable after we electronically file such reports with, or furnish such reports to, the Securities and Exchange Commission. Also available on the website to review and print for investors are the Corporate Governance Principles, Audit Committee charter, Compensation and Leadership Development Committee charter, Governance and Nominating Committee charter, Strategy and Acquisitions Committee charter, Code of Conduct and Whistleblower Policy, and other corporate governance policies.
CAUTIONARY STATEMENTS RELEVANT TO FORWARD-LOOKING INFORMATION FOR THE PURPOSE OF “SAFE HARBOR” PROVISIONS OF THE PRIVATE SECURITIES LITIGATION REFORM ACT OF 1995
Certain information in this report constitutes forward-looking statements. Such forward-looking statements include, but are not limited to, current views and estimates of our outlook for fiscal 2022, other future economic circumstances, industry conditions in domestic and international markets, our performance and financial results (e.g., debt levels, return on invested capital, value-added product growth, capital expenditures, tax rates, access to foreign markets and dividend policy). These forward-looking statements are subject to a number of factors and uncertainties that could cause our actual results and experiences to differ materially from anticipated results and expectations expressed in such forward-looking statements. We wish to caution readers not to place undue reliance on any forward-looking statements, which speak only as of the date made. We undertake no obligation to update any forward-looking statements, whether as a result of new information, future events or otherwise.
Among the factors that may cause actual results and experiences to differ from anticipated results and expectations expressed in such forward-looking statements are the following: (i) the COVID-19 global pandemic and associated responses thereto have had an adverse impact on our business and operations, and the extent that the COVID-19 pandemic continues to impact us will depend on future developments, which are highly uncertain and cannot be predicted with confidence, including the scope, severity and duration of the pandemic, and public adoption rates of COVID-19 vaccines and their effectiveness against variants of COVID-19, including the Delta variant; (ii) the effectiveness of our financial excellence programs; (iii) access to foreign markets together with foreign economic conditions, including currency fluctuations, import/export restrictions and foreign politics; (iv) cyber incidents, security breaches or other disruptions of our information technology systems; (v) risks associated with our failure to consummate favorable acquisition transactions or integrate certain acquisitions' operations; (vi) the Tyson Limited Partnership’s ability to exercise significant control over the Company; (vii) fluctuations in the cost and availability of inputs and raw materials, such as live cattle, live swine, feed grains (including corn and soybean meal) and energy; (viii) market conditions for finished products, including competition from other global and domestic food processors, supply and pricing of competing products and alternative proteins and demand for alternative proteins; (ix) outbreak of a livestock disease (such as African swine fever (ASF), avian influenza (AI) or bovine spongiform encephalopathy (BSE)), which could have an adverse effect on livestock we own, the availability of livestock we purchase, consumer perception of certain protein products or our ability to access certain domestic and foreign markets; (x) changes in consumer preference and diets and our ability to identify and react to consumer trends; (xi) effectiveness of advertising and marketing programs; (xii) significant marketing plan changes by large customers or loss of one or more large customers; (xiii) our ability to leverage brand value propositions; (xiv) changes in availability and relative costs of labor and contract farmers and our ability to maintain good relationships with team members, labor unions, contract farmers and independent producers providing us livestock; (xv) issues related to food safety, including costs resulting from product recalls, regulatory compliance and any related claims or litigation; (xvi) compliance with and changes to regulations and laws (both domestic and foreign), including changes in accounting standards, tax laws, environmental laws, agricultural laws and occupational, health and safety laws; (xvii) adverse results from litigation; (xviii) risks associated with leverage, including cost increases due to rising interest rates or changes in debt ratings or outlook; (xix) impairment in the carrying value of our goodwill or indefinite life intangible assets; (xx) our participation in a multiemployer pension plan; (xxi) volatility in capital markets or interest rates; (xxii) risks associated with our commodity purchasing activities; (xxiii) the effect of, or changes in, general economic conditions; (xxiv) impacts on our operations caused by factors and forces beyond our control, such as natural disasters, fire, bioterrorism, pandemics or extreme weather; (xxv) failure to maximize or assert our intellectual property rights; (xxvi) effects related to changes in tax rates, valuation of deferred tax assets and liabilities, or tax laws and their interpretation; (xxvii) the effectiveness of our internal control over financial reporting, including identification of material weaknesses; and (xxviii) those factors listed under Item 1A. Risk Factors.
Item 1A. RISK FACTORS
These risks, which should be considered carefully with the information provided elsewhere in this report, could materially adversely affect our business, financial condition or results of operations. Additional risks and uncertainties not currently known to us or that we currently deem to be immaterial also may materially adversely affect our business, financial condition or results of operations.
BUSINESS & OPERATIONAL RISK FACTORS
The outbreak of the COVID-19 global pandemic and associated responses has had, and is expected to continue to have, an adverse impact on our business and operations.
The COVID-19 pandemic has negatively affected many parts of our business and operations. The extent that the COVID-19 pandemic continues to impact general economic conditions and our business, operations and results of operations will depend on future developments, which are highly uncertain and are difficult to predict, including, but not limited to, the duration and spread of the outbreak and additional variants, its severity, the actions to contain the virus or treat its impact, including the distribution and efficacy of vaccines and the speed of critical mass adoption of available vaccines, and how quickly and to what extent normal economic and operating conditions can resume.
We have experienced, and may experience in the future, slowdowns and temporary idling of certain of our production facilities due to a number of COVID-19 related factors, including implementing additional safety measures, testing of our team members, team member absenteeism, and governmental orders. During fiscal 2021, we experienced slowdowns at our production facilities. We anticipate we may experience additional volatility in our ability to operate our facilities at full utilization rates, depending on the factors detailed above. The idling and slowdowns impacted our results of operations for fiscal 2021, and additional or prolonged idling of facilities or an extended period of operating at a reduced capacity or more significant reductions in our operations at our facilities could have a material adverse impact on our ability to operate our business and on our results of operations.
We have experienced, and expect to continue to experience, an increase in operating costs in connection with higher costs associated with ensuring the continued health and safety of team members including regular temperature checks, providing additional personal protective equipment and deep cleaning facilities. During fiscal 2021, we incurred direct incremental expenses related to COVID-19 totaling approximately $335 million, which primarily included team member costs associated with worker health and availability, including direct costs for personal protection equipment, production facility sanitization, COVID-19 testing and vaccinations, donations, product downgrades, rendered product and certain professional fees, partially offset by The Coronavirus Aid, Relief and Economic Security Act (the “CARES Act”) credits. There can be no assurance that the health and safety measures we have taken (which include adding temperature and symptom screening stations for employees prior to entering our facilities, increasing physical distancing of our employees and requiring the vaccination of team members) will eradicate the risks associated with working in a critical infrastructure industry, including but not limited to, infection of our employees or the temporary closure of a facility. Further, there can be no assurance that we will not incur additional direct incremental expenses related to COVID-19 going forward, and that such amounts will not be material or have a material impact on our business, cash flows or results of operations.
Workforce limitations and travel restrictions resulting from COVID-19 and related government actions adversely impacted, and may continue to adversely impact, many aspects of our business. A number of our team members at various facilities have tested positive for COVID-19. These team members, and in some cases those working in close contact with diagnosed persons, are required to be quarantined, which has led to a decrease in our available workforce in various locations. The decrease in our available workforce has at times adversely impacted our ability to operate our business effectively. If a significant percentage of our workforce is unable to work, including because of illness, travel or government restrictions in connection with COVID-19, this could have an adverse effect on our operations and results of operations. In addition, certain of our team members who claim to have tested positive for COVID-19, or their family members, have filed lawsuits seeking compensatory and punitive damages for wrongful death and personal injury claims in several states. We expect additional team members or family members of team members may assert similar claims as the COVID-19 pandemic continues. If we are unsuccessful in defending against such claims, we may experience significant losses and expenses in connection with these lawsuits, which could adversely affect our liquidity, results of operations and financial condition.
We have also experienced, and expect to continue to experience, disruption and volatility in our supply chain, which has resulted, and may continue to result, in increased costs for certain raw materials, packaging materials and transportation costs. The spread of COVID-19 has also disrupted and may continue to disrupt logistics necessary to import, export and deliver products to us and our customers. Ports and other channels of entry have been closed or operating at only a portion of capacity and means of transporting products within regions or countries may be limited for the same reason. Other supply chain risks associated with the COVID-19 pandemic include but are not limited to shutdowns or reduced operations at our suppliers’ facilities, the continued inability of some of our contract producers to manage their livestock, supply chain disruptions for feed grains, changes in consumer orders due to shifting consumer patterns, changes in livestock and protein market prices, and additional disruptions in logistics or the distribution chain for our products ,the occurrence of any of which may result in a reduction in our fill rates to our customers. In addition, our operations, or those of independent contract poultry producers and producers who provide the live animals to our production operations, may become more limited in their ability to procure, deliver, or produce our food products because of transport restrictions related to quarantines or travel bans and the closure of certain of our production facilities.
As a result of the COVID-19 pandemic, each of our segments experienced a shift in demand from foodservice to retail during 2020. While each of our segments has subsequently experienced varying levels of foodservice recovery and the return of volumes during fiscal 2021, the long-term impact of COVID-19 remains uncertain and will depend on a number of future developments which are uncertain and cannot be predicted at this time. In addition, in the event of a protracted period of economic downturn, demand for our foodservice products may remain below expectations or decrease further, and demand for our retail consumption products may also decrease, which could have an adverse impact on our results of operations.
Governmental authorities at the federal, state and local levels may increase or impose new or stricter social distancing directives, stay-at-home restrictions, travel bans, quarantines, workforce and workplace restrictions or other measures related to COVID-19 variants and resurgences, including any variants such as the Delta variant. Such actions could cause us to continue to incur additional costs.
We also face other risks associated with the COVID-19 pandemic, including:
- additional increase in input cost may not be adequately c
Showing the first 8K of 61K characters. Open the full section
Item 1B. UNRESOLVED STAFF COMMENTS
None.
Item 2. PROPERTIES
The following table summarizes our domestic production properties as of October 2, 2021:
| Number of Facilities(1) | |||||||||||||||||||||||||||||
| Owned | Leased | Total | Capacity(2) | Average Capacity Utilization | |||||||||||||||||||||||||
| Beef Segment Production Facilities | 14 | — | 14 | 155,000 head | 78 | % | |||||||||||||||||||||||
| Pork Segment Production Facilities | 7 | — | 7 | 469,000 head | 88 | % | |||||||||||||||||||||||
| Chicken Segment Operation Facilities | 178 | 8 | 186 | 47 million head | 79 | % | |||||||||||||||||||||||
| Prepared Foods Segment Operation Facilities | 34 | — | 34 | 73 million pounds | 79 | % | |||||||||||||||||||||||
(1)Certain facilities produce products that are reported in multiple segments. For presentation purposes, facilities are reflected in the segment that had the majority of the facility’s production. Additionally, livestock grower farms are excluded.
(2)Capacity per week is based on the following: Beef and Pork (six day week) and Chicken and Prepared Foods (five day week). Average capacity utilization is based on capacity available throughout the year.
Beef
Beef facilities include various phases of harvesting live cattle and fabricating beef products and specialty products. We also have various facilities which have rendering operations along with tanneries and hide treatment operations. The Beef segment includes five case-ready operations that share facilities with the Pork segment. One of the beef facilities contains a tallow refinery.
Pork
Pork facilities include various phases of harvesting live hogs and fabricating pork products and specialty products. The Pork segment includes five case-ready operations that share facilities with and are included in the Beef segment in the table above.
Chicken
Our vertically-integrated Chicken operations facilities include processing facilities, rendering facilities, blending mills, feed mills, grain elevators and broiler hatcheries. The Chicken processing facilities include various phases of harvesting, dressing, cutting, packaging, deboning and further-processing. We also have animal nutrition operations, which are associated with the Chicken rendering facilities or within various Chicken processing facilities. The blending mills, feed mills, grain elevators and broiler hatcheries have sufficient capacity to meet the needs of the chicken growout operations. The Chicken segment includes five processing facilities that share facilities with and are included in the Prepared Foods segment in the table above.
Prepared Foods
Our Prepared Foods segment includes processing facilities and a vertically-integrated turkey operation. Our Prepared Foods facilities process fresh and frozen chicken, turkey, beef, pork and other raw materials into ready-to-eat sandwiches, sandwich components such as flame-grilled hamburgers and Philly steaks, pizza toppings, branded and processed meats, appetizers, prepared meals, ethnic foods, flour and corn tortilla products and meat dishes. The Prepared Foods segment includes one processing facility that is shared with and is included in the Chicken segment in the table above.
We own and lease domestic distribution and cold storage facilities that support the supply chains of all our segment operations and are not specifically dedicated to individual segments.
Our International/Other foreign production operations in Asia-Pacific and China-Korea include one beef facility, 20 chicken processing facilities, four feed mills and one broiler hatchery. The processing facilities include various phases of harvesting, dressing, cutting, packaging, deboning and further-processing. We also have a foreign production operation in Europe which includes a chicken further-processing facility.
We believe our present facilities are generally adequate and suitable for our current purposes; however, seasonal fluctuations in inventories and production may occur as a reaction to market demands for certain products. We regularly engage in construction and other capital improvement projects intended to expand capacity and improve the efficiency of our processing and support facilities. We also consider the efficiencies of our operations and may from time to time consider changing the number or type of facilities we operate to align with our capacity needs.
Item 3. LEGAL PROCEEDINGS
Refer to the description of the Broiler Antitrust Civil Litigation, the Wage Rate Litigation and the Broiler Chicken Grower Litigation under the heading “Commitments and Contingencies” in Part II, Item 8, Notes to Consolidated Financial Statements, Note 21: Commitments and Contingencies, which discussion is incorporated herein by reference.
On June 6, 2019, our poultry rendering facility in Hanceville, Alabama, acquired from American Proteins, Inc. in 2018, experienced a release of partially treated wastewater that reached a nearby river and resulted in a fish kill. We took remediation efforts following the release to mitigate the impact. The State of Alabama filed suit against Tyson Farms, Inc. on April 29, 2020 for the June 6, 2019 release, as well as a prior release. Related civil suits have also been filed, which include individual and collective claims for compensatory and punitive damages against us and other defendants for alleged contamination of the local water supply, personal injury, property damage, diminution in property values, loss of recreational waterway use, lost non-profit revenue and business damages. Certain plaintiffs also allege that the facility’s historical and ongoing operations constitute a nuisance under Alabama law and are also seeking injunctive relief. On August 13, 2021, the court approved a settlement of all claims with the State of Alabama related to this action on terms not material to the Company. While we do not admit any liability as part of the settlement, we believe that the settlement was in the best interests of the Company and its shareholders to avoid the uncertainty, risk, expense and distraction of protracted litigation.
On December 19, 2019, a putative class of direct purchasers filed a class action against us, other turkey suppliers, and Agri Stats, Inc. in the United States District Court for the Northern District of Illinois. The plaintiffs allege, among other things, that the defendants entered into an agreement to exchange competitively sensitive information regarding turkey supply, production and pricing plans, all with the intent to artificially inflate the price of turkey, in violation of the Sherman Act. Plaintiffs are seeking treble damages, pre- and post-judgment interest, costs and attorneys’ fees on behalf of the putative class. On April 13, 2020, a similar complaint was filed in the United States District Court for the Northern District of Illinois on behalf of a putative class of indirect purchasers of turkey alleging claims based on the Sherman Act and various state law causes of action. The plaintiffs are seeking treble damages, pre- and post-judgment interest, costs, and attorneys' fees on behalf of the putative class. Since the original filing, certain putative class members have opted out of the matter and are proceeding with individual direct actions making similar claims, and others may do so in the future. In April 2021, we reached agreement to settle all claims with the putative direct purchaser class for $4.625 million and with the putative commercial and institutional indirect purchaser class for $1.75 million. On May 25, 2021, the Court granted preliminary approval of the settlement with the putative direct purchaser class, and the final fairness hearing is scheduled for January 6, 2022. On July 26, 2021, the court granted preliminary approval of the settlement with the putative commercial and institutional indirect purchaser class, and the final approval hearing is expected to be held in early 2022. While we do not admit any liability as part of the settlements, we believe that the settlements were in the best interests of the Company and its shareholders to avoid the uncertainty, risk, expense and distraction of protracted litigation.
On June 19, 2005, the Attorney General and the Secretary of the Environment of the State of Oklahoma filed a complaint in the United States District Court for the Northern District of Oklahoma against Tyson Foods, Inc., three subsidiaries and six other poultry integrators. The complaint, which was subsequently amended, asserts a number of state and federal causes of action including, but not limited to, counts under the Comprehensive Environmental Response, Compensation, and Liability Act, Resource Conservation and Recovery Act, and state-law public nuisance theories. Oklahoma alleges that the defendants and certain contract growers who were not joined in the lawsuit polluted the surface waters, groundwater and associated drinking water supplies of the Illinois River Watershed through the land application of poultry litter. Oklahoma’s claims were narrowed through various rulings issued before and during trial and its claims for natural resource damages were dismissed by the district court in a ruling issued on July 22, 2009, which was subsequently affirmed on appeal by the Tenth Circuit Court of Appeals. A non-jury trial of the remaining claims including Oklahoma’s request for injunctive relief began on September 24, 2009. Closing arguments were held on February 11, 2010. The district court has not yet rendered its decision from the trial.
Other Matters
As of October 2, 2021, we had approximately 137,000 team members and, at any time, have various employment practices matters outstanding. In the aggregate, these matters are important to the Company, and we devote considerable resources to managing employment issues. Additionally, we are subject to other lawsuits, investigations and claims (some of which involve substantial amounts) arising out of the conduct of our business. While the ultimate results of these matters cannot be determined, they are not expected to have a material adverse effect on our consolidated results of operations or financial position.
Item 4. MINE SAFETY DISCLOSURES
Not applicable.
INFORMATION ABOUT OUR EXECUTIVE OFFICERS
Each of our executive officers serve one-year terms from the date of their election, or until their successors are appointed and qualified. Chairman of the Board of Directors John Tyson is the father of Chief Sustainability Officer John R. Tyson and nephew of Director Barbara A. Tyson. No other family relationships exist among these officers. The name, title, age (as of October 2, 2021) and calendar year of initial election to executive office of our executive officers are listed below:
| Name | Title | Age | Year Elected Executive Officer | |||||||||||||||||
| John H. Tyson | Chairman of the Board of Directors | 68 | 2011 | |||||||||||||||||
| David Bray | Group President Poultry | 52 | 2021 | |||||||||||||||||
| Stewart Glendinning | Executive Vice President and Chief Financial Officer | 56 | 2017 | |||||||||||||||||
| Donnie King | President and Chief Executive Officer | 59 | 2019 | |||||||||||||||||
| Chris Langholz | Group President International | 58 | 2020 | |||||||||||||||||
| Shane Miller | Group President Fresh Meats | 52 | 2021 | |||||||||||||||||
| Jason Nichol | Chief Customer Officer | 49 | 2021 | |||||||||||||||||
| Noelle O'Mara | Group President Prepared Foods | 42 | 2019 | |||||||||||||||||
| Johanna Söderström | Executive Vice President and Chief People Officer | 50 | 2020 | |||||||||||||||||
| Scott Spradley | Executive Vice President and Chief Technology and Automation Officer | 56 | 2017 | |||||||||||||||||
| Phillip Thomas | Vice President, Controller and Chief Accounting Officer | 46 | 2020 | |||||||||||||||||
| Amy Tu | Executive Vice President, Chief Legal Officer and Secretary, Global Governance and Corporate Affairs | 54 | 2017 | |||||||||||||||||
| John R. Tyson | Executive Vice President, Strategy and Chief Sustainability Officer | 31 | 2019 |
John H. Tyson has served as Chairman of the Board of Directors since 1998 and was previously Chief Executive Officer of the Company from 2000 until 2006. Mr. Tyson was initially employed by the Company in 1973.
David Bray was appointed Group President Poultry in June 2021 after serving as Senior Vice President, Retail Poultry and Case Ready Meats since August 2020 and as Senior Vice President, Grocery from April 2017 to July 2020. Mr. Bray previously served as Vice President, Grocery Sales from September 2014 to April 2017 and as Vice President, Consumer Product Customer Development from March 2011 to September 2014. Mr. Bray was employed at Kraft Foods Group prior to joining the Company.
Stewart Glendinning was appointed Executive Vice President and Chief Financial Officer in February 2018 after serving as Executive Vice President since his initial employment by the Company in December 2017. Mr. Glendinning was employed at Molson Coors Brewing Company prior to joining the Company.
Donnie King was appointed President and Chief Executive Officer in June 2021 after serving as Chief Operating Officer since February 2021 and Group President Poultry since September 2020. Mr. King served as Group President, International and Chief Administration Officer from February 2019 to September 2020 in addition to the role of Group President, International from January 2019 to February 2020. Mr. King previously served as President, North American Operations from 2015 to 2016 and President, North American Operations and Foodservice in 2014. Mr. King was initially employed by Valmac Industries in 1982. Valmac Industries was acquired by the Company in 1984. Mr. King was self-employed from 2016 to February 2019 before returning to the Company.
Chris Langholz was appointed Group President, International in October 2021 after serving as President, International since February 2020. Mr. Langholz was President of Cargill Asia Pacific and President of International Protein prior to joining the Company.
Shane Miller was appointed Group President, Fresh Meats in February 2021 after serving as Chief Operating Officer, Fresh Meats since October 2020. Mr. Miller previously served as Senior Vice President and General Manager, Beef Enterprise from January 2019 to October 2020, Senior Vice President, General Manager, Value Added & Case Ready from February 2018 to January 2019, Senior Vice President, Pork from July 2015 to February 2018 and Senior Vice President, Pork Margin Management from May 2013 to July 2015. Mr. Miller has held numerous other management and leadership roles since joining the Company in 2002.
Jason Nichol was appointed Chief Customer Officer in February 2021 after serving as Senior Vice President, Walmart since March 2016 and as Vice President, Walmart from his initial employment by the Company in April 2015 to February 2016. Mr. Nichol was employed by Nabisco, Cott Beverages and Scotts Miracle-Gro prior to joining the Company.
Noelle O'Mara was appointed Group President, Prepared Foods in August 2019 after serving as Chief Marketing Officer since April 2019, having previously served as General Manager and Senior Vice President, Tyson Brands Deli and Innovation since 2018, Senior Vice President and General Manager Jimmy Dean Brands since 2017 and Vice President, Emerging Brands Innovation since joining the company in 2016. Ms. O'Mara was employed at Kraft Foods Group prior to joining the Company.
Johanna Söderström was appointed Executive Vice President and Chief People Officer in October 2021 after serving as Executive Vice President and Chief Human Resources Officer since July 2020. Ms. Söderström was employed by Dow Chemical Company prior to joining the Company.
Scott Spradley was appointed Executive Vice President and Chief Technology and Automation Officer in October 2021 after serving as Executive Vice President and Chief Technology Officer since 2017. Mr. Spradley was employed by Hewlett Packard Enterprise prior to joining the Company.
Phillip Thomas was appointed Vice President, Controller and Chief Accounting Officer in July 2020 after serving as Vice President and Assistant Controller since March 2014, prior to which he served as Senior Director Financial Reporting since his initial employment with the Company in July 2008.
Amy Tu was appointed Executive Vice President and Chief Legal Officer and Secretary, Global Governance and Corporate Affairs in October 2021 after serving as Executive Vice President, General Counsel and Secretary since November 2020 and Executive Vice President and General Counsel since December 2017. Ms. Tu was employed by The Boeing Company prior to joining the Company.
John R. Tyson was appointed Executive Vice President, Strategy and Chief Sustainability Officer in October 2021 after serving as Chief Sustainability Officer since September 2019, and Director, Office of the Chief Executive Officer since May 2019. Mr. Tyson has been an observer at the Company’s board of directors’ meetings since 2014. He was employed by J.P. Morgan as a private equity and venture capital investor prior to joining the Company.
PART II
Item 5. MARKET FOR REGISTRANT’S COMMON EQUITY, RELATED STOCKHOLDER MATTERS AND ISSUER PURCHASES OF EQUITY SECURITIES
We have issued and outstanding two classes of capital stock, Class A stock and Class B stock. Holders of Class B stock may convert such stock into Class A stock on a share-for-share basis. Holders of Class B stock are entitled to 10 votes per share and holders of Class A stock are entitled to one vote per share on matters submitted to shareholders for approval. As of October 30, 2021, there were approximately 23,000 holders of record of our Class A stock and six holders of record of our Class B stock.
DIVIDENDS
Cash dividends cannot be paid to holders of Class B stock unless they are simultaneously paid to holders of Class A stock. The per share amount of the cash dividend paid to holders of Class B stock cannot exceed 90% of the cash dividend simultaneously paid to holders of Class A stock. In fiscal 2021, the annual dividend rate for Class A stock was $1.78 per share and the annual dividend rate for Class B stock was $1.60 per share. Effective November 12, 2021, the Board of Directors increased the quarterly dividend previously declared on August 12, 2021, to $0.46 per share on our Class A common stock and $0.414 per share on our Class B common stock. The increased quarterly dividend is payable on December 15, 2021, to shareholders of record at the close of business on December 1, 2021. The Board also declared a quarterly dividend of $0.46 per share on our Class A common stock and $0.414 per share on our Class B common stock, payable on March 15, 2022, to shareholders of record at the close of business on March 1, 2022. We anticipate the remaining quarterly dividends in fiscal 2022 will be $0.46 and $0.414 per share of our Class A and Class B stock, respectively. This results in an annual dividend rate in fiscal 2022 of $1.84 for Class A shares and $1.656 for Class B shares, or a 3% increase compared to the fiscal 2021 annual dividend rate. We have paid uninterrupted quarterly dividends on common stock each year since 1977.
MARKET INFORMATION
Our Class A stock is traded on the New York Stock Exchange under the symbol “TSN.” No public trading market currently exists for our Class B stock.
ISSUER PURCHASES OF EQUITY SECURITIES
The table below provides information regarding our purchases of Class A stock during the periods indicated.
| Period | Total Number of Shares Purchased (2) | Average Price Paid per Share | Total Number of Shares Purchased as Part of Publicly Announced Plans or Programs (3) | Maximum Number of Shares that May Yet Be Purchased Under the Plans or Programs (1) | ||||||||||||||||
| Jul. 4, 2021 to Jul. 31, 2021 | 49,469 | $ | 72.62 | — | 18,851,028 | |||||||||||||||
| Aug. 1, 2021 to Sept. 4, 2021 | 135,762 | 78.42 | — | 18,851,028 | ||||||||||||||||
| Sept. 5, 2021 to Oct. 2, 2021 | 30,720 | 76.43 | — | 18,851,028 | ||||||||||||||||
| Total | 215,951 | $ | 76.81 | — | 18,851,028 |
(1)On February 7, 2003, our Board of Directors approved a program to repurchase up to 25 million shares of Class A common stock from time to time in open market or privately negotiated transactions. On May 3, 2012, our Board of Directors approved an increase of 35 million shares, on January 30, 2014, our Board of Directors approved an increase of 25 million shares and on February 4, 2016, our Board of Directors approved an increase of 50 million shares under the program. The program has no fixed or scheduled termination date.
(2)We purchased 215,951 shares during the period that were not made pursuant to our previously announced stock repurchase program but were purchased to fund certain Company obligations under our equity compensation plans. These transactions included 209,579 shares purchased in open market transactions and 6,372 shares withheld to cover required tax withholdings on the vesting of restricted stock.
(3)Shares purchased during the period pursuant to our previously announced stock repurchase program.
PERFORMANCE GRAPH
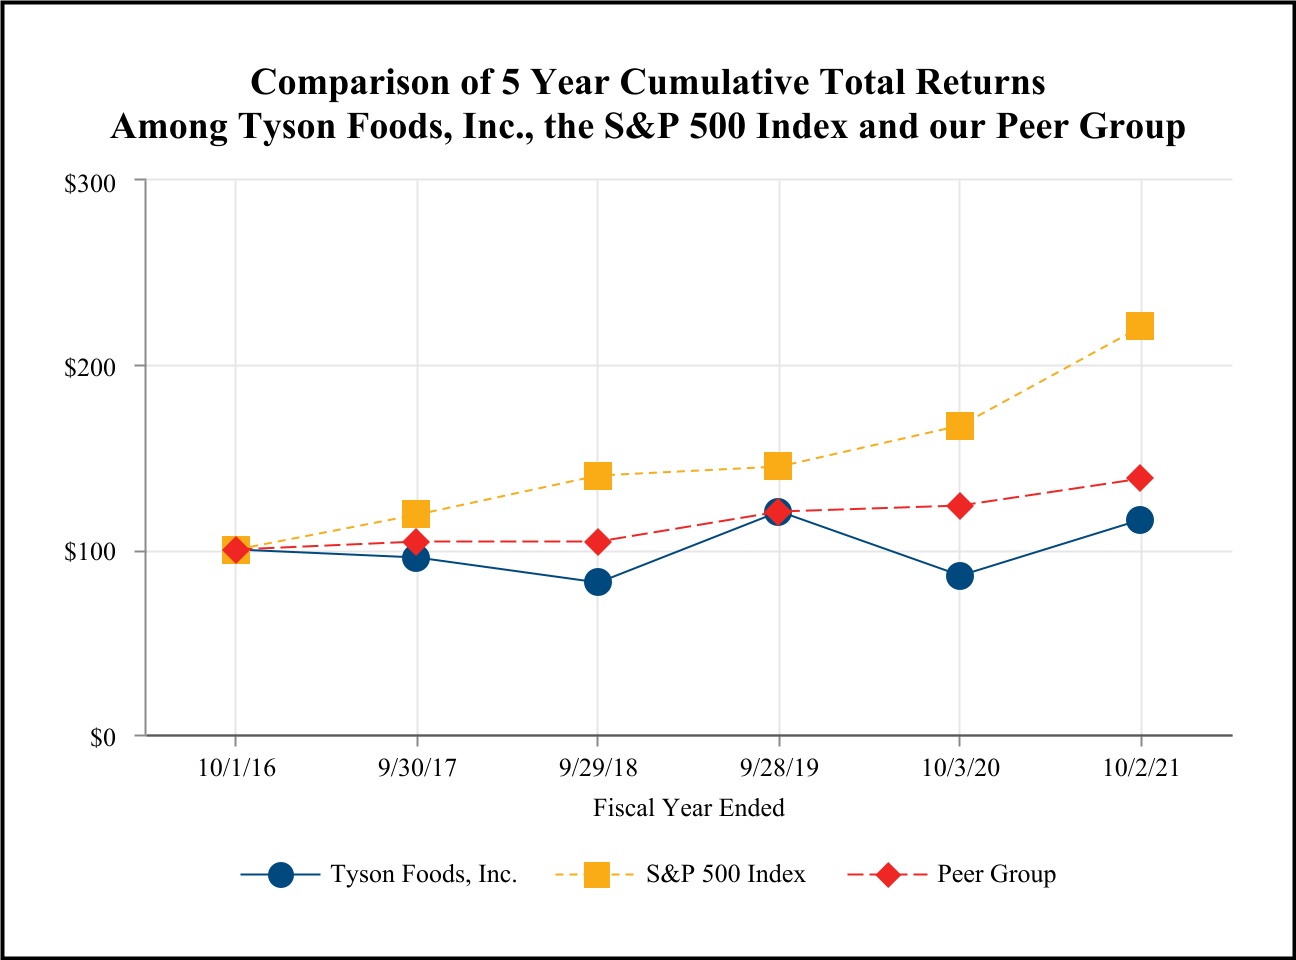
The following graph shows a five-year comparison of cumulative total returns for our Class A stock, the Standard & Poor’s ("S&P") 500 Index and our peer group of companies described below.
| Fiscal Years Ended | |||||||||||||||||||||||||||||||||||||||||
| 10/1/16 | 9/30/17 | 9/29/18 | 9/28/19 | 10/3/20 | 10/2/21 | ||||||||||||||||||||||||||||||||||||
| Tyson Foods, Inc. | $ | 100.00 | $ | 95.76 | $ | 82.30 | $ | 120.34 | $ | 85.83 | $ | 116.14 | |||||||||||||||||||||||||||||
| S&P 500 Index | 100.00 | 118.62 | 139.85 | 144.25 | 166.22 | 219.48 | |||||||||||||||||||||||||||||||||||
| Peer Group | 100.00 | 99.69 | 101.00 | 118.35 | 121.64 | 136.07 |
The total cumulative return on investment (change in the year-end stock price plus reinvested dividends), which is based on the stock price or composite index at the end of fiscal 2016, is presented for each of the periods for the Company, the S&P 500 Index and our peer group. The complete list of our peer group includes: Archer-Daniels-Midland Company, Bunge Limited, Campbell Soup Company, ConAgra Foods, Inc., General Mills, Inc., Hormel Foods Corp., Kellogg Co., Kraft Heinz Company, Mondelez International Inc., PepsiCo, Inc., Pilgrim's Pride Corporation, The Coca-Cola Company, The Hershey Company and The J.M. Smucker Company. The graph compares the performance of the Company's Class A common stock with that of the S&P 500 Index and our peer group, with the return of each company in the peer group weighted on market capitalization. The stock price performance of the Company's Class A common stock shown in the above graph is not necessarily indicative of future stock price performance.
The information in this "Performance Graph" section shall not be deemed to be "soliciting material" or to be "filed" with the Securities and Exchange Commission or subject to Regulation 14A or 14C, or to the liabilities of Section 18 of the Securities Exchange Act of 1934.
Item 6. SELECTED FINANCIAL DATA
Not applicable.
Item 7. MANAGEMENT’S DISCUSSION AND ANALYSIS OF FINANCIAL CONDITION AND RESULTS OF OPERATIONS
OBJECTIVE
The following discussion provides an analysis of the Company’s financial condition, cash flows and results of operations from management's perspective and should be read in conjunction with the consolidated financial statements and notes thereto included in Part II, Item 8 of this Annual Report on Form 10-K. Our objective is to also provide discussion of events and uncertainties known to management that are reasonably likely to cause reported financial information not to be indicative of future operating results or of future financial condition and to offer information that provides understanding of our financial condition, cash flows and results of operations.
DESCRIPTION OF THE COMPANY
We are one of the world’s largest food companies and a recognized leader in protein. Founded in 1935 by John W. Tyson and grown under three generations of family leadership, the Company has a broad portfolio of products and brands including Tyson®, Jimmy Dean®, Hillshire Farm®, Ball Park®, Wright®, Aidells®, ibp® and State Fair®.
We operate in four reportable segments: Beef, Pork, Chicken and Prepared Foods. International/Other primarily includes our foreign operations in Australia, China, Malaysia, Mexico, the Netherlands, South Korea and Thailand, third-party merger and integration costs and corporate overhead related to Tyson New Ventures, LLC. For further description of the business, refer to Part I, Item 1, Business.
OVERVIEW
COVID-19
We continue to monitor and respond to the evolving nature of the COVID-19 pandemic and its impact to our global business. In addition to our ongoing internal COVID-19 task force formed for the primary purposes of maintaining the health and safety of our team members, ensuring our ability to operate our processing facilities and maintaining the liquidity of our business, we have expanded our medical team with the addition of a Chief Medical Officer during fiscal 2021. We have experienced and continue to experience multiple challenges related to the pandemic. These challenges increased our operating costs during fiscal 2020 and fiscal 2021. Operationally, we experienced slowdowns and temporary idling of production facilities due to team member absenteeism and choices we made to ensure team member health and safety. Each of our segments experienced a shift in demand from foodservice to retail during 2020 and have seen varying levels of foodservice recovery and the return of volumes during fiscal 2021. The long-term impact of COVID-19 remains uncertain and will depend on future developments, including the duration and spread of the pandemic, COVID-19 variants and resurgences, and related actions taken by federal, state and local government officials to prevent and manage disease spread, all of which are uncertain and cannot be predicted. Additionally, we continue to assess the potential of more permanent impacts to our businesses.
Team Members
The health and safety of our team members is our top priority. To protect our team members, we implement safety measures recommended by the Centers for Disease Control and Prevention (“CDC”) and the Occupational Safety and Health Administration (“OSHA”) in our facilities and coordinate with other health officials as appropriate. In addition to hiring a Chief Medical Officer, we have added 200 nurse and administrative support staff positions and developed an “always-on” testing strategy rooted in contact tracing. In August 2021, we announced all domestic team members were required to be fully vaccinated by November 1, 2021.
Customers and Production
Our most significant impacts from COVID-19 relate to channel shifts and lower production. We are committed to doing our best to ensure the continuity of our business and the availability of our products to customers. Our production capabilities, including our large scale and geographic proximities, allow us to adapt some of our facilities to the changing demand. In addition, our production facilities experienced varying levels of production impacts, including reduced volumes, due to the implementation of additional worker health precautions and worker absenteeism.
Supply Chain
Our supply chain has stayed largely intact as we have built contingency plans for redundant supply for our production facilities as well as our external suppliers. We have been able to leverage our extensive distribution network and large private transportation fleet to help mitigate the impacts of COVID-19. We have experienced and expect to continue to experience volatility in commodity inputs, which has impacted our input costs, in part due to impacts caused by COVID-19. Since we also export globally, container availability and port capacities have been among the challenges in meeting the global demand for our products.
Insurance and CARES Act
Although we maintain insurance policies for various risks, we do not believe most COVID-19 impacts will be covered by our policies. The Coronavirus Aid, Relief and Economic Security Act (the “CARES Act”), among other things, includes provisions relating to refundable payroll tax credits, deferral of the employer portion of social security payments, and a number of income tax provisions. The provisions related to income tax will not have a significant impact on our financial statements.
Overall Financial Condition
We continue to proactively manage the Company and its operations through the pandemic. The major challenge we face is the availability of team members to operate our production facilities due to our production facilities experiencing varying levels of absenteeism and due to labor shortages associated with the economic impact of the pandemic. We will continue to operate our production facilities with team member health and safety as a top priority. However, we cannot predict the ultimate impact that COVID-19 will have on our short- and long-term demand at this time, as it will depend on, among other things, the severity and duration of the COVID-19 pandemic. We generated $3.8 billion of operating cash flows during fiscal 2021. At October 2, 2021, we had $4.8 billion of liquidity, which included availability under our revolving credit facility and $2.5 billion of cash and cash equivalents. We have $1.1 billion of current debt. Combined with the cash expected to be generated from the Company’s operations, we anticipate that we will maintain sufficient liquidity to operate our business, make capital expenditures, pay dividends and address other needs including our ability to meet maturing debt obligations.
Fiscal year
Our accounting cycle resulted in a 52-week year for both fiscal 2021 and 2019 and a 53-week year for fiscal 2020.
General
Sales grew 9% in fiscal 2021 over fiscal 2020 to $47.0 billion, primarily due to increased average sales prices in each of our segments, partially offset by the impact of an additional week in fiscal 2020. Fiscal 2021 operating income increased compared to fiscal 2020, as strong Beef results and the gain on the sale of our pet treats business were partially offset by a decline in operating income in the Chicken and Pork segments. In fiscal 2021, our results were impacted by $626 million of charges related to legal contingency accruals, $27 million of charges related to the relocation of a production facility in China, $17 million of production facilities fire costs, net of insurance proceeds and a $784 million gain on the sale of our pet treats business. In fiscal 2020, our results were impacted by $77 million of restructuring and related charges offset by the positive impact of the additional week.
During fiscal 2021, we incurred direct incremental expenses related to COVID-19 totaling approximately $335 million, which were recorded in Cost of Sales in our Consolidated Statements of Income. During fiscal 2020, we incurred direct incremental expenses related to COVID-19 totaling approximately $540 million, of which approxima
Showing the first 8K of 100K characters. Open the full section
Item 7A. QUANTITATIVE AND QUALITATIVE DISCLOSURES ABOUT MARKET RISK
Market risk relating to our operations results primarily from changes in commodity prices, interest rates and foreign exchange rates, as well as credit risk concentrations. To address certain of these risks, we enter into various derivative transactions as described below. If a derivative instrument is accounted for as a hedge, depending on the nature of the hedge, changes in the fair value of the instrument either will be offset against the change in fair value of the hedged assets, liabilities or firm commitments through earnings, or be recognized in Other Comprehensive Income (Loss) until the hedged item is recognized in earnings. The ineffective portion of an instrument’s change in fair value is recognized immediately.
Further, we hold certain positions, primarily in grain and livestock futures that either do not meet the criteria for hedge accounting or are not designated as hedges. With the exception of normal purchases and normal sales that are expected to result in physical delivery, we record these positions at fair value, and the unrealized gains and losses are reported in earnings at each reporting date.
The sensitivity analyses presented below are the measures of potential losses of fair value resulting from hypothetical changes in market prices related to commodities. Sensitivity analyses do not consider the actions we may take to mitigate our exposure to changes, nor do they consider the effects such hypothetical adverse changes may have on overall economic activity. Actual changes in market prices may differ from hypothetical changes.
COMMODITIES RISK
We purchase certain commodities, such as grains and livestock in the course of normal operations. As part of our commodity risk management activities, we use derivative financial instruments, primarily forwards and options, to reduce the effect of changing prices and as a mechanism to procure the underlying commodity. However, as the commodities underlying our derivative financial instruments can experience significant price fluctuations, any requirement to mark-to-market the positions that have not been designated or do not qualify as hedges could result in volatility in our results of operations. Contract terms of a hedge instrument closely mirror those of the hedged item providing a high degree of risk reduction and correlation. Contracts designated and highly effective at meeting this risk reduction and correlation criteria are recorded using hedge accounting. We generally do not hedge
anticipated transactions beyond 18 months. The following table presents a sensitivity analysis resulting from a hypothetical change of 10% in market prices as of October 2, 2021 and October 3, 2020, on the fair value of open positions. The fair value of such positions is a summation of the fair values calculated for each commodity by valuing each net position at quoted forward and option prices. The market risk exposure analysis included both derivatives designated as hedge instruments and derivatives not designated as hedge instruments.
| Effect of 10% change in fair value | in millions | ||||||||||
| 2021 | 2020 | ||||||||||
| Livestock: | |||||||||||
| Live Cattle | $ | 42 | $ | 24 | |||||||
| Lean Hogs | 38 | 19 | |||||||||
| Grain: | |||||||||||
| Corn | 24 | 23 | |||||||||
| Soybean Meal | 26 | 28 |
INTEREST RATE RISK
At October 2, 2021, we had variable rate debt of $11 million with a weighted average interest rate of 3.0%. A hypothetical 10% increase in interest rates effective at October 2, 2021, and October 3, 2020, would have a minimal effect on interest expense.
Additionally, changes in interest rates impact the fair value of our fixed-rate debt. At October 2, 2021, we had fixed-rate debt of $9,337 million with a weighted average interest rate of 4.49%. Market risk for fixed-rate debt is estimated as the potential increase in fair value, resulting from a hypothetical 10% decrease in interest rates. A hypothetical 10% decrease in interest rates would have increased the fair value of our fixed-rate debt by approximately $154 million at October 2, 2021, and $108 million at October 3, 2020. The fair values of our debt were estimated based on quoted market prices and/or published interest rates.
We are subject to interest rate risk associated with our pension and post-retirement benefit obligations. Changes in interest rates impact the liabilities associated with these benefit plans as well as the amount of income or expense recognized for these plans. Declines in the value of the plan assets could diminish the funded status of the pension plans and potentially increase the requirements to make cash contributions to these plans. See Part II, Item 8, Notes to Consolidated Financial Statements, Note 16: Pensions and Other Postretirement Benefits for additional information.
FOREIGN CURRENCY RISK
We have foreign exchange exposure from fluctuations in foreign currency exchange rates primarily as a result of certain receivable and payable balances. The primary currencies we have exposure to are the Australian dollar, the Brazilian real, the British pound sterling, the Canadian dollar, the Chinese renminbi, the European euro, the Malaysian ringgit, the Mexican peso, and the Thai baht. We periodically enter into foreign exchange forward and option contracts to hedge some portion of our foreign currency exposure. A hypothetical 10% change in foreign exchange rates related to the foreign exchange forward and option contracts would have had a $13 million and $54 million impact on pretax income at October 2, 2021 and October 3, 2020, respectively.
CONCENTRATIONS OF CREDIT RISK
Our financial instruments exposed to concentrations of credit risk consist primarily of cash equivalents and trade receivables. Our cash equivalents are in high quality securities placed with major banks and financial institutions. Concentrations of credit risk with respect to receivables are limited due to our large number of customers and their dispersion across geographic areas. We perform periodic credit evaluations of our customers’ financial condition and generally do not require collateral. At October 2, 2021 and October 3, 2020, 16.3% and 16.5%, respectively, of our net accounts receivable balance was due from Walmart Inc. No other single customer or customer group represented 10% or greater of net accounts receivable.
Item 8. FINANCIAL STATEMENTS AND SUPPLEMENTARY DATA
TYSON FOODS, INC.
CONSOLIDATED STATEMENTS OF INCOME
| Three years ended October 2, 2021 | |||||||||||||||||
| in millions, except per share data | |||||||||||||||||
| 2021 | 2020 | 2019 | |||||||||||||||
| Sales | $ | 47,049 | $ | 43,185 | $ | 42,405 | |||||||||||
| Cost of Sales | 40,523 | 37,801 | 37,383 | ||||||||||||||
| Gross Profit | 6,526 | 5,384 | 5,022 | ||||||||||||||
| Selling, General and Administrative | 2,130 | 2,376 | 2,252 | ||||||||||||||
| Operating Income | 4,396 | 3,008 | 2,770 | ||||||||||||||
| Other (Income) Expense: | |||||||||||||||||
| Interest income | (8) | (10) | (11) | ||||||||||||||
| Interest expense | 428 | 485 | 462 | ||||||||||||||
| Other, net | (65) | (131) | (55) | ||||||||||||||
| Total Other (Income) Expense | 355 | 344 | 396 | ||||||||||||||
| Income before Income Taxes | 4,041 | 2,664 | 2,374 | ||||||||||||||
| Income Tax Expense | 981 | 593 | 381 | ||||||||||||||
| Net Income | 3,060 | 2,071 | 1,993 | ||||||||||||||
| Less: Net Income Attributable to Noncontrolling Interests | 13 | 10 | 13 | ||||||||||||||
| Net Income Attributable to Tyson | $ | 3,047 | $ | 2,061 | $ | 1,980 | |||||||||||
| Weighted Average Shares Outstanding: | |||||||||||||||||
| Class A Basic | 293 | 293 | 293 | ||||||||||||||
| Class B Basic | 70 | 70 | 70 | ||||||||||||||
| Diluted | 365 | 365 | 366 | ||||||||||||||
| Net Income Per Share Attributable to Tyson: | |||||||||||||||||
| Class A Basic | $ | 8.57 | $ | 5.79 | $ | 5.56 | |||||||||||
| Class B Basic | $ | 7.70 | $ | 5.21 | $ | 4.99 | |||||||||||
| Diluted | $ | 8.34 | $ | 5.64 | $ | 5.40 |
See accompanying Notes to Consolidated Financial Statements.
TYSON FOODS, INC.
CONSOLIDATED STATEMENTS OF COMPREHENSIVE INCOME
| Three years ended October 2, 2021 | |||||||||||||||||
| in millions | |||||||||||||||||
| 2021 | 2020 | 2019 | |||||||||||||||
| Net Income | $ | 3,060 | $ | 2,071 | $ | 1,993 | |||||||||||
| Other Comprehensive Income (Loss), Net of Taxes: | |||||||||||||||||
| Derivatives accounted for as cash flow hedges | 2 | 9 | (15) | ||||||||||||||
| Investments | (1) | 1 | 2 | ||||||||||||||
| Currency translation | 17 | (29) | (23) | ||||||||||||||
| Postretirement benefits | (11) | (43) | (66) | ||||||||||||||
| Total Other Comprehensive Income (Loss), Net of Taxes | 7 | (62) | (102) | ||||||||||||||
| Comprehensive Income | 3,067 | 2,009 | 1,891 | ||||||||||||||
| Less: Comprehensive Income Attributable to Noncontrolling Interests | 13 | 10 | 13 | ||||||||||||||
| Comprehensive Income Attributable to Tyson | $ | 3,054 | $ | 1,999 | $ | 1,878 |
See accompanying Notes to Consolidated Financial Statements.
TYSON FOODS, INC.
CONSOLIDATED BALANCE SHEETS
| October 2, 2021, and October 3, 2020 | |||||||||||
| in millions, except share and per share data | |||||||||||
| 2021 | 2020 | ||||||||||
| Assets | |||||||||||
| Current Assets: | |||||||||||
| Cash and cash equivalents | $ | 2,507 | $ | 1,420 | |||||||
| Accounts receivable, net | 2,400 | 1,952 | |||||||||
| Inventories | 4,382 | 3,859 | |||||||||
| Other current assets | 533 | 367 | |||||||||
| Total Current Assets | 9,822 | 7,598 | |||||||||
| Net Property, Plant and Equipment | 7,837 | 7,596 | |||||||||
| Goodwill | 10,549 | 10,899 | |||||||||
| Intangible Assets, net | 6,519 | 6,774 | |||||||||
| Other Assets | 1,582 | 1,589 | |||||||||
| Total Assets | $ | 36,309 | $ | 34,456 | |||||||
| Liabilities and Shareholders’ Equity | |||||||||||
| Current Liabilities: | |||||||||||
| Current debt | $ | 1,067 | $ | 548 | |||||||
| Accounts payable | 2,225 | 1,876 | |||||||||
| Other current liabilities | 3,033 | 1,810 | |||||||||
| Total Current Liabilities | 6,325 | 4,234 | |||||||||
| Long-Term Debt | 8,281 | 10,791 | |||||||||
| Deferred Income Taxes | 2,195 | 2,317 | |||||||||
| Other Liabilities | 1,654 | 1,728 | |||||||||
| Commitments and Contingencies (Note 21) | |||||||||||
| Shareholders’ Equity: | |||||||||||
| Common stock ($0.10 par value): | |||||||||||
| Class A-authorized 900 million shares, issued 378 million shares | 38 | 38 | |||||||||
| Convertible Class B-authorized 900 million shares, issued 70 million shares | 7 | 7 | |||||||||
| Capital in excess of par value | 4,486 | 4,433 | |||||||||
| Retained earnings | 17,502 | 15,100 | |||||||||
| Accumulated other comprehensive gain (loss) | (172) | (179) | |||||||||
| Treasury stock, at cost – 83 million shares at October 2, 2021 and October 3, 2020 | (4,138) | (4,145) | |||||||||
| Total Tyson Shareholders’ Equity | 17,723 | 15,254 | |||||||||
| Noncontrolling Interests | 131 | 132 | |||||||||
| Total Shareholders’ Equity | 17,854 | 15,386 | |||||||||
| Total Liabilities and Shareholders’ Equity | $ | 36,309 | $ | 34,456 |
See accompanying Notes to Consolidated Financial Statements.
TYSON FOODS, INC.
CONSOLIDATED STATEMENTS OF SHAREHOLDERS’ EQUITY
| Three years ended October 2, 2021 | |||||||||||||||||||||||||||||||||||
| in millions | |||||||||||||||||||||||||||||||||||
| 2021 | 2020 | 2019 | |||||||||||||||||||||||||||||||||
| Shares | Amount | Shares | Amount | Shares | Amount |
Showing the first 8K of 218K characters. Open the full section
Item 9. CHANGES IN AND DISAGREEMENTS WITH ACCOUNTANTS ON ACCOUNTING AND FINANCIAL DISCLOSURE
Not applicable.
Item 9A. CONTROLS AND PROCEDURES
Evaluation of Disclosure Controls and Procedures
An evaluation was performed, under the supervision and with the participation of management, including the Chief Executive Officer ("CEO") and the Chief Financial Officer ("CFO"), of the effectiveness of the design and operation of our disclosure controls and procedures (as defined in Rule 13a-15(e) and 15d-15(e) under the Securities Exchange Act of 1934, as amended (the "1934 Act")). Based on that evaluation, the CEO and CFO concluded that, as of October 2, 2021, our disclosure controls and procedures were effective.
Remediation of Previously Reported Material Weakness in Internal Control Over Financial Reporting
During the first quarter of fiscal 2021, we identified and disclosed a material weakness in our internal control over financial reporting over the existence of live cattle inventory. Specifically, we did not design and maintain effective controls to verify the existence of Company inventory in the custody of third-party live cattle suppliers and appropriately perform the live cattle inventory reconciliation and review at the designed level of precision. To remediate the material weakness described above, we designed and implemented a control requiring the inspection and physical verification of live cattle at third-party feedyards as well as conducted training on the execution of the Company’s key control regarding the reconciliation and review of live cattle inventory, including the sufficient review based on defined thresholds.
During the fourth quarter of fiscal 2021, we successfully completed the testing necessary to conclude that the material weakness has been remediated.
Management’s Annual Report on Internal Control Over Financial Reporting
Management is responsible for establishing and maintaining adequate internal control over financial reporting, as defined in Rule 13a-15(f) and 15d-15(f) of the 1934 Act. Our internal control over financial reporting was designed to provide reasonable assurance regarding the reliability of financial reporting and the preparation of financial statements for external purposes in accordance with generally accepted accounting principles. Because of its inherent limitations, internal control over financial reporting may not prevent or detect misstatements. Also, projections of any evaluation of effectiveness to future periods are subject to the risk that controls may become inadequate because of changes in conditions, or the degree of compliance with the policies or procedures may deteriorate.
Management conducted an evaluation of the effectiveness of our internal control over financial reporting as of October 2, 2021. In making this assessment, we used criteria set forth by the Committee of Sponsoring Organizations of the Treadway Commission ("COSO") in Internal Control - Integrated Framework (2013). Based on this evaluation under the framework in Internal Control - Integrated Framework (2013) issued by COSO, management concluded the Company’s internal control over financial reporting was effective as of October 2, 2021.
The Company’s independent registered public accounting firm, PricewaterhouseCoopers LLP, who has audited the fiscal 2021 financial statements included in this Annual Report on Form 10-K, has also audited the effectiveness of the Company’s internal control over financial reporting as of October 2, 2021 as stated in its report which appears in Part II, Item 8 of this Annual Report on Form 10-K.
Changes in Internal Control Over Financial Reporting
There were no changes in the Company’s internal control over financial reporting (as defined in Rules 13a-15(f) and 15d-15(f) under the 1934 Act) during the quarter ended October 2, 2021 that have materially affected, or are reasonably likely to materially affect, the Company’s internal control over financial reporting.
Item 9B. OTHER INFORMATION
None.
PART III
Item 10. DIRECTORS, EXECUTIVE OFFICERS AND CORPORATE GOVERNANCE
See information set forth under the captions “Election of Directors” and "Board of Directors and Corporate Governance Information" in the Company’s definitive Proxy Statement for the Company’s Annual Meeting of Shareholders to be held February 10, 2022 (the “Proxy Statement”), which information is incorporated herein by reference. Pursuant to general instruction G(3) of Annual Report on Form 10-K, certain information concerning our executive officers is included under the caption “Information About Our Executive Officers” in Part I of this Annual Report on Form 10-K.
We have a code of ethics as defined in Item 406 of Regulation S-K, which applies to all of our directors and team members, including our principal executive officers, principal financial officer, principal accounting officer or controller, and persons performing similar functions. This code of ethics, titled “Tyson Code of Conduct,” is available, free of charge on our website at http://ir.tyson.com.
We will post any amendments to the Code of Conduct, and any waivers that are required to be disclosed by the rules of either the Securities and Exchange Commission or the New York Stock Exchange, on our website.
Item 11. EXECUTIVE COMPENSATION
See the information set forth under the captions “Executive Compensation,” “Director Compensation For Fiscal Year 2021,” “Compensation Discussion and Analysis,” “Report of the Compensation and Leadership Development Committee” and "Compensation Committee Interlocks and Insider Participation” in the Proxy Statement, which information is incorporated herein by reference. However, pursuant to instructions to Item 407(e)(5) of Regulation S-K, the material appearing under the sub-heading “Report of the Compensation and Leadership Development Committee” shall be deemed "furnished" and not be deemed to be “filed” with the SEC, other than as provided in this Item 11.
Item 12. SECURITY OWNERSHIP OF CERTAIN BENEFICIAL OWNERS AND MANAGEMENT AND RELATED STOCKHOLDER MATTERS
See the information included under the captions “Security Ownership of Certain Beneficial Owners” and “Security Ownership of Management” in the Proxy Statement, which information is incorporated herein by reference.
Securities Authorized for Issuance Under Equity Compensation Plans
The following information reflects certain information about our equity compensation plans as of October 2, 2021:
| Equity Compensation Plan Information | |||||||||||||||||
| Number of Securities to be issued upon exercise of outstanding options | Weighted average exercise price of outstanding options | Number of Securities remaining available for future issuance under equity compensation plans (excluding Securities reflected in the first column (a)) | |||||||||||||||
| Equity compensation plans approved by security holders | 7,295,488 | $ | 63.73 | 27,544,595 | |||||||||||||
| Equity compensation plans not approved by security holders | — | — | — | ||||||||||||||
| Total | 7,295,488 | $ | 63.73 | 27,544,595 |
(a) Shares of Class A Common Stock available for future issuance as of October 2, 2021, under the Stock Incentive Plan (9,463,920), the Employee Stock Purchase Plan (10,433,067) and the Retirement Savings Plan (7,647,608).
Item 13. CERTAIN RELATIONSHIPS AND RELATED TRANSACTIONS, AND DIRECTOR INDEPENDENCE
See the information included under the captions “Election of Directors,” "Board of Directors and Corporate Governance Information" and “Certain Transactions” in the Proxy Statement, which information is incorporated herein by reference.
Item 14. PRINCIPAL ACCOUNTING FEES AND SERVICES
See the information included under the captions “Audit Fees,” “Audit-Related Fees,” “Tax Fees,” “All Other Fees,” and “Audit Committee Pre-Approval Policy” in the Proxy Statement, which information is incorporated herein by reference.
PART IV
Item 15. EXHIBITS, FINANCIAL STATEMENT SCHEDULES
(a)The following documents are filed as a part of this report:
(1) Consolidated Financial Statements
Consolidated Statements of Income for the three years ended October 2, 2021
Consolidated Statements of Comprehensive Income for the three years ended October 2, 2021
Consolidated Balance Sheets at October 2, 2021, and October 3, 2020
Consolidated Statements of Shareholders’ Equity for the three years ended October 2, 2021
Consolidated Statements of Cash Flows for the three years ended October 2, 2021
Notes to Consolidated Financial Statements
Report of Independent Registered Public Accounting Firm
(2) Consolidated Financial Statement Schedules
Financial Statement Schedule - Schedule II Valuation and Qualifying Accounts for the three years ended October 2, 2021
All other schedules are omitted because they are neither applicable nor required.
(3) Exhibits required by Item 601 of Regulation S-K
EXHIBIT INDEX
Exhibit No.
Showing the first 8K of 68K characters. Open the full section
Item 16. Form 10-K Summary
None.
SIGNATURES
Pursuant to requirements of Section 13 or 15(d) of the Securities Exchange Act of 1934, the registrant has duly caused this report to be signed on its behalf by the undersigned, thereunto duly authorized.
| TYSON FOODS, INC. | ||||||||||||||
| By: | /s/ Stewart Glendinning | November 15, 2021 | ||||||||||||
| Stewart Glendinning | ||||||||||||||
| Executive Vice President and Chief Financial Officer (Principal Financial Officer) | ||||||||||||||
| By: | /s/ Phillip W. Thomas | November 15, 2021 | ||||||||||||
| Phillip W. Thomas | ||||||||||||||
| Vice President, Controller and Chief Accounting Officer (Principal Accounting Officer) | ||||||||||||||
Pursuant to the requirements of the Securities Exchange Act of 1934, this report has been signed below by the following persons on behalf of the registrant and in the capacities and on the date indicated.
| /s/ Les R. Baledge | Director | November 15, 2021 | ||||||||||||
| Les R. Baledge | ||||||||||||||
| /s/ Gaurdie E. Banister Jr. | Director | November 15, 2021 | ||||||||||||
| Gaurdie E. Banister Jr. | ||||||||||||||
| /s/ Mike Beebe | Director | November 15, 2021 | ||||||||||||
| Mike Beebe | ||||||||||||||
| /s/ Maria Claudia Borras | Director | November 15, 2021 | ||||||||||||
| Maria Claudia Borras | ||||||||||||||
| /s/ David J. Bronczek | Director | November 15, 2021 | ||||||||||||
| David J. Bronczek | ||||||||||||||
| /s/ Mikel A. Durham | Director | November 15, 2021 | ||||||||||||
| Mikel A. Durham | ||||||||||||||
| /s/ Stewart Glendinning | Executive Vice President and Chief Financial Officer | November 15, 2021 | ||||||||||||
| Stewart Glendinning | (Principal Financial Officer) | |||||||||||||
| /s/ Donnie King | President and Chief Executive Officer | November 15, 2021 | ||||||||||||
| Donnie King | (Principal Executive Officer) | |||||||||||||
| /s/ Jonathan D. Mariner | Director | November 15, 2021 | ||||||||||||
| Jonathan D. Mariner | ||||||||||||||
| /s/ Kevin M. McNamara | Vice Chairman of the Board of Directors | November 15, 2021 | ||||||||||||
| Kevin M. McNamara | ||||||||||||||
| /s/ Cheryl S. Miller | Director | November 15, 2021 | ||||||||||||
| Cheryl S. Miller | ||||||||||||||
| /s/ Jeffrey K. Schomburger | Director | November 15, 2021 | ||||||||||||
| Jeffrey K. Schomburger | ||||||||||||||
| /s/ Phillip W. Thomas | Vice President, Controller and Chief Accounting Officer | November 15, 2021 | ||||||||||||
| Phillip W. Thomas | (Principal Accounting Officer) | |||||||||||||
| /s/ Robert C. Thurber | Director | November 15, 2021 | ||||||||||||
| Robert C. Thurber | ||||||||||||||
| /s/ Barbara A. Tyson | Director | November 15, 2021 | ||||||||||||
| Barbara A. Tyson | ||||||||||||||
| /s/ John H. Tyson | Chairman of the Board of Directors | November 15, 2021 | ||||||||||||
| John H. Tyson | ||||||||||||||
| /s/ Noel White | Executive Vice Chairman of the Board of Directors | November 15, 2021 | ||||||||||||
| Noel White |