 filings.tools
Item 5. MARKET FOR REGISTRANT’S COMMON EQUITY, RELATED STOCKHOLDER MATTERS AND ISSUER PURCHASES OF EQUITY SECURITIES
7K characters. Original on sec.gov · Markdown
Item 5. MARKET FOR REGISTRANT’S COMMON EQUITY, RELATED STOCKHOLDER MATTERS AND ISSUER PURCHASES OF EQUITY SECURITIES
We have issued and outstanding two classes of capital stock, Class A stock and Class B stock. Holders of Class B stock may convert such stock into Class A stock on a share-for-share basis. Holders of Class B stock are entitled to 10 votes per share and holders of Class A stock are entitled to one vote per share on matters submitted to shareholders for approval. As of October 29, 2022, there were approximately 24,000 holders of record of our Class A stock and six holders of record of our Class B stock.
DIVIDENDS
Cash dividends cannot be paid to holders of Class B stock unless they are simultaneously paid to holders of Class A stock. The per share amount of the cash dividend paid to holders of Class B stock cannot exceed 90% of the cash dividend simultaneously paid to holders of Class A stock. In fiscal 2022, the annual dividend rate for Class A stock was $1.84 per share and the annual dividend rate for Class B stock was $1.656 per share. Effective November 11, 2022, the Board of Directors increased the quarterly dividend previously declared on August 11, 2022, to $0.48 per share on our Class A common stock and $0.432 per share on our Class B common stock. The increased quarterly dividend is payable on December 15, 2022, to shareholders of record at the close of business on December 1, 2022. The Board also declared a quarterly dividend of $0.48 per share on our Class A common stock and $0.432 per share on our Class B common stock, payable on March 15, 2023, to shareholders of record at the close of business on March 1, 2023. We anticipate the remaining quarterly dividends in fiscal 2023 will be $0.48 and $0.432 per share of our Class A and Class B stock, respectively. This results in an annual dividend rate in fiscal 2023 of $1.92 for Class A shares and $1.728 for Class B shares, or a 4% increase compared to the fiscal 2022 annual dividend rate. We have paid uninterrupted quarterly dividends on common stock each year since 1977.
MARKET INFORMATION
Our Class A stock is traded on the New York Stock Exchange under the symbol “TSN.” No public trading market currently exists for our Class B stock.
ISSUER PURCHASES OF EQUITY SECURITIES
The table below provides information regarding our purchases of Class A stock during the periods indicated.
| Period | Total Number of Shares Purchased (2) | Average Price Paid per Share | Total Number of Shares Purchased as Part of Publicly Announced Plans or Programs (3) | Maximum Number of Shares that May Yet Be Purchased Under the Plans or Programs (1) | ||||||||||||||||
| Jul. 3, 2022 to Jul. 30, 2022 | 45,951 | $ | 84.05 | — | 11,957,990 | |||||||||||||||
| Jul. 31, 2022 to Sept. 3, 2022 | 49,180 | 82.91 | — | 11,957,990 | ||||||||||||||||
| Sept. 4, 2022 to Oct. 1, 2022 | 19,311 | 73.57 | — | 11,957,990 | ||||||||||||||||
| Total | 114,442 | $ | 81.79 | — | 11,957,990 |
(1)On February 7, 2003, our Board of Directors approved a program to repurchase up to 25 million shares of Class A common stock from time to time in open market or privately negotiated transactions. On May 3, 2012, our Board of Directors approved an increase of 35 million shares, on January 30, 2014, our Board of Directors approved an increase of 25 million shares and on February 4, 2016, our Board of Directors approved an increase of 50 million shares under the program. The program has no fixed or scheduled termination date.
(2)We purchased 114,442 shares during the period that were not made pursuant to our previously announced stock repurchase program but were purchased to fund certain Company obligations under our equity compensation plans. These transactions included 110,604 shares purchased in open market transactions and 3,838 shares withheld to cover required tax withholdings on the vesting of restricted stock.
(3)Shares purchased during the period pursuant to our previously announced stock repurchase program.
PERFORMANCE GRAPH
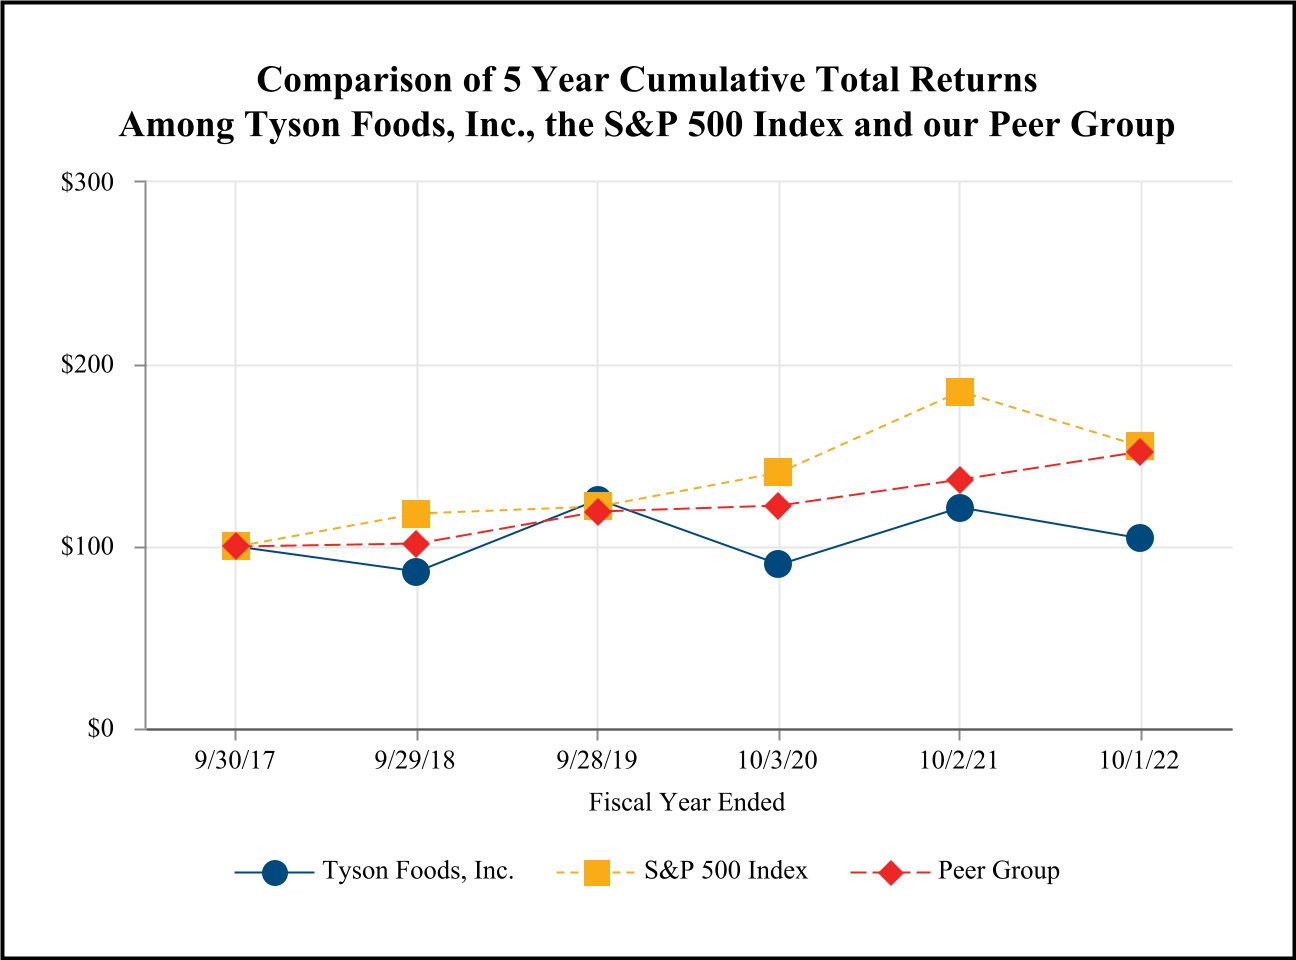
The following graph shows a five-year comparison of cumulative total returns for our Class A stock, the Standard & Poor’s (“S&P”) 500 Index and our peer group of companies described below.
| Fiscal Years Ended | |||||||||||||||||||||||||||||||||||||||||
| 9/30/17 | 9/29/18 | 9/28/19 | 10/3/20 | 10/2/21 | 10/1/22 | ||||||||||||||||||||||||||||||||||||
| Tyson Foods, Inc. | $ | 100.00 | $ | 85.94 | $ | 125.67 | $ | 89.62 | $ | 121.28 | $ | 104.37 | |||||||||||||||||||||||||||||
| S&P 500 Index | 100.00 | 117.90 | 121.61 | 140.13 | 185.04 | 154.59 | |||||||||||||||||||||||||||||||||||
| Peer Group | 100.00 | 101.31 | 118.72 | 122.02 | 136.50 | 151.97 |
The total cumulative return on investment (change in the year-end stock price plus reinvested dividends), which is based on the stock price or composite index at the end of fiscal 2017, is presented for each of the periods for the Company, the S&P 500 Index and our peer group. The complete list of our peer group includes: Archer-Daniels-Midland Company, Bunge Limited, Campbell Soup Company, ConAgra Foods, Inc., General Mills, Inc., Hormel Foods Corp., Kellogg Co., Kraft Heinz Company, Mondelez International Inc., PepsiCo, Inc., Pilgrim’s Pride Corporation, The Coca-Cola Company, The Hershey Company and The J.M. Smucker Company. The graph compares the performance of the Company’s Class A common stock with that of the S&P 500 Index and our peer group, with the return of each company in the peer group weighted on market capitalization. The stock price performance of the Company’s Class A common stock shown in the above graph is not necessarily indicative of future stock price performance.
The information in this “Performance Graph” section shall not be deemed to be “soliciting material” or to be “filed” with the SEC or subject to Regulation 14A or 14C, or to the liabilities of Section 18 of the Securities Exchange Act of 1934.
Previous: Item 4. MINE SAFETY DISCLOSURES · Next: Item 6. SELECTED FINANCIAL DATA