 filings.tools
Item 5. MARKET FOR REGISTRANT’S COMMON EQUITY, RELATED STOCKHOLDER MATTERS AND
3K characters. Original on sec.gov · Markdown
Item 5. MARKET FOR REGISTRANT’S COMMON EQUITY, RELATED STOCKHOLDER MATTERS AND
ISSUER PURCHASES OF EQUITY SECURITIES
Information regarding the principal market for our ordinary shares and related shareholder matters is as follows:
Our ordinary shares are traded on the New York Stock Exchange under the symbol IR. As of February 1, 2020, the approximate number of record holders of ordinary shares was 2,753.
Issuer Purchases of Equity Securities
The following table provides information with respect to purchases by us of our ordinary shares during the quarter ended December 31, 2019:
| Period | Total number of shares purchased (000's) (a) (b) | Average price paid per share (a) (b) | Total number of shares purchased as part of program (000's) (a) | Approximate dollar value of shares still available to be purchased under the program ($000's) (a) | ||||||||||
| October 1 - October 31 | 0.4 | $ | 117.02 | — | $ | 999,961 | ||||||||
| November 1 - November 30 | 1,016.6 | 129.43 | 1,016.6 | $ | 868,382 | |||||||||
| December 1 - December 31 | 897.9 | 132.10 | 896.4 | $ | 749,959 | |||||||||
| Total | 1,914.9 | $ | 130.68 | 1,913.0 |
(a) Share repurchases are made from time to time in accordance with management's capital allocation strategy, subject to market conditions and regulatory requirements. In October 2018, our Board of Directors authorized the repurchase of up to $1.5 billion of our ordinary shares under a share repurchase program (2018 Authorization) upon completion of the prior authorized share repurchase program. During the fourth quarter of 2019, we repurchased and canceled approximately $250 million of our ordinary shares leaving approximately $750 million remaining under the 2018 Authorization.
(b) We may also reacquire shares outside of the repurchase program from time to time in connection with the surrender of shares to cover taxes on vesting of share based awards. We reacquired 394 shares in October, 9 shares in November and 1,411 shares in December in transactions outside the repurchase programs.
Performance Graph
The following graph compares the cumulative total shareholder return on our ordinary shares with the cumulative total return on (i) the Standard & Poor’s 500 Stock Index and (ii) the Standard & Poor’s 500 Industrial Index for the five years ended December 31, 2019. The graph assumes an investment of $100 in our ordinary shares, the Standard & Poor’s 500 Stock Index and the Standard & Poor’s 500 Industrial Index on December 31, 2014 and assumes the reinvestment of dividends.
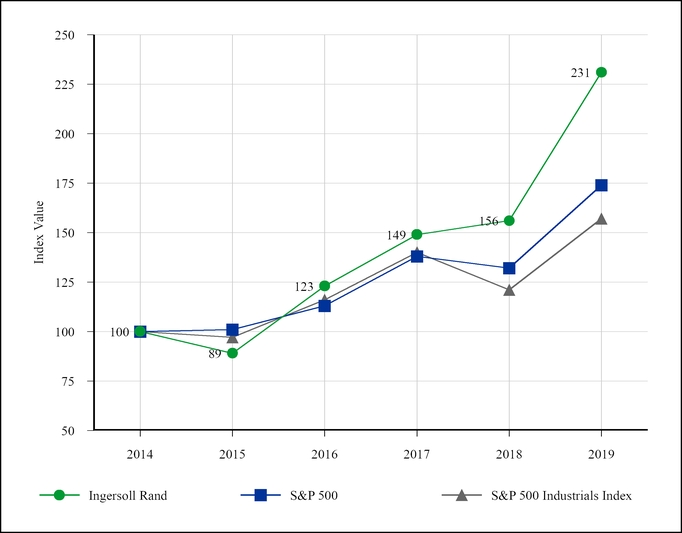
| Company/Index | 2014 | 2015 | 2016 | 2017 | 2018 | 2019 |
| Ingersoll Rand | 100 | 89 | 123 | 149 | 156 | 231 |
| S&P 500 | 100 | 101 | 113 | 138 | 132 | 174 |
| S&P 500 Industrials Index | 100 | 97 | 116 | 140 | 121 | 157 |
Previous: Item 4. MINE SAFETY DISCLOSURES · Next: Item 6. SELECTED FINANCIAL DATA