 filings.tools
Trade Desk 10-K 2019-12-31
Filed 2020-02-28. 22 sections, 362K characters. Original on sec.gov · Markdown · JSON
Cover and table of contents
f
UNITED STATES
SECURITIES AND EXCHANGE COMMISSION
Washington, D.C. 20549
FORM 10-K
(Mark One)
| ☒ | ANNUAL REPORT PURSUANT TO SECTION 13 OR 15(d) OF THE SECURITIES EXCHANGE ACT OF 1934 |
|---|
For the fiscal year ended December 31, 2019
OR
| ☐ | TRANSITION REPORT PURSUANT TO SECTION 13 OR 15(d) OF THE SECURITIES EXCHANGE ACT OF 1934 |
|---|
For the transition period from to
Commission File Number 001-37879

THE TRADE DESK, INC.
(Exact name of registrant as specified in its charter)
| Delaware | 27-1887399 | |
|---|---|---|
| (State or other jurisdiction of incorporation or organization) | (I.R.S. Employer Identification No.) |
42 N. Chestnut Street
Ventura, California 93001
(Address of principal executive offices, including zip code)
(805) 585-3434
(Registrant’s telephone number, including area code)
Securities registered pursuant to Section 12(b) of the Act:
| Title of each class | Trading Symbol | Name of each exchange on which registered | ||
|---|---|---|---|---|
| Class A Common Stock, par value $0.000001 per share | TTD | The Nasdaq Stock Market LLC |
Securities registered pursuant to Section 12(g) of the Act: None
Indicate by check mark if the registrant is a well-known seasoned issuer, as defined in Rule 405 of the Securities Act. Yes ☒ No ☐
Indicate by check mark if the registrant is not required to file reports pursuant to Section 13 or 15(d) of the Act. Yes ☐ No ☒
Indicate by check mark whether the registrant: (1) has filed all reports required to be filed by Section 13 or 15(d) of the Securities Exchange Act of 1934 during the preceding 12 months (or for such shorter period that the registrant was required to file such reports), and (2) has been subject to such filing requirements for the past 90 days. Yes ☒ No ☐
Indicate by check mark whether the registrant has submitted electronically every Interactive Data File required to be submitted pursuant to Rule 405 of Regulation S-T (§232.405 of this chapter) during the preceding 12 months (or for such shorter period that the registrant was required to submit such files). Yes ☒ No ☐
Indicate by check mark whether the registrant is a large accelerated filer, an accelerated filer, a non-accelerated filer, a smaller reporting company or an emerging growth company. See the definition of “large accelerated filer,” “accelerated filer,” “smaller reporting company,” and “emerging growth company” in Rule 12b-2 of the Exchange Act.
| Large accelerated filer | ☒ | Accelerated filer | ☐ | |||
|---|---|---|---|---|---|---|
| Non-accelerated filer | ☐ | Smaller reporting company | ☐ | |||
| Emerging growth company | ☐ |
If an emerging growth company, indicate by check mark if the registrant has elected not to use the extended transition period for complying with any new or revised financial accounting standards provided pursuant to Section 13(a) of the Exchange Act. ☐
Indicate by check mark whether the registrant is a shell company (as defined in Rule 12b-2 of the Exchange Act). Yes ☐ No ☒
The aggregate market value of the voting and non-voting common equity held by non-affiliates of the registrant as of June 30, 2019, based on the closing sales price for the Registrant’s Class A common stock, as reported on the NASDAQ Global Market, was approximately $8,779,399,707. As of January 31, 2020, there were 40,412,377 shares of the registrant’s Class A common stock outstanding and 5,161,323 shares of the registrant’s Class B common stock outstanding.
DOCUMENTS INCORPORATED BY REFERENCE
Portions of the registrant’s Proxy Statement for the 2020 Annual Meeting of Stockholders are incorporated by reference in Part III of this Annual Report on Form 10-K to the extent stated herein. Such proxy statement will be filed with the Securities and Exchange Commission within 120 days of the registrant’s fiscal year ended December 31, 2019.
THE TRADE DESK, INC.
ANNUAL REPORT ON FORM 10-K
FOR THE FISCAL YEAR ENDED DECEMBER 31, 2019
TABLE OF CONTENTS
SPECIAL NOTE ABOUT FORWARD-LOOKING STATEMENTS
This Annual Report on Form 10-K contains forward-looking statements within the meaning of Section 27A of the Securities Act of 1933, as amended, and Section 21E of the Securities Exchange Act of 1934, as amended. Forward-looking statements generally relate to future events or our future financial or operating performance and may include statements concerning, among other things, our business strategy (including anticipated trends and developments in, and management plans for, our business and the markets in which we operate), financial results, operating results, revenues, operating expenses, and capital expenditures, sales and marketing initiatives and competition. In some cases, you can identify forward-looking statements because they contain words such as “may,” “might,” “will,” “should,” “expects,” “plans,” “anticipates,” “could,” “intends,” “target,” “projects,” “contemplates,” “believes,” “estimates,” “predicts,” “suggests,” “potential” or “continue” or the negative of these words or other similar terms or expressions that concern our expectations, strategy, plans or intentions. These statements are not guarantees of future performance; they reflect our current views with respect to future events and are based on assumptions and are subject to known and unknown risks, uncertainties and other factors that may cause our actual results, performance or achievements to be materially different from expectations or results projected or implied by forward-looking statements.
We discuss many of these risks in Item 1A of this Annual Report on Form 10-K in greater detail under the heading “Risk Factors” and in other filings we make from time to time with the Securities and Exchange Commission, or SEC. Also, these forward-looking statements represent our estimates and assumptions only as of the date of this Annual Report on Form 10-K, which are inherently subject to change and involve risks and uncertainties. Unless required by federal securities laws, we assume no obligation to update any of these forward-looking statements, or to update the reasons actual results could differ materially from those anticipated, to reflect circumstances or events that occur after the statements are made. Given these uncertainties, investors should not place undue reliance on these forward-looking statements.
Investors should read this Annual Report on Form 10-K and the documents that we reference in this report and have filed with the SEC completely and with the understanding that our actual future results may be materially different from what we expect. We qualify all of our forward-looking statements by these cautionary statements.
PART I
Item 1. Business
Overview
The Trade Desk, Inc. (the “Company,” “we,” “our,” or “The Trade Desk”) is a technology company that empowers buyers of advertising. Through our self-service, cloud-based platform, ad buyers can create, manage, and optimize more expressive data-driven digital advertising campaigns across ad formats and channels, including display, video, audio, in-app, native and social, on a multitude of devices, such as computers, mobile devices, and connected TV (“CTV”). Our platform’s integrations with major inventory, publisher, and data partners provides ad buyers reach and decisioning capabilities, and our enterprise application programming interfaces (“APIs”) enable our clients to develop on top of the platform.
We commercially launched our platform in 2011, targeting display advertising. Since launching, we added support for several additional advertising formats, and in 2019, approximately 79% of gross spend on our platform came from mobile, video (which includes CTV), audio, native and social channels.
Our clients are primarily the advertising agencies and other service providers for advertisers, with whom we enter into ongoing master services agreements (“MSAs”). We generate revenue by charging our clients a platform fee based on a percentage of a client’s total spend on advertising. We also generate revenue from providing data and other value-added services and platform features.
The Trade Desk is a Delaware corporation established in 2009, headquartered in Ventura, California.
Our Industry
We believe that several trends in the advertising industry, happening in parallel, are driving a shift to programmatic advertising – the selling and buying of advertising inventory electronically.
Some of the key industry trends are:
Media is Becoming Digital. Media is increasingly becoming digital as a result of advances in technology and changes in consumer behavior. This shift has enabled unprecedented options for advertisers to target and measure their advertising campaigns across nearly every media channel and device. The digital advertising market is a significant and growing part of the total advertising market. We believe that the market is evolving and that advertisers will shift more spend to digital media. Since media is becoming increasingly digital, decisions based on consumer and behavioral data are more prevalent.
Fragmentation of Audience. As digital media grows, audience fragmentation is accelerating. A growing “long tail” of mobile applications (apps), media players, websites and content presents a challenge for advertisers trying to reach a large audience. Audience fragmentation has substantially impacted TV content distribution, perhaps more than any other channel, which we believe is changing how TV advertising inventory is monetized. Mirroring the fragmentation occurring in content, the number of devices used by individual consumers has increased. Both of these fragmentation trends are opportunities for technology companies that can consolidate and simplify media buying options for advertisers and their agencies.
Convergence of TV and the Internet. While still in its early days, we are witnessing a generational shift from linear TV to CTV with the convergence of the internet and television programming. New technologies allow more video content to be delivered over the Internet more seamlessly, accelerating consumer demand to watch what they want, when they want and where they want. The anticipated worldwide rollout of 5G, the fifth generational standard for wireless networks, will bring significantly faster data transfer speeds with less latency, and a better user experience, to consumers of mobile video. We believe these technologies will continue to feed consumer demand for CTV (including mobile video) and bring about new opportunities for content owners and advertisers to connect with consumers.
Increased Use of Data. Advances in software and hardware and the growing use of the Internet have made it possible to collect and rapidly process massive amounts of user data. Data vendors are able to collect user information across a wide range of Internet properties and connected devices, aggregate it and combine it with other data sources. This data is then made non-identifiable and available within seconds based on specific parameters and attributes. Advertisers can integrate this targeting data with their own or an agency’s proprietary data relating to client attributes, the advertisers’ own store locations and other related characteristics. Through the use of these types of data sources, together with real-time feedback on consumer reactions to the ads, programmatic advertising increases the value of impressions for advertisers and inventory owners, and viewers receive more relevant ads.
Automation of Ad Buying. The growing complexity of digital advertising has increased the need for automation. Technology that enables fast, accurate and cost-effective decision-making through the application of computer algorithms that use extensive data sets has become critical for the success of digital advertising campaigns. Using programmatic inventory buying tools, advertisers are able to automate their campaigns, providing them with better price discovery, on an impression-by-impression basis. As a result, advertisers are able to bid on and purchase the advertising inventory they value the most, pay less for advertising inventory they do not value as much, and abstain from buying advertising inventory that does not fit their campaign parameters.
Digital Advertising Eco-System
The digital advertising eco-system is divided into buyers, sellers and marketplaces, which can be further segmented on the basis of whether participants provide services or technology. We believe that participants on the buy-side or sell-side should be advocates for their buyers or sellers, while those in the market business should act as a referee or have market-driven incentives to protect or enhance the integrity of the marketplace. We believe that there are inherent conflicts of interest when market participants serve both buyers and sellers.
What We Do
We empower ad buyers, by providing a self‑service omnichannel software platform that enables our clients to purchase and manage data‑driven digital advertising campaigns. Our platform allows clients to manage integrated advertising campaigns across various advertising channels and formats, including display, video, audio, native and social, on a multitude of devices, including computers, mobile devices, and CTV.
| • | We Are Exclusively Focused on the Buy-Side. We focus on buyers since they control the advertising budgets. Also, the supply of digital advertising inventory exceeds demand, and accordingly, we believe it is a buyer’s market. We also believe that by aligning our business only with buyers, we are able to avoid inherent conflicts of interest that exist when serving both the buy-side and sell-side. This focus allows us to build trust with clients, many of whom leverage their proprietary data on our platform. That trust and ability to use their own data on our platform, without worrying about it being used by other participants, enables our clients and their advertisers to achieve better results. This trust provides us the benefit of long-term and stable relationships with our clients. |
|---|
| • | We Are an Enabler, Not a Disruptor. With our platform, we enable advertising agencies and other service providers. Advertisers can benefit from a comprehensive solution that combines our platform with the services provided by advertising agencies. |
|---|
| • | We Are Data-Driven. Our platform was founded on the principle that data-driven decisions will be the future of advertising. We built a data management platform first, before building our ad buying technology. While data from disparate third-party data providers can improve campaign performance, our clients’ success often relies largely on our ability to ingest proprietary data directly from brands and their agencies to enable intelligent decisioning that optimizes advertising campaigns. Given our independent, buy-side focused approach, and our strict protocol of carefully earmarking all client first-party data we ingest onto our data management platform, our clients trust us with their most granular and expressive data. Our technology platform enables the effective use of this granular data, which allows our clients to run precisely targeted advertising campaigns that maximize their return on advertising investments. Additionally, we are able to better optimize campaigns by using the data streams that we capture across different devices, so that data from one channel can be used to inform another. The breadth of data that we collect from a multitude of data sources across channels gives our clients a holistic view of their target audiences, enabling more effective targeting across different channels. |
|---|
| • | We Do Not Arbitrage Advertising Inventory. To further align our interests with those of our clients, we do not buy advertising inventory in order to resell it to our clients for a profit. Instead, we provide our clients with a platform that allows them to manage their omnichannel advertising campaigns, on a self-serve basis with robust reporting. With our platform, our clients control their campaign spend and are able to access and choose from many inventory sources. |
|---|
| • | We Have Ongoing Relationships with Clients. We derive substantially all of our revenue from ongoing MSAs with our clients rather than episodic insertion orders. We believe that this approach helps us strengthen our relationships with our clients and grow their use of our platform over the long term, providing us with a highly scalable business model. |
|---|
| • | We Are a Clear Box, Not a Black Box. Our platform is transparent and shows our clients their costs of advertising inventory, data, our platform fee and detailed performance metrics on their advertising campaigns. Our clients directly access and execute campaigns on our platform, control all facets of inventory purchasing decisions, and receive detailed, real-time reporting on all their advertising campaigns. By providing transparent information on our platform, our clients are able to continually compare results and target their budgets to the most effective advertising inventory, data providers and channels. |
|---|
| • | We Are an Open Platform. Clients can customize and build their own features on top of our platform. Clients may use our APIs to, for example, design their own user interface, bulk manage advertising campaigns, and link other systems including ad servers or reporting tools. Using our APIs or by working with our engineering team, clients invest their own resources to build their own proprietary tools in areas including reporting, campaign strategy, custom algorithms or proprietary data use cases. Our open platform approach enables our advertising agency and service provider clients to provide differentiated offerings to their clients, which we believe leads to long-term relationships and increased use of our platform. |
|---|
Our Platform
At the core of our platform is our bid-factor based architecture, which we believe has advantages over line-item based architectures that other buy-side systems use. Our bid-factor based system allows users to define desirable factors and the value associated with those factors. Based on these factors, our platform can compute in real-time the value of impressions and bid only for optimal impressions. Because of the granularity of the bid factors, users of our platform can rapidly create billions of different bid permutations with only a few clicks. This expressiveness enables better targeting, pricing and campaign results.
Our platform is useful and user-friendly based on the following:
| • | Easy to Use, Open and Customizable. Our platform provides multiple, easy-to-use automation tools that help our users focus on managing the key factors affecting their campaigns. Our platform also enables clients to integrate custom features and interfaces for their own use through our APIs. |
|---|
| • | Expressiveness. Our platform allows clients to easily define and manage advertising campaigns with multiple targeting parameters that may result in quadrillions of permutations, which we refer to as expressiveness. We believe that expressiveness provides clients with the ability to target audiences with an extremely high level of precision and thus obtain higher returns on their advertising spend. |
|---|
| • | Integrated, Omnichannel and Cross-device. Our platform provides integrated access to a wide range of omnichannel inventory and data sources, as well as third-party services such as ad servers, ad verification services and survey vendors. Our platform’s integration of these sources and services enables our clients to deploy their budgets through a wide variety of channels, media screens and formats, targeted in their desired manner, through a single platform. |
|---|
Some of the key features of our platform are:
| • | Auto-Optimization. We provide auto-optimization features which allow buyers to automate their campaigns and support them with computer generated modeling and decision making. In addition, by giving clients full reporting, budgeting, and bidding transparency, clients can take control of targeting variables when desired, and apply algorithmic automation when appropriate. |
|---|
| • | Advanced Reporting and Analytics Tools. We provide a comprehensive view of consumers’ interactions with the ads purchased through our platform with robust reporting of performance insights across multiple variables, such as audience characteristics, ad format, site category, website, device, creative type, and geography. Better reporting results in better learning, often leading to better campaign optimization and outcomes. |
|---|
| • | Data Management. Our platform enables clients to license a broad selection of data from third-party vendors in a seamless and easy manner, allowing them to further optimize their campaigns with the most relevant data. |
|---|
| • | Koa Artificial Intelligence. A predictive engine that helps platform users make data-driven decisions without sacrificing control or transparency. Koa makes recommendations for campaign optimizations based on its sophisticated analysis of rich data sets. Advertisers can then choose which optimizations make the most sense for their campaigns. |
|---|
| • | Media Planner. An omnichannel solution designed for digital media professionals to generate, analyze, and launch data-driven, programmatic media plans. This tool analyzes the actions of existing core audiences with the data we see across the open internet to deliver a fully transparent, performance-focused, and ready-to-activate campaign. |
|---|
| • | Private Marketplace Support. For clients who wish to transact directly with individual publishers, we offer a comprehensive user interface for discovering and transacting via a wide variety of private contracts. Additionally, we offer a solution for advertisers to access publisher inventory via a direct tag in a publisher’s ad server where there is no other programmatic access to such publisher’s inventory. |
|---|
Our platform enables a media planner or buyer at an advertising agency to:
| • | purchase digital media programmatically on various media exchanges and sell-side platforms; |
|---|
| • | acquire and use third-party data to optimize and measure digital advertising campaigns; |
|---|
| • | integrate and deploy their proprietary first-party data with our platform in order to optimize campaign efficacy; |
|---|
| • | monitor and manage ongoing digital advertising campaigns on a real-time basis; |
|---|
| • | link digital campaigns to offline sales results or other business objectives; |
|---|
| • | access other services such as our data management platform and publisher management platform marketplace; and |
|---|
| • | use our user interface and APIs to build their own proprietary technology on top of our platform. |
|---|
Our Technology
The core elements of our technology are:
| • | Scalable Architecture. Our platform infrastructure is hosted in data centers in eight countries around the world. On average, our real-time bidding technology evaluates more than 790 billion ad opportunities per day, reaching over 819 million devices per day on a global basis. Our core bidding architecture is easily adaptable to a variety of inventory formats, allowing our platform to communicate with many different inventory sources. |
|---|
| • | Predictive Models. We use the massive data captured by our platform to build predictive models around user characteristics, such as demographic, purchase intent or interest data. Data from our platform is continually fed back into these models, which enables them to improve over time as the use of our platform increases. |
|---|
| • | Performance Optimization. During campaign execution, our optimization engine continually scores a variety of attributes of each impression, such as website, industry vertical or geography, for their likelihood to achieve campaign performance goals. Our bidding engine then shifts bids and budgets in real-time to deliver optimal performance. Additionally, our platform enables clients to set multiple, simultaneous optimization goals for their advertising. |
|---|
| • | Real-time Analytics. Our platform continuously collects data regarding inventory availability. Real-time campaign delivery and spend totals are used to manage campaign budgets and goal caps, as well as campaign reporting. This data is fed back into our optimization engine to improve campaign performance, and into machine-learning models for user demographic predictive modeling. |
|---|
Our Growth Strategy
The key elements of our long-term growth strategy include:
| • | Increase Our Share of Existing Clients’ Digital Advertising Spend. Many advertisers are moving a greater percentage of their advertising budgets to programmatic channels. We believe that this shift will provide us with the opportunity to capture a larger share of the overall advertising spend by our existing clients. Additionally, we plan to promote additional services and data to our clients, helping us grow our business. |
|---|
| • | Grow Our Client Base. We have extensive relationships with many advertising agencies and other service providers, and believe that, given the decentralized nature of the advertising industry, we have the opportunity to expand our relationships within these agencies and with additional agencies and service providers. We expect to continue making investments in growing our sales and client service team to support this strategy. |
|---|
| • | Expand Our Omnichannel Capabilities. We believe offering clients capabilities across all media channels and devices enables advertisers to manage omnichannel campaigns and use data from each channel to inform decisions in other channels. We believe these capabilities will continue to further strengthen our relationships with our clients. We intend to continue to invest in innovation across all channels, including the integration of new inventory sources within CTV, digital radio, social, native, and digital out of home. |
|---|
| • | Extend Our Reach in CTV. Television is the largest category of advertising spend, and we believe that the future of television is in streaming media and video on demand through subscription services and connected devices. We plan to invest significant resources in technology, sales and support staff related to our CTV growth initiatives. |
|---|
| • | Continue to Innovate in Technology and Data. We intend to continue to innovate in technology to improve our platform and enhance its features and functionalities. We view data as one of our key competitive advantages. We will continue to invest resources in growing our data offerings, both from third-party providers as well as our proprietary data. |
|---|
| • | Expand Our International Presence. Many of our clients serve advertisers on a global basis and we intend to expand our presence outside of the United States, or U.S., to serve the needs of those advertisers in additional geographies. As we expand relationships with our existing clients, we are investing in select regions in Europe and Asia. In particular, we believe that China and Indonesia may represent substantial growth opportunities, and we are investing in developing our business in those markets. |
|---|
Our Clients
Our clients consist of purchasers of programmatic advertising inventory and data. As of December 31, 2019, we had approximately 820 clients, consisting primarily of advertising agencies or groups within advertising agencies that have independent relationships with us, manage budgets independently of one-another, are based in different jurisdictions, and are served by unique Trade Desk teams. Many of these agencies are owned by holding companies, where decision-making is decentralized such that purchasing decisions are made, and relationships with advertisers are located, at the agency, local branch or division level. Our client count includes only those parties which have signed MSAs with us and have spent more than $20,000 on our platform.
If all of our individual client contractual relationships were aggregated at the holding company level, two clients would have each represented more than 10% of our gross billings in 2019, two clients would have each represented more than 10% of our gross billings in 2018 and three clients would have each represented more than 10% of our gross billings in 2017. Our contractual and billing arrangement with Omnicom Group Inc. is at the holding company level and accounted for 10% of our gross billings in 2019, 10% in 2018 and 11% in 2017. For Publicis Groupe and WPP plc, we enter into separate contracts and billing relationships with various of its individual agencies and account for them as separate clients. We do not have any contractual relationship with Publicis Groupe or the holding company WPP plc. Publicis Media Inc. (formerly VivaKi, Inc.), which is affiliated with Publicis Groupe, accounted for 13% of our gross billings in 2019, 20% in 2018 and 22% in 2017. Mindshare, which is affiliated with WPP plc, accounted for 10% of our gross billings in 2017.
Our clients typically enter into MSAs with us that give users constant access to our platform. The MSAs do not contain any material commitments on behalf of clients to use our platform to purchase ad inventory, data or other features. These MSAs typically have one-year terms that renew automatically for additional one-year periods, unless earlier terminated. The MSAs are typically terminable at any time upon 60 days’ notice by either party.
Our clients are loyal, as reflected by our client retention rate of over 95% in 2019, 2018 and 2017. In addition, our clients typically grow their use of our platform over time.
Our Advertising and Data Inventory Suppliers
For suppliers of programmatic advertising inventory and data, we believe that we are an important business partner, as we represent one of the largest sources of buy-side demand within the digital advertising industry.
We obtain digital advertising inventory from over 95 ad exchanges, supply-side platforms, publishers and ad networks, providing us with access to a breadth of programmatic advertising inventory across computers, mobile devices and CTV. On average each day, our platform provides our clients with access to over 790 billion ad impressions per day, reaching over 819 million devices per day on a global basis.
For third-party data vendors, we believe that we represent an important distribution channel. As of December 31, 2019, we have integrated our platform with over 194 third-party data vendors whose products we make available for purchase through our platform.
Sales and Marketing
Given our self-serve business model, we focus on supporting, advising and training our clients to use our platform independently as soon as they are ready to transact.
Once a new client has access to our platform, they work closely with our client service teams, which onboard the new client and provide continuous support throughout the early campaigns. Typically, once a client has gained some initial experience, it will move to a fully self-serve model and request support as needed.
To help train our clients, suppliers and other digital media participants, we have created an e-learning program called The Trading Academy. We believe that this initiative is an important component in our strategy of enabling rapid onboarding to our platform.
Our marketing efforts are focused on increasing awareness for our brand, executing thought-leadership initiatives, supporting our sales team and generating new leads. We seek to accomplish these objectives by presenting at industry conferences, hosting client conferences, publishing white papers and research, public relations activities, social media presence and advertising campaigns.
Technology and Development
Rapid innovation is a core driver of our business success and our corporate culture. We prioritize and align our product roadmap with our clients’ needs, and we aim to refresh our platform weekly. Our development teams are intentionally lean and nimble in nature, providing for transparency and accountability.
We expect technology and development expense to increase as we continue to invest in the development of our platform to support additional features and functions, increase the number of advertising and data inventory suppliers and ramp up the volume of advertising spending on our platform. We also intend to invest in technology to further automate our business processes.
Seasonality
In the advertising industry, companies commonly experience seasonal fluctuations in revenue. For example, many advertisers allocate the largest portion of their budgets to the fourth quarter of the calendar year in order to coincide with increased holiday purchasing. Historically, the fourth quarter of the year reflects our highest level of advertising activity and the first quarter reflects the lowest level of such activity. We expect our revenue to continue to fluctuate based on seasonal factors that affect the advertising industry as a whole.
Our Competition
Our industry is highly competitive and fragmented. We compete with other demand-side platform providers, some of which are smaller, privately-held companies and others are divisions of large, well-established companies such as AT&T, Google and Adobe. We believe that we compete primarily based on the performance, capabilities and transparency of our platform and our focus on the buy-side. We believe that we are differentiated from our competitors in the following areas:
| • | we are an independent technology company focused on serving advertising agencies and others on the buy-side of our industry; |
|---|
| • | our client relationships are based on MSAs as opposed to campaign-specific insertion orders; |
|---|
| • | our platform provides comprehensive access to a wide range of inventory types and third-party data vendors; |
|---|
| • | our platform allows clients to build proprietary advantages by integrating custom features and interfaces for their own use through our APIs; and |
|---|
| • | our technology provides highly expressive targeting. |
|---|
In addition, we believe that new entrants would find it difficult to gain direct access to inventory providers, given their limited scale and the costs that additional integrations impose on inventory providers.
Our Employees and Culture
We have employees and offices around the world to serve advertisers’ desire to communicate with consumers worldwide.
Our business and our culture are anchored on four core principles:
| • | No company can effect global change without passionate forward‑thinking people as both employees and clients. |
|---|
| • | By preserving an honest and transparent culture and avoiding client conflict, we can exert exponentially less effort to grow our business. |
|---|
| • | We have committed to our clients and employees that we will never stop innovating. |
|---|
| • | Being profitable and changing the world can co‑exist and is more likely to happen when striving for both simultaneously. |
|---|
We believe we attract talented employees to our company and sophisticated ad buyers to our platform in large part because of our vision and unwavering commitment to empower the buy‑side of advertising.
As of December 31, 2019, we had 1,310 employees, of whom 851 are in the U.S. Our team draws from a broad spectrum of backgrounds and experiences, across technology, advertising and securities trading and other areas. We foster an entrepreneurial culture so that we may remain focused and innovative over time, as we strive to serve our clients with openness, transparency and humility.
Development of International Markets
We have been increasing our focus on markets outside the U.S. to serve the global needs of our clients. We believe that the global opportunity for programmatic advertising is significant, and should continue to expand as publishers and advertisers outside the U.S. seek to adopt the benefits that programmatic advertising provides. To capitalize on this opportunity, we intend to continue investing in our presence internationally. Our growth and the success of our initiatives in newer markets will depend on the continued adoption of our platform by our existing clients, as well as new clients, in these markets. Information about our geographic gross billings is set forth in Note 12 of “Item 8. Financial Statements and Supplementary Data” in this Annual Report on Form 10-K.
Intellectual Property
The protection of our technology and intellectual property is an important component of our success. We rely on intellectual property laws, including trade secret, copyright, patent and trademark laws in the U.S. and abroad, and use contracts, confidentiality procedures, non-disclosure agreements, employee disclosure and invention assignment agreements and other contractual rights to protect our intellectual property. We have patent applications that are pending, however, historically, we have not patented our proprietary technology in order to keep our technology architecture, trade secrets, and engineering roadmap private. Our patent applications may not result in the issuance of any patents, and any issued patents may not actually provide adequate defensive protection or competitive advantages to us. Our ability to continually develop new intellectual property and deliver new functionality quickly serves to protect us against competitors in digital advertising technology. We believe our platform is difficult to replicate and would be expensive and time-consuming to build.
Collection and Use of Data; Privacy and Data Protection Legislation and Regulation
We and our clients currently use pseudonymous data about Internet users on our platform to manage and execute digital advertising campaigns in a variety of ways, including delivering advertisements to Internet users based on their geographic locations, the type of device they are using, their interests as inferred from their web browsing or app usage activity, or their relationships with our clients. Such data is passed to us from third parties, including original equipment manufacturers, application providers, and publishers. We do not use this data to discover the identity of individuals, and we currently prohibit clients, data providers and inventory suppliers from importing data that directly identifies individuals.
Our ability, like those of other advertising technology companies, to collect, augment, analyze, use and share data relies upon the ability to uniquely identify devices across websites and applications, and to collect data about user interactions with those devices for purposes such as serving relevant ads and measuring the effectiveness of ads. The processes used to identify devices and similar and associated technologies are governed by U.S. and foreign laws and regulations and dependent upon their implementation within the industry ecosystem. Such laws, regulations, and industry standards may change from time to time, including those relating to the level of consumer notice and consent required before a company can employ cookies or other electronic tools to collect data about interactions with users online.
In the U.S., both federal and state legislation govern activities such as the collection and use of data, and privacy in the advertising technology industry has frequently been subject to review by the Federal Trade Commission (the “FTC”), U.S. Congress, and individual states. Much of the federal oversight on digital advertising in the U.S. currently comes from the FTC, which has primarily relied upon Section 5 of the Federal Trade Commission Act, which prohibits companies from engaging in “unfair” or “deceptive” trade practices, including alleged violations of representations concerning privacy protections and acts that allegedly violate individuals’ privacy interests. However, there is increasing consumer concern over data privacy in recent years, which has led to a myriad of proposed legislation and new legislation both at the federal and state levels, some of which has affected and will continue to affect our operations and those of our industry partners. For example, the California Consumer Privacy Act of 2018 (the “CCPA”), which went into effect January 1, 2020, defines “personal information” broadly enough to include online identifiers provided by individuals’ devices, applications, and protocols (such as IP addresses, mobile application identifiers and unique cookie identifiers) and individuals’ location data, if there is potential that individuals can be identified by such data. The CCPA establishes a new privacy framework for covered businesses by, among other requirements, establishing new data privacy rights for consumers in the State of California (including rights to deletion of and access to personal information), imposing special rules on the collection of consumer data from minors, creating new notice obligations and new limits on the “sale” of personal information (interpreted by some to include common advertising practices), and creating a new and potentially severe statutory damages framework for violations of the CCPA and for businesses that fail to implement reasonable security procedures and practices to prevent data breaches. The CCPA also offers the possibility to a consumer to recover statutory damages for certain violations and could open the door more broadly to additional risks of individual and class-action lawsuits even though the statute’s private right of action is limited in scope.
As our business is global, our activities are also subject to foreign legislation and regulation. In the European Union (including the European Economic Area (the “EEA”), countries of Iceland, Liechtenstein and Norway), or EU, separate laws and regulations (and member states’ implementations thereof) govern the processing of personal data, and these laws and regulations continue to impact us. The General Data Protection Regulation(“GDPR”), which applies to us, came into effect on May 25, 2018. Like the CCPA, the GDPR defines “personal data” broadly, and it enhances data protection obligations for controllers of such data and for service providers processing the data. It also provides certain rights, such as access and deletion, to the individuals about whom the personal data relates. The digital advertising industry has collaborated to create a user-facing framework for establishing and managing legal bases under the GDPR and other EU privacy laws including ePrivacy (discussed below), however European regulators have questioned the framework’s viability and activists have filed complaints with regulators of alleged non-compliance by specific companies that employ the framework. Continuing to maintain compliance with the GDPR’s requirements requires significant time, resources and expense, and may lead to significant changes in our business operations.
Additionally in the EU, EU Directive 2002/58/EC (as amended by Directive 2009/136/EC), commonly referred to as the ePrivacy or Cookie Directive, directs EU member states to ensure that accessing information on an Internet user’s computer, such as through a cookie and other similar technologies, is allowed only if the Internet user has been informed about such access, and provided consent. A replacement for the Cookie Directive is currently under discussion by EU member states to complement and bring electronic communication services in line with the GDPR and force a harmonized approach across EU member states. Although it remains under debate, the proposed ePrivacy Regulation may further raise the bar for the use of cookies, and the fines and penalties for breach may be significant. We cannot yet determine the impact such future laws, regulations, and standards may have on our business.
For the transfer of personal data from the EU to the U.S., we rely upon, and are currently certified under, the EU-U.S. and Swiss-U.S. Privacy Shield Frameworks. The Privacy Shield Framework, however, is facing criticism from privacy advocates and legal challenges in E.U. courts, as are other EU mechanisms for adequate data transfer to the U.S. such as the standard contractual clauses. If successful challenges leave us with no reasonable option for the lawful cross-border transfer of personal data, and if we nonetheless continue to transfer personal data from the EU to the US, that could lead to governmental enforcement actions, litigation, fines and penalties or adverse publicity which could have an adverse effect on our reputation and business or cause us to need to establish systems to maintain certain data in the EU, which may involve substantial expense and cause us to need to divert resources from other aspects of our operations.
As the collection and use of data for digital advertising has received media attention over the past several years, some government regulators, such as the FTC, and privacy advocates have suggested creating a “Do Not Track” standard that would allow Internet users to express a preference, independent of cookie settings in their browser, not to have their online browsing activities tracked. If a “Do Not Track” standard is imposed by state, federal, or foreign legislation, adopted by many Internet users, or agreed upon by standard setting groups, we may have to change our business practices.
We participate in several industry self-regulatory programs, mainly initiated by the Network Advertising Initiative, or NAI, the Digital Advertising Alliance, or DAA, and their international counterparts. Our efforts to comply with the self-regulatory principles of these programs include offering Internet users notice and choice when advertising is served to them based, in part, on their interests. We believe that this user-centric approach to addressing consumer privacy empowers consumers to make informed decisions on the use of their data.
Available Information
We file Annual Reports on Form 10-K, Quarterly Reports on Form 10-Q, Current Reports on Form 8-K, proxy statements, and related amendments, exhibits and other information with the Securities and Exchange Commission (the “SEC”). You may access and read our filings without charge through the SEC’s website at www.sec.gov or through our website at http://investors.thetradedesk.com, as soon as reasonably practicable after such materials are electronically filed with or furnished to the SEC pursuant to Section 13(a) or 15(d) of the Securities Exchange Act of 1934, as amended (the “Exchange Act”).
Website addresses referred to in this Annual Report on Form 10-K are not intended to function as hyperlinks, and the information contained on our website is not incorporated into, and does not form a part of this Annual Report on Form 10-K or any other report or documents we file with or furnish to the SEC.
Item 1A. Risk Factors
Investing in our Class A common stock involves a high degree of risk. You should consider carefully the risks and uncertainties described below, together with all of the other information contained in this Annual Report, including the consolidated financial statements and the related notes and Management’s Discussion and Analysis of Financial Condition and Results of Operations, before making investment decisions related to our Class A common stock. If any of the following risks are realized, our business, financial condition, results of operations and prospects could be materially and adversely affected. In that event, the market price of our Class A common stock could decline and you could lose part or all of your investment.
Risks Related to Our Business and Industry
If we fail to maintain and grow our client base and spend through our platform, our revenue and business may be negatively impacted.
To sustain or increase our revenue, we must regularly add new clients and encourage existing clients to maintain or increase the amount of advertising inventory purchased through our platform and adopt new features and functionalities that we make available. If competitors introduce lower cost or differentiated offerings that compete with or are perceived to compete with ours, our ability to sell our services to new or existing clients could be impaired. We have spent significant effort in cultivating our relationships with advertising agencies, which has resulted in an increase in the budgets allocated to, and the amount of advertising purchased on, our platform. However, it is possible that we may reach a point of saturation at which we cannot continue to grow our revenue from such agencies because of internal limits that advertisers may place on the allocation of their advertising budgets to digital media to a particular provider or otherwise. While we generally have MSAs in place with our clients, such agreements allow our clients to change the amount they spend through our platform or terminate our services with limited notice. We do not typically have exclusive relationships with our clients and there is limited cost to moving their media spend to our competitors. As a result, we have limited visibility to our future advertising revenue streams. We cannot assure you that our clients will continue to use our platform or that we will be able to replace, in a timely or effective manner, departing clients with new clients that generate comparable revenue. If a major client representing a significant portion of our business decides to materially reduce its use of our platform or to cease using our platform altogether, it is possible that our revenue or revenue growth rate could be significantly reduced and our business negatively impacted.
The loss of advertising agencies as clients could significantly harm our business, financial condition and results of operations.
Our client base consists primarily of advertising agencies. We do not have exclusive relationships with advertising agencies and we depend on agencies to work with us to build and maintain advertiser relationships and execute advertising campaigns.
The loss of agencies as clients could significantly harm our business, financial condition and results of operations. If we fail to maintain satisfactory relationships with an advertising agency, we risk losing business from the advertisers represented by that agency.
Advertisers may change advertising agencies. If an advertiser switches from an agency that utilizes our platform to one that does not, we will lose revenue from that advertiser. In addition, some advertising agencies have their own relationships with suppliers of advertising inventory and can directly connect advertisers with such suppliers. Our business may suffer to the extent that advertising agencies and inventory suppliers purchase and sell advertising inventory directly from one another or through intermediaries other than us.
We had approximately 820 clients, consisting primarily of advertising agencies, as of December 31, 2019. Many of these agencies are owned by holding companies, where decision making is decentralized such that purchasing decisions are made, and relationships with advertisers, are located, at the agency, local branch or division level. If all of our individual client contractual relationships were aggregated at the holding company level, Publicis Groupe and Omnicom Group Inc. would each represent more than 10% of our gross billings for 2019.
In most cases, we enter into separate contracts and billing relationships with the individual agencies and account for them as separate clients. However, some holding companies for these agencies may choose to exert control over the individual agencies in the future. If so, any loss of relationships with such holding companies and, consequently, of their agencies, local branches or divisions, as clients could significantly harm our business, financial condition and results of operations.
If we fail to innovate or make the right investment decisions in our offerings and platform, we may not attract and retain advertisers and advertising agencies and our revenue and results of operations may decline.
Our industry is subject to rapid and frequent changes in technology, evolving client needs and the frequent introduction by our competitors of new and enhanced offerings. We must constantly make investment decisions regarding offerings and technology to meet client demand and evolving industry standards. We may make bad decisions regarding these investments. If new or existing competitors have more attractive offerings, we may lose clients or clients may decrease their use of our platform. New client demands, superior competitive offerings or new industry standards could require us to make unanticipated and costly changes to our platform or business model. In addition, as we develop and introduce new products and services, including those incorporating or utilizing
artificial intelligence and machine learning, they may raise new, or heighten existing, technological, legal and other challenges, and may cause unintended consequences, may not function properly or may be misused by our clients. If we fail to adapt to our rapidly changing industry or to evolving client needs, or we provide new products and services that exacerbate technological, legal or other challenges, demand for our platform could decrease and our business, financial condition and results of operations may be adversely affected.
The market for programmatic buying for advertising campaigns is relatively new and evolving. If this market develops slower or differently than we expect, our business, growth prospects and financial condition would be adversely affected.
The substantial majority of our revenue has been derived from clients that programmatically purchase advertising inventory through our platform. We expect that spending on programmatic ad buying will continue to be our primary source of revenue for the foreseeable future, and that our revenue growth will largely depend on increasing spend through our platform. The market for programmatic ad buying is an emerging market, and our current and potential clients may not shift to programmatic ad buying from other buying methods as quickly as we expect, reducing our growth potential. If the market for programmatic ad buying deteriorates or develops more slowly than we expect, it could reduce demand for our platform, and our business, growth prospects and financial condition would be adversely affected.
In addition, our revenue may not necessarily grow at the same rate as spend on our platform. Growth in spend may outpace growth in our revenue as the market for programmatic buying for advertising matures due to a number of factors including pricing competition, quantity discounts and shifts in product, media, client and channel mix. A significant change in revenue as a percentage of spend co
Showing the first 8K of 122K characters. Open the full section
Item 1B. Unresolved Staff Comments
None.
Item 1B. Unresolved Staff Comments
None.
Item 2. Properties
Refer to “Item 1. Business–Overview”.
Item 3. Legal Proceedings
We are not currently a party to any legal proceedings, litigation or claims, which, if determined adversely to us, would have a material adverse effect on our business, financial condition, results of operations or cash flows. We may from time to time, be party to litigation and subject to claims incident to the ordinary course of business. Regardless of the outcome, litigation can have an adverse impact on us because of defense and settlement costs, diversion of management resources and other factors.
Item 4. Mine Safety Disclosures
Not applicable.
PART II
Item 5. Market for Registrant’s Common Equity, Related Stockholder Matters and Issuer Purchases of Equity Securities
Our Class A common stock began trading on the NASDAQ Global Market on September 21, 2016 under the symbol “TTD”. Prior to this date, there was no public trading market for our Class A common stock. There is no public trading market for our Class B common stock.
Holders of Record
As of January 31, 2020, there were approximately 15 holders of record of our Class A common stock and 21 holders of record of our Class B common stock. The actual number of stockholders is greater than this number of record holders and includes stockholders who are beneficial owners but whose shares are held in street name by brokers and other nominees. This number of holders also does not include stockholders whose shares may be held in trust by other entities.
Dividend Policy
We have never declared or paid any dividends on our Class A or Class B common stock, and we do not anticipate paying any cash dividends in the foreseeable future. We currently intend to retain any earnings to finance the operation and expansion of our business. Any future determination to pay dividends will be at the discretion of our board of directors and will be dependent upon then-existing conditions, including our earnings, capital requirements, results of operations, financial condition, business prospects and other factors that our board of directors considers relevant. Refer to “Item 7. Management’s Discussion and Analysis of Financial Condition and Results of Operations” for additional information regarding our financial condition. In addition, our credit facility contains restrictions on our ability to pay dividends.
Purchases of Equity Securities by the Issuer and Affiliated Purchasers
None.
Recent Sales of Unregistered Securities
None.
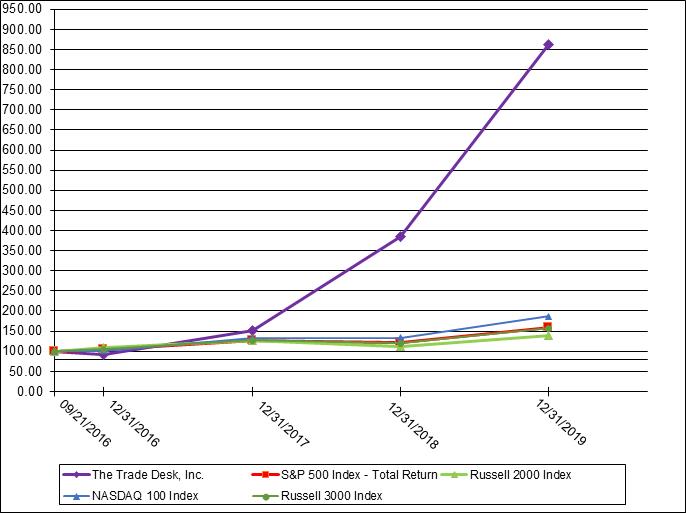
Stock Performance Graph
This performance graph shall not be deemed “soliciting material” or to be “filed” with the SEC for purposes of Section 18 of the Exchange Act, or otherwise subject to the liabilities under that Section, and shall not be deemed to be incorporated by reference into any filing of ours under the Securities Act of 1933, as amended, except as shall be expressly set forth by specific reference in such filing.
The following graph compares the cumulative total stockholder return on an initial investment of $100 in our Class A common stock between September 21, 2016 (our initial trading day) and December 31, 2019, with the comparative cumulative total returns of the Standard & Poor’s (S&P) 500 Index, Russell 3000 Index and NASDAQ 100 Index over the same period. As previously discussed, we have not paid any cash dividends and, therefore, the cumulative total return calculation for us is based solely upon stock price appreciation (depreciation) and not reinvestment of cash dividends, whereas the data for the S&P 500 Index, Russell 3000 Index and NASDAQ 100 Index assumes reinvestments of dividends. The graph assumes the closing market price on September 21, 2016 of $30.10 per share as the initial value of our Class A common stock. The returns shown are based on historical results and are not necessarily indicative of, nor intended to forecast, future stock price performance. The performance graph also includes a comparison with the Russell 2000 Index, which we are now replacing with the Russell 3000 Index because it is the relevant index in which the Company is now included.
Item 6. Selected Financial Data
The following tables set forth our selected consolidated financial data for the periods indicated. We have derived the selected consolidated statements of operations data for 2019, 2018, and 2017 and the selected consolidated balance sheet data as of December 31, 2019 and 2018 from our audited consolidated financial statements included elsewhere in this Annual Report on Form 10-K. The selected consolidated statements of operations data for 2016 and 2015 and the selected consolidated balance sheet data as of December 31, 2017, 2016 and 2015 were derived from our audited consolidated financial statements that are not included in this Annual Report on Form 10-K.
The following selected consolidated financial data should be read in conjunction with “Item 7. Management’s Discussion and Analysis of Financial Condition and Results of Operations” and our consolidated financial statements and the related notes appearing in “Item 8. Financial Statements and Supplementary Data” in this Annual Report on Form 10-K. Our historical results are not necessarily indicative of our future results.
| Year Ended December 31, | ||||||||||||||||||||
|---|---|---|---|---|---|---|---|---|---|---|---|---|---|---|---|---|---|---|---|---|
| 2019 | 2018 | 2017 | 2016 | 2015 | ||||||||||||||||
| (in thousands, except per share data) | ||||||||||||||||||||
| Consolidated Statements of Operations Data: | ||||||||||||||||||||
| Revenue | $ | 661,058 | $ | 477,294 | $ | 308,217 | $ | 202,926 | $ | 113,836 | ||||||||||
| Operating expenses (1): | ||||||||||||||||||||
| Platform operations | 156,180 | 114,098 | 66,230 | 39,876 | 22,967 | |||||||||||||||
| Sales and marketing | 132,882 | 87,071 | 61,379 | 46,056 | 26,794 | |||||||||||||||
| Technology and development | 116,752 | 83,892 | 52,806 | 27,313 | 12,819 | |||||||||||||||
| General and administrative | 143,048 | 84,910 | 58,446 | 32,163 | 13,276 | |||||||||||||||
| Total operating expenses | 548,862 | 369,971 | 238,861 | 145,408 | 75,856 | |||||||||||||||
| Income from operations | 112,196 | 107,323 | 69,356 | 57,518 | 37,980 | |||||||||||||||
| Total other expense (income), net | (4,024 | ) | 1,586 | 5,731 | 13,684 | 8,125 | ||||||||||||||
| Income before income taxes | 116,220 | 105,737 | 63,625 | 43,834 | 29,855 | |||||||||||||||
| Provision for income taxes | 7,902 | 17,597 | 12,827 | 23,352 | 13,926 | |||||||||||||||
| Net income | $ | 108,318 | $ | 88,140 | $ | 50,798 | $ | 20,482 | $ | 15,929 | ||||||||||
| Net income (loss) attributable to common stockholders (2) | $ | 108,318 | $ | 88,140 | $ | 50,798 | $ | (26,727 | ) | $ | 8,764 | |||||||||
| Net income (loss) per share attributable to common stockholders–basic (2) | $ | 2.43 | $ | 2.08 | $ | 1.26 | $ | (1.46 | ) | $ | 0.85 | |||||||||
| Net income (loss) per share attributable to common stockholders–diluted (2) | $ | 2.27 | $ | 1.92 | $ | 1.15 | $ | (1.46 | ) | $ | 0.39 |
| Year Ended December 31, | ||||||||||||||||||||
|---|---|---|---|---|---|---|---|---|---|---|---|---|---|---|---|---|---|---|---|---|
| 2019 | 2018 | 2017 | 2016 | 2015 | ||||||||||||||||
| (in thousands) | ||||||||||||||||||||
| Financial and Operating Data: | ||||||||||||||||||||
| Gross spend (3) | $ | 3,128,872 | $ | 2,350,877 | $ | 1,555,856 | $ | 1,027,984 | $ | 552,325 | ||||||||||
| Gross billings (4) | $ | 3,095,687 | $ | 2,285,013 | $ | 1,491,742 | $ | 990,561 | $ | 529,975 |
| As of December 31, | ||||||||||||||||||||
|---|---|---|---|---|---|---|---|---|---|---|---|---|---|---|---|---|---|---|---|---|
| 2019 | 2018 | 2017 | 2016 | 2015 | ||||||||||||||||
| (in thousands) | ||||||||||||||||||||
| Consolidated Balance Sheet Data: | ||||||||||||||||||||
| Cash, cash equivalents and short-term investments | $ | 254,988 | $ | 207,232 | $ | 155,950 | $ | 133,400 | $ | 4,047 | ||||||||||
| Accounts receivable, net | 1,166,376 | 834,764 | 599,565 | 377,240 | 191,943 | |||||||||||||||
| Total assets | 1,728,761 | 1,117,872 | 797,164 | 537,596 | 210,231 | |||||||||||||||
| Accounts payable | 868,618 | 669,147 | 490,377 | 321,163 | 108,461 | |||||||||||||||
| Long-term debt, net of current portion | — | — | 27,000 | 25,847 | 45,918 | |||||||||||||||
| Total liabilities | 1,116,244 | 723,305 | 551,581 | 373,216 | 171,885 | |||||||||||||||
| Convertible preferred stock | — | — | — | — | 24,204 | |||||||||||||||
| Total stockholders’ equity | 612,517 | 394,567 | 245,583 | 164,380 | 14,142 |
| (1) | Includes stock-based compensation expense as follows: |
|---|
| Year Ended December 31, | ||||||||||||||||||||
|---|---|---|---|---|---|---|---|---|---|---|---|---|---|---|---|---|---|---|---|---|
| 2019 | 2018 | 2017 | 2016 | 2015 | ||||||||||||||||
| (in thousands) | ||||||||||||||||||||
| Platform operations | $ | 5,350 | $ | 4,463 | $ | 2,674 | $ | 756 | $ | 71 | ||||||||||
| Sales and marketing | 20,769 | 11,306 | 6,261 | 1,707 | 127 | |||||||||||||||
| Technology and development | 26,553 | 13,855 | 6,661 | 1,513 | 85 | |||||||||||||||
| General and administrative | 28,086 | 12,586 | 5,721 | 1,080 | 91 | |||||||||||||||
| Total | $ | 80,758 | $ | 42,210 | $ | 21,317 | $ | 5,056 | $ | 374 |
Refer to Note 10 to our audited consolidated financial statements for more information regarding stock-based compensation expense.
| (2) | Refer to Note 3 to our audited consolidated financial statements for a description of the net income (loss) attributable to common stockholders and net income (loss) per share attributable to common stockholders—basic and diluted computations. |
|---|
| (3) | Gross spend includes the value of a client’s purchases through our platform plus our platform fee, which is a percentage of a client’s purchases through the platform. We review gross spend for internal management purposes to assess market share and scale, and to plan for optimal levels of support for our clients. Some companies in our industry report revenue on a gross basis or use similar metrics, so tracking our gross spend allows us to compare our results to the results of those companies. Gross spend does not represent our revenue reported on a GAAP basis. Our gross spend is influenced by the volume and characteristics of bids for advertising inventory won through our platform. We expect our revenue as a percentage of gross spend, which is sometimes referred to as take rate, to fluctuate due to the types of services and features selected by our clients through our platform and certain volume discounts. We track gross spend based on the location of our office servicing the respective clients. Other companies, including companies in our industry, may calculate gross spend or similarly titled measures differently, which reduces its usefulness as a comparative measure. |
|---|
| (4) | Gross billings represents the amount we invoice our clients, net of allowances. As some of our clients have payment relationships directly with advertising inventory suppliers for the amount of advertising inventory the clients purchase through our platform, we do not invoice these clients for this spend, and we only invoice such clients for data, other services and our platform fee. Accordingly, gross billings are less than gross spend and represent gross spend, less platform discounts and less the value of advertising inventory and data that our clients purchase directly from publishers through our platform. We report revenue on a net basis which represents gross billings net of amounts we pay suppliers for the cost of advertising inventory, data and add-on features. We expect our revenue as a percentage of gross billings to fluctuate due to the types of services and features selected by our clients through our platform and certain volume discounts. We review gross billings for internal management purposes to adequately plan for our working capital needs and monitor collection risk. We track gross billings based on the billing address of the client. In many cases, international clients are serviced from our U.S. offices resulting in gross billings exceeding gross spend for international clients. |
|---|
Item 7. Management’s Discussion and Analysis of Financial Condition and Results of Operations
You should read the following discussion and analysis of our financial condition and results of operations together with the consolidated financial statements and the related notes to those statements included in Item 8 to this Annual Report on Form 10-K. In addition to historical financial information, the following discussion contains forward-looking statements that reflect our plans, estimates, beliefs, and expectations, and involve risks and uncertainties. Factors that could cause or contribute to these differences include those discussed below and elsewhere in this Annual Report on Form 10-K, particularly in the section titled “Item 1A. Risk Factors” and the “Special Note About Forward-Looking Statements”.
The following generally discusses 2019 and 2018 items and year-to-year comparisons between 2019 and 2018. Discussion of historical items and year-to-year comparisons between 2018 and 2017 that are not included in this discussion can be found in “Management’s Discussion and Analysis of Financial Condition and Results of Operations” in our Annual Report on Form 10-K for the fiscal year ended December 31, 2018 filed with SEC on February 22, 2019. References to “Notes” are notes included in our consolidated financial statements appearing elsewhere in this Annual Report on Form 10-K.
Overview
We are a technology company that empowers buyers of advertising. Through our self-service, cloud-based platform, ad buyers can create, manage, and optimize more expressive data-driven digital advertising campaigns across ad formats, including display, video, audio, native and social, on a multitude of devices, such as computers, mobile devices, and CTV. Our platform’s integrations with major data, inventory, and publisher partners provides ad buyers reach and decisioning capabilities, and our enterprise APIs enable our clients to develop on top of the platform.
We commercially launched our platform in 2011, targeting display advertising. We have since extended our platform to address additional advertising formats, and in 2019, approximately 79% of gross spend on our platform was for mobile, video, audio, native and social.
Our clients are primarily the advertising agencies and other service providers for advertisers, with whom we enter into ongoing MSAs. We generate revenue by charging our clients a platform fee based on a percentage of a client’s total spend on advertising. We also generate revenue from providing data and other value-added services and platform features.
Executive Summary
Highlights
For the years ended December 31, 2019 and 2018:
| • | our revenue was $661.1 million and $477.3 million, respectively, representing an increase of 39%; and |
|---|
| • | our net income was $108.3 million and $88.1 million, respectively. |
|---|
Trends, Opportunities and Challenges
The growing digitization of media and fragmentation of audiences has increased the complexity of advertising, and thereby increased the need for automation in ad buying, which we provide on our platform. In order to grow, we will need to continue to develop our platform’s programmatic capabilities and advertising inventory. We believe that key opportunities include our ongoing global expansion, continuing development of our CTV, video, audio, and native ad inventory, and continuing development of data usage and advertising targeting capabilities.
We believe that growth of the programmatic advertising market is important for our ability to grow our business. Adoption of programmatic advertising by advertisers allows us to acquire new clients and grow revenue from existing clients. Although our clients include some of the largest advertising agencies in the world, we believe there is significant room for us to expand further within these clients and gain a larger amount of their advertising spend through our platform. We also believe that the industry trends noted above will lead to advertisers adopting programmatic advertising through platforms such as ours.
Similarly, the adoption of programmatic advertising by inventory owners and content providers allows us to expand the volume and type of advertising inventory that we present to our clients. For example, we have expanded our CTV, native and audio advertising offerings through our recent integrations with supply-side partners.
We invest for long-term growth. We anticipate that our operating expenses will continue to increase significantly in the foreseeable future as we invest in platform operations and technology and development to enhance our product features, including programmatic buying of CTV ad inventory, and in sales and marketing to acquire new clients and reinforce our relationships with existing clients. In addition, we expect to continue making investments in our infrastructure, including our information technology, financial and administrative systems and controls, to support our growing operations.
In addition, we believe the markets outside of the U.S. offer an opportunity for growth, and we intend to make additional investments in sales and marketing and product development to expand in these markets, including China, where we are making significant investments in our platform and growing our team.
We believe that these investments will contribute to our long-term growth, although they may negatively impact profitability in the near term.
Our business model has allowed us to grow significantly, and we believe that our operating leverage enables us to support future growth profitably.
Factors Affecting Our Performance
Growth in and Retention of Client Spend
Our recent growth has been driven by expanding our share of spend by our existing clients and adding new clients. Our clients include some of the largest advertising agencies in the world, and we believe there is significant room for us to expand further within these clients. As a result, future revenue growth depends upon our ability to retain our existing clients and to gain a larger amount of their advertising spend through our platform.
In order to analyze the contribution to the growth of our business driven by the increase in gross spend from existing clients, we measure annual gross spend for the set of clients, or cohort, that commenced spending on our platform in a specific year relative to subsequent periods. The gross spend from each of our cohorts has increased over subsequent periods. However, over time we will likely lose clients from each cohort, clients may spend less on our platform and the growth rate of gross spend may change. Any such change could have a significant negative impact on gross spend and operating results.
Ability to Expand our Omnichannel Reach, Including CTV and Digital Radio
We enable the purchase of advertising inventory in a wide variety of formats, such as display, mobile, video, audio, social and native. Our future growth will depend on our ability to maintain and grow the inventory of, and spend on, other channels in addition to display advertising. We believe that our ability to integrate and offer CTV and digital radio advertising inventory for purchase through our platform, and in particular our ability to manage the increased costs that will accompany these purchases, will impact the future growth of our business.
Growth of the Programmatic Advertising Market
Our operating results and prospects will be impacted by the overall adoption of programmatic advertising by inventory owners and content providers, as well as advertisers and the agencies and service providers that represent them. Programmatic advertising has grown rapidly in recent years, and any acceleration, or slowing, of this growth would affect our operating and financial performance. In addition, even if the programmatic advertising market continues to grow at its current rate, our ability to position ourselves within the market will impact the future growth of our business.
Development of International Markets
We have been increasing our focus on markets outside the U.S. to serve the global needs of our clients. We believe that the global opportunity for programmatic advertising is significant due to the growing middle class abroad, and should continue to expand as publishers and advertisers outside the U.S. seek to adopt the benefits that programmatic advertising provides. To capitalize on this opportunity, we intend to continue investing in our presence internationally. Our growth and the success of our initiatives in newer markets will depend on the continued adoption of our platform by our existing clients, as well as new clients, in these markets. Information about geographic gross billings is set forth in Note 12—Segment and Geographic Information.
Seasonality
In the advertising industry, companies commonly experience seasonal fluctuations in revenue. For example, many advertisers allocate the largest portion of their budgets to the fourth quarter of the calendar year in order to coincide with increased holiday purchasing. Historically, the fourth quarter of the year reflects our highest level of advertising activity and the first quarter reflects the lowest level of such activity. We expect our revenue to continue to fluctuate based on seasonal factors that affect the advertising industry as a whole.
Components of Our Results of Operations
We have one primary business activity and operate in one reportable and operating segment.
Revenue
We generate revenue from clients who enter into agreements with us to use our platform to purchase advertising inventory, data and other add-on features.
We report revenue on a net basis which represents gross billings net of amounts we pay suppliers for the cost of advertising inventory, data and add-on features. Our accounts receivable are recorded at the amount of gross billings to clients, net of allowances, for the amounts we are responsible to collect, and our accounts payable are recorded at the amount payable to suppliers. Accordingly, both accounts receivable and accounts payable appear large in relation to revenue reported on a net basis.
Revenue as a percentage of gross spend may fluctuate from period to period due to a number of factors, such as changes in the proportion of spend represented by our larger clients with the lowest platform fees, our clients’ use of platform features and volume discounts. We expect that our revenue as a percentage of gross spend will fluctuate in the future, especially as we introduce and as our clients select new platform features, expand our omnichannel capabilities, extend our reach to more CTV inventory and add additional clients whose businesses may have different underlying business models.
Refer to “Critical Accounting Policies and Estimates—Revenue Recognition” below for a description of our revenue recognition policies.
Operating Expenses
We classify our operating expenses into the following four categories:
Platform Operations. Platform operations expense consists of expenses related to hosting our platform, which includes “internet traffic” associated with the viewing of available impressions or queries per second (“QPS”) and providing support to our clients. Platform operations expense includes hosting costs, personnel costs, and amortization of acquired technology and capitalized software costs for the development of our platform, including allocated overhead. Personnel costs included in platform operations include salaries, bonuses, stock-based compensation, and employee benefit costs, and are primarily attributable to personnel who provide our clients with support using our platform and the personnel who support our platform. We capitalize certain costs associated with the development of our platform and amortize these costs in platform operations over their estimated useful lives. We allocate overhead such as information technology infrastructure, rent and occupancy charges based on headcount.
We expect platform operations expenses to increase in absolute dollars in future periods as we continue to experience increased volumes of QPS through our platform and hire additional personnel to support our clients.
Sales and Marketing. Sales and marketing expense consists primarily of personnel costs, including salaries, bonuses, stock-based compensation, employee benefits costs and commission costs, for our sales and marketing personnel. Sales and marketing expense also includes costs for market development programs, advertising, promotional and other marketing activities, and allocated overhead. We allocate overhead such as information technology infrastructure, rent and occupancy charges based on headcount. Commissions costs are expensed as incurred.
Our sales organization focuses on marketing our platform to increase its adoption by existing and new clients. We are also focused on expanding our international business by growing our sales teams in countries in which we currently operate, as well as establishing a presence in additional countries. As a result, we expect sales and marketing expenses to increase in absolute dollars in future periods. Sales and marketing expense as a percentage of revenue may fluctuate from period to period based on revenue levels and the timing of our investments in our sales and marketing functions as these investments may vary in scope and scale over periods and are impacted by the revenue seasonality in our industry and business.
Technology and Development. Our technology and development expense consists primarily of personnel costs, including salaries, bonuses, stock-based compensation and employee benefits costs, third-party consultant costs associated with the ongoing development and maintenance of our platform and integrations with our advertising and data inventory suppliers, amortization of capitalized third-party software used in the development of our platform and allocated overhead. We allocate overhead such as information technology infrastructure, rent and occupancy charges based on headcount. Technology and development costs are expensed as incurred, except to the extent that such costs are associated with software development that qualifies for capitalization, which are then recorded as capitalized software development costs included in other assets, non-current on our consolidated balance sheet. We amortize capitalized software development costs relating to our platform to platform operations expense.
We believe that continued investment in our platform is critical to attaining our strategic objectives and long-term growth. We therefore expect technology and development expense to increase as we continue to invest in the development of our platform to support additional features and functions, increase the number of advertising and data inventory suppliers and ramp up the volume of advertising spend on our platform. Our development efforts also include additional platform functionality to support our international expansion. We also intend to invest in technology to further automate our business processes.
General and Administrative. Our general and administrative expense consists primarily of personnel costs, including salaries, bonuses, stock-based compensation, and employee benefits costs associated with our executive, finance, legal, human resources, compliance, and other administrative personnel, as well as accounting and legal professional services fees, bad debt expense and allocated overhead. We allocate overhead such as information technology infrastructure, rent and occupancy charges based on headcount.
We expect to continue to invest in corporate infrastructure to support growth. We expect general and administrative expenses to increase in absolute dollars in future periods.
Other Expense (Income), Net
Interest Expense. Interest expense is mainly related to our debt, which carries a variable interest rate.
Interest Income. Interest income is mainly related to our cash, cash equivalents and short-term investments, which carry variable interest rates.
Foreign Currency Exchange Loss, Net. Foreign currency exchange loss, net consists primarily of gains and losses on foreign currency transactions. We have foreign currency exposure related to our accounts receivable and, to a much lesser extent, accounts payable that are denominated in currencies other than the U.S. Dollar, principally the Euro, British Pound, Australian Dollar, Canadian Dollar, Indonesian Rupiah, Japanese Yen, Singapore Dollar and Thai Baht.
Provision for Income Taxes
The provision for income taxes consists primarily of U.S. federal, state, and foreign income taxes. Our income tax provision may be significantly affected by changes to our estimates for tax in jurisdictions in which we operate and other estimates utilized in determining the global effective tax rate. Actual results may also differ from our estimates based on changes in economic conditions. Such changes could have a substantial impact on the income tax provision. We evaluate the judgments surrounding our estimates and make adjustments, as appropriate, each reporting period.
Our effective tax rate differs from the U.S. federal statutory income tax rate due to stock-based compensation, foreign tax rate differences, research and development tax credits, and state taxes.
Realization of our deferred tax assets is dependent primarily on the generation of future taxable income. In considering the need for a valuation allowance, we consider our historical, as well as future, projected taxable income along with other objectively verifiable evidence. Objectively verifiable evidence includes our realization of tax attributes, assessment of tax credits and utilization of net operating loss carryforwards during the year.
Results of Operations
The following tables set forth our consolidated results of operations and our consolidated results of operations as a percentage of revenue for the periods presented.
| For the year ended December 31, | ||||||||
|---|---|---|---|---|---|---|---|---|
| 2019 | 2018 | |||||||
| (in thousands) | ||||||||
| Revenue | $ | 661,058 | $ | 477,294 | ||||
| Operating expenses: | ||||||||
| Platform operations | 156,180 | 114,098 | ||||||
| Sales and marketing | 132,882 | 87,071 | ||||||
| Technology and development | 116,752 | 83,892 | ||||||
| General and administrative | 143,048 | 84,910 | ||||||
| Total operating expenses | 548,862 | 369,971 | ||||||
| Income from operations | 112,196 | 107,323 | ||||||
| Total other expense (income), net | (4,024 | ) | 1,586 | |||||
| Income before income taxes | 116,220 | 105,737 | ||||||
| Provision for income taxes | 7,902 | 17,597 | ||||||
| Net income | $ | 108,318 | $ | 88,140 |
| For the Year Ended December 31, | ||||||||
|---|---|---|---|---|---|---|---|---|
| 2019 | 2018 | |||||||
| (as a percentage of revenue*) | ||||||||
| Revenue | 100 | % | 100 | % | ||||
| Operating expenses: | ||||||||
| Platform operations | 24 | 24 | ||||||
| Sales and marketing | 20 | 18 | ||||||
| Technology and development | 18 | 18 | ||||||
| General and administrative | 22 | 18 | ||||||
| Total operating expenses | 83 | 78 | ||||||
| Income from operations | 17 | 22 | ||||||
| Total other expense (income), net | (1 | ) | — | |||||
| Income before income taxes | 18 | 22 | ||||||
| Provision for income taxes | 1 | 4 | ||||||
| Net income | 16 | % | 18 | % |
| * | Percentages may not sum due to rounding. |
|---|
Comparison of the Years Ended December 31, 2019 and 2018
Revenue
| Year Ended December 31, | 2019 vs 2018 Change | |||||||||||||||
|---|---|---|---|---|---|---|---|---|---|---|---|---|---|---|---|---|
| 2019 | 2018 | $ | % | |||||||||||||
| (in thousands, except percentages) | ||||||||||||||||
| Revenue | $ | 661,058 | $ | 477,294 | $ | 183,764 | 39 | % |
The increase in revenue was primarily due to an increase in gross spend on our platform. Gross spend on our platform by existing clients added prior to 2019 increased by 24% in the aggregate in 2019, and these existing clients represented approximately 92% of the total gross spend in 2019. In 2019, 58% of existing clients added prior to 2019 increased their gross spend on our platform and their average increase in gross spend was approximately $2.6 million.
Revenue as a percentage of gross spend in the aggregate may fluctuate from period to period based on our client mix and the extent to which clients utilize our platform’s features.
Platform Operations
| Year Ended December 31, | 2019 vs 2018 Change | |||||||||||||||
|---|---|---|---|---|---|---|---|---|---|---|---|---|---|---|---|---|
| 2019 | 2018 | $ | % | |||||||||||||
| (in thousands, except percentages) | ||||||||||||||||
| Platform operations | $ | 156,180 | $ | 114,098 | $ | 42,082 | 37 | % | ||||||||
| Percent of revenue | 24 | % | 24 | % |
The increase in platform operations expense was primarily due to increases of $19.3 million in hosting costs and $13.8 million in personnel costs, including $0.9 million of stock-based compensation and $6.0 million in allocated facilities. The increase in hosting costs was primarily attributable to supporting the increased use of our platform by our clients. The increase in personnel costs was primarily due to an increase in headcount for our client support team. The increase in allocated facilities costs was primarily driven by new office leases to support our growth.
We expect platform operations expenses to increase in absolute dollars in future periods, as we continue to experience increased volumes of transactions through our platform and hire additional personnel to support our clients.
Sales and Marketing
| Year Ended December 31, | 2019 vs 2018 Change | |||||||||||||||
|---|---|---|---|---|---|---|---|---|---|---|---|---|---|---|---|---|
| 2019 | 2018 | $ | % | |||||||||||||
| (in thousands, except percentages) | ||||||||||||||||
| Sales and marketing | $ | 132,882 | $ | 87,071 | $ | 45,811 | 53 | % | ||||||||
| Percent of revenue | 20 | % | 18 | % |
The increase in sales and marketing expense was primarily due to increases of $32.6 million in personnel costs, including $9.5 million of stock-based compensation, $5.1 million in marketing expenses and $8.1 million in allocated facilities costs. The increase in personnel costs was primarily due to an increase in sales and marketing headcount in order to support our sales efforts and to continue to develop and maintain relationships with our clients. The increase in overall marketing expenses was mainly related to our participation in industry events, tradeshows and related public relations activities. The increase in allocated facilities costs was primarily driven by new office leases to support our growth.
We expect sales and marketing expenses to increase in absolute dollars in future periods, as we focus on increasing the adoption of our platform with existing and new clients and expanding our international business.
Technology and Development
| Year Ended December 31, | 2019 vs 2018 Change | |||||||||||||||
|---|---|---|---|---|---|---|---|---|---|---|---|---|---|---|---|---|
| 2019 | 2018 | $ | % | |||||||||||||
| (in thousands, except percentages) | ||||||||||||||||
| Technology and development | $ | 116,752 | $ | 83,892 | $ | 32,860 | 39 | % | ||||||||
| Percent of revenue | 18 | % | 18 | % |
The increase in technology and development expense was primarily due to increases of $25.6 million in personnel costs, including $12.7 million of stock-based compensation, and $7.8 million in allocated facilities costs. The increase in personnel costs was primarily attributable to increased headcount to maintain and support our technology and development efforts. The increase in allocated facilities costs was primarily driven by new office leases to support our growth.
We expect technology and development expense to increase in absolute dollars, as we continue to invest in the development of our platform to support additional features and functions, increase the number of advertising and data inventory suppliers and ramp up the volume of advertising spend on our platform. We also intend to invest in technology to further automate our business processes.
General and Administrative
| Year Ended December 31, | 2019 vs 2018 Change | |||||||||||||||
|---|---|---|---|---|---|---|---|---|---|---|---|---|---|---|---|---|
| 2019 | 2018 | $ | % | |||||||||||||
| (in thousands, except percentages) | ||||||||||||||||
| General and administrative | $ | 143,048 | $ | 84,910 | $ | 58,138 | 68 | % | ||||||||
| Percent of revenue | 22 | % | 18 | % |
The increase in general and administrative expense was primarily due to increases of $44.8 million in personnel costs, including $15.5 million of stock-based compensation, and $7.5 million in allocated facilities costs. The increase in personnel costs, including stock-based compensation, was primarily due to increased headcount to support our growth and an increase in our stock price. The increase in allocated facilities costs was primarily driven by new office leases to support our growth.
We expect general and administrative expenses to increase in absolute dollars in future periods, as we continue to invest in corporate infrastructure to support our growth.
Other Expense (Income), Net
| Year Ended December 31, | 2019 vs 2018 Change | |||||||||||
|---|---|---|---|---|---|---|---|---|---|---|---|---|
| 2019 | 2018 | $ | ||||||||||
| (in thousands) | ||||||||||||
| Total other expense (income), net | $ | (4,024 | ) | $ | 1,586 | $ | (5,610 | ) |
The decrease in total other expense (income), net was primarily due to an increase in interest income of $3.6 million, and decreases in interest expense of $0.7 million and foreign currency exchange loss, net of $1.2 million. The increase in interest income was primarily attributable to an increase in short-term investments during 2019.
Provision for Income Taxes
| Year Ended December 31, | ||||||||
|---|---|---|---|---|---|---|---|---|
| 2019 | 2018 | |||||||
| (in thousands, except percentages) | ||||||||
| Provision for income taxes | $ | 7,902 | $ | 17,597 | ||||
| Effective tax rate | 7 | % | 17 | % |
The difference between the effective tax rate in 2019 of 7% and the U.S. federal statutory income tax rate of 21% was primarily due to the impact of tax benefits associated with stock-based awards partially offset by the impact of taxes in foreign jurisdictions. For 2019, the provision for income taxes included $43.1 million of benefits associated with stock-based awards.
The difference between the effective tax rate in 2018 of 17% and the U.S. federal statutory income tax rate of 21% was primarily due to the impact of tax benefits associated with stock-based awards partially offset by the impact of state taxes. For 2018, the provision for income taxes included $15.1 million of benefits associated with stock-based awards.
Quarterly Results of Operations
The following tables set forth our quarterly unaudited consolidated statements of operations data in dollars and as a percentage of total revenue for each of the eight quarters in the period ended December 31, 2019. We have prepared the quarterly unaudited consolidated statements of operations data on a basis consistent with the audited consolidated financial statements included in “Item 8. Financial Statements and Supplementary Data” of this Annual Report on Form 10-K. In the opinion of management, the financial information in these tables reflects all adjustments, consisting only of normal recurring adjustments, which management considers necessary for a fair statement of this data. This information should be read in conjunction with the audited consolidated financial statements and related notes included in “Item 8. Financial Statements and Supplementary Data” of this Annual Report on Form 10-K. The results of historical periods are not necessarily indicative of the results for any future period.
| Three Months Ended | ||||||||||||||||||||||||||||||||
|---|---|---|---|---|---|---|---|---|---|---|---|---|---|---|---|---|---|---|---|---|---|---|---|---|---|---|---|---|---|---|---|---|
| Dec 31, | Sept 30, | Jun 30, | Mar 31, | Dec 31, | Sept 30, | Jun 30, | Mar 31, | |||||||||||||||||||||||||
| 2019 | 2019 | 2019 | 2019 | 2018 | 2018 | 2018 | 2018 | |||||||||||||||||||||||||
| Revenue | $ | 215,944 | $ | 164,203 | $ | 159,924 | $ | 120,987 | $ | 160,468 | $ | 118,825 | $ | 112,333 | $ | 85,668 | ||||||||||||||||
| Operating expenses: | ||||||||||||||||||||||||||||||||
| Platform operations | 47,267 | 39,932 | 35,330 | 33,651 | 35,256 | 29,344 | 26,601 | 22,897 | ||||||||||||||||||||||||
| Sales and marketing | 42,931 | 36,142 | 31,072 | 22,737 | 27,064 | 23,287 | 20,690 | 16,030 | ||||||||||||||||||||||||
| Technology and development | 32,803 | 29,185 | 29,452 | 25,312 | 24,086 | 22,621 | 19,484 | 17,701 | ||||||||||||||||||||||||
| General and administrative | 40,293 | 37,017 | 32,121 | 33,617 | 25,094 | 21,310 | 19,396 | 19,110 | ||||||||||||||||||||||||
| Total operating expenses | 163,294 | 142,276 | 127,975 | 115,317 | 111,500 | 96,562 | 86,171 | 75,738 | ||||||||||||||||||||||||
| Income from operations | 52,650 | 21,927 | 31,949 | 5,670 | 48,968 | 22,263 | 26,162 | 9,930 | ||||||||||||||||||||||||
| Total other expense (income), net | (1,045 | ) | (1,892 | ) | (1,420 | ) | 333 | (336 | ) | 158 | 1,064 | 700 | ||||||||||||||||||||
| Income before income taxes | 53,695 | 23,819 | 33,369 | 5,337 | 49,304 | 22,105 | 25,098 | 9,230 | ||||||||||||||||||||||||
| Provision for (benefit from) income taxes | 2,750 | 4,397 | 5,569 | (4,814 | ) | 9,869 | 1,813 | 5,755 | 160 | |||||||||||||||||||||||
| Net income | $ | 50,945 | $ | 19,422 | $ | 27,800 | $ | 10,151 | $ | 39,435 | $ | 20,292 | $ | 19,343 | $ | 9,070 | ||||||||||||||||
| Earnings per share: | ||||||||||||||||||||||||||||||||
| Basic | $ | 1.13 | $ | 0.43 | $ | 0.63 | $ | 0.23 | $ | 0.91 | $ | 0.47 | $ | 0.46 | $ | 0.22 | ||||||||||||||||
| Diluted | $ | 1.06 | $ | 0.40 | $ | 0.58 | $ | 0.21 | $ | 0.84 | $ | 0.44 | $ | 0.43 | $ | 0.20 |
| Three Months Ended | ||||||||||||||||||||||||||||||||
|---|---|---|---|---|---|---|---|---|---|---|---|---|---|---|---|---|---|---|---|---|---|---|---|---|---|---|---|---|---|---|---|---|
| Dec 31, | Sept 30, | Jun 30, | Mar 31, | Dec 31, | Sept 30, | Jun 30, | Mar 31, | |||||||||||||||||||||||||
| 2019 | 2019 | 2019 | 2019 | 2018 | 2018 | 2018 | 2018 | |||||||||||||||||||||||||
| (as a percentage of revenue*) | ||||||||||||||||||||||||||||||||
| Revenue | 100 | % | 100 | % | 100 | % | 100 | % | 100 | % | 100 | % | 100 | % | 100 | % | ||||||||||||||||
| Operating expenses: | ||||||||||||||||||||||||||||||||
| Platform operations | 22 | 24 | 22 | 28 | 22 | 25 | 24 | 27 | ||||||||||||||||||||||||
| Sales and marketing | 20 | 22 | 19 | 19 | 17 | 20 | 18 | 19 | ||||||||||||||||||||||||
| Technology and development | 15 | 18 | 18 | 21 | 15 | 19 | 17 | 21 | ||||||||||||||||||||||||
| General and administrative | 19 | 23 | 20 | 28 | 16 | 18 | 17 | 22 | ||||||||||||||||||||||||
| Total operating expenses | 76 | 87 | 80 | 95 | 69 | 81 | 77 | 88 | ||||||||||||||||||||||||
| Income from operations | 24 | 13 | 20 | 5 | 31 | 19 | 23 | 12 | ||||||||||||||||||||||||
| Total other expense (income), net | — | (1 | ) | (1 | ) | — | — | — | 1 | 1 | ||||||||||||||||||||||
| Income before income taxes | 25 | 14 | 21 | 4 | 31 | 19 | 22 | 11 | ||||||||||||||||||||||||
| Provision for (benefit from) income taxes | 1 | 3 | 3 | (4 | ) | 6 | 2 | 5 | — | |||||||||||||||||||||||
| Net income | 24 | % | 11 | % | 18 | % | 8 | % | 25 | % | 17 | % | 17 | % | 11 | % |
| * | Percentages may not sum due to rounding. |
|---|
Liquidity and Capital Resources
As of December 31, 2019, we had cash and cash equivalents of $130.9 million, including cash of $29.8 million held by our international subsidiaries, short-term investments in marketable securities of $124.1 million and working capital of $518.8 million.
We believe our existing cash and cash equivalents, cash flow from operations, and our undrawn available balance under our amended credit facility (refer to the section captioned “Credit Facility” below) will be sufficient to meet our working capital requirements for at least the next 12 months. Our current credit facility matures in May 2022. Further, in November 2017, we filed a shelf registration statement on Form S-3 with the SEC, or the Shelf Registration, which permits us to issue equity securities and equity-linked securities from time to time, subject to certain limitations. The Shelf Registration is intended to provide us with additional flexibility to access capital markets for general corporate purposes, subject to market conditions and our capital needs. Our future capital requirements and the adequacy of available funds will depend on many factors, including those set forth under “Risk Factors” within this Annual Report on Form 10-K.
In the future, we may attempt to raise additional capital through the sale of equity securities or through equity-linked or debt financing arrangements. If we raise additional funds by issuing equity or equity-linked securities, the ownership of our existing stockholders will be diluted. If we raise additional financing by the incurrence of additional indebtedness, we may be subject to increased fixed payment obligations and could also be subject to additional restrictive covenants, such as limitations on our ability to incur additional debt, and other operating restrictions that could adversely impact our ability to conduct our business. Any future indebtedness we incur may result in terms that could be unfavorable to equity investors.
There can be no assurances that we will be able to raise additional capital. The inability to raise capital would adversely affect our ability to achieve our business objectives. In addition, if our operating performance during the next 12 months is below our expectations, our liquidity and ability to operate our business could be adversely affected.
Credit Facility
On October 26, 2018, we and a syndicate of banks, led by Citibank, N.A., as agent, entered into the Second Amended and Restated Loan and Security Agreement (the “Second A&R Credit Agreement”, which we also refer to as “our credit facility”). Available funding commitments to us under the Second A&R Credit Agreement, subject to certain conditions, total up to $150.0 million, with a $20.0 million sublimit for swingline borrowings and a $15.0 million sublimit for the issuance of letters of credit. Under certain circumstances, we have the right to increase the Second A&R Credit Facility by an amount not to exceed $100.0 million. As of December 31, 2019, we did not have an outstanding debt balance under the Second A&R Credit Facility, and availability was $143.3 million. We were in compliance with all covenants as of December 31, 2019.
For additional information regarding the Second A&R Credit Agreement, refer to Note 7—Debt.
Cash Flows
The following table summarizes our cash flows for the periods presented:
| Year Ended December 31, | ||||||||
|---|---|---|---|---|---|---|---|---|
| 2019 | 2018 | |||||||
| (in thousands) | ||||||||
| Cash flows provided by operating activities | $ | 60,205 | $ | 86,603 | ||||
| Cash flows used in investing activities | $ | (163,841 | ) | $ | (25,191 | ) | ||
| Cash flows provided by (used in) financing activities | $ | 27,280 | $ | (10,130 | ) |
Operating Activities
Our cash flows from operating activities are primarily influenced by growth in our operations, increases or decreases in collections from our clients and related payments to our suppliers for advertising inventory and data. We typically pay suppliers in advance of collections from our clients. Our collection and payment cycles can vary from period to period. In addition, we expect seasonality to impact cash flows from operating activities on a sequential quarterly basis during the year.
In 2019, cash provided by operating activities of $60.2 million resulted primarily from net income adjusted for non-cash items of $222.9 million, partially offset by a net decrease in our working capital of $162.7 million. The net decrease in working capital was primarily related to an increase in accounts receivable of $331.4 million, partially offset by an increase in accounts payable of $191.8 million. The increase in accounts receivable was primarily due to the increase in spend through our platform and the timing of cash receipts from clients and the increase in accounts payable was primarily due to the timing of payments to suppliers.
In 2018, cash provided by operating activities of $86.6 million resulted primarily from net income adjusted for non-cash items of $142.1 million, partially offset by a net decrease in our working capital of $55.5 million. The net decrease in working capital was primarily related to an increase in accounts receivable of $239.9 million, partially offset by an increase in accounts payable of $177.7 million. The increase in accounts receivable was primarily due to the increase in spend through our platform and the timing of cash receipts from clients and the increase in accounts payable was primarily due to the timing of payments to suppliers.
Investing Activities
Our primary investing activities consist of investing in short-term investments in marketable securities, purchases of property and equipment in support of our expanding headcount as a result of our growth, and capital expenditures to develop our software in support of enhancing our technology platform. As our business grows, we expect our capital expenditures and our investment activity to continue to increase.
In 2019, we used $163.8 million of cash in investing activities, consisting of $212.8 million to purchase short-term investments, $35.7 million to purchase property and equipment and $4.9 million of investments in capitalized software, partially offset by maturities of short-term investments of $89.5 million. Purchases of property and equipment, leasehold improvements and investments in capitalized software support our growth and further development of our platform.
In 2018, we used $25.2 million of cash in investing activities, consisting of $19.8 million to purchase property and equipment and $5.4 million of investments in capitalized software.
Financing Activities
Our financing activities consisted primarily of proceeds from our equity compensation plans, taxes paid related to net settlement of restricted stock awards and borrowings and repayments of our debt.
In 2019, cash provided by financing activities of $27.3 million was primarily due to the $29.9 million proceeds from stock option exercises and $16.7 million proceeds from the employee stock purchase plan, partially offset by $19.3 million of taxes paid for restricted stock award settlements.
In 2018, cash used in financing activities of $10.1 million was primarily due to the $27.0 million repayment of our line of credit and taxes paid related to net settlement of restricted stock of $6.7 million, partially offset by proceeds of $13.8 million from our employee stock purchase plan and $10.0 million from stock options exercises.
Off-Balance Sheet Arrangements
We do not have any relationships with other entities or financial partnerships, such as entities often referred to as structured finance or special purpose entities that have been established for the purpose of facilitating off-balance sheet arrangements or other contractually narrow or limited purposes. We did not have any other off-balance sheet arrangements as of December 31, 2019 other than operating leases and the indemnification agreements described in Note 13—Commitments and Contingencies.
Contractual Obligations and Known Future Cash Requirements
Our principal commitments consist of our non-cancelable operating leases for our various office facilities, and other contractual commitments consisting of obligations to our hosting services providers, marketing contracts and providers of software as a service. In certain cases, the terms of the lease agreements provide for rental payments on a graduated basis.
The following table summarizes our contractual obligations, including interest, at December 31, 2019:
| Payments Due by Period | ||||||||||||||||||||
|---|---|---|---|---|---|---|---|---|---|---|---|---|---|---|---|---|---|---|---|---|
| Less than | 1-3 | 3-5 | More than | |||||||||||||||||
| Total | 1 Year | Years | Years | 5 Years | ||||||||||||||||
| (in thousands) | ||||||||||||||||||||
| Operating lease obligations | $ | 325,329 | $ | 14,770 | $ | 87,578 | $ | 70,620 | $ | 152,361 | ||||||||||
| Other contractual commitments | 186,949 | 55,112 | 63,837 | 68,000 | — | |||||||||||||||
| Total minimum payments | $ | 512,278 | $ | 69,882 | $ | 151,415 | $ | 138,620 | $ | 152,361 |
As of December 31, 2019, our total amount of gross unrecognized tax benefits was $53.2 million before netting with deferred tax assets for tax credit carryforwards and is considered a long-term obligation. Due to their nature, there is a high degree of uncertainty regarding the time of future cash outflows and other events that extinguish these liabilities.
In the ordinary course of business, we enter into agreements in which we may agree to indemnify clients, suppliers, vendors, lessors, business partners, lenders, stockholders and other parties with respect to certain matters, including losses resulting from claims of intellectual property infringement, damages to property or persons, business losses, or other liabilities. Generally, these indemnity and defense obligations relate to our own business operations, obligations, and acts or omissions. However, under some circumstances, we agree to indemnify and defend contract counterparties against losses resulting from their own business operations, obligations, and acts or omissions, or the business operations, obligations, and acts or omissions of third parties. These indemnity provisions generally survive termination or expiration of the agreements in which they appear. In addition, we have entered into indemnification agreements with our directors, executive officers and other officers that will require us to indemnify them against liabilities that may arise by reason of their status or service as directors, officers or employees. No demands have been made upon us to provide indemnification under such agreements and there are no claims that we are aware of that could have a material effect on our consolidated financial statements.
Critical Accounting Policies and Estimates
Our consolidated financial statements are prepared in accordance with accounting principles generally accepted in the United States of America (“GAAP”). The preparation of these consolidated financial statements requires us to make estimates and assumptions that affect the reported amounts of assets, liabilities, revenue, expenses and related disclosures. We evaluate our estimates and assumptions on an ongoing basis. Our estimates are based on historical experience and various other assumptions that we believe to be reasonable under the circumstances. Our actual results could differ from these estimates.
We believe that the assumptions and estimates associated with the evaluation of revenue recognition criteria, including the determination of revenue recognition as net versus gross in our revenue arrangements, operating lease assets and liabilities, including our incremental borrowing rate and terms and provisions of each lease, stock-based compensation expense and income taxes have the greatest potential impact on our consolidated financial statements. Therefore, we consider these to be our critical accounting policies and estimates. Except for the changes described in Note 2—Basis of Presentation and Summary of Significant Accounting Policies, there were no other changes to our critical accounting policies and estimates.
Revenue Recognition
We generate revenue from clients who enter into agreements with us to use our platform to purchase advertising inventory, data and other add-on features. We charge our clients a platform fee, which is a percentage of a client’s purchases through the platform. In addition, we invoice our clients for the cost of advertising inventory purchased, plus data and any add-on features purchased through the platform.
We determine revenue recognition through the following steps:
| • | Identification of a contract with a customer; |
|---|
| • | Identification of the performance obligations in the contract; |
|---|
| • | Determination of the transaction price; |
|---|
| • | Allocation of the transaction price to the performance obligations in the contract; and |
|---|
| • | Recognition of revenue when or as the performance obligations are satisfied. |
|---|
We maintain agreements with each client and supplier in the form of MSAs, which set out the terms of the relationship and access to our platform. Our performance obligation is to provide the use of our platform to clients to develop ad campaigns and select the advertising inventory, data and other add-on features. We charge clients a platform fee, based on a percentage of a client’s purchases through the platform, and the transaction price is determined based on the consideration to which we expect to be entitled in exchange for the completion of a transaction, that is, when a bid is won. The platform fee percentage is based on the level of purchases by the client through the platform during the month. We recognize revenue for our platform fee at a point in time when a purchase by the client occurs through our platform, which is when a bid is won. Subsequent to a bid being won through our platform, the associated fees are generally not subject to adjustment or refund. Historically, any refunds and adjustments have not been material.
We report revenue net of amounts we pay suppliers for the cost of advertising inventory, third-party data and other add-on features (collectively, “Supplier Features”). The determination of whether we are the principal or agent, and hence whether to report revenue on a gross basis for the amount of the Supplier Features the clients purchase using the platform plus our platform fees or on a net basis for the amount of platform fees charged to the client, requires judgment. We determined that we are not primarily responsible for the purchase of Supplier Features, but rather, we are primarily responsible to provide a platform that enables clients to bid on advertising inventory, and use data and other add-on features in designing and executing their campaigns. We do not control the Supplier Features prior to the purchase by the client, and we do not have pricing latitude with respect to the cost of such features. The platform fee we charge clients is a percentage of their purchases through our platform, similar to a commission, and the platform fee is not contingent on the results of an advertising campaign. Based on these and other factors, we determined that we are not the principal in the purchase and sale of Supplier Features in all of our arrangements, and therefore, we report revenue on a net basis for the platform fees charged to clients.
Stock-Based Compensation
Compensation expense related to stock options, restricted stock awards and units, which we refer to, collectively, as restricted stock, and awards granted under our employee stock purchase plan, or ESPP, is measured and recognized in our consolidated financial statements based on the fair value of the awards granted. The increase in our stock price since our IPO in September 2016 and our growth in headcount have resulted in increased stock-based compensation for each sequential fiscal year since our IPO. The fair value of each option award is estimated on the grant date using the Black-Scholes option-pricing model. The fair value of restricted stock is calculated using the closing market price of our common stock on the date of grant, and for performance-based restricted stock, we also assess the probability of targets being achieved in determining the amount of expense to recognize. Stock-based compensation expense related to stock options and restricted stock is recognized on a straight-line basis over the requisite service periods of the awards, which is generally four years. For performance-based restricted stock, expense is recognized on a graded-vesting attribution basis over the requisite service period of the award and is adjusted in subsequent reporting periods if the assessed probability or estimated level of achievement of the performance goals changes. Stock-based compensation expense for ESPP awards is recognized on a graded-vesting attribution basis over the requisite service period of each award.
For additional information regarding stock-based compensation and the assumptions used for determining the fair value of stock options and ESPP awards, refer to Note 2—Basis of Presentation and Summary of Significant Accounting Policies and Note 10—Stock-Based Compensation.
Income Taxes
Our income tax provision may be significantly affected by changes to our estimates for tax in jurisdictions in which we operate and other estimates utilized in determining the global effective tax rate. Actual results may also differ from our estimate based on changes in economic conditions. Such changes could have a substantial impact on the income tax provision. We evaluate the judgments surrounding our estimates and make adjustments, as appropriate, each reporting period.
Deferred income tax assets and liabilities are determined based upon the net effects of the differences between the consolidated financial statements carrying amounts and the tax basis of assets and liabilities and are measured using the enacted tax rate expected to apply to taxable income in the years in which the differences are expected to be reversed. A valuation allowance is used to reduce some or all of the deferred tax assets if, based upon the weight of available evidence, it is more likely than not that those deferred tax assets will not be realized.
We recognize the tax benefit from an uncertain tax position only if it is more likely than not that the tax position will be sustained on examination by the taxing authorities, based on the technical merits of the position. The tax benefits recognized in the consolidated financial statements from such positions are then measured based on the largest benefit that has a greater than 50% likelihood of being realized. We recognize interest and penalties accrued related to our uncertain tax positions in our income tax provision in the accompanying consolidated statement of operations.
In April 2019, we completed a series of transactions resulting in changes to its international legal structure, including a transfer of certain intellectual property rights among wholly owned subsidiaries, primarily to align its structure to its evolving operations. We recorded a $262.4 million deferred tax asset associated with this restructuring offset by a reserve for uncertain tax position of $51.0 million. Based on available objective evidence, management believes it is not more-likely-than-not that these additional foreign deferred tax assets will be realizable as of December 31, 2019 and, therefore, are offset by a full valuation allowance to the extent not offset by reserves from uncertain tax positions. Management applied significant judgment in estimating the fair value of intangible assets, which involved the use of significant assumptions, including revenue growth rates, margins and discount rates.
Leases
We have operating leases for our offices. We recognize most of our operating lease rights and commitments as operating lease right-of-use assets (“operating lease assets”), operating lease liabilities and operating lease liabilities, non-current, respectively, on our consolidated balance sheets.
We determine if an arrangement is, or contains, a lease at inception. Operating lease assets and liabilities are initially recorded based on the present value of lease payments over the lease term, which includes the minimum unconditional term of the lease, and may include options to extend or terminate the lease when it is reasonably certain at the commencement date that such options will be exercised. The decision to include these options involves consideration of our overall growth plans, as well as other strategic and economic factors. Since determination of the lease term requires an application of judgment, lease terms that differ from our determination could potentially have a material impact on our consolidated balance sheet. As the rate implicit for each of our leases is not readily determinable, we use our incremental borrowing rate, based on the information available at the lease commencement date in determining the present value of our expected lease payments. The rate is determined by analyzing and combining an applicable risk-free rate, a financial spread adjustment and any lease specific adjustment, which requires judgment.
Recently Issued Accounting Pronouncements
For information regarding recent accounting pronouncements, refer to Note 2—Basis of Presentation and Summary of Significant Accounting Policies.
Item 7A. Quantitative and Qualitative Disclosure about Market Risk
We have operations both within the U.S. and internationally, and we are exposed to market risks in the ordinary course of our business. These risks include primarily interest rate, foreign currency exchange and inflation risks.
Interest Rate Risk
We are exposed to market risk from changes in interest rates on our credit facility, which accrues interest at a variable rate. We have not used any derivative financial instruments to manage our interest rate risk exposure. No amount was owed on our revolving credit facility as of December 31, 2019.
Foreign Currency Exchange Risk
We have foreign currency risks related to our revenue and expenses denominated in currencies other than the U.S. Dollar, principally the Euro, British Pound, Australian Dollar, Canadian Dollar, Indonesian Rupiah, Japanese Yen, Singapore Dollar and Thai Baht. The volatility of exchange rates depends on many factors that we cannot forecast with reliable accuracy. We have experienced and will continue to experience fluctuations in our net income as a result of transaction gains and losses related to translating cash balances, trade accounts receivable and payable balances that are denominated in currencies other than the U.S. Dollar. The effect of an immediate 10% adverse change in foreign exchange rates on foreign-denominated accounts at December 31, 2019, would result in a foreign currency loss of approximately $18.5 million. In the event our non-U.S. Dollar denominated sales and expenses increase, our operating results may be more greatly affected by fluctuations in the exchange rates of the currencies in which we do business.
We enter into forward contracts or other derivative transactions in an attempt to hedge our foreign currency risk. There can be no assurance that such transactions will be effective in hedging some or all of our foreign currency exposures and under some circumstances could generate losses for us.
Inflation Risk
We do not believe that inflation has had a material effect on our business, financial condition or results of operations. If our costs were to become subject to significant inflationary pressures, we might not be able to fully offset such higher costs through price increases. Our inability or failure to do so could harm our business, financial condition and results of operations.
Item 8. Financial Statements and Supplementary Data
THE TRADE DESK, INC.
INDEX TO CONSOLIDATED FINANCIAL STATEMENTS
The supplementary financial information required by this Item 8 is included in Item 7 under the caption “Quarterly Results of Operations,” which is incorporated herein by reference.
REPORT OF INDEPENDENT REGISTERED PUBLIC ACCOUNTING FIRM
To the Board of Directors and Stockholders of The Trade Desk, Inc.
Opinions on the Financial Statements and Internal Control over Financial Reporting
We have audited the accompanying consolidated balance sheets of The Trade Desk, Inc. and its subsidiaries (the “Company”) as of December 31, 2019 and 2018, and the related consolidated statements of operations, of stockholders’ equity and of cash flows for each of the three years in the period ended December 31, 2019, including the related notes (collectively referred to as the “consolidated financial statements”). We also have audited the Company's internal control over financial reporting as of December 31, 2019, based on criteria established in Internal Control - Integrated Framework (2013) issued by the Committee of Sponsoring Organizations of the Treadway Commission (COSO).
In our opinion, the consolidated financial statements referred to above present fairly, in all material respects, the financial position of the Company as of December 31, 2019 and 2018, and the results of its operations and its cash flows for each of the three years in the period ended December 31, 2019 in conformity with accounting principles generally accepted in the United States of America. Also in our opinion, the Company maintained, in all material respects, effective internal control over financial reporting as of December 31, 2019, based on criteria established in Internal Control - Integrated Framework (2013) issued by the COSO.
Change in Accounting Principle
As discussed in Note 2 to the consolidated financial statements, the Company changed the manner in which it accounts for leases in 2019.
Basis for Opinions
The Company's management is responsible for these consolidated financial statements, for maintaining effective internal control over financial reporting, and for its assessment of the effectiveness of internal control over financial reporting, included in Management’s Report on Internal Control over Financial Reporting appearing under Item 9A. Our responsibility is to express opinions on the Company’s consolidated financial statements and on the Company's internal control over financial reporting based on our audits. We are a public accounting firm registered with the Public Company Accounting Oversight Board (United States) (PCAOB) and are required to be independent with respect to the Company in accordance with the U.S. federal securities laws and the applicable rules and regulations of the Securities and Exchange Commission and the PCAOB.
We conducted our audits in accordance with the standards of the PCAOB. Those standards require that we plan and perform the audits to obtain reasonable assurance about whether the consolidated financial statements are free of material misstatement, whether due to error or fraud, and whether effective internal control over financial reporting was maintained in all material respects.
Our audits of the consolidated financial statements included performing procedures to assess the risks of material misstatement of the consolidated financial statements, whether due to error or fraud, and performing procedures that respond to those risks. Such procedures included examining, on a test basis, evidence regarding the amounts and disclosures in the consolidated financial statements. Our audits also included evaluating the accounting principles used and significant estimates made by management, as well as evaluating the overall presentation of the consolidated financial statements. Our audit of internal control over financial reporting included obtaining an understanding of internal control over financial reporting, assessing the risk that a material weakness exists, and testing and evaluating the design and operating effectiveness of internal control based on the assessed risk. Our audits also included performing such other procedures as we considered necessary in the circumstances. We believe that our audits provide a reasonable basis for our opinions.
Definition and Limitations of Internal Control over Financial Reporting
A company’s internal control over financial reporting is a process designed to provide reasonable assurance regarding the reliability of financial reporting and the preparation of financial statements for external purposes in accordance with generally accepted accounting principles. A company’s internal control over financial reporting includes those policies and procedures that (i) pertain to the maintenance of records that, in reasonable detail, accurately and fairly reflect the transactions and dispositions of the assets of the company; (ii) provide reasonable assurance that transactions are recorded as necessary to permit preparation of financial statements in accordance with generally accepted accounting principles, and that receipts and expenditures of the company are being made only in accordance with authorizations of management and directors of the company; and (iii) provide reasonable assurance regarding prevention or timely detection of unauthorized acquisition, use, or disposition of the company’s assets that could have a material effect on the financial statements.
Because of its inherent limitations, internal control over financial reporting may not prevent or detect misstatements. Also, projections of any evaluation of effectiveness to future periods are subject to the risk that controls may become inadequate because of changes in conditions, or that the degree of compliance with the policies or procedures may deteriorate.
Critical Audit Matters
The critical audit matters communicated below are matters arising from the current period audit of the consolidated financial statements that were communicated or required to be communicated to the audit committee and that (i) relate to accounts or disclosures that are material to the consolidated financial statements and (ii) involved our especially challenging, subjective, or complex judgments. The communication of critical audit matters does not alter in any way our opinion on the consolidated financial statements, taken as a whole, and we are not, by communicating the critical audit matters below, providing separate opinions on the critical audit matters or on the accounts or disclosures to which they relate.
Revenue Recognition – Platform Fees
As described in Note 2 to the consolidated financial statements, the Company maintains agreements with each client and supplier in the form of master service agreements, which set out the terms of the relationship and access to the Company’s platform. The Company’s performance obligation is to provide the use of its platform to clients to develop ad campaigns and select the advertising inventory, data and other add-on features. The Company charges clients a platform fee, based on a percentage of a client’s purchases through the platform. The Company recognizes revenue for its platform fee at a point in time when the purchase by a client occurs through its platform. Management reports revenue on a net basis for the platform fees charged to clients. For the year
Showing the first 8K of 95K characters. Open the full section
Item 9. Changes in and Disagreements with Accountants on Accounting and Financial Disclosure
None.
Item 9A. Controls and Procedures
Evaluation of Disclosure Controls and Procedures
Our management, with the participation of our Chief Executive Officer (“CEO”) and Chief Financial Officer (“CFO”), evaluated the effectiveness of our disclosure controls and procedures as defined in Rules 13a-15(e) and 15d-15(e) under the Securities Exchange Act of 1934, as amended (the “Exchange Act”), as of December 31, 2019. Our disclosure controls and procedures are designed to provide reasonable assurance that information we are required to disclose in the reports we file or submit under the Exchange Act is accumulated and communicated to our management, including our CEO and CFO, as appropriate to allow timely decisions regarding required disclosures, and is recorded, processed, summarized, and reported within the time periods specified in the SEC’s rules and forms. Based on this evaluation, our CEO and CFO have concluded that our disclosure controls and procedures were effective at the reasonable assurance level as of December 31, 2019.
Management’s Report on Internal Control over Financial Reporting
Management is responsible for establishing and maintaining adequate internal control over financial reporting, as defined in Rules 13a-15(f) and 15d-15(f) under the Exchange Act. Our internal control over financial reporting is a process designed to provide reasonable assurance regarding the reliability of financial reporting and the preparation of our financial statements for external purposes in accordance with generally accepted accounting principles.
Management assessed the effectiveness of our internal control over financial reporting as of December 31, 2019 using the criteria set forth by the Committee of Sponsoring Organizations of the Treadway Commission in Internal Control—Integrated Framework (2013). Based on its assessment, our management, including our CEO and CFO, has concluded that our internal control over financial reporting was effective as of December 31, 2019.
The effectiveness of our internal control over financial reporting as of December 31, 2019 has been audited by PricewaterhouseCoopers LLP, our independent registered public accounting firm, as stated in their report, which appears in Item 8 of this Annual Report on Form 10-K.
Changes in Internal Control over Financial Reporting
We transitioned to a new accounting and financial reporting system, which replaced our existing accounting and financial reporting system. The go-live for this new system occurred during July 2019, and our system implementation was completed during the quarter ended September 30, 2019. Management evaluated the process changes as a result of the system implementation, and where needed, modified the design of and the testing for operating effectiveness of internal control over financial reporting. The modification to the design of and testing for operating effectiveness was specific to the new accounting and financial reporting system’s functionalities and features. We did not identify any previously unidentified risks or design gaps as a result of the system implementation. Testing for operating effectiveness of internal control over financial reporting has been completed for the fiscal year ended December 31, 2019, and management concluded that the internal control over financial reporting under the new accounting and financial reporting system was operating effectively.
There have been no significant changes in our internal control over financial reporting during the quarter ended December 31, 2019 that have materially affected, or are reasonably likely to materially affect, our internal control over financial reporting.
Inherent Limitations on Effectiveness of Controls
Management recognizes that a control system, no matter how well conceived and operated, can provide only reasonable, not absolute, assurance that the objectives of the control system are met. Further, the design of a control system must reflect the fact that there are resource constraints, and the benefits of controls must be considered relative to their costs. Because of the inherent limitations in all control systems, no evaluation of controls can provide absolute assurance that all control issues and instances of fraud or error, if any, have been detected. These inherent limitations include the realities that judgments in decision making can be faulty, and that breakdowns can occur because of a simple error or mistake. Additionally, controls can be circumvented by the individual acts of some persons, by collusion of two or more people, or by management override of the controls. The design of any system of controls also is based in part upon certain assumptions about the likelihood of future events, and there can be no assurance that any design will succeed in achieving its stated goals under all potential future conditions; over time, controls may become inadequate because of changes in conditions, or the degree of compliance with policies or procedures may deteriorate. Because of the inherent limitations in a cost-effective control system, misstatements due to error or fraud may occur and not be detected.
Item 9B. Other Information
None.
PART III
Item 10. Directors, Executive Officers and Corporate Governance
The information required by this item will be included in our proxy statement relating to our 2020 annual meeting of stockholders to be filed by us with the SEC no later than 120 days after the close of our fiscal year ended December 31, 2019 (the "Proxy Statement") and is incorporated herein by reference.
We have a code of business ethics and conduct that applies to all of our employees, including our Principal Executive Officer, Principal Financial Officer, Principal Accounting Officer, and our Board of Directors. A copy of this code, "Code of Business Conduct and Ethics", is available on our website at http://investors.thetradedesk.com. We intend to satisfy the disclosure requirement under Item 5.05 of Form 8-K regarding amendment to, or waiver from, a provision of our Code of Business Conduct and Ethics by posting such information on our investor relations website under the heading "Leadership & Governance" at http://investors.thetradedesk.com.
Item 11. Executive Compensation
The information required by this item will be included in the Proxy Statement and is incorporated herein by reference.
Item 12. Security Ownership of Certain Beneficial Owners and Management and Related Stockholder Matters
The information required by this item will be included in the Proxy Statement and is incorporated herein by reference.
Item 13. Certain Relationships and Related Transactions, and Director Independence
The information required by this item will be included in the Proxy Statement and is incorporated herein by reference.
Item 14. Principal Accounting Fees and Services
The information required by this item will be included in the Proxy Statement and is incorporated herein by reference.
PART IV
Item 15. Exhibits and Financial Statement Schedules
(a) We have filed the following documents as part of this Annual Report on Form 10-K:
- Consolidated Financial Statements
Refer to Index to Consolidated Financial Statements in Item 8 herein.
- Financial Statement Schedules
No financial statement schedules are provided because the information called for is not required or is shown in the financial statements of the notes thereto.
- Exhibits
Exhibits required to be filed as part of this report are:
| + | Indicates a management contract or compensatory plan or arrangement. |
|---|
| (1) | The information in this exhibit is furnished and deemed not filed with the Securities and Exchange Commission for purposes of section 18 of the Securities Exchange Act of 1934, as amended, or the Exchange Act, and is not to be incorporated by reference into any filing of The Trade Desk, Inc. under the Securities Act of 1933, as amended, of the Securities Act, or the Exchange Act, whether made before or after the date hereof, regardless of any general incorporation language in such filing. |
|---|
Item 16. Form 10-K Summary
None.
SIGNATURES
Pursuant to the requirements of Section 13 or 15(d) of the Securities Exchange Act of 1934, the registrant has duly caused this report to be signed on its behalf by the undersigned, thereunto duly authorized, on the 27th day of February, 2020.
| THE TRADE DESK, INC. | ||||
|---|---|---|---|---|
| By: | /s/ BLAKE J. GRAYSON | |||
| Blake J. Grayson | ||||
| Chief Financial Officer |
POWER OF ATTORNEY
KNOW ALL PERSONS BY THESE PRESENTS, that each person whose signature appears below constitutes and appoints Jeff T. Green and Blake J. Grayson, jointly and severally, as his or her true and lawful attorneys-in-fact and agents, with full power of substitution and resubstitution, for him or her and in his or her name, place and stead, in any and all capacities, to sign any and all amendments to this Annual Report on Form 10-K, and to file the same, with all exhibits thereto, and other documents in connection therewith, with the Securities and Exchange Commission, granting unto said attorneys-in-fact and agents, and each of them, full power and authority to do and perform each and every act and thing requisite and necessary to be done in connection therewith, as fully to all intents and purposes as he or she might or could do in person, hereby ratifying and confirming that all said attorneys-in-fact and agents, or any of them or their or his or her substitute or substitutes, may lawfully do or cause to be done by virtue hereof.
Pursuant to the requirements of the Securities Exchange Act of 1934, this report has been signed below by the following persons on behalf of the registrant and in the capacities and on the dates indicated.
| Signature | Title | Date | |||
|---|---|---|---|---|---|
| /s/ JEFF T. GREEN | Chief Executive Officer, Director (principal | February 27, 2020 | |||
| Jeff T. Green | executive officer) | ||||
| /s/ BLAKE J. GRAYSON | Chief Financial Officer (principal financial | February 27, 2020 | |||
| Blake J. Grayson | officer and principal accounting officer) | ||||
| /s/ BRIAN J. STEMPECK | Chief Strategy Officer, Director | February 27, 2020 | |||
| Brian J. Stempeck | |||||
| /s/ LISE J. BUYER | Director | February 27, 2020 | |||
| Lise J. Buyer | |||||
| /s/ KATHRYN E. FALBERG | Director | February 27, 2020 | |||
| Kathryn E. Falberg | |||||
| /s/ THOMAS FALK | Director | February 27, 2020 | |||
| Thomas Falk | |||||
| /s/ ERIC B. PALEY | Director | February 27, 2020 | |||
| Eric B. Paley | |||||
| /s/ GOKUL RAJARAM | Director | February 27, 2020 | |||
| Gokul Rajaram | |||||
| /s/ DAVID B. WELLS | Director | February 27, 2020 | |||
| David B. Wells |