 filings.tools
Take-Two Interactive 10-K 2021-03-31
Filed 2021-05-19. 22 sections, 422K characters. Original on sec.gov · Markdown · JSON
Cover and table of contents
UNITED STATES
SECURITIES AND EXCHANGE COMMISSION
WASHINGTON, D.C. 20549
FORM 10-K
| ☒ | Annual Report Pursuant to Section 13 or 15(d) of the Securities Exchange Act of 1934 | ||||
| For the fiscal year ended March 31, 2021 | |||||
| OR | |||||
| ☐ | Transition Report Pursuant to Section 13 or 15(d) of the Securities Exchange Act of 1934 | ||||
| For the transition period from to . |
Commission file number 001-34003
TAKE-TWO INTERACTIVE SOFTWARE, INC.
(Exact name of registrant as specified in its charter)
| Delaware (State or Other Jurisdiction of Incorporation or Organization) | 51-0350842 (I.R.S. Employer Identification No.) | |||||||
| 110 West 44th Street New York, New York (Address of principal executive offices) | 10036 (Zip Code) |
Registrant's Telephone Number, Including Area Code: (646) 536-2842
Securities registered pursuant to Section 12(b) of the Act:
| Title of each class | Trading symbol | Name of each exchange on which registered | ||||||
| Common Stock, $.01 par value | TTWO | NASDAQ Global Select Market |
Securities registered pursuant to Section 12(g) of the Act: None
Indicate by check mark if the registrant is a well-known seasoned issuer, as defined in Rule 405 of the Securities Act. Yes ý No o
Indicate by check mark if the registrant is not required to file reports pursuant to Section 13 or Section 15(d) of the Act. Yes o No ý
Indicate by check mark whether the Registrant (1) has filed all reports required to be filed by Section 13 or 15(d) of the Securities Exchange Act of 1934 during the preceding 12 months (or for such shorter period that the registrant was required to file such reports), and (2) has been subject to such filing requirements for the past 90 days. Yes ý No o
Indicate by check mark whether the registrant has submitted electronically every Interactive Data File required to be submitted pursuant to Rule 405 of Regulation S-T (§232.405 of this chapter) during the preceding 12 months (or for such shorter period that the registrant was required to submit such files). Yes ý No o
Indicate by check mark whether the registrant is a large accelerated filer, an accelerated filer, a non-accelerated filer, a smaller reporting company, or an emerging growth company. See the definitions of "large accelerated filer," "accelerated filer," "smaller reporting company," and "emerging growth company" in Rule 12b-2 of the Exchange Act. (Check one):
| Large accelerated filer ý | Accelerated filer o | Non-accelerated filer o | Smaller reporting company ☐ | Emerging growth company ☐ |
If an emerging growth company, indicate by check mark if the registrant has elected not to use the extended transition period for complying with any new or revised financial accounting standards provided pursuant to Section 13(a) of the Exchange Act. o
Indicate by check mark whether the registrant has filed a report on and attestation to its management’s assessment of the effectiveness of its internal control over financial reporting under Section 404(b) of the Sarbanes-Oxley Act (15 U.S.C. 7262(b)) by the registered public accounting firm that prepared or issued its audit report. ý
Indicate by check mark whether the registrant is a shell company (as defined in Rule 12b-2 of the Exchange Act). Yes ☐ No ý
The aggregate market value of the voting and non-voting common equity held by non-affiliates computed by reference to the price at which the common equity was last sold, or the average bid and asked price of such common equity, as of the last business day of the Registrant's most recently completed second fiscal quarter was approximately $13,938,279,654.
As of May 5, 2021, there were 115,656,093 shares of the Registrant's Common Stock outstanding, net of treasury stock.
Documents Incorporated by Reference:
Portions of the registrant's definitive proxy statement for the 2021 Annual Meeting of Stockholders
are incorporated by reference into Part III herein.
INDEX
CAUTIONARY NOTE ABOUT FORWARD-LOOKING STATEMENTS
The statements contained herein which are not historical facts are considered forward-looking statements under federal securities laws and may be identified by words such as "anticipates," "believes," "estimates," "expects," "intends," "plans," "potential," "predicts," "projects," "seeks," "should," "will," or words of similar meaning and include, but are not limited to, statements regarding the outlook for Take-Two Interactive Software, Inc.'s ("Take-Two," the "Company," "we," "us," or similar pronouns) future business and financial performance. Such forward-looking statements are based on the current beliefs of our management as well as assumptions made by and information currently available to them, which are subject to inherent uncertainties, risks, and changes in circumstances that are difficult to predict. Actual outcomes and results may vary materially from these forward-looking statements based on a variety of risks and uncertainties including the uncertainty of the impact of the COVID-19 pandemic and measures taken in response thereto; the effect that measures taken to mitigate the COVID-19 pandemic have on our operations, including our ability to timely deliver our titles and other products, and on the operations of our counterparties, including retailers, including digital storefronts and platform partners, and distributors; the effects of the COVID-19 pandemic on consumer demand and the discretionary spending patterns of our customers; the impact of reductions in interest rates by the Federal Reserve and other central banks, including on our short-term investment portfolio; the impact of potential inflation; volatility in foreign currency exchange rates; as well as, but not limited to, the risks and uncertainties discussed under the heading "Risk Factors" included in Part I, Item 1A herein. All forward-looking statements are qualified by these cautionary statements and speak only as of the date they are made. The Company undertakes no obligation to update any forward-looking statement, whether as a result of new information, future events or otherwise.
PART I
Item 1. Business
General
We are a leading developer, publisher and marketer of interactive entertainment for consumers around the globe. We develop and publish products principally through Rockstar Games, 2K, Private Division, Social Point, and Playdots. Our products are currently designed for console gaming systems, including, but not limited to, the Sony Computer Entertainment, Inc. ("Sony") PlayStation®4 ("PS4") and PlayStation5 ("PS5"), Microsoft Corporation ("Microsoft") Xbox One® ("Xbox One") and Xbox Series X|S ("Xbox Series X|S"), and Nintendo's SwitchTM ("Switch"), as well as personal computers ("PC"), including smartphones and tablets. We deliver our products through physical retail, digital download, online platforms, and cloud streaming services.
Our website address is www.take2games.com. We make all of our filings with the Securities and Exchange Commission ("SEC") available free of charge on our website under the caption "Financial Information—SEC Filings." Included in these filings are our annual reports on Form 10-K, quarterly reports on Form 10-Q, current reports on Form 8-K and amendments to those reports, which are available as soon as reasonably practicable after we electronically file or furnish such materials with the SEC pursuant to Section 13(a) or 15(d) of the Securities Exchange Act of 1934. Our website and the information contained therein or connected thereto are not intended to be incorporated into this Annual Report on Form 10-K. The SEC maintains a website that contains annual, quarterly and current reports, proxy and information statements and other information that issuers (including the Company) file electronically with the SEC. The SEC's website is www.sec.gov.
Strategy
Overview. We endeavor to be the most creative, innovative and efficient company in our industry. Our core strategy is to capitalize on the popularity of video games by developing and publishing high-quality interactive entertainment experiences across a range of genres. We focus on building compelling entertainment franchises by publishing a select number of titles for which we can create sequels and incremental revenue opportunities through virtual currency, add-on content, and in-game purchases. Most of our intellectual property is internally owned and developed, which we believe best positions us financially and competitively. We have established a portfolio of proprietary software content for the major hardware platforms in a wide range of genres, including action, adventure, family/casual, role-playing, shooter, sports and strategy, which we distribute worldwide. We believe that our commitment to creativity and innovation is a distinguishing strength, enabling us to differentiate our products in the marketplace by combining advanced technology with compelling storylines and characters that provide unique gameplay experiences for consumers. We have created, acquired, or licensed a group of highly recognizable brands to match the broad consumer demographics that we serve, ranging from adults to children and game enthusiasts to casual gamers. Another cornerstone of our strategy is to support the success of our products in the marketplace through innovative marketing programs and global distribution on platforms and through channels that are relevant to our target audience.
Support World-Class Creative Teams. Creativity and innovation remain the core tenets of our organization and are the lifeblood of our ongoing success. We have 5,079 employees working in game development in studios around the world, including some of the most well-known names in the business. The creative teams at Rockstar Games and 2K are renowned for their consistent ability to deliver games that set new benchmarks for excellence. In addition, Private Division is dedicated to bringing titles from top independent developers to market, and Social Point and Playdots further enhance our development capabilities with a track record of producing multiple hits in the free-to-play mobile sector. Whether expanding our portfolio of franchises, launching new intellectual property, or providing innovative ways for audiences to remain captivated and engaged, we prioritize producing the highest quality entertainment experiences. We support our teams by focusing on talent retention and acquisition, and our label structure enables us to target distinct market segments and opportunities.
Focus on Core Strength of Producing High Quality Titles. We focus on publishing a select number of high-quality titles based on internally owned and developed intellectual properties. We currently own the intellectual property rights to 27 proprietary brands. In addition, we selectively develop titles based on licensed properties, including sports leagues, and also publish externally developed titles.
We use a product investment review process to evaluate potential titles for investment, to review existing titles in development, and to assess titles after release by measuring their performance in the market and the return on our investment. We apply this process to all of our products, whether internally or externally developed. The product investment review process includes reviews of each project at various stages of development by our executive management team and the senior management of our publishing labels and also includes coordination between our sales and marketing personnel before the launch of titles. This disciplined approach to product investment is expected to enhance the competitiveness and profitability of our titles.
We develop our products using a combination of our internal development teams and external development resources acting under contract with us. We typically select external developers based on their track record and expertise in developing products in the same category or genre. One developer will generally produce the same game for multiple platforms and will also produce sequels to the original game. We believe that selecting and using development resources in this manner allows us to leverage the particular expertise of our internal and external development resources, which is designed to maintain our quality standards for our products.
Leverage Emerging Technologies, Platforms, and Distribution Channels, Including Digitally Delivered Content. Interactive entertainment played online and on mobile platforms, such as tablets and smartphones, presents opportunities to enhance our growth and profitability. In addition, the interactive entertainment software industry is delivering a growing amount of content for traditional platforms through digital download. We provide a variety of digitally delivered products and offerings, which typically have a higher gross margin than physically delivered products. Virtually all of our titles that are available through retailers as packaged goods products are also available through direct digital download (from websites we own or third-party websites). We also publish an expanding variety of titles for tablets and smartphones, which are delivered to consumers through digital download. We will continue to invest in emerging opportunities in mobile and online gameplay, particularly for our wholly-owned franchises, as well as downloadable content and microtransactions that enable gamers to pay to download additional content to enhance their game playing experience. We aim to drive ongoing engagement and incremental revenue from recurrent consumer spending on our titles through virtual currency, add-on content, and in-game purchases.
Expand International Business. The global market for interactive entertainment continues to grow, and we seek to increase our presence internationally, particularly in Asia, the Middle East, and Latin America. We are continuing to execute on our growth initiatives in Asia, where our strategy is to broaden the distribution of our existing products and expand our online gaming presence, especially in China and South Korea. We are a direct publisher in Japan and South Korea. While we retain title to all intellectual property, in some regions, local publishers, under license agreements, are responsible for localization of software content, distribution, and marketing of the products in their respective local markets. We intend to continue to build on our licensing relationships and also continue to expand on distribution strategies to grow our international business.
Our Businesses
Our revenue is primarily derived from the sale of internally developed software titles and software titles developed by third parties. Operating margins are dependent in part upon our ability to release new, commercially successful software products and to manage effectively their development and marketing costs. We have internal development studios located in Australia, Canada, China, Czech Republic, Hungary, India, South Korea, Spain, the United Kingdom (U.K.), and the United States (U.S.). As of March 31, 2021, we had a research and development staff of 5,079 employees with the technical capabilities to develop software titles for all major consoles, PCs, and mobile platforms in multiple languages and territories.
Agreements with third-party developers generally give us exclusive publishing and marketing rights and require us to make development payments, pay royalties based on product sales, and satisfy other conditions. Development payments for software titles are typically recoupable against royalties otherwise due to developers based on software sales. Our agreements with third-party developers generally provide us with the right to monitor development efforts and to cease making development payments if specified development milestones are not satisfied. We also regularly monitor the level of development payments in light of the expected sales for the related titles.
We continue to engage in evolving business models such as online gaming, virtual currency, add-on content, and in-game purchases, and we expect to continue to generate incremental revenue from these opportunities.
Rockstar Games. Software titles published by our Rockstar Games label are primarily internally developed. We expect Rockstar Games, our wholly-owned publisher of the Grand Theft Auto, Max Payne, Midnight Club, Red Dead Redemption, and other popular franchises, to continue to be a leader in the action/adventure product category and to create groundbreaking entertainment. We believe that Rockstar Games has established a uniquely original, popular cultural phenomenon with its Grand Theft Auto series, which is the interactive entertainment industry's most iconic and critically acclaimed brand and has sold-in over 335 million units worldwide. The latest installment, Grand Theft Auto V, has sold-in over 145 million units worldwide and includes access to Grand Theft Auto Online. Red Dead Redemption 2, which has been a critical and commercial success that set numerous entertainment industry records, has sold-in more than 35 million units worldwide to date. Rockstar Games is also well known for developing brands in other genres, including the LA Noire, Bully, and Manhunt franchises. Rockstar Games continues to expand on our established franchises by developing sequels, offering downloadable episodes, and additional content.
2K. Our 2K label has published a variety of popular entertainment properties across all key platforms and across a range of genres including shooter, action, role-playing, strategy, sports and family/casual entertainment. We expect 2K to continue to develop new, successful franchises in the future. 2K's internally owned and developed franchises include the critically acclaimed, multi-million unit selling BioShock, Mafia, Sid Meier's Civilization, and XCOM series. 2K also publishes externally developed franchises such as Borderlands. 2K's realistic sports simulation titles include our flagship NBA 2K series, which continues to be the top-ranked NBA basketball video game, the WWE 2K professional wrestling series, and PGA TOUR 2K. In March 2020, 2K announced a multi-year partnership with the National Football League encompassing multiple future video games that will be non-simulation football game experiences.
Private Division. Our Private Division label is dedicated to bringing titles from the industry's leading creative talent to market and is the publisher and owner of Kerbal Space Program. Private Division also released The Outer Worlds and Ancestors: The Humankind Odyssey, based on new IP from renowned industry creative talent. Kerbal Space Program 2 is planned for release in fiscal year 2023.
Social Point. Social Point develops and publishes popular free-to-play mobile games that deliver high quality, deeply-engaging entertainment experiences, including its two most successful games, Dragon City and Monster Legends. In addition, Social Point has a robust development pipeline with a number of exciting games planned for launch in the coming years.
Playdots. On September 4, 2020, we acquired privately held Playdots, Inc. ("Playdots") for consideration having an acquisition date fair value of $195.5 million, consisting of $97.8 million in cash and the issuance of 0.6 million shares of our common stock. (See Note 22 - Acquisitions of our Consolidated Financial Statements.) Founded in 2013 and based in New York, New York, Playdots builds mobile games with unique and thoughtful designs. Playdots is best known for Two Dots, which has been downloaded over 80 million times since its launch six years ago and continues to deeply engage audiences throughout the world.
We are continuing to execute on our growth initiatives in Asia, where our strategy is to broaden the distribution of our existing products and establish an online gaming presence, especially in China and South Korea. 2K has secured a multi-year license from the NBA to develop an online version of our NBA simulation game in China, Taiwan, South Korea and Southeast Asia. NBA 2K Online, our free-to-play NBA simulation game, that is based on the console edition of NBA 2K, which was co-developed by 2K and Tencent, is the top online PC sports game in China with over 52 million registered users. We have released two iterations of NBA 2K Online and continue to enhance the title with new features.
We have expanded our relationship with the NBA through the NBA 2K League. This groundbreaking competitive gaming league is jointly owned by us and the NBA and consists of teams operated by actual NBA franchises. The NBA 2K League follows a professional sports league format: head-to-head competition throughout a regular season, followed by a bracketed playoff system and a finals match-up that was held in August in each of the NBA 2K League's first three seasons. The NBA 2K League's fourth season is set to take place in calendar year 2021.
Intellectual Property
Our business is highly dependent on the creation, acquisition, licensing and protection of intellectual property. The intellectual property rights we have created or acquired for our internally-owned portfolio of brands include BioShock, Bully, Carnival Games, Dragon City, Grand Theft Auto, Kerbal Space Program, L.A. Noire, Mafia, Manhunt, Max Payne, Midnight Club, Monster Legends, Red Dead, Sid Meier's Civilization, Two Dots, and XCOM. We believe that content ownership facilitates our internal product development efforts and maximizes profit potential. We attempt to protect our software and production techniques under copyright, patent, trademark and trade secret laws as well as through contractual restrictions on disclosure, copying and distribution.
We also enter into content license agreements, such as those with sports leagues, players associations, music labels and musicians. These licenses are typically limited to use of the licensed rights in products for specific time periods. In addition, we license and include console manufacturer technology in our products on a non-exclusive basis, which allows our games to be played on their respective hardware systems.
Manufacturing
Platform manufacturers, such as Sony, Microsoft, and Nintendo, either manufacture or control the selection of approved manufacturers of software products sold for use on their respective hardware platforms. We place a purchase order for the manufacture of our products with Sony, Nintendo, or Microsoft's approved replicator and then send software code to the manufacturer, together with related artwork, user instructions, warranty information, brochures and packaging designs for approval, defect testing and manufacture. Games are generally shipped within two to three weeks of receipt of our purchase order and all materials.
Our software titles typically carry a 90-day limited warranty.
Arrangements with Platform Manufacturers
We have entered into license agreements with Sony and Microsoft to develop and publish software in Asia, Australia, Europe, North America, and certain Latin American, Middle Eastern, and African countries. We are not required to obtain any licenses from hardware manufacturers to develop titles for the PC.
Sony. Effective March 23, 2017, we entered into a PlayStation Global Developer and Publisher Agreement with Sony Computer Entertainment, Inc. and certain of its affiliates, pursuant to which Sony granted us the right and license to develop, publish, have manufactured, market, advertise, distribute and sell PlayStation compatible products for all PlayStation systems. The agreement requires us to submit products to Sony for approval and for us to make royalty payments to Sony based on the number of units manufactured or revenue from digitally downloaded content. In addition, products for PlayStation systems are required to be manufactured by Sony-approved manufacturers. On September 30, 2020, we entered into a PlayStation 5 Amendment, with an effective date of May 1, 2020 (the “PS5 Amendment”), to our existing PlayStation Global Developer and Publisher Agreement. The PS5 Amendment amends the existing agreement to include the PlayStation 5 interactive entertainment system in the definition of systems in the agreement and to extend all of the terms and conditions of the existing agreement to our PlayStation 5 products and services.
The term of the agreement, as amended, expires on March 31, 2022, with automatic one-year renewal terms thereafter (unless one party gives the other notice of termination). Sony may terminate the agreement for any or no reason upon 30 days’ notice. The agreement may also be terminated by Sony immediately in the event of a breach by us or our bankruptcy or insolvency. Upon expiration or termination of the agreement, we have certain rights to sell off existing inventories.
Microsoft. Under the terms of the license agreements that we have entered into with Microsoft Corporation and its affiliates, Microsoft granted us the right and license to develop, publish, have manufactured, market, advertise, distribute and sell Xbox compatible products. The agreements require us to submit products to Microsoft for approval and to make royalty payments to Microsoft based on the number of units manufactured or revenue from digitally downloaded content. In addition, products for the Xbox consoles are required to be manufactured by Microsoft-approved manufacturers.
Effective as of November 17, 2005, we entered into an Xbox 360 Publisher License Agreement with Microsoft for the Xbox 360 console (the “Xbox 360 Agreement”). Effective as of July 1, 2020, we entered into an Xbox Console Publisher License Agreement with Microsoft for the Xbox Series X|S and Xbox One consoles (the “Xbox Next Gen Agreement” and together with Xbox 360 Agreement, the “Xbox Agreements”). The term of Xbox 360 Agreement expires on May 31, 2022, and the term of the Xbox Next Gen Agreement expires on March 31, 2023, each with automatic one-year renewal terms thereafter (unless one party gives the other advance notice of non-renewal). These Xbox Agreements may be terminated by Microsoft immediately in the event of a breach by us, and the Xbox Next Gen Agreement may also be terminated by Microsoft
immediately in the event of our bankruptcy or insolvency. Upon expiration or termination of each of the Xbox Agreements, we have certain rights to sell off existing inventories.
Sales
We sell software titles both physically and digitally through direct relationships with large retail customers, including digital storefronts and platform partners, and third-party distributors. Our top customers include, among others, Sony, Microsoft, Steam, GameStop, Epic, Apple, and Google. We sell our products globally and have sales operations in Australia, Canada, France, Germany, Japan, the Netherlands, New Zealand, Singapore, South Korea, Spain, Taiwan, the United Kingdom, and the United States.
We are dependent on a limited number of customers that account for a significant portion of our sales. Sales to our five largest customers during the fiscal year ended March 31, 2021 accounted for 78.4% of our net revenue, with Sony and Microsoft each accounting for more than 10.0% of our net revenue during the fiscal year ended March 31, 2021.
We also distribute our titles, add-on content, and in-game purchases through direct digital download to consoles and PCs, including smartphones and tablets. We view digital distribution as an important growth opportunity for our industry and Company; however, we expect that packaged goods and traditional retailers will continue to be a significant channel for the sale of our console products for the foreseeable future.
Marketing
Our marketing and promotional efforts are intended to maximize consumer interest in our titles, promote brand name recognition of our franchises, assist retailers and properly position, package and merchandise our titles. From time to time, we also receive marketing support from hardware manufacturers in connection with their own promotional efforts.
We market titles by:
-
Implementing public relations campaigns, using social, digital, online, television, outdoor, and print marketing, including certain performance marketing programs. We believe that we label and market our products in accordance with the applicable principles and guidelines of the Entertainment Software Rating Board, or the ESRB, an independent self-regulatory body that assigns ratings and enforces advertising guidelines for the interactive software industry.
-
Stimulating continued sales by reducing the wholesale prices of our products to retailers, digital storefronts, and platform providers at various times during the life of a product. Price protection may occur at any time in a product's life cycle, but typically occurs three to nine months after a product's initial launch. In certain international markets, we also provide volume rebates to stimulate continued product sales.
-
Employing various other marketing methods designed to promote consumer awareness, including social media, in-store promotions and point-of-purchase displays, direct mail, cooperative advertising, attendance at trade shows as well as product sampling through demonstration software distributed via the Internet or the digital online services.
As of March 31, 2021, we had a sales and marketing staff of 651 people.
Product Procurement
We procure products from suppliers principally using standard purchase orders based on our assessment of market demand. We carry inventory quantities that we believe are necessary to provide rapid response to retailer and distributor orders. We utilize electronic data interchange with many of our customers to enhance the efficiency of placing and shipping orders and receiving payments.
Competition
In our business, we compete with:
-
Other interactive entertainment companies, including those offering mobile games, that range in size and cost structure from very small with limited resources to very large with greater financial, marketing, technical, and other resources than ours. Examples of our competitors include Activision Blizzard, Inc., Electronic Arts Inc., and Ubisoft Entertainment S.A.
-
Sony, Microsoft, and Nintendo for the sale of interactive entertainment software. Each of these competitors is a large developer and marketer of software for their own platforms and has the financial resources to withstand significant price competition and to implement extensive advertising campaigns.
-
Other software, hardware, entertainment, and media for limited retail shelf space and promotional resources. The competition is intense among an increasing number of newly introduced entertainment software titles and hardware for adequate levels of shelf space and promotional support.
-
Other forms of entertainment such as motion pictures, television, social networking, online computer programs, and other forms of entertainment, which may be less expensive or provide other advantages to consumers.
Competition in the entertainment software industry is based on innovation, features, playability, product quality, brand name recognition, compatibility with popular platforms, access to distribution channels, price, marketing, and customer service. Our business is driven by hit titles, which require increasing budgets for development and marketing. For physical sales, competition for our titles is influenced by the timing of competitive product releases and the similarity of such products to our titles and may result in loss of shelf space or a reduction in sell-through of our titles at retail stores.
International Operations
International sales are a significant part of our business. For the fiscal years ended March 31, 2021, 2020 and 2019, we earned 40.2%, 42.5% and 46.5%, respectively, of our net revenue outside the United States. We are continuing to execute on our growth initiatives in Asia, where our strategy is to broaden the distribution of our existing products and expand our online gaming presence, especially in China and South Korea. We are subject to risks inherent in foreign trade, including increased credit risks, tariffs and duties, fluctuations in foreign currency exchange rates, shipping delays and international political, regulatory and economic developments, all of which can have a significant effect on our operating results. See Notes 1 and 2 to our Consolidated Financial Statements.
Segment and Geographic Information
We have one operating and reportable segment. See Notes 1, 2, and 9 to our Consolidated Financial Statements.
Human Capital
Human Capital Management. One of Take-Two’s most important assets is our people. With 6,495 full-time employees as of March 31, 2021, of which 3,341 were employed outside of the United States, we are constantly focused on our teams – their success, their structure and how best to support them given their particular needs and projects. 49% of our employees are located in North America, 35% in Europe, and 16% in the Asia-Pacific region; 77% of our employees are focused on product development.
Due to COVID-19, this past year was a challenging one for our employees, and, given the largely remote working environment, we implemented programs to make sure our people felt supported in their roles, providing enhanced manager training to help strengthen teams despite the physical distance, broadening our wellness and mental health offerings, encouraging people to step away from their screens when they could and spending a lot of time listening to employee feedback.
Despite the challenges of the pandemic, creativity and innovation remained the core tenets of our organization and the lifeblood of our ongoing success. The creative teams at our labels are renowned for their consistent ability to deliver games that set new benchmarks for excellence. We support our creative and corporate teams by focusing on talent retention and acquisition, including through: offering job development and skills training initiatives, extensive employee benefits and numerous well-being programs, and partnering with the leadership at our labels to foster the types of cultures our leaders believe best support and grow the creative processes for their particular teams.
Diversity, Equity, and Inclusion. We firmly believe that diverse teams are more valuable and effective, and that diversity is key to our success. We are committed to enhancing workforce diversity at Take-Two, and we strive to provide an inclusive workplace in which everyone feels respected, heard, and safe. We believe our culture of compassion and respect fosters a warm, welcoming environment for all qualified candidates and colleagues. Specific efforts we take include company-sponsored service projects in the communities in which we operate; providing financial and other support to organizations working to eradicate social and racial injustice as well as providing educational, athletic, and other opportunities to underserved communities; working with organizations to support the rights of the LGBTIQ community; endeavoring to expand the diversity of our industry’s candidate pool through scholarships to minority game design students and contributions to organizations providing STEM opportunities to children in underserved communities; delivering interview training and career counseling to young adults in those same communities; and celebrating cultural differences through various employee affinity groups and company events and offerings.
Talent Assessment & Development and Employee Experience. We strongly believe in internal growth opportunities and career development tracks. We also recognize the importance of our employees staying current in an ever-changing industry. To that end, our global Learning & Development team curates a wide variety of training materials and programs
targeting both hard skills development and career progression as well as programs in leadership development and employee round tables. Further, our compliance training program seeks to ensure that our employees recognize and report any signs of harassment, discrimination, retaliation, or other inappropriate behaviors in the workplace and that they understand and abide by our Code of Business Conduct and other internal policies.
Our learning and development programs are designed to be closely aligned with our performance management process and succession planning. Our formalized performance management process provides the platform for evaluating each individual employee’s contributions to the team and our success, with a focus on regular communication and transparency. We work hard to ensure that development opportunities are individually tailored and that all decisions regarding hiring, career progression, and compensation are based on qualifications, work ethic, and job performance.
Beyond formal performance management, we check in with our teams throughout the year with global town hall meetings, "pulse" surveys, culture assessments and team qualities and values workshops. The feedback generated through these tools helps to ensure we are providing a supportive, dynamic, and stimulating work environment for all of our employees. These efforts and more contributed to Take-Two being named one of The Wall Street Journal’s Best Managed US Companies in 2018, included among EM360’s Top 10 Companies with the Best Employee/Employer Relations in 2019, and listed on Fortune’s Great Places to Work list in 2019 and 2021 and Best Places to Work in NYC list in 2020.
Compensation and Benefits. The main objectives of our compensation and benefit programs are to attract, retain, motivate, and reward our employees, who operate in a highly competitive and technologically challenging environment. We offer competitive compensation packages designed to incentivize high individual and company performance. We regularly review our compensation and benefits packages from both an internal and external standpoint to ensure competitiveness, including through industry benchmarking analysis. We seek to link compensation (including annual changes in compensation) to our overall and business unit performance, as well as each individual’s contribution to the results achieved. The emphasis on our overall performance is intended to align our employees’ financial interests with the interests of our shareholders. In addition to awarding Restricted Stock Units to employees at certain levels, we also offer an Employee Stock Purchase Plan to further align the interests of our employees with our shareholders.
We also provide a comprehensive benefits package that includes traditional offerings, such as medical, dental vision, retirement, disability, accident and life insurance, prescription drugs, and leaves, and also includes programs such as well-being, fitness reimbursement, mental health benefits, mental health awareness training for Human Resources personnel and managers throughout the Company, and charitable giving with a company match. We have hosted 100+ company-wide bootcamps to promote physical fitness and employee comradery.
Item 1A. Risk Factors
Our business is subject to many risks and uncertainties, which may affect our future financial performance. Because of the risks and uncertainties described below, as well as other factors affecting our operating results and financial condition, past financial performance should not be considered to be a reliable indicator of future performance and our business and financial performance could be harmed and the market value of our securities could decline.
Risks relating to our business and industry
Our results of operations may be materially adversely impacted by the coronavirus pandemic (COVID-19).
Our results of operations may be materially adversely affected by COVID-19. The global spread of COVID-19 has created significant uncertainty, resulting in volatility and economic disruption. The extent to which COVID-19 has an impact on our business, operations, or financial results will depend on numerous evolving factors that we may not be able to accurately predict, including the duration and scope of the pandemic; governmental, business, and individuals’ actions that have been and continue to be taken in response to the pandemic; economic activity and related actions taken in response to the pandemic; the effect on consumer demand for our products and the discretionary spending patterns of our customers, including the ability of our customers to pay for our products; our ability to develop, market, and sell our products, including as a result of travel restrictions and people working from home; the impact on the operations of our counterparties, including the physical retail, digital download online platforms, and cloud streaming services we rely on for the distribution of our products, the suppliers who manufacture our physical products, and other third parties with which we partner (e.g. to market or ship our products); any closures of our, our customers', and counterparties' offices and facilities; additional volatility in exchange rates; the impact of potential inflation; and the impact of reductions in interest rates by the Federal Reserve and other central banks, including on our short-term investment portfolio.
Further, “shelter-in-place,” quarantine, or other such initiatives by governmental entities could also disrupt our operations. In such situations, if employees or third-party developers who cannot optimally perform their responsibilities from home are not able to or are unwilling to report to work, we may experience material interruptions in product development and delays in bringing products to market. Such circumstances may also impact the effectiveness of our quality controls and game testing measures. An increase in the number of employees working remotely also increases the potential adverse impact of risk associated with information technology systems and networks, including cyber-attacks, computer viruses, malicious software, security breach, and telecommunication failures, both for systems and networks we control directly and for those that employees and third-party developers rely on to work remotely. Any failure to prevent or mitigate security breaches or cyber risks or detect, or respond adequately to, a security breach or cyber risk, or any other disruptions to our information technology systems and networks, can have adverse effects on our business. The spread of COVID-19 has caused us to modify our business practices (including employee travel, employee work locations, and cancellation of physical participation in meetings, events and conferences), and we may take further actions as may be required by government authorities or that we determine are in the best interests of our employees, customers and business partners. Further, key personnel could contract COVID-19, hindering their availability and productivity.
Additionally, sports organizations' operations and seasons have and may be altered based on the response to COVID-19. Such events could affect the demand for our sports titles.
While we have developed and continue to develop plans to help mitigate the negative impact of the pandemic on our business, these efforts may not be effective, and a protracted economic downturn may limit the effectiveness of our mitigation efforts. Any of these considerations described above could cause or contribute to the risks described elsewhere herein and could materially adversely affect our business, financial condition, results of operations or stock price. Additionally, while we have seen increased demand for our products due to stay-at-home orders, the curtailment of certain other forms of entertainment, and other pandemic-related factors that make consumers more inclined to spend time at home, benefiting our financial results and operating metrics, the trends in fiscal year 2021 with respect to our revenues, net income, and other financial results and operating metrics may not be indicative of results for future periods, particularly if these pandemic-related factors become less significant.
We are dependent on the future success of our Grand Theft Auto products, and we must continue to publish "hit" titles or sequels to such "hit" titles in order to compete successfully in our industry.
Grand Theft Auto and certain of our other titles, such as Red Dead Redemption or NBA 2K, are "hit" products and have historically accounted for a substantial portion of our revenue. Grand Theft Auto products contributed 29.2% of our net revenue for the fiscal year ended March 31, 2021, and the five best-selling franchises (including Grand Theft Auto), which may change year over year, in the aggregate accounted for 84.1% of our net revenue for the fiscal year ended March 31, 2021. If we fail to continue to develop and sell new commercially successful "hit" titles or sequels to such "hit" titles or experience any delays in product releases or disruptions following the commercial release of our "hit" titles or their sequels, our revenue and profits may decrease substantially and we may incur losses. In addition, competition in our industry is intense and a relatively small number of hit titles account for a large portion of total revenue in our industry. Hit products offered by our competitors may take a larger share of consumer spending than we anticipate, which could cause revenue generated from our products to fall below our expectations. If our competitors develop more successful products or services at lower price points or based on payment models perceived as offering better value, or if we do not continue to develop consistently high quality and well-received products and services, our revenue and profitability may decline. In addition, both the online and mobile games marketplaces are characterized by frequent product introductions, relatively low barriers to entry, and new and evolving business methods, technologies and platforms for development. Widespread consumer adoption of these new platforms for games and other technological advances in and/or new business or payment models in online or mobile game offerings could negatively affect our sales of console and traditional PC products before we have an opportunity to develop profitable businesses in such markets.
The interactive entertainment software industry is highly competitive.
We compete for both licenses to properties and the sale of interactive entertainment software with Sony and Microsoft, each of which is a large developer and marketer of software for its own platforms. We also compete with game publishers, such as Activision Blizzard, Inc., Electronic Arts Inc., and Ubisoft Entertainment S.A. As our business is dependent upon our ability to develop hit titles, which require increasing budgets for development and marketing, the availability of significant financial resources has become a major competitive factor in developing and marketing software games. Some of our competitors have greater financial, technical, personnel, and other reso
Showing the first 8K of 88K characters. Open the full section
Item 1B. Unresolved Staff Comments
None.
Item 2. Properties
Our principal executive offices are located at 110 West 44th Street (also known as 1133 Avenue of the Americas), New York, New York, in approximately 76,000 square feet of space under a lease expiring in December 2032.
We also lease approximately 64,000 square feet of space under a lease expiring in March 2023 at 622 Broadway, New York, New York.
Take-Two Interactive Software Europe Ltd, our wholly-owned subsidiary, leases approximately 39,500 square feet of office space in London, United Kingdom, which expires in December 2034, and approximately 12,500 square feet of office space in Windsor, United Kingdom, which expires in January 2022. Rockstar North, our wholly-owned subsidiary, leases 72,000 square feet of office space in Edinburgh, Scotland, which expires in June 2024.
2K corporate offices and two development studios occupy approximately 123,000 square feet of leased office space in Novato, California. The lease expires in June 2023 with respect to approximately 59,000 square feet and July 2025 with respect to approximately 64,000 square feet.
In addition, our other subsidiaries lease office space in Sydney and Pyrmont, Australia; Halifax, Lunenburg, Oakville, Montreal and Parksville, Canada; Chengdu and Shanghai, China; Brno and Prague, Czech Republic; Paris, France; Munich, Germany; Budapest, Hungary; Bangalore, India; Dublin, Ireland; Tokyo, Japan; Mexico City, Mexico, Breda, Netherlands; Auckland, New Zealand; Singapore; Seoul, South Korea; Madrid and Barcelona, Spain; Luzerne, Switzerland; Taipei, Taiwan; Brighton, Dundee, London, Lincoln, Leeds, and Oxford, United Kingdom; and, in the United States: Agoura Hills, Carlsbad, Foothill Ranch, Petaluma, Moorpark, San Jose, and San Mateo California; Sparks, Maryland; Andover and Westwood, Massachusetts; Las Vegas, Nevada; Bethpage and New York, New York; Austin, Texas; and Kirkland and Seattle, Washington.
For information regarding our lease commitments, see Note 14 - Leases to our Consolidated Financial Statements.
Item 3. Legal Proceedings
Refer to Note 15 - Commitments and Contingencies to our Consolidated Financial Statements for disclosures regarding our legal proceedings.
Item 4. Mine Safety Disclosures
Not applicable.
PART II
Item 5. Market for Registrant's Common Equity, Related Stockholder Matters and Issuer Purchases of Equity Securities
Market Information and Holders
Our common stock trades on the NASDAQ Global Select Market under the symbol "TTWO." The number of record holders of our common stock was 61 as of May 6, 2021.
Dividend Policy
We have never declared or paid cash dividends. We currently anticipate that all future earnings will be retained to finance the growth of our business and we do not expect to declare or pay any cash dividends in the foreseeable future. The payment of dividends in the future is within the discretion of our Board of Directors and will depend upon future earnings, capital requirements and other relevant factors. Our Credit Agreement requires us to meet certain incurrence tests prior to paying a dividend. See "Liquidity and Capital Resources" under Item 7 for additional information on our Credit Agreement.
Securities Authorized for Issuance under Equity Compensation Plans
The table setting forth this information is included in Part III—Item 12, Security Ownership of Certain Beneficial Owners and Management and Related Stockholder Matters.
Stock Performance Graph
This performance graph shall not be deemed "filed" for purposes of Section 18 of the Exchange Act or otherwise subject to the liabilities under that Section, and shall not be deemed to be incorporated by reference into any filing of the Company under the Exchange Act or the Securities Act of 1933.
The following line graph compares, from March 31, 2016 through March 31, 2021, the cumulative total stockholder return on our common stock with the cumulative total return on the stocks comprising the NASDAQ Composite Index and the stocks comprising a peer group index consisting of Activision Blizzard, Inc. and Electronic Arts Inc. The comparison assumes $100 was invested on March 31, 2016 in our common stock and in each of the following indices and assumes reinvestment of all cash dividends, if any, paid on such securities. We have not paid any cash dividends and, therefore, our cumulative total return calculation is based solely upon stock price appreciation and not upon reinvestment of cash dividends. Historical stock price is not necessarily indicative of future stock price performance.
Comparison of 5 Year Cumulative Total Return*
Among Take-Two Interactive Software, Inc., the NASDAQ Composite Index and a Peer Group
March 2021
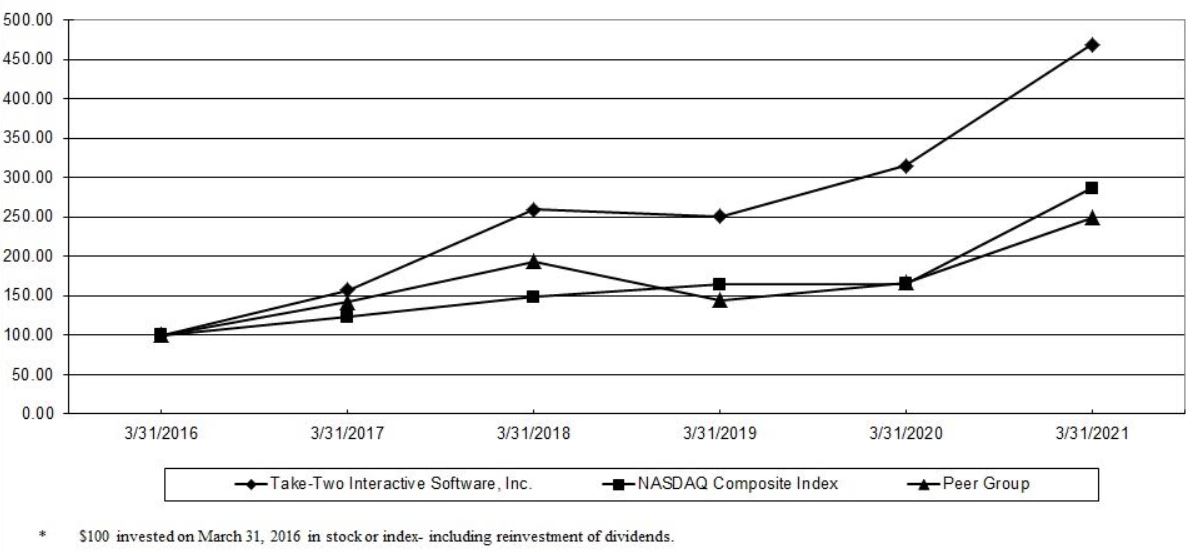
- The graph and chart assume that $100 was invested on March 31, 2016 in the applicable stock or index and that all dividends were reinvested.
| March 31, | |||||||||||||||||||||||||||||||||||
| 2016 | 2017 | 2018 | 2019 | 2020 | 2021 | ||||||||||||||||||||||||||||||
| Take-Two Interactive Software, Inc. | $ | 100.00 | $ | 157.34 | $ | 259.57 | $ | 250.52 | $ | 314.87 | $ | 469.07 | |||||||||||||||||||||||
| NASDAQ Composite Index | 100.00 | 122.88 | 148.39 | 164.16 | 165.30 | 286.62 | |||||||||||||||||||||||||||||
| Peer Group | 100.00 | 142.46 | 193.38 | 144.40 | 167.11 | 248.86 |
Issuer Purchases of Equity Securities
Share Repurchase Program—Our Board of Directors has authorized the repurchase of up to 14,217,683 shares of our common stock. Under this program, we may purchase shares from time to time through a variety of methods, including in the open market or through privately negotiated transactions, in accordance with applicable securities laws. Repurchases are subject to the availability of stock, prevailing market conditions, the trading price of the stock, our financial performance and other conditions. The program does not require us to repurchase shares and may be suspended or discontinued at any time for any reason.
During the fiscal years ended March 31, 2021, 2020, and 2019, we repurchased 0, 0, and 3,715,642 shares of our common stock in the open market, respectively, for $0.0 million, $0.0 million, and $362.4 million, respectively, including commissions, as part of the program. As of March 31, 2021, we had repurchased a total of 10,399,529 shares of our common stock under the program, and 3,818,154 shares of our common stock remained available for repurchase under the share repurchase program. All of the repurchased shares are classified as Treasury stock in our Consolidated Balance Sheets.
Summary Table—The table below details the share repurchases that were made by us during the three months ended March 31, 2021:
| Period | Shares purchased | Average price per share | Total number of shares purchased as part of publicly announced plans or programs | Maximum number of shares that may yet be purchased under the repurchase program | ||||||||||||||||||||||
| January 1 - 31, 2021 | — | — | — | 3,818 | ||||||||||||||||||||||
| February 1 - 28, 2021 | — | $ | — | — | 3,818 | |||||||||||||||||||||
| March 1 - 31, 2021 | — | $ | — | — | 3,818 |
Item 6. Selected Financial Data
Not applicable
Item 7. Management's Discussion and Analysis of Financial Condition and Results of Operations
Overview
Our Business
We are a leading developer, publisher, and marketer of interactive entertainment for consumers around the globe. We develop and publish products principally through Rockstar Games, 2K, Private Division, Social Point, and Playdots. Our products are currently designed for console gaming systems and PC, including smartphones and tablets. We deliver our products through physical retail, digital download, online platforms and cloud streaming services.
Trends and Factors Affecting our Business
Product Release Schedule. Our financial results are affected by the timing of our product releases and the commercial success of those titles. Our Grand Theft Auto products in particular have historically accounted for a significant portion of our revenue. Sales of Grand Theft Auto products generated 29.2% of our net revenue for the fiscal year ended March 31, 2021. The timing of our Grand Theft Auto product releases may affect our financial performance on a quarterly and annual basis.
Economic Environment and Retailer Performance. We continue to monitor economic conditions, including the impact of the COVID-19 pandemic, that may unfavorably affect our businesses, such as deteriorating consumer demand, pricing pressure on our products, credit quality of our receivables, and foreign currency exchange rates. The COVID-19 pandemic has affected and may continue to affect our business operations, including our employees, customers, partners, and communities, and there is substantial uncertainty in the nature and degree of its continued effects over time. During fiscal year 2021, as in the final quarter of fiscal year 2020, we noted a positive impact to our results that we believe was partly due to increased consumer engagement with our products because of the COVID-19 related business closures and movement restrictions, such as "shelter in place" and "lockdown" orders, implemented around the world, as well as the online accessibility and social nature of our products. However, we cannot be certain as to the duration of these effects, the impact of vaccination efforts or of the lifting of certain restrictions on them, and the potential offsetting impacts of deteriorating economic conditions and decreased consumer spending generally. We expect that engagement trends will continue to be notably higher than they were pre-pandemic; however, as the return to normalcy continues, we expect a moderation of the trends that benefited our industry over the past year. We have developed and continue to develop plans to help mitigate the negative impact of the pandemic on our business, such as our transition, based on our concern for the health and safety of our teams, to working from home for the vast majority of our teams over the last year, which to date has resulted in minimal disruption. However, despite largely positive outcomes to date, these efforts may ultimately not be effective, and a protracted economic downturn may limit the effectiveness of our mitigation efforts. Any of these considerations described above could cause or contribute to the risks described, above, in Item 1A of this Form 10-K and could materially adversely affect our business, financial condition, results of operations, or stock price. Therefore, the effects of COVID-19 may not be fully reflected in our financial results until future periods, and, at this time, we are not able to predict its ultimate impact on our business.
Additionally, our business is dependent upon a limited number of customers that account for a significant portion of our revenue. Our five largest customers accounted for 78.4%, 71.5% and 70.1% of net revenue during the fiscal years ended March 31, 2021, 2020 and 2019, respectively. As of March 31, 2021 and 2020, five customers comprised 77.6% and 58.1% of our gross accounts receivable, respectively, with our significant customers (those that individually comprised more than 10% of our gross accounts receivable balance) accounting for 69.2% and 48.8% of such balance at March 31, 2021 and 2020, respectively. We had two customers who accounted for 50.4% and 18.8% of our gross accounts receivable as of March 31, 2021 and two customers who accounted for 29.4% and 19.4% of our gross accounts receivable as of March 31, 2020. We did not have any additional customers that exceeded 10% of our gross accounts receivable as of March 31, 2021 and 2020. The economic environment has affected our customers in the past, and may do so in the future, including as a result of the COVID-19 pandemic. Bankruptcies or consolidations of our large retail customers could seriously hurt our business, due to uncollectible accounts receivables and the concentration of purchasing power among the remaining large retailers. The COVID-19 pandemic has led, and may continue to lead, to increased consolidation as larger, better capitalized competitors will be in a stronger position to withstand prolonged periods of economic downturn and sustain their business through the financial volatility. Certain of our large customers sell used copies of our games, which may negatively affect our business by reducing demand for new copies of our games. While the downloadable content that we now offer for certain of our titles may serve to reduce used game sales, we expect used game sales to continue to adversely affect our business.
Hardware Platforms. We derive most of our revenue from the sale of products made for video game consoles manufactured by third parties, which comprised 74.6% of our net revenue by product platform for the fiscal year ended
March 31, 2021. The success of our business is dependent upon the consumer acceptance of these platforms and the continued growth in the installed base of these platforms. When new hardware platforms are introduced, such as those released in November 2020 by Sony and Microsoft, demand for interactive entertainment used on older platforms typically declines, which may negatively affect our business during the market transition to the new consoles. The new Sony and Microsoft consoles provide "backwards compatibility" (i.e. the ability to play games for the previous generation of consoles), which could mitigate the risk of such a decline. However, we cannot be certain how backwards compatibility will affect demand for our products. Further, COVID-19 or other events, may impact the availability of these new consoles, which may also affect demand. We manage our product delivery on each current and future platform in a manner we believe to be most effective to maximize our revenue opportunities and achieve the desired return on our investments in product development. Accordingly, our strategy is to focus our development efforts on a select number of the highest quality titles for these platforms, while also expanding our offerings for other platforms such as tablets, smartphones, and online games.
Online Content and Digital Distribution. The interactive entertainment software industry is delivering a growing amount of content through digital online delivery methods. We provide a variety of online delivered products and offerings. Virtually all of our titles that are available through retailers as packaged goods products are also available through direct digital download (from websites we own and others owned by third parties) as well as a large selection of our catalog titles. In addition, we aim to drive ongoing engagement and incremental revenue from recurrent consumer spending on our titles through virtual currency, add-on content, and in-game purchases. We also publish an expanding variety of titles for tablets and smartphones, which are delivered to consumers through digital download. As disclosed in our "Results of Operations," below, net revenue from digital online channels comprised 86.6% of our net revenue for the fiscal year ended March 31, 2021. We expect online delivery of games and game offerings to continue to grow and to be the primary part of our business over the long term.
Content Release Highlights
During fiscal year 2021, we released new content for a number of our biggest franchises, including, but not limited to Grand Theft Auto Online, Red Dead Online, Borderlands, and Sid Meier’s Civilization. Our 2K label also released NBA 2K21 and PGA TOUR 2K21.
To date we have announced that, during fiscal year 2022, Rockstar Games will release Grand Theft Auto V for the PS5 and Xbox Series X|S, Private Division will release OlliOlli World digitally, and 2K will release NBA 2K22 and WWE 2K22. In addition, throughout the year, we expect our labels to deliver new content for our franchises. We will also continue to invest in opportunities that we believe will enhance and scale our business and have the potential to drive growth over the long-term.
Fiscal 2021 Financial Summary
Our Net revenue for fiscal year ended March 31, 2021 was led by titles from a variety of our top franchises, primarily NBA 2K; Grand Theft Auto Online and Grand Theft Auto V; Red Dead Redemption 2 and Red Dead Online; Borderlands 3, and our WWE 2K franchise*.* Our Net revenue increased to $3,372.8 million, an increase of $283.8 million or 9.2% compared to the fiscal year ended March 31, 2020.
For the fiscal year ended March 31, 2021, our Net income was $588.9 million, as compared to Net income of $404.5 million in the prior year, and includes the reversal of share-based compensation expense of $69.8 million due to forfeitures and a gain of $40.6 million due to primarily the sale of one of our investments. Diluted earnings per share for the fiscal year ended March 31, 2021 was $5.09, as compared to Diluted income per share of $3.54 for the fiscal year ended March 31, 2020. Our operating income for the fiscal year ended March 31, 2021 increased compared to the operating income for fiscal year ended March 31, 2020, due primarily to higher Gross profit, which was due primarily to higher revenue from the titles described above, lower capitalized software amortization as a percentage of net revenue, and lower internal royalties as a percentage of net revenue, partially offset by higher Operating expenses primarily due to higher headcount.
At March 31, 2021, we had $2,060.2 million of Cash and cash equivalents and Restricted cash and cash equivalents, compared to $1,993.4 million at March 31, 2020. The increase in Cash and cash equivalents and Restricted cash and cash equivalents from March 31, 2020 was due primarily to Net cash provided by operating activities from sales primarily from the previously mentioned titles*,* partially offset by investments in software development and licenses as well as royalty payments. This net increase was partially offset by (i) Net cash used in investing activities primarily related to changes in bank time deposits and net purchases of available for sale securities, our acquisition of Playdots, and purchases of fixed assets and (ii) Net cash used in financing activities, which was primarily related to tax payments related to net share settlements of our restricted stock.
Critical Accounting Policies and Estimates
Our most critical accounting policies, which are those that require significant judgment, include revenue recognition; price protection and allowances for returns; capitalization and recognition of software development costs and licenses; fair value estimates including valuation of goodwill, and intangible assets; valuation and recognition of stock-based compensation; and income taxes. See Note 1 - Basis of Presentation and Significant Accounting Policies in the Notes to our Consolidated Financial Statements in this Annual Report on Form 10-K.
Recently Adopted and Recently Issued Accounting Pronouncements
See Note 1 - Basis of Presentation and Significant Accounting Policies.
Operating Metric
Net Bookings
We monitor Net Bookings as a key operating metric in evaluating the performance of our business. Net Bookings is defined as the net amount of products and services sold digitally or sold-in physically during the period and includes licensing fees, merchandise, in-game advertising, strategy guides, and publisher incentives. Net Bookings were as follows:
| Fiscal Year Ended March 31, | |||||||||||||||||||||||
| 2021 | 2020 | Increase/(decrease) | Increase/(decrease) % | ||||||||||||||||||||
| Net Bookings | $ | 3,552,598 | $ | 2,990,358 | $ | 562,240 | 18.8 | % |
For the fiscal year ended March 31, 2021, Net Bookings increased by $562.2 million as compared to the prior year due primarily to increases in Net Bookings from our NBA 2K franchise, Grand Theft Auto Online and Grand Theft Auto V, our Mafia franchise, PGA TOUR 2K21, which released in August 2020, Two Dots, which was part of our Playdots acquisition completed in September 2020*,* and Dragon City, partially offset by a decrease in Net Bookings from Borderlands 3, which released in September 2019, and The Outer Worlds, which released in October 2019*.*
Results of Operations
In this section, we discuss the results of our operations for the fiscal year ended March 31, 2021 compared to the fiscal year ended March 31, 2020. For the comparison of fiscal year 2020 to fiscal year 2019, refer to Part II, Item 7 “Management’s Discussion and Analysis of Financial Condition and Results of Operations” of our Annual Report on Form 10-K for the year ended March 31, 2020.
The following table sets forth, for the periods indicated, our statements of operations, net revenue by geographic region, net revenue by platform, net revenue by distribution channel, and net revenue by content type:
| Fiscal Year Ended March 31, | ||||||||||||||||||||||||||||||||||||||
| 2021 | 2020 | 2019 | ||||||||||||||||||||||||||||||||||||
| Net revenue | $ | 3,372,772 | 100.0 | % | $ | 3,088,970 | 100.0 | % | $ | 2,668,394 | 100.0 | % | ||||||||||||||||||||||||||
| Cost of goods sold | 1,535,085 | 45.5 | % | 1,542,450 | 49.9 | % | 1,523,644 | 57.1 | % | |||||||||||||||||||||||||||||
| Gross profit | 1,837,687 | 54.5 | % | 1,546,520 | 50.1 | % | 1,144,750 | 42.9 | % | |||||||||||||||||||||||||||||
| Selling and marketing | 444,985 | 13.2 | % | 458,424 | 14.8 | % | 391,400 | 14.7 | % | |||||||||||||||||||||||||||||
| General and administrative | 390,683 | 11.6 | % | 318,235 | 10.3 | % | 281,234 | 10.5 | % | |||||||||||||||||||||||||||||
| Research and development | 317,311 | 9.4 | % | 296,398 | 9.6 | % | 230,170 | 8.6 | % | |||||||||||||||||||||||||||||
| Depreciation and amortization | 55,596 | 1.6 | % | 48,113 | 1.6 | % | 40,232 | 1.5 | % | |||||||||||||||||||||||||||||
| Business reorganization | (272) | — | % | 83 | — | % | (4,958) | (0.2) | % | |||||||||||||||||||||||||||||
| Total operating expenses | 1,208,303 | 35.8 | % | 1,121,253 | 36.3 | % | 938,078 | 35.2 | % | |||||||||||||||||||||||||||||
| Income from operations | 629,384 | 18.7 | % | 425,267 | 13.8 | % | 206,672 | 7.7 | % | |||||||||||||||||||||||||||||
| Interest and other, net | 8,796 | 0.3 | % | 38,505 | 1.2 | % | 26,113 | 1.0 | % | |||||||||||||||||||||||||||||
| Gain (loss) on long-term investments, net | 39,636 | 1.2 | % | (5,333) | (0.2) | % | — | — | % | |||||||||||||||||||||||||||||
| Income before income taxes | 677,816 | 20.1 | % | 458,439 | 14.8 | % | 232,785 | 8.7 | % | |||||||||||||||||||||||||||||
| Provision for (benefit from) income taxes | 88,930 | 2.6 | % | 53,980 | 1.7 | % | (101,052) | (3.8) | % | |||||||||||||||||||||||||||||
| Net income | $ | 588,886 | 17.5 | % | $ | 404,459 | 13.1 | % | $ | 333,837 | 12.5 | % |
| Fiscal Year Ended March 31, | ||||||||||||||||||||||||||||||||||||||
| 2021 | 2020 | 2019 | ||||||||||||||||||||||||||||||||||||
| Net revenue by geographic region: | ||||||||||||||||||||||||||||||||||||||
| United States | $ | 2,015,885 | 59.8 | % | $ | 1,775,682 | 57.5 | % | $ | 1,426,906 | 53.5 | % | ||||||||||||||||||||||||||
| International | 1,356,887 | 40.2 | % | 1,313,288 | 42.5 | % | 1,241,488 | 46.5 | % | |||||||||||||||||||||||||||||
| Net revenue by platform: | ||||||||||||||||||||||||||||||||||||||
| Console | $ | 2,516,993 | 74.6 | % | $ | 2,308,602 | 74.7 | % | 2,233,861 | 83.7 | % | |||||||||||||||||||||||||||
| PC and other | 855,779 | 25.4 | % | 780,368 | 25.3 | % | 434,533 | 16.3 | % | |||||||||||||||||||||||||||||
| Net revenue by distribution channel: | ||||||||||||||||||||||||||||||||||||||
| Digital online | $ | 2,919,292 | 86.6 | % | $ | 2,378,563 | 77.0 | % | 1,681,609 | 63.0 | % | |||||||||||||||||||||||||||
| Physical retail and other | 453,480 | 13.4 | % | 710,407 | 23.0 | % | 986,785 | 37.0 | % | |||||||||||||||||||||||||||||
| Net revenue by content: | ||||||||||||||||||||||||||||||||||||||
| Recurrent consumer spending | $ | 2,074,687 | 61.5 | % | 1,384,999 | 44.8 | % | 1,070,916 | 40.1 | % | ||||||||||||||||||||||||||||
| Full game and other | 1,298,085 | 38.5 | % | $ | 1,703,971 | 55.2 | % | $ | 1,597,478 | 59.9 | % |
Fiscal Years ended March 31, 2021 and 2020
| (thousands of dollars) | 2021 | % of net revenue | 2020 | % of net revenue | Increase/(decrease) | % Increase/(decrease) | ||||||||||||||||||||||||||||||||
| Net revenue | $ | 3,372,772 | 100.0 | % | $ | 3,088,970 | 100.0 | % | $ | 283,802 | 9.2 | % | ||||||||||||||||||||||||||
| Internal royalties | 637,652 | 18.9 | % | 483,697 | 15.7 | % | 153,955 | 31.8 | % | |||||||||||||||||||||||||||||
| Software development costs and royalties(1) | 396,797 | 11.8 | % | 611,198 | 19.8 | % | (214,401) | (35.1) | % | |||||||||||||||||||||||||||||
| Licenses | 260,721 | 7.7 | % | 170,408 | 5.5 | % | 90,313 | 53.0 | % | |||||||||||||||||||||||||||||
| Product costs | 239,915 | 7.1 | % | 277,147 | 9.0 | % | (37,232) | (13.4) | % | |||||||||||||||||||||||||||||
| Cost of goods sold | 1,535,085 | 45.5 | % | 1,542,450 | 49.9 | % | (7,365) | (0.5) | % | |||||||||||||||||||||||||||||
| Gross profit | $ | 1,837,687 | 54.5 | % | $ | 1,546,520 | 50.1 | % | $ | 291,167 | 18.8 | % |
(1) Includes $8,707 and $154,031 of stock-based compensation expense in 2021 and 2020, respectively.
For the fiscal year ended March 31, 2021, net revenue increased by $283.8 million, as compared to the prior year. The increase was due primarily to an increase in net revenue of (i) $378.6 million from our NBA 2K franchise*,* (ii) $267.4 million from Grand Theft Auto Online and Grand Theft Auto V, (iii) $75.5 million from our Mafia franchise, (iv) $65.0 million from PGA TOUR 2K21, which released in August 2020, (vi) $24.1 million from Dragon City, and (vii) $20.5 million from Two Dots, which was part of our Playdots. acquisition completed in September 2020*.* These increases were offset by a decrease in net revenue of (i) $226.4 million from Borderlands 3, which released in September 2019, (ii) $217.8 million from Red Dead Redemption 2, which released on PC in November 2019, and (iii) $124.7 million from The Outer Worlds, which released in October 2019.
Net revenue from console games increased by $208.4 million and accounted for 74.6% of our total net revenue in the fiscal year ended March 31, 2021, as compared to 74.7% in the prior year. The increase was due to an increase in net revenue from our NBA 2K franchise, Grand Theft Auto Online, PGA TOUR 2K21, and our Mafia franchise, partially offset by a decrease in net revenue from Red Dead Redemption 2, Borderlands 3, and The Outer Worlds. Net revenue from PC and other increased by $75.4 million and accounted for 25.4% of our total net revenue in the fiscal year ended March 31, 2021, as compared to 25.3% in the prior year. The increase was due to an increase in net revenue from Grand Theft Auto V and Grand Theft Auto Online, our NBA 2K franchise, Dragon City, Two Dots, and our Mafia franchise, partially offset by a decrease in net revenue from Borderlands 3 and The Outer Worlds.
Net revenue from digital online channels increased by $540.7 million and accounted for 86.6% of our total net revenue for the fiscal year ended March 31, 2021, as compared to 77.0% in the prior year. The increase was due to an increase in net revenue from our NBA 2K franchise, Grand Theft Auto Online and Grand Theft Auto V, our Mafia franchise, and PGA TOUR 2K21, partially offset by a decrease in net revenue from Borderlands 3, The Outer Worlds, and Red Dead Redemption 2. Net revenue from physical retail and other channels decreased by $256.9 million and accounted for 13.4% of our total net revenue for the fiscal year ended March 31, 2021, as compared to 23.0% for the prior year. The decrease was due to a decrease in net revenue from Red Dead Redemption 2, Borderlands 3, and The Outer Worlds, partially offset by an increase in net revenue from our Mafia franchise and PGA TOUR 2K21.
Recurrent consumer spending is generated from ongoing consumer engagement and includes revenue from virtual currency, add-on content, and in-game purchases. Net revenue from recurrent consumer spending increased by $689.7 million and accounted for 61.5% of net revenue for the fiscal year ended March 31, 2021, as compared to 44.8% for the prior year. The increase was due to an increase in net revenue from our NBA 2K franchise, Grand Theft Auto Online and Grand Theft Auto V,
Civilization VI, Dragon City and Two Dots. Net revenue from full game and other decreased by $405.9 million and accounted for 38.5% of net revenue for the fiscal year ended March 31, 2021, as compared to 55.2% for the prior year. The decrease was due to a decrease in net revenue from Borderlands 3, Red Dead Redemption 2, and The Outer Worlds, partially offset by an increase in net revenue from our Mafia franchise, and PGA TOUR 2K21.
Gross profit as a percentage of net revenue for the fiscal year ended March 31, 2021 was 54.5%, as compared to 50.1% in the prior year. The percentage increase was due primarily to lower capitalized software amortization as a percentage of net revenue based on the timing of releases and a reversal of stock-based compensation expense as a result of forfeited awards (see Note 17 - Stock-Based Compensation), partially offset by higher internal royalties as a percentage of net revenue due to the timing of when royalties are earned, and product mix.
Net revenue earned outside of the United States increased by $43.6 million and accounted for 40.2% of our total net revenue in the fiscal year ended March 31, 2021, as compared to 42.5% in the prior year. The increase in net revenue outside of the United States was due to an increase in net revenue from Grand Theft Auto Online and Grand Theft Auto V, our NBA 2K franchise, and our Mafia franchise*,* partially offset by a decrease in net revenue from Red Dead Redemption 2 and Borderlands 3. Changes in foreign currency exchange rates increased net revenue and gross profit by $11.2 million and $7.5 million, respectively, in the fiscal year ended March 31, 2021 as compared to the prior year.
Operating Expenses
| (thousands of dollars) | 2021 | % of net revenue | 2020 | % of net revenue | Increase/(decrease) | % Increase/(decrease) | ||||||||||||||||||||||||||||||||
| Selling and marketing | $ | 444,985 | 13.2 | % | $ | 458,424 | 14.8 | % | $ | (13,439) | (2.9) | % | ||||||||||||||||||||||||||
| General and administrative | 390,683 | 11.6 | % | 318,235 | 10.3 | % | 72,448 | 22.8 | % | |||||||||||||||||||||||||||||
| Research and development | 317,311 | 9.4 | % | 296,398 | 9.6 | % | 20,913 | 7.1 | % | |||||||||||||||||||||||||||||
| Depreciation and amortization | 55,596 | 1.6 | % | 48,113 | 1.6 | % | 7,483 | 15.6 | % | |||||||||||||||||||||||||||||
| Business reorganization | (272) | — | % | 83 | — | % | (355) | (427.7) | % | |||||||||||||||||||||||||||||
| Total operating expenses | $ | 1,208,303 | 35.8 | % | $ | 1,121,253 | 36.3 | % | $ | 87,050 | 7.8 | % |
Includes stock-based compensation expense, which was allocated as follows (in thousands):
| 2021 | 2020 | |||||||||||||
| Selling and marketing | $ | 18,348 | $ | 18,680 | ||||||||||
| General and administrative | $ | 56,830 | $ | 53,607 | ||||||||||
| Research and development | $ | 26,587 | $ | 31,563 | ||||||||||
Foreign currency exchange rates increased total operating expenses by $9.7 million in the fiscal year ended March 31, 2021 as compared to the prior year.
Selling and marketing
Selling and marketing expenses decreased by $13.4 million in the fiscal year ended March 31, 2021 as compared to the prior year, due primarily to $49.1 million in lower overall marketing expenses due primarily to less spend on Borderlands 3 and Red Dead Redemption 2, partially offset by marketing expenses for Two Dots with no comparable costs in the prior year period. The net decrease was partially offset by an increase in personnel expenses, primarily due to increased headcount.
General and administrative
General and administrative expenses increased by $72.4 million for the fiscal year ended March 31, 2021, as compared to the prior year, due primarily to increases in (i) personnel expenses for additional headcount and higher incentive compensation, (ii) charitable contributions made in connection with our COVID-19 pandemic response and relief efforts, (iii) professional fees related to consulting, including for our acquisition of Playdots and our offer to acquire Codemasters Group Holdings PLC, and (iv) IT expenses, primarily for cloud-based services.
General and administrative expenses for the fiscal years ended March 31, 2021 and 2020 include occupancy expense (primarily rent, utilities and office expenses) of $27.5 million and $25.9 million, respectively, related to our development studios.
Research and development
Research and development expenses increased by $20.9 million for the fiscal year ended March 31, 2021, as compared to the prior year, due primarily to increased personnel expense due to increased headcount.
Depreciation and amortization
Depreciation and amortization expenses increased by $7.5 million for the fiscal year ended March 31, 2021, as compared to the prior year, due primarily to an increase in IT infrastructure and leasehold improvements for new office locations.
Business Reorganization
During the fiscal year ended March 31, 2021, business reorganization expense decreased by $0.4 million as compared to the prior year period and was not material.
Interest and other, net
| (thousands of dollars) | 2021 | % of net revenue | 2020 | % of net revenue | Increase/(decrease) | % Increase/(decrease) | ||||||||||||||||||||||||||||||||
| Interest income | $ | 18,701 | 0.6 | % | $ | 47,341 | 1.5 | % | $ | (28,640) | (60.5) | % | ||||||||||||||||||||||||||
| Interest expense | (6,207) | (0.2) | % | (2,637) | (0.1) | % | (3,570) | 135.4 | % | |||||||||||||||||||||||||||||
| Foreign currency exchange gain (loss) | 727 | — | % | (3,589) | (0.1) | % | 4,316 | (120.3) | % | |||||||||||||||||||||||||||||
| Other | (4,425) | (0.1) | % | (2,610) | (0.1) | % | (1,815) | 69.5 | % | |||||||||||||||||||||||||||||
| Interest and other, net | $ | 8,796 | 0.3 | % | $ | 38,505 | 1.2 | % | $ | (29,709) | (77.2) | % |
Interest and other, net was income of $8.8 million for the fiscal year ended March 31, 2021, as compared to income of $38.5 million for the fiscal year ended March 31, 2020. The decrease was due primarily to a $28.6 million decrease in interest income due to lower interest rates.
Gain/(loss) on long-term investments, net
Gain/(loss) on long-term investments, net for the fiscal year ended March 31, 2021 was a gain of $39.6 million compared to a loss of $5.3 million in the prior year period and was due primarily to the sale of one of our investments (see Note 4 - Fair Value Measurements).
Provision for income taxes
Our income tax expense was $88.9 million for the fiscal year ended March 31, 2021 as compared to $54.0 million for the fiscal year ended March 31, 2020.
When compared to the statutory rate of 21%, the effective tax rate of 13.1% for the fiscal year ended March 31, 2021 was due primarily to a $29.1 million tax benefit from tax credits anticipated to be utilized, a $21.4 million tax benefit from our geographic mix of earnings and $13.7 million in excess tax benefits from employee stock compensation.
When compared to the statutory rate of 21%, the effective tax rate of 11.8% for the fiscal year ended March 31, 2020 was primarily due to a $37.9 million tax benefit from tax credits anticipated to be utilized, $12.7 million from our geographic mix of earnings, $11.9 million due to a net deferred tax asset arising from a step up in tax basis related to the Federal Act on Tax Reform and AVH (Old-Age and Survivors Insurance) Financing ("TRAF") enacted in Switzerland during the fiscal year, discussed below, $9.2 million in changes in unrecognized tax benefits primarily due to audit settlements, and $8.4 million in excess tax benefits from employee stock compensation. These benefits were partially offset by tax expense of $19.8 million from the reversal of net deferred tax benefits relating to the Altera case.
The effective tax rate in the current year was higher compared to the prior year primarily due to decreased tax benefits related to the one time creation of the net deferred tax asset related to TRAF offset by decreased expense associated with the reversal of net deferred tax benefits relating to the Altera case.
The accounting for share-based compensation will increase or decrease our effective tax rate based upon the difference between our share-based compensation expense and the deductions taken on our tax return, which depends on the stock price at the time of the employee award vesting. Since we recognize excess tax benefits on a discrete basis, we anticipate that our effective tax rate will vary from quarter to quarter depending on our stock price in each period.
We anticipate that additional excess tax benefits or shortfalls from employee stock compensation, tax credits, and changes in our geographic mix of earnings could have a significant impact on our effective tax rate in the future. In addition, we are regularly examined by domestic and foreign taxing authorities. Examinations may result in tax assessments in excess of amounts claimed and the payment of additional taxes. We believe our tax positions comply with applicable tax law, and that we have adequately provided for reasonably foreseeable tax assessments. It is possible that settlement of audits or the expiration of the statute of limitations could have an impact on our effective tax rate in future periods.
On March 11, 2021, The American Rescue Plan Act of 2021 (“ARPA”) was signed into law. ARPA includes several revenue-raising and business provisions. One such provision that impacts the Company is the expansion of the limitation of compensation deductions for certain covered employees of publicly held corporations. Effective April 1, 2027, ARPA expanded the limitation to cover the next five most highly compensated employees. As of March 31, 2021, ARPA did not have a material impact on our Consolidated Financial Statements.
On March 27, 2020, the U.S. enacted the Coronavirus Aid, Relief and Economic Security Act (the "CARES Act"), which provides numerous tax and other stimulus measures that generally support the U.S. economy. The CARES Act did not have a material impact on our Consolidated Financial Statements.
On May 19, 2019, a public referendum held in Switzerland approved the TRAF, which was effective for us on January 1, 2020. The TRAF abolished preferential tax regimes for holding companies, domicile companies, and mixed companies at the cantonal level. The TRAF allows the cantons to establish transition rules, the implementation of which may be subject to a ruling from the canton. For the fiscal year ended March 31, 2020, we recorded a deferred tax asset of $45.3 million offset by a valuation allowance of $33.4 million arising from the Swiss cantonal tax basis step-up.
As of March 31, 2021, we had gross unrecognized tax benefits, including interest and penalties, of $167.6 million, of which $62.6 million would affect our effective tax rate if realized. For the fiscal year ended March 31, 2021, gross unrecognized tax benefits increased by $33.3 million.
We are no longer subject to audit for U.S. federal income tax returns for periods prior to our fiscal year ended March 31, 2018 and state income tax returns for periods prior to the fiscal year ended March 31, 2017. With few exceptions, we are no longer subject to income tax examinations in non-U.S. jurisdictions for years prior to fiscal year ended March 31, 2016. Certain taxing authorities are currently examining our income tax returns for the fiscal years ended March 31, 2015 through March 31, 2019.
Net income and earnings per share
For the fiscal year ended March 31, 2021, our net income was $588.9 million, as compared to $404.5 million in the prior year. Diluted earnings per share for the fiscal year ended March 31, 2021 was $5.09, as compared to $3.54 for the fiscal year ended March 31, 2020. Diluted weighted average shares outstanding of 115.7 million were 1.6 million higher due primarily to normal stock compensation activity, including vests as well as grants and forfeitures in the prior year being fully outstanding in the current year.
Liquidity and Capital Resources
Our primary cash requirements have been to fund (i) the development, manufacturing and marketing of our published products, (ii) working capital, (iii) acquisitions and (iv) capital expenditures. We expect to rely on cash and cash equivalents as well as on short-term investments, funds provided by our operating activities, and our Credit Agreement to satisfy our working capital needs.
Short-term Investments
As of March 31, 2021, we had $1,308.7 million of short-term investments, which are highly liquid in nature and represent an investment of cash that is available for current operations. From time to time, we may purchase additional short-term investments depending on future market conditions and liquidity needs. As of March 31, 2021, based on the composition of our investment portfolio and actions by central banks around the world to cut interest rates, including the U.S. Federal Reserve, in response to the COVID-19 pandemic and related adverse economic conditions, we anticipate investment yields to remain low, which would lower our future interest income. Such impact is not expected to be material to our liquidity.
Credit Agreement
On February 8, 2019, we entered into an unsecured Credit Agreement (the “Credit Agreement”) that runs through February 8, 2024. The Credit Agreement provides for an unsecured five-year revolving credit facility with commitments of $200 million, including sublimits for (i) the issuance of letters of credit in an aggregate face amount of up to $25 million and (ii) borrowings and letters of credit denominated in Pounds Sterling, Euros and Canadian Dollars in an aggregate principal amount of up to $25 million. In addition, the Credit Agreement contains uncommitted incremental capacity permitting the incurrence of up to an additional $250 million in term loans or revolving credit facilities. Loans under the Credit Agreement will bear interest at a margin of (a) 0.125% to 0.750% above a certain base rate (3.25% at March 31, 2021), or (b) 1.125% to 1.750% above LIBOR (approximately 1.10% at March 31, 2021), which margins are determined by reference to our consolidated total net leverage ratio.
As of March 31, 2021, there was $197.9 million available to borrow under the Credit Agreement and we had $2.1 million of letters of credit outstanding. At March 31, 2021, we had no outstanding borrowings under the Credit Agreement.
The Credit Agreement also includes, among other terms and conditions, maximum leverage ratio, minimum cash reserves and, in certain circumstances, minimum interest coverage ratio financial covenants, as well as limitations on the Company’s and each of its subsidiaries’ ability to create, incur, assume or be liable for indebtedness; dispose of assets outside the ordinary course; acquire, merge or consolidate with or into another person or entity; create, incur or allow any lien on any of its property; make investments; or pay dividends or make distributions, in each case subject to certain exceptions. In addition, the Credit Agreement provides for certain events of default such as nonpayment of principal and interest when due thereunder, breaches of representations and warranties, noncompliance with covenants, acts of insolvency and default on indebtedness held by third parties (subject to certain limitations and cure periods).
Financial Condition
We are subject to credit risks, particularly if any of our receivables represent a limited number of customers or are concentrated in foreign markets. If we are unable to collect our accounts receivable as they become due, it could adversely affect our liquidity and working capital position.
Generally, we have been able to collect our accounts receivable in the ordinary course of business. We do not hold any collateral to secure payment from customers. We have trade credit insurance on the majority of our customers to mitigate accounts receivable risk.
A majority of our trade receivables are derived from sales to major retailers, including digital storefronts and platform partners, and distributors. Our five largest customers accounted for 78.4%, 71.5%, and 70.1% of net revenue during the fiscal years ended March 31, 2021, 2020, and 2019, respectively. As of March 31, 2021 and 2020, five customers accounted for 77.6% and 58.1% of our gross accounts receivable, respectively. Customers that individually accounted for more than 10% of our gross accounts receivable balance comprised 69.2% and 48.8% of such balances at March 31, 2021 and 2020, respectively. We had two customers who accounted for 50.4% and 18.8% of our gross accounts receivable as of March 31, 2021 and two customers who accounted for 29.4%, and 19.4% of our gross accounts receivable as of March 31, 2020. We did not have any additional customers that exceeded 10% of our gross accounts receivable as of March 31, 2021 and 2020. Based upon performing ongoing credit evaluations, maintaining trade credit insurance on a majority of our customers and our past collection experience, we believe that the receivable balances from these largest customers do not represent a significant credit risk, although we actively monitor each customer's creditworthiness and economic conditions that may affect our customers' business and access to capital. We are monitoring the current global economic conditions, including credit markets and other factors as it relates to our customers in order to manage the risk of uncollectible accounts receivable, including as a result of the COVID-19 pandemic.
We believe our current cash and cash equivalents, short-term investments and projected cash flow from operations, along with availability under our Credit Agreement will provide us with sufficient liquidity to satisfy our cash requirements for working capital, capital expenditures, and commitments on both a short-term and long-term basis. Our liquidity and capital resources were not materially affected by the COVID-19 pandemic and related volatility and slowdown in the global financial markets to date. For further discussion regarding the potential future impacts of the COVID-19 pandemic and related economic conditions on our business, refer to Item 1A, Risk Factors.
As of March 31, 2021, the amount of cash and cash equivalents held outside of the U.S. by our foreign subsidiaries was $321.1 million. These balances are dispersed across various locations around the world. We believe that such dispersion meets the business and liquidity needs of our foreign affiliates. In addition, we expect to have the ability to generate sufficient cash domestically to support ongoing operations for the foreseeable future.
The Tax Cuts and Jobs Act, as enacted in December 2017, includes a number of provisions, which generally establish a territorial-style system for taxing foreign income of domestic multinational corporations. Our current intention is to reinvest indefinitely the earnings of our foreign subsidiaries, and, therefore, we have not recorded any material tax liabilities associated with the repatriation of foreign earnings.
Our Board of Directors has authorized the repurchase of up to 14.2 million shares of our common stock. Under this program, we may purchase shares from time to time through a variety of methods, including in the open market or through privately negotiated transactions, in accordance with applicable securities laws. Repurchases are subject to the availability of stock, prevailing market conditions, the trading price of the stock, our financial performance and other conditions. The program does not require us to repurchase shares and may be suspended or discontinued at any time for any reason.
During the fiscal years ended March 31, 2021, 2020, and 2019, we repurchased zero, zero, and 3.7 million shares of our common stock, respectively, in the open market for $0.0 million, $0.0 million, and $362.4 million, respectively, including
commissions as part of the program. As of March 31, 2021, we had repurchased a total of 10.4 million shares of our common stock under the program, and 3.8 million shares of our common stock remained available for repurchase under the share repurchase program.
Our changes in cash flows were as follows:
| Fiscal Year Ended March 31, | ||||||||||||||||||||
| (thousands of dollars) | 2021 | 2020 | 2019 | |||||||||||||||||
| Net cash provided by operating activities | $ | 912,318 | $ | 685,678 | $ | 843,515 | ||||||||||||||
| Net cash (used in) provided by investing activities | (806,724) | 4,049 | (223,576) | |||||||||||||||||
| Net cash used in financing activities | (57,338) | (77,453) | (463,685) | |||||||||||||||||
| Effects of foreign currency exchange rates on cash, cash equivalents, and restricted cash and cash equivalents | 18,599 | (10,868) | (10,639) | |||||||||||||||||
| Net change in cash, cash equivalents, and restricted cash and cash equivalents | $ | 66,855 | $ | 601,406 | $ | 145,615 |
At March 31, 2021, we had $2,060.2 million of Cash, cash equivalents, and Restricted cash and cash equivalents, compared to $1,993.4 million at March 31, 2020. The increase in Cash, cash equivalents, and Restricted cash and cash equivalents from March 31, 2020 was due primarily to Net cash provided by operating activities from sales primarily from the previously mentioned titles*,* partially offset by investments in software development and licenses as well as royalty payments. This net increase was partially offset by (i) Net cash used in investing activities primarily related to changes in bank time deposits and net purchases of available for sale securities, our acquisition of Playdots, and purchases of fixed assets and (ii) Net cash used in financing activities, which was primarily related to tax payments related to net share settlements of our restricted stock.
Commitments
Refer to Note 15 - Commitments and Contingencies to our Consolidated Financial Statements for disclosures regarding our commitments.
Capital Expenditures
In fiscal year 2022, we anticipate capital expenditures to be $100 million.
Off-Balance Sheet Arrangements
As of March 31, 2021 and 2020, we did not have any material relationships with unconsolidated entities or financial parties, such as entities often referred to as structured finance or variable interest entities, which would have been established for the purpose of facilitating off-balance sheet arrangements or other contractually narrow or limited purposes. As such, we are not exposed to any financing, liquidity, market or credit risk that could arise if we had engaged in such relationships.
International Operations
Net revenue earned outside of the United States is principally generated by our operations in Europe, Asia, Australia, Canada and Latin America. For the fiscal years ended March 31, 2021, 2020 and 2019, 40.2%, 42.5% and 46.5%, respectively, of our net revenue was earned outside the United States. We are subject to risks inherent in foreign trade, including increased credit risks, tariffs and duties, fluctuations in foreign currency exchange rates, shipping delays and international political, regulatory and economic developments, all of which can have a significant effect on our operating results.
Fluctuations in Quarterly Operating Results and Seasonality
We have experienced fluctuations in quarterly and annual operating results as a result of the timing of the introduction of new titles, variations in sales of titles developed for particular platforms, market acceptance of our titles, development and promotional expenses relating to the introduction of new titles, sequels or enhancements of existing titles, projected and actual changes in platforms, the timing and success of title introductions by our competitors, product returns, changes in pricing policies by us and our competitors, the accuracy of retailers' forecasts of consumer demand, the size and timing of acquisitions, the timing of orders from major customers, and order cancellations and delays in product shipment. Sales of our products are also seasonal, with peak demand typically occurring in the fourth calendar quarter during the holiday season. For certain of our software products with multiple performance obligations, we defer the recognition of our net revenue over an estimated service period which generally ranges from six to fifteen months. As a result, the quarter in which we generate the highest net bookings may be different from the quarter in which we recognize the highest amount of net revenue. Quarterly comparisons of operating results are not necessarily indicative of future operating results.
Item 7A. Quantitative and Qualitative Disclosures About Market Risk
Market risk is the potential loss arising from fluctuations in market rates and prices. Our market risk exposures primarily include fluctuations in interest rates and foreign currency exchange rates.
Interest Rate Risk
Our exposure to fluctuations in interest rates relates primarily to our short-term investment portfolio and variable rate debt under the Credit Agreement.
We seek to manage our interest rate risk by maintaining a short-term investment portfolio that includes corporate bonds with high credit quality and maturities less than two years. Since short-term investments mature relatively quickly and can be reinvested at the then current market rates, interest income on a portfolio consisting of short-term securities is more subject to market fluctuations than a portfolio of longer-term maturities. However, the fair value of a short-term portfolio is less sensitive to market fluctuations than a portfolio of longer-term securities. We do not currently use derivative financial instruments in our short-term investment portfolio. Our investments are held for purposes other than trading.
As of March 31, 2021, we had $1,308.7 million of short-term investments, which included $729.9 million of available-for-sale securities. The available-for-sale securities were recorded at fair market value with unrealized gains or losses resulting from changes in fair value reported as a separate component of accumulated other comprehensive income (loss), net of tax, in stockholders' equity. We also had $1,422.9 million of cash and cash equivalents that are comprised primarily of money market funds and bank-time deposits. We determined that, based on the composition of our investment portfolio, there was no material interest rate risk exposure to our Consolidated Financial Statements or liquidity as of March 31, 2021.
Historically, fluctuations in interest rates have not had a significant effect on our operating results. Under our Credit Agreement, loans will bear interest at a rate of (a) 0.250% to 0.750% above a certain base rate (3.25% at March 31, 2021) or (b) 1.125% to 1.750% above LIBOR (approximately 1.10% at March 31, 2021), which rates are determined by reference to our consolidated total net leverage ratio. Changes in market rates may affect our future interest expense if there is an outstanding balance on our line of credit. At March 31, 2021, there were no outstanding borrowings under our Credit Agreement.
Foreign Currency Exchange Rate Risk
We transact business in foreign currencies and are exposed to risks resulting from fluctuations in foreign currency exchange rates. Accounts relating to foreign operations are translated into United States dollars using prevailing exchange rates at the relevant period end. Translation adjustments are included as a separate component of stockholders' equity on our Consolidated Balance Sheets. For the fiscal years ended March 31, 2021 and 2020, our foreign currency translation adjustment was a gain of $51.3 million and a loss of $27.4 million, respectively. We recognized a foreign currency exchange transaction gain of $0.7 million, a loss of $3.6 million, and a loss of $0.5 million for the fiscal years ended March 31, 2021, 2020, and 2019, respectively, in Interest and other, net in our Consolidated Statements of Operations.
Balance Sheet Hedging Activities
We use foreign currency forward contracts to mitigate foreign currency exchange rate risk associated with non-functional currency denominated cash balances and inter-company funding loans, non-functional currency denominated accounts receivable and non-functional currency denominated accounts payable. These transactions are not designated as hedging instruments and are accounted for as derivatives whereby the fair value of the contracts is reported as either assets or liabilities on our Consolidated Balance Sheets, and gains and losses resulting from changes in the fair value are reported in interest and other, net, in our Consolidated Statements of Operations. We do not enter into derivative financial contracts for speculative or trading purposes. At March 31, 2021, we had $92.1 million of forward contracts outstanding to buy foreign currencies in exchange for U.S. dollars and $140.5 million of forward contracts outstanding to sell foreign currencies in exchange for U.S. dollars all of which have maturities of less than one year. At March 31, 2020, we had $52.6 million of forward contracts outstanding to buy foreign currencies in exchange for U.S. dollars and $122.0 million of forward contracts outstanding to sell foreign currencies in exchange for U.S. dollars all of which have maturities of less than one year. For the fiscal years ended March 31, 2021, 2020 and 2019, we recorded a loss of $3.6 million, a loss of $1.0 million, and a gain of $16.8 million, respectively, related to foreign currency forward contracts in Interest and other, net on our Consolidated Statements of Operations. As of March 31, 2021 and 2020, the fair value of these outstanding forward contracts was a loss of $0.1 million and a loss $0.0 million, respectively, and is included in accrued and other current liabilities. The fair value of these outstanding forward contracts is estimated based on the prevailing exchange rates of the various hedged currencies as of the end of the period.
Our hedging programs are designed to reduce, but do not entirely eliminate, the effect of currency exchange rate movements. We believe the counterparties to these foreign currency forward contracts are creditworthy multinational
commercial banks and that the risk of counterparty nonperformance is not material. Notwithstanding our efforts to mitigate some foreign currency exchange rate risks, there can be no assurance that our hedging activities will adequately protect us against the risks associated with foreign currency fluctuations, which may be more volatile as a result of COVID-19. For the fiscal year ended March 31, 2021, 40.2% of our revenue was generated outside the United States. Using sensitivity analysis, a hypothetical 10% increase in the value of the U.S. dollar against all currencies would decrease revenue by 4.0%, while a hypothetical 10% decrease in the value of the U.S. dollar against all currencies would increase revenue by 4.0%. In the opinion of management, a substantial portion of this fluctuation would be offset by cost of goods sold and operating expenses incurred in local currency.
Item 8. Financial Statements and Supplementary Data
The financial statements and supplementary data appear in a separate section of this Form 10-K following Part IV. We provide details of our valuation and qualifying accounts in Note 21 - Supplementary Financial Information to our Consolidated Financial Statements. All schedules have been omitted since the information required to be submitted has been included on our Consolidated Financial Statements or notes thereto or has been omitted as not applicable or not required.
Item 9. Changes in and Disagreements with Accountants on Accounting and Financial Disclosure
None.
Item 9A. Controls and Procedures
Definition and Limitations of Disclosure Controls and Procedures
Our disclosure controls and procedures (as defined in Rules 13a-15(e) and 15d-15(e) under the Securities Exchange Act of 1934, as amended (the "Exchange Act")) are designed to reasonably ensure that information required to be disclosed in our reports filed under the Exchange Act is (i) recorded, processed, summarized, and reported within the time periods specified in the Securities and Exchange Commission's rules and forms and (ii) accumulated and communicated to management, including our principal executive officer and principal financial officer, as appropriate, to allow timely decisions regarding required disclosures.
There are inherent limitations to the effectiveness of any system of disclosure controls and procedures. These limitations include the possibility of human error, the circumvention or overriding of the controls and procedures and reasonable resource constraints. In addition, because we have designed our system of controls based on certain assumptions, which we believe are reasonable, about the likelihood of future events, our system of controls may not achieve its desired purpose under all possible future conditions. Accordingly, our disclosure controls and procedures provide reasonable assurance, but not absolute assurance, of achieving their objectives.
Evaluation of Disclosure Controls and Procedures
Our management, with the participation of our principal executive officer and principal financial officer, has evaluated the effectiveness of our disclosure controls and procedures at March 31, 2021, the end of the period covered by this report. Based on this evaluation, the principal executive officer and principal financial officer concluded that, at March 31, 2021, our disclosure controls and procedures were effective to provide reasonable assurance that information required to be disclosed by us in the reports that we file or submit under the Exchange Act is (i) recorded, processed, summarized, and reported on a timely basis, and (ii) accumulated and communicated to management, including our principal executive officer and principal financial officer, as appropriate to allow timely decisions regarding required disclosures.
Management's Report on Internal Control Over Financial Reporting
Our management is responsible for establishing and maintaining adequate internal control over financial reporting (as defined in Rule 13a-15(f) under the Exchange Act). Management conducted an evaluation of the effectiveness of our internal control over financial reporting based on the criteria set forth in Internal Control—Integrated Framework issued by the Committee of Sponsoring Organizations of the Treadway Commission 2013 framework ("COSO"). Based on this evaluation, management has concluded that our internal control over financial reporting was effective as of March 31, 2021.
In accordance with SEC guidance, our management’s assessment of and conclusion on the effectiveness of internal control over financial reporting did not include the internal controls of Playdots, which we acquired in September 2020 and is included in the March 31, 2021 Consolidated Financial Statements and constituted 3.2% of consolidated total assets as of March 31, 2021.
Our independent registered public accounting firm, Ernst & Young LLP, has issued an audit report on our internal control over financial reporting, which is included in this Form 10-K.
Changes in Internal Control Over Financial Reporting
There were no changes in our internal control over financial reporting during the fiscal quarter ended March 31, 2021, which were identified in connection with management's evaluation required by paragraph (d) of Rules 13a-15 and 15d-15 under the Exchange Act, that have materially affected, or are reasonably likely to materially affect, our internal control over financial reporting. We have not experienced any material impact to our internal controls over financial reporting despite the fact that most of our employees are working remotely due to the COVID-19 pandemic. We are continually monitoring and assessing the effect of the COVID-19 situation on our internal controls to minimize the impact on their design and operating effectiveness.
On September 4, 2020, we acquired Playdots. We are currently in the process of incorporating the internal controls and procedures of Playdots into our internal control over financial reporting for purposes of our assessment of and report on internal control over financial reporting for the fiscal year ending March 31, 2022.
Item 9B. Other Information
None.
PART III
Item 10. Directors, Executive Officers and Corporate Governance
The information required by this Item is incorporated herein by reference to the sections entitled "Proposal 1—Election of Directors" and "Executive Compensation—Section 16(a) Beneficial Ownership Reporting Compliance" in our definitive Proxy Statement (the "Proxy Statement") for the Annual Meeting of Stockholders to be held in 2021. We intend to file the Proxy Statement within 120 days after the end of the fiscal year (i.e. on or before July 29, 2021). Our Code of Business Conduct and Ethics applicable to our directors and all employees, including senior financial officers, is available on our website at www.take2games.com. If we make any amendment to our Code of Business Conduct and Ethics that is required to be disclosed pursuant to the Exchange Act, we will make such disclosures on our website.
Item 11. Executive Compensation
The information required by this Item is incorporated herein by reference to the section entitled "Executive Compensation" in our Proxy Statement.
Item 12. Security Ownership of Certain Beneficial Owners and Management and Related Stockholder Matters
The information required by this Item is incorporated herein by reference to the sections entitled "Voting Security Ownership of Certain Beneficial Owners and Management" and "Equity Compensation Plan Information" in our Proxy Statement.
Item 13. Certain Relationships and Related Transactions, and Director Independence
The information required by this Item is incorporated herein by reference to the section entitled "Certain Relationships and Related Transactions" in our Proxy Statement.
Item 14. Principal Accounting Fees and Services
The information required by this Item is incorporated herein by reference to the section entitled "Independent Auditor Fee Information" in our Proxy Statement.
PART IV
Item 15. Exhibits, Financial Statement Schedules
(a)The following documents are filed as part of this Report:
(i)Financial Statements. See Index to Financial Statements on page 44 of this Report.
(ii)Financial Statement Schedule. See Note 21 - Supplementary Financial Information to our Consolidated Financial Statements.
(iii)Index to Exhibits:
† Schedules omitted pursuant to item 601(b)(2) of Regulation S-K. The Company agrees to furnish supplementally a copy of any omitted schedule to the SEC upon its request.
+ Represents a management contract or compensatory plan or arrangement.
*Portions thereof were omitted and filed separately with the Securities and Exchange Commission pursuant to a request for confidential treatment that was granted in accordance with Exchange Act Rule 24b-2.
** Portions of this exhibit have been redacted in compliance with Regulation S-K Item 601(b)(10).
Attached as Exhibit 101 to this report are the following formatted in XBRL (Extensible Business Reporting Language): (i) Consolidated Balance Sheets at March 31, 2021 and 2020, (ii) Consolidated Statements of Operations for the fiscal years ended March 31, 2021, 2020 and 2019, (iii) Consolidated Statements of Comprehensive Income for the fiscal years ended March 31, 2021, 2020 and 2019, (iv) Consolidated Statements of Cash Flows for the fiscal years ended March 31, 2021, 2020 and 2019, (v) Consolidated Statements of Stockholders' Equity for the fiscal years ended March 31, 2021, 2020 and 2019, and (vi) Notes to the Consolidated Financial Statements.
Item 16. Form 10-K Summary
Not applicable.
TAKE-TWO INTERACTIVE SOFTWARE, INC.
FISCAL YEAR ENDED MARCH 31, 2021
INDEX TO FINANCIAL STATEMENTS
| Page | |||||
| Reports of Independent Registered Public Accounting Firm | 44 | ||||
| Consolidated Balance Sheets—At March 31, 2021 and 2020 | 48 | ||||
| Consolidated Statements of Operations—For the fiscal years ended March 31, 2021, 2020 and 2019 | 49 | ||||
| Consolidated Statements of Comprehensive Income—For the fiscal years ended March 31, 2021, 2020 and 2019 | 50 | ||||
| Consolidated Statements of Cash Flows—For the fiscal years ended March 31, 2021, 2020 and 2019 | 51 | ||||
| Consolidated Statements of Stockholders' Equity—For the fiscal years ended March 31, 2021, 2020 and 2019 | 52 | ||||
| Notes to the Consolidated Financial Statements | 53 |
(All other items in this report are inapplicable)
Report of Independent Registered Public Accounting Firm
To the Stockholders and the Board of Directors of Take-Two Interactive Software, Inc.
Opinion on the Financial Statements
We have audited the accompanying consolidated balance sheets of Take-Two Interactive Software, Inc. (the Company) as of March 31, 2021 and 2020, the related consolidated statements of operations, comprehensive income, cash flows, and stockholders’ equity for each of the three years in the period ended March 31, 2021, and the related notes (collectively referred to as the “consolidated financial statements”). In our opinion, the consolidated financial statements present fairly, in all material respects, the financial position of the Company at March 31, 2021 and 2020, and the results of its operations and its cash flows for each of the three years in the period ended March 31, 2021, in conformity with U.S. generally accepted accounting principles.
We also have audited, in accordance with the standards of the Public Company Accounting Oversight Board (United States) (PCAOB), the Company's internal control over financial reporting as of March 31, 2021, based on criteria established in Internal Control-Integrated Framework issued by the Committee of Sponsoring Organizations of the Treadway Commission (2013 framework) and our report dated May 18, 2021 expressed an unqualified opinion thereon.
Adoption of ASU No. 2016-02
As discussed in Note 1 to the consolidated financial statements, the Company changed its method of accounting for leases effective April 1, 2019 due to the adoption of Accounting Standards Update (ASU) No. 2016-02, Leases (Topic 842) and the related amendments.
Basis for Opinion
These financial statements are the responsibility of the Company's management. Our responsibility is to express an opinion on the Company’s financial statements based on our audits. We are a public accounting firm registered with the PCAOB and are required to be independent with respect to the Company in accordance with the U.S. federal securities laws and the applicable rules and regulations of the Securities and Exchange Commission and the PCAOB.
We conducted our audits in accordance with the standards of the PCAOB. Those standards require that we plan and perform the audit to obtain reasonable assurance about whether the financial statements are free of material misstatement, whether due to error or fraud. Our audits included performing procedures to assess the risks of material misstatement of the financial statements, whether due to error or fraud, and performing procedures that respond to those risks. Such procedures included examining, on a test basis, evidence regarding the amounts and disclosures in the financial statements. Our audits also included evaluating the accounting principles used and significant estimates made by management, as well as evaluating the overall presentation of the financial statements. We believe that our audits provide a reasonable basis for our opinion.
Critical Audit Matters
The critical audit matters communicated below are matters arising from the current period audit of the financial statements that were communicated or required to be communicated to the audit committee and that: (1) relate to accounts or disclosures that are material to the financial statements and (2) involved our especially challenging, subjective, or complex judgments. The communication of critical audit matters does not alter in any way our opinion on the consolidated financial statements, taken as a whole, and we are not, by communicating the critical audit matters below, providing separate opinions on the critical audit matters or on the accounts or disclosures to which they relate.
| Revenue recognition | |||||
| Description of the Matter | As described in Note 1 to the consolidated financial statements, a significant portion of the Company’s revenue recognized is for full game software products that management must evaluate to determine whether such products sold have distinct and separable performance obligations. Such performance obligations can be licenses for intellectual property that provide a functional offline gaming experience or game related services. If multiple performance obligations are identified, management must estimate a standalone selling price for each identified performance obligation which is used to allocate the full game software product transaction price. Revenue for amounts allocated to offline functionality is recognized upon delivery of the product. Separately, revenue for amounts allocated to the game related services is recognized ratably over an estimated service period. Significant judgment is exercised by the Company in identifying performance obligations within its full game software products that should be accounted for separately in each revenue arrangement, estimating the standalone selling price for each performance obligation and determining the service period that should be utilized to recognize revenue over time. Auditing the identification of performance obligations for full game software products requires complex auditor judgment as each full game software product has unique features that management must evaluate to determine whether each feature should be accounted for separately. Auditing the judgments and estimates made by management in determining the standalone selling prices for each identified performance obligation is especially challenging as the Company typically does not have observable standalone selling prices for each performance obligation and must rely on an expected cost-plus margin methodology, taking into account relevant cost assumptions including estimates of post-release support. Similarly, auditing the estimated service period for the game related services is especially challenging as the Company must consider a variety of data points. Such data points include the weighted average number of days between players’ first and last days played online, known online trends, the service periods of the Company’s previously released products, and, to the extent publicly available, the service periods of the Company’s competitors’ products that are similar in nature. | ||||
| How We Addressed the Matter in Our Audit | We obtained an understanding, evaluated the design and te |
Showing the first 8K of 185K characters. Open the full section