 filings.tools
Item 5. MARKET FOR REGISTRANT’S COMMON EQUITY, RELATED STOCKHOLDER MATTERS AND ISSUER PURCHASES OF EQUITY SECURITIES.
5K characters. Original on sec.gov · Markdown
Item 5. MARKET FOR REGISTRANT’S COMMON EQUITY, RELATED STOCKHOLDER MATTERS AND ISSUER PURCHASES OF EQUITY SECURITIES.
Our common stock is traded on the New York Stock Exchange under the symbol “TYL.” At December 31, 2019, we had approximately 1,215 stockholders of record. Most of our stockholders hold their shares in street name; therefore, there are substantially more than 1,215 beneficial owners of our common stock.
We did not pay any cash dividends in 2019 or 2018. Our bank credit agreement contains restrictions on the payment of cash dividends. We intend to retain earnings for use in the operation and expansion of our business and do not anticipate paying a cash dividend in the foreseeable future.
The following table summarizes certain information related to our stock incentive plan, restricted stock units and our employee stock purchase plan. There are no warrants or rights related to our equity compensation plans as of December 31, 2019.
| Number of securities to be issued upon exercise of outstanding options, warrants, purchase rights and vesting of restricted stock units as of December 31, 2019 | Weighted average exercise price of outstanding options and unvested restricted stock units | Number of securities remaining available for future issuance under equity compensation plans (excluding securities reflected in initial column as of December 31, 2019) | |||||||
| Plan Category | |||||||||
| Equity compensation plans approved by security shareholders: | |||||||||
| 2018 Incentive Stock Plan | 4,052,461 | $ | 155.92 | 3,097,303 | |||||
| Employee Stock Purchase Plan | 9,681 | 255.02 | 701,837 | ||||||
| Equity compensation plans not approved by security shareholders | — | — | — | ||||||
| 4,062,142 | $ | 156.15 | 3,799,140 |
As of December 31, 2019, we had authorization to repurchase up to approximately 2.6 million additional shares of Tyler common stock. During 2019, we purchased approximately 72,000 shares of our common stock for an aggregate purchase price of $14.3 million.
A summary of the repurchase activity during 2019 is as follows:
| Period | Total number of shares repurchased | Additional number of shares authorized that may be repurchased | Average price paid per share | Maximum number of shares that may be repurchased under current authorization | |||||||||
| Three months ended March 31 | 71,793 | 1,500,000 | $ | 199.03 | 2,620,925 | ||||||||
| Three months ended June 30 | — | — | — | 2,620,925 | |||||||||
| Three months ended September 30 | — | — | — | 2,620,925 | |||||||||
| October 1 through October 31 | — | — | — | 2,620,925 | |||||||||
| November 1 through November 30 | — | — | — | 2,620,925 | |||||||||
| December 1 through December 31 | — | — | — | 2,620,925 | |||||||||
| 71,793 | 1,500,000 | $ | 199.03 |
In February 2019, our board of directors authorized the repurchase of an additional 1.5 million of Tyler common stock. The repurchase program, which was approved by our board of directors, was announced in October 2002 and was amended at various times from 2003 through 2019. There is no expiration date specified for the authorization, and we intend to repurchase stock under the program from time to time.
As of February 19, 2020, we had remaining authorization to repurchase up to 2.6 million additional shares of our common stock.
Performance Graph
The following Performance Graph and related information shall not be deemed “soliciting material” or to be “filed” with the Securities and Exchange Commission, nor shall such information be incorporated by reference into any future filing under the Securities Act of 1933 or Securities Exchange Act of 1934, each as amended, except to the extent that we specifically incorporate it by reference into such filing.
The following table compares total shareholder returns for Tyler over the last five years to the Standard and Poor’s 500 Stock Index and the Standard and Poor’s 600 Information Technology Index assuming a $100 investment made on December 31, 2014. Each of the three measures of cumulative total return assumes reinvestment of dividends. The stock performance shown on the graph below is not necessarily indicative of future price performance.
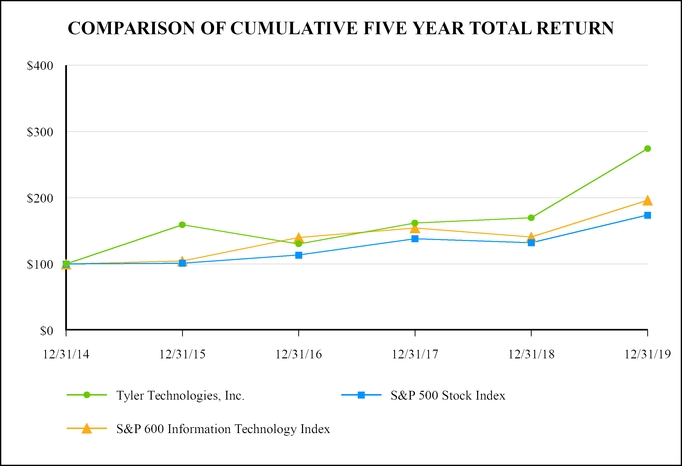
| Company / Index | 12/31/14 | 12/31/15 | 12/31/16 | 12/31/17 | 12/31/18 | 12/31/19 | |||||||||||
| Tyler Technologies, Inc. | 100 | 159.28 | 130.46 | 161.78 | 169.79 | 274.14 | |||||||||||
| S&P 500 Stock Index | 100 | 101.38 | 113.51 | 138.29 | 132.23 | 173.86 | |||||||||||
| S&P 600 Information Technology Index | 100 | 104.65 | 140.08 | 154.48 | 140.68 | 196.38 |
Previous: Item 4. SUBMISSION OF MATTERS TO A VOTE OF SECURITY HOLDERS. · Next: Item 6. SELECTED FINANCIAL DATA.