 filings.tools
United Airlines Holdings 10-K 2019-12-31
Filed 2020-02-25. 22 sections, 467K characters. Original on sec.gov · Markdown · JSON
Cover and table of contents
UNITED STATES
SECURITIES AND EXCHANGE COMMISSION
Washington, DC 20549
| FORM | 10-K |
| ☒ | ANNUAL REPORT PURSUANT TO SECTION 13 OR 15(d) OF THE SECURITIES EXCHANGE ACT OF 1934 |
For the fiscal year ended December 31, 2019
OR
| ☐ | TRANSITION REPORT PURSUANT TO SECTION 13 OR 15(d) OF THE SECURITIES EXCHANGE ACT OF 1934 |
For the transition period from to

| Commission File Number | Exact Name of Registrant as Specified in its Charter, Principal Executive Office Address and Telephone Number | State of Incorporation | I.R.S. Employer Identification No. | ||||||||
| 001-06033 | United Airlines Holdings, Inc. | Delaware | 36-2675207 | ||||||||
| 233 South Wacker Drive, | Chicago, | Illinois | 60606 | ||||||||
| (872) | 825-4000 | ||||||||||
| 001-10323 | United Airlines, Inc. | Delaware | 74-2099724 | ||||||||
| 233 South Wacker Drive, | Chicago, | Illinois | 60606 | ||||||||
| (872) | 825-4000 |
Securities registered pursuant to Section 12(b) of the Act:
| Title of Each Class | Trading Symbol | Name of Each Exchange on Which Registered | ||||
| United Airlines Holdings, Inc. | Common Stock, $0.01 par value | UAL | The Nasdaq Stock Market LLC | |||
| United Airlines, Inc. | None | None | None |
Securities registered pursuant to Section 12(g) of the Act:
| United Airlines Holdings, Inc. | None | |||
| United Airlines, Inc. | None | |||
Indicate by check mark if the registrant is a well-known seasoned issuer, as defined in Rule 405 of the Securities Act
| United Airlines Holdings, Inc. | Yes | ☒ | No | ☐ | United Airlines, Inc. | Yes | ☒ | No | ☐ |
Indicate by check mark if the registrant is not required to file reports pursuant to Section 13 or Section 15(d) of the Act.
| United Airlines Holdings, Inc. | Yes | ☐ | No | ☒ | United Airlines, Inc. | Yes | ☐ | No | ☒ |
Indicate by check mark whether the registrant (1) has filed all reports required to be filed by Section 13 or 15(d) of the Securities Exchange Act of 1934 during the preceding 12 months (or for such shorter period that the registrant was required to file such reports), and (2) has been subject to such filing requirements for the past 90 days.
| United Airlines Holdings, Inc. | Yes | ☒ | No | ☐ | United Airlines, Inc. | Yes | ☒ | No | ☐ |
Indicate by check mark whether the registrant has submitted electronically every Interactive Data File required to be submitted pursuant to Rule 405 of Regulation S-T (§232.405 of this Chapter) during the preceding 12 months (or for such shorter period that the registrant was required to submit such files).
| United Airlines Holdings, Inc. | Yes | ☒ | No | ☐ | United Airlines, Inc. | Yes | ☒ | No | ☐ |
Indicate by check mark whether the registrant is a large accelerated filer, an accelerated filer, a non-accelerated filer, a smaller reporting company, or an emerging growth company. See the definitions of "large accelerated filer," "accelerated filer," "smaller reporting company," and "emerging growth company" in Rule 12b-2 of the Exchange Act.
| United Airlines Holdings, Inc. | Large accelerated filer | ☒ | Accelerated filer | ☐ | Non-accelerated filer | ☐ | Smaller reporting company | ☐ | Emerging growth company | ☐ |
| United Airlines, Inc. | Large accelerated filer | ☐ | Accelerated filer | ☐ | Non-accelerated filer | ☒ | Smaller reporting company | ☐ | Emerging growth company | ☐ |
If an emerging growth company, indicate by check mark if the registrant has elected not to use the extended transition period for complying with any new or revised financial accounting standards provided pursuant to Section 13(a) of the Exchange Act.
| United Airlines Holdings, Inc. | ☐ | |
| United Airlines, Inc. | ☐ |
Indicate by check mark whether the registrant is a shell company (as defined in Rule 12b-2 of the Exchange Act).
| United Airlines Holdings, Inc. | Yes | ☐ | No | ☒ | ||
| United Airlines, Inc. | Yes | ☐ | No | ☒ |
The aggregate market value of common stock held by non-affiliates of United Airlines Holdings, Inc. was $21.1 billion as of June 28, 2019, based on the closing sale price of $87.55 on that date. There is no market for United Airlines, Inc. common stock.
Indicate the number of shares outstanding of each of the registrant's classes of common stock, as of February 18, 2020.
| United Airlines Holdings, Inc. | 247,951,116 | shares of common stock ($0.01 par value) | |
| United Airlines, Inc. | 1,000 | shares of common stock ($0.01 par value) (100% owned by United Airlines Holdings, Inc.) |
This combined Form 10-K is separately filed by United Airlines Holdings, Inc. and United Airlines, Inc.
OMISSION OF CERTAIN INFORMATION
United Airlines, Inc. meets the conditions set forth in General Instruction I(1)(a) and (b) of Form 10-K and is therefore filing this form with the reduced disclosure format allowed under that General Instruction.
DOCUMENTS INCORPORATED BY REFERENCE
Certain information required by Items 10, 11, 12 and 13 of Part III of this Form 10-K is incorporated by reference for United Airlines Holdings, Inc. from its definitive proxy statement for its 2020 Annual Meeting of Stockholders.
United Airlines Holdings, Inc. and Subsidiary Companies
United Airlines, Inc. and Subsidiary Companies
Annual Report on Form 10-K
For the Year Ended December 31, 2019
This Annual Report on Form 10-K ("Form 10-K") contains various "forward-looking statements" within the meaning of Section 27A of the Securities Act of 1933, as amended (the "Securities Act"), and Section 21E of the Securities Exchange Act of 1934, as amended (the "Exchange Act"). Forward-looking statements represent our expectations and beliefs concerning future results or events, based on information available to us on the date of the filing of this Form 10-K, and are subject to various risks and uncertainties. Factors that could cause actual results or events to differ materially from those referenced in the forward-looking statements are listed in Part I, Item 1A. Risk Factors and in Part II, Item 7. Management's Discussion and Analysis of Financial Condition and Results of Operations. We disclaim any intent or obligation to update or revise any of the forward-looking statements, whether in response to new information, unforeseen events, changed circumstances or otherwise, except as required by applicable law.
PART I
Item 1. BUSINESS.
Overview
United Airlines Holdings, Inc. (together with its consolidated subsidiaries, "UAL" or the "Company") is a holding company and its principal, wholly-owned subsidiary is United Airlines, Inc. (together with its consolidated subsidiaries, "United"). As UAL consolidates United for financial statement purposes, disclosures that relate to activities of United also apply to UAL, unless otherwise noted. United's operating revenues and operating expenses comprise nearly 100% of UAL's revenues and operating expenses. In addition, United comprises approximately the entire balance of UAL's assets, liabilities and operating cash flows. When appropriate, UAL and United are named specifically for their individual contractual obligations and related disclosures and any significant differences between the operations and results of UAL and United are separately disclosed and explained. We sometimes use the words "we," "our," "us," and the "Company" in this report for disclosures that relate to all of UAL and United.
UAL was incorporated under the laws of the State of Delaware on December 30, 1968. Effective June 27, 2019, UAL amended its Certificate of Incorporation to change its name to "United Airlines Holdings, Inc." Our principal executive office is located at 233 South Wacker Drive, Chicago, Illinois 60606 (telephone number (872) 825-4000).
The Company's website is located at www.united.com and its investor relations website is located at ir.united.com. The information contained on or connected to the Company's websites is not incorporated by reference into this Annual Report on Form 10-K and should not be considered part of this or any other report filed with the U.S. Securities and Exchange Commission ("SEC"). The Company's filings with the SEC, including annual reports on Form 10-K, quarterly reports on Form 10-Q, current reports on Form 8-K, and all amendments to those reports, as well as UAL's proxy statement for its annual meeting of stockholders, are accessible without charge on the Company's investor relations website, as soon as reasonably practicable, after such material is electronically filed with, or furnished to, the SEC. Such filings are also available on the SEC's website at www.sec.gov.
Operations
The Company transports people and cargo throughout North America and to destinations in Asia, Europe, Africa, the Pacific, the Middle East and Latin America. UAL, through United and its regional carriers, operates more than 4,900 flights a day to 362 airports across six continents, with hubs at Newark Liberty International Airport ("Newark"), Chicago O'Hare International Airport ("Chicago O'Hare"), Denver International Airport ("Denver"), George Bush Intercontinental Airport ("Houston Bush"), Los Angeles International Airport ("LAX"), A.B. Won Pat International Airport ("Guam"), San Francisco International Airport ("SFO") and Washington Dulles International Airport ("Washington Dulles").
All of the Company's domestic hubs are located in large business and population centers, contributing to a large amount of "origin and destination" traffic. The hub and spoke system allows us to transport passengers between a large number of destinations with substantially more frequent service than if each route were served directly. The hub system also allows us to add service to a new destination from a large number of cities using only one or a limited number of aircraft. As discussed under Alliances below, United is a member of Star Alliance, the world's largest alliance network.
Regional. The Company has contractual relationships with various regional carriers to provide regional aircraft service branded as United Express. This regional service complements our operations by carrying traffic that connects to our hubs and allows flights to smaller cities that cannot be provided economically with mainline aircraft. Champlain Enterprises, LLC d/b/a CommutAir ("CommutAir"), Republic Airline Inc. ("Republic"), ExpressJet Airlines LLC ("ExpressJet"), GoJet Airlines LLC ("GoJet"), Mesa Airlines, Inc. ("Mesa"), SkyWest Airlines, Inc. ("SkyWest"), Air Wisconsin Airlines LLC ("Air Wisconsin"), and Trans States Airlines, LLC ("Trans States") are all regional carriers that operate with capacity contracted to United under capacity purchase agreements ("CPAs"). Under these CPAs, the Company pays the regional carriers contractually agreed fees
(carrier costs) for operating these flights plus a variable rate adjustment based on agreed performance metrics, subject to annual adjustments. The fees are based on specific rates multiplied by specific operating statistics (e.g., block hours, departures), as well as fixed monthly amounts. Under these CPAs, the Company is also responsible for all fuel costs incurred, as well as landing fees and other costs, which are either passed through by the regional carrier to the Company without any markup or directly incurred by the Company. In some cases, the Company owns some or all of the aircraft subject to the CPA and leases such aircraft to the regional carrier. In return, the regional carriers operate the capacity of the aircraft included within the scope of such CPA exclusively for United, on schedules determined by the Company. The Company also determines pricing and revenue management, assumes the inventory and distribution risk for the available seats and permits mileage accrual and redemption for regional flights through its MileagePlus loyalty program.
Alliances. United is a member of Star Alliance, a global integrated airline network and the largest and most comprehensive airline alliance in the world. As of January 1, 2020, Star Alliance carriers served nearly 1,300 airports in 195 countries with more than 19,000 daily departures. Star Alliance members, in addition to United, are Aegean Airlines, Air Canada, Air China, Air India, Air New Zealand, All Nippon Airways ("ANA"), Asiana Airlines, Austrian Airlines, Aerovías del Continente Americano S.A. ("Avianca"), Brussels Airlines, Copa Airlines ("Copa"), Croatia Airlines, EGYPTAIR, Ethiopian Airlines, EVA Air, LOT Polish Airlines, Lufthansa, SAS Scandinavian Airlines, Shenzhen Airlines, Singapore Airlines, South African Airways, SWISS, TAP Air Portugal, THAI Airways International and Turkish Airlines. In addition to its members, Star Alliance includes Shanghai-based Juneyao Airlines as a connecting partner.
United has a variety of bilateral commercial alliance agreements and obligations with Star Alliance members, addressing, among other things, reciprocal earning and redemption of frequent flyer miles, access to airport lounges and, with certain Star Alliance members, codesharing of flight operations (whereby one carrier's selected flights can be marketed under the brand name of another carrier). In addition to the alliance agreements with Star Alliance members, United currently maintains independent marketing alliance agreements with other air carriers, including Aeromar, Aer Lingus, Air Dolomiti, Azul Linhas Aéreas Brasileiras S.A. ("Azul"), Boutique Air, Cape Air, Edelweiss, Eurowings, Hawaiian Airlines, Olympic Air, Silver Airways and Vistara. In addition to the marketing alliance agreements with air partners, United also offers a train-to-plane codeshare and frequent flyer alliance with Amtrak from Newark on select city pairs in the northeastern United States.
United also participates in four passenger joint business arrangements ("JBAs"): one with Air Canada and the Lufthansa Group (which includes Lufthansa and its affiliates Austrian Airlines, Brussels Airlines, Eurowings and SWISS) covering transatlantic routes, one with ANA covering certain transpacific routes, one with Air New Zealand covering certain routes between the United States and New Zealand and one with Avianca and Copa Airlines, which, upon receipt of regulatory approvals will cover routes between the United States and Central and South America, excluding Brazil. These passenger JBAs enable the participating carriers to integrate the services they provide in the respective regions, capturing revenue synergies and delivering enhanced customer benefits, such as highly competitive flight schedules, fares and services. United also participates in cargo JBAs with ANA for transpacific cargo services and with Lufthansa for transatlantic cargo services. These cargo JBAs offer expanded and more seamless access to cargo space across the carriers' respective combined networks.
Loyalty Program. United's MileagePlus loyalty program builds customer loyalty by offering awards, benefits and services to program participants. Members in this program earn miles for flights on United, United Express, Star Alliance members and certain other airlines that participate in the program. Members can also earn miles by purchasing goods and services from our network of non-airline partners, such as domestic and international credit card issuers, retail merchants, hotels and car rental companies. Members can redeem miles for free (other than taxes and government-imposed fees), discounted or upgraded travel and non-travel awards.
United has an agreement with JPMorgan Chase Bank, N.A. ("Chase"), pursuant to which members of United's MileagePlus loyalty program who are residents of the United States can earn miles for making purchases using a MileagePlus credit card issued by Chase (the "Co-Brand Agreement"). The Co-Brand Agreement also provides for joint marketing and other support for the MileagePlus credit card and provides Chase with other benefits such as permission to market to the Company's customer database.
In 2019, approximately 6.1 million MileagePlus flight awards were used on United and United Express. These awards represented 7.2% of United's total revenue passenger miles. Total miles redeemed for flights on United and United Express, including class-of-service upgrades, represented approximately 87% of the total miles redeemed. In addition, excluding miles redeemed for flights on United and United Express, MileagePlus members redeemed miles for approximately 2.2 million other awards. These awards include United Club memberships, car and hotel awards, merchandise and flights on other air carriers.
Aircraft Fuel. The table below summarizes UAL's aircraft fuel consumption and expense during the last three years.
| Year | Gallons Consumed (in millions) | Fuel Expense (in millions) | Average Price Per Gallon | Percentage of Total Operating Expense | ||||||||||
| 2019 | 4,292 | $ | 8,953 | $ | 2.09 | 23 | % | |||||||
| 2018 | 4,137 | $ | 9,307 | $ | 2.25 | 24 | % | |||||||
| 2017 | 3,978 | $ | 6,913 | $ | 1.74 | 20 | % |
Our operational and financial results can be significantly impacted by changes in the price and availability of aircraft fuel. To provide adequate supplies of fuel, the Company routinely enters into purchase contracts that are customarily indexed to market prices for aircraft fuel, and the Company generally has some ability to cover short-term fuel supply and infrastructure disruptions at certain major demand locations. The price of aircraft fuel has fluctuated substantially in the past several years. The Company's current strategy is to not enter into transactions to hedge its fuel consumption, although the Company regularly reviews its strategy based on market conditions and other factors.
Third-Party Business. United generates third-party business revenue that includes maintenance services, catering, frequent flyer award non-travel redemptions and ground handling. Third-party business revenue is recorded in Other operating revenue. Expenses associated with third-party business, except non-travel redemptions, are recorded in Other operating expenses. Non-travel redemptions expenses are recorded to Other operating revenue.
Distribution Channels. The Company's airline seat inventory and fares are distributed through the Company's direct channels, traditional travel agencies and on-line travel agencies. The use of the Company's direct sales website, www.united.com, the Company's mobile applications and alternative distribution systems provides the Company with an opportunity to de-commoditize its services, better present its content, make more targeted offerings, better retain its customers, enhance its brand and lower its ticket distribution costs. Agency sales are primarily sold using global distribution systems ("GDS"). United has developed and expects to continue to develop capabilities to sell certain ancillary products through the GDS channel to provide an enhanced buying experience for customers who purchase in that channel.
Industry Conditions
Domestic Competition. The domestic airline industry is highly competitive and dynamic. The Company's competitors consist primarily of other airlines and, to a certain extent, other forms of transportation. Currently, any U.S. carrier deemed fit by the U.S. Department of Transportation (the "DOT") is largely free to operate scheduled passenger service between any two points within the United States. Competition can be direct, in the form of another carrier flying the exact non-stop route, or indirect, where a carrier serves the same two cities non-stop from an alternative airport in that city or via an itinerary requiring a connection at another airport. Air carriers' cost structures are not uniform and are influenced by numerous factors. Carriers with lower costs may offer lower fares to passengers, which could have a potential negative impact on the Company's revenues. Domestic pricing decisions are impacted by intense competitive pressure exerted on the Company by other U.S. airlines. In order to remain competitive and maintain passenger traffic levels, we often find it necessary to match competitors' discounted fares. Since we compete in a dynamic marketplace, attempts to generate additional revenue through increased fares often fail.
International Competition. Internationally, the Company competes not only with U.S. airlines, but also with foreign carriers. International competition has increased and may continue to increase in the future as a result of airline mergers and acquisitions, JBAs, alliances, restructurings, liberalization of aviation bilateral agreements and new or increased service by competitors, including government subsidized competitors from certain Middle East countries. Competition on international routes is subject to varying degrees of governmental regulation. The Company's ability to compete successfully with non-U.S. carriers on international routes depends in part on its ability to generate traffic to and from the entire United States via its integrated domestic route network and its ability to overcome business and operational challenges across its network worldwide. Foreign carriers currently are prohibited by U.S. law from carrying local passengers between two points in the United States and the Company generally experiences comparable restrictions in foreign countries. Separately, "fifth freedom rights" allow the Company to operate between points in two different foreign countries and foreign carriers may also have fifth freedom rights between the U.S. and another foreign country. In the absence of fifth freedom rights, or some other extra-bilateral right to conduct operations between two foreign countries, U.S. carriers are constrained from carrying passengers to points beyond designated international gateway cities. To compensate partially for these structural limitations, U.S. and foreign carriers have entered into alliances, immunized JBAs and marketing arrangements that enable these carriers to exchange traffic between each other's flights and route networks. See Alliances, above, for additional information.
Seasonality. The air travel business is subject to seasonal fluctuations. Historically, demand for air travel is higher in the second and third quarters, driving higher revenues, than in the first and fourth quarters, which are periods of lower travel demand.
Industry Regulation
Domestic Regulation. All carriers engaged in air transportation in the United States are subject to regulation by the DOT. Absent an exemption, no air carrier may provide air transportation of passengers or property without first being issued a DOT certificate of public convenience and necessity. The DOT also grants international route authority, approves international codeshare arrangements and regulates methods of competition. The DOT regulates consumer protection and maintains jurisdiction over advertising, denied boarding compensation, tarmac delays, baggage liability and other areas and may add additional expensive regulatory burdens in the future. The DOT has launched investigations or claimed rulemaking authority to regulate commercial agreements among carriers or between carriers and third parties in a wide variety of contexts.
Airlines are also regulated by the Federal Aviation Administration (the "FAA"), an agency within the DOT, primarily in the areas of flight safety, air carrier operations and aircraft maintenance and airworthiness. The FAA issues air carrier operating certificates and aircraft airworthiness certificates, prescribes maintenance procedures, oversees airport operations, and regulates pilot and other employee training. From time to time, the FAA issues directives that require air carriers to inspect, modify or ground aircraft and other equipment, potentially causing the Company to incur substantial, unplanned expenses. The airline industry is also subject to numerous other federal laws and regulations. The U.S. Department of Homeland Security ("DHS") has jurisdiction over virtually every aspect of civil aviation security. The Antitrust Division of the U.S. Department of Justice ("DOJ") has jurisdiction over certain airline competition matters. The U.S. Postal Service has authority over certain aspects of the transportation of mail by airlines. Labor relations in the airline industry are generally governed by the Railway Labor Act ("RLA"), a federal statute. The Company is also subject to investigation inquiries by the DOT, FAA, DOJ, DHS, the U.S. Food and Drug Administration ("FDA"), the U.S. Department of Agriculture ("USDA") and other U.S. and international regulatory bodies.
Airport Access. Access to landing and take-off rights, or "slots," at several major U.S. airports served by the Company are subject to government regulation. Federally-mandated domestic slot restrictions that limit operations and regulate capacity currently apply at three airports: Reagan National Airport in Washington, D.C. ("Reagan National"), John F. Kennedy International Airport and LaGuardia Airport ("LaGuardia") in the New York City metropolitan region. Of these three airports, United currently operates at two: Reagan National and LaGuardia. Additional restrictions on takeoff and landing slots at these and other airports may be implemented in the future and could affect the Company's rights of ownership and transfer as well as its operations.
Legislation. The airline industry is subject to legislative actions (or inactions) that may have an impact on operations and costs. In 2018, the U.S. Congress approved a five-year reauthorization for the FAA, which encompasses significant aviation tax and policy-related issues. The law includes a range of policy changes related to airline customer service and aviation safety which are ongoing and, depending on how they are implemented, could impact our operations and costs. Additionally, the U.S. Congress may consider legislation related to aviation safety as well as environmental issues which could impact the Company and the airline industry.
Catering Operations. The Company owns and operates catering kitchens at airports in Denver, Cleveland, Newark, Houston, and Honolulu, which prepare ready-to-eat food for United flights. Some of the Company's kitchens also prepare ready-to-eat food for other domestic and international airlines. The Company's onboard food service operations are subject to FDA regulation through its interstate conveyance sanitation regulations, and the Company's catering operations are subject to regulation by the FDA and the USDA, as well as other federal, state, and local regulatory agencies. In particular, the FDA enforces the Federal Food Safety Modernization Act which requires all food manufacturers, including ready-to-eat catering operations, to implement stringent risk-based preventive controls. As a result, the Company's catering and food service operations are periodically subject to inspections and enforcement by regulatory agencies.
International Regulation. International air transportation is subject to extensive government regulation. In connection with the Company's international services, the Company is regulated by both the U.S. government and the governments of the foreign countries the Company serves. In addition, the availability of international routes to U.S. carriers is regulated by aviation agreements between the U.S. and foreign governments, and in some cases, fares and schedules require the approval of the DOT and/or the relevant foreign governments.
Legislation. Foreign countries are increasingly enacting passenger protection laws, rules and regulations that meet or exceed U.S. requirements. In cases where this activity exceeds U.S. requirements, additional burden and liability may be placed on the Company. Certain countries have regulations requiring passenger compensation and/or enforcement penalties from the Company in addition to changes in operating procedures due to canceled and delayed flights.
Airport Access. Historically, access to foreign markets has been tightly controlled through bilateral agreements between the U.S. and each foreign country involved. These agreements regulate the markets served, the number of carriers allowed to serve each market and the frequency of carriers' flights. Since the early 1990s, the U.S. has pursued a policy of "Open Skies" (meaning all U.S.-flag carriers have access to the destination), under which the U.S. government has negotiated a number of bilateral agreements allowing unrestricted access between U.S. and foreign markets. Currently, there are more than 100 Open Skies agreements in effect. However, even with Open Skies, many of the airports that the Company serves in Europe, Asia and Latin America maintain slot controls. A large number of these slot controls exist due to congestion, environmental and noise protection and reduced capacity due to runway and air traffic control ("ATC") construction work, among other reasons. London Heathrow International Airport, Frankfurt Rhein-Main Airport, Shanghai Pudong International Airport, Beijing Capital International Airport, Sao Paulo Guarulhos International Airport and Tokyo Haneda International Airport are among the most restrictive foreign airports due to slot and capacity limitations.
The Company's ability to serve some foreign markets and expand into certain others is limited by the absence of aviation agreements between the U.S. government and the relevant foreign governments. Shifts in U.S. or foreign government aviation policies may lead to the alteration or termination of air service agreements. Depending on the nature of any such change, the value of the Company's international route authorities and slot rights may be materially enhanced or diminished. Similarly, foreign governments control their airspace and can restrict our ability to overfly their territory, enhancing or diminishing the value of the Company's existing international route authorities and slot rights.
Environmental Regulation. The airline industry is subject to increasingly stringent federal, state, local and international environmental requirements, including those regulating emissions to air, water discharges, safe drinking water and the use and management of hazardous substances and wastes.
Climate Change. There is an increasing global regulatory focus on greenhouse gas ("GHG") emissions and their potential impacts relating to climate change. An initiative to regulate GHG emissions from aviation known as the European Union ("EU") Emission Trading System ("ETS") was adopted in 2009, but applicability to flights arriving or departing from airports outside the EU has been postponed several times. In December 2017, the European Parliament voted to extend exemptions for extra-EU flights until December 2023 in order to align the extension date with the completion of the pilot phase of the International Civil Aviation Organization's ("ICAO") Carbon Offsetting and Reduction Scheme for International Aviation ("CORSIA"). CORSIA, which was adopted in October 2016, is intended to create a single global market-based measure to achieve carbon-neutral growth for international aviation after 2020, which can be achieved through airline purchases of carbon offset credits. However, the European Parliament is expected to assess CORSIA implementation and re-assess the applicability of EU ETS to international aviation in 2024, at which point the EU could require all extra- and intra-EU flights to participate in EU ETS. Certain CORSIA program details remain to be developed and could potentially be affected by political developments in participating countries or the results of the pilot phase of the program, and thus the impact of CORSIA cannot be fully predicted. However, CORSIA is expected to increase operating costs for the Company, depending on a number of factors, including the number of its flights that are subject to CORSIA, the fuel efficiency of the Company's fleet, the Company's purchase and use of CORSIA-eligible sustainable aviation fuels, aviation sector growth, and the price of CORSIA-eligible offsets. In 2017, ICAO also adopted a carbon dioxide ("CO2") emission standard for aircraft. In 2016, the U.S. Environmental Protection Agency ("EPA") commenced procedural steps necessary to adopt its own standard, but has not yet taken further action. While the precise timing and final form of these various programs and requirements continue to evolve, the Company is taking various actions that are expected to help reduce its CO2 emissions over time such as improving fuel efficiency, fleet renewal, aircraft retrofits and promoting the commercialization of sustainable aviation fuels.
Other Regulations. Our operations are subject to a variety of other environmental laws and regulations both in the United States and internationally. These include noise-related restrictions on aircraft types and operating times and state and local air quality initiatives which have, or could in the future, result in curtailments in services, increased operating costs, limits on expansion, or further emission reduction requirements. Certain airports and/or governments, both domestically and internationally, either have or are seeking to establish environmental fees and other requirements applicable to carbon emissions, local air quality pollutants and/or noise. The implementation of these requirements is expected to result in restrictions on mobile sources such as cars, trucks and airport ground support equipment in corresponding locations. Finally, environmental cleanup laws could require the Company to undertake or subject the Company to liability for investigation and remediation costs at certain owned or leased locations or third-party disposal locations.
Until applicability of new regulations to our specific operations is better defined and/or until pending regulations are finalized, future costs to comply with such regulations will remain uncertain but are likely to increase our operating costs over time. While we continue to monitor these developments, the precise nature of future requirements and their applicability to the Company are difficult to predict, but the financial impact to the Company and the aviation industry could be significant.
Employees
As of December 31, 2019, UAL, including its subsidiaries, had approximately 96,000 employees. Approximately 84% of the Company's employees were represented by various U.S. labor organizations.
Collective bargaining agreements between the Company and its represented employee groups are negotiated under the RLA. Such agreements typically do not contain an expiration date and instead specify an amendable date, upon which the agreement is considered "open for amendment."
On February 1, 2019, the collective bargaining agreement with the Air Line Pilots Association ("ALPA"), the labor union representing United's pilots, became amendable. The Company and ALPA are in negotiations for an amended agreement. The Company and UNITE HERE, the labor union representing United's Catering employees, started negotiations for a first collective bargaining agreement in March 2019.
The following table reflects the Company's represented employee groups, the number of employees per represented group, union representation for each employee group, and the amendable date for each employee group's collective bargaining agreement as of December 31, 2019:
| Employee Group | Number of Employees | Union | Agreement Open for Amendment | ||||
| Flight Attendants | 24,203 | Association of Flight Attendants (the "AFA") | August 2021 | ||||
| Fleet Service | 13,803 | International Association of Machinists and Aerospace Workers (the "IAM") | December 2021 | ||||
| Passenger Service | 12,135 | IAM | December 2021 | ||||
| Pilots | 12,251 | ALPA | January 2019 | ||||
| Technicians | 9,318 | International Brotherhood of Teamsters (the "IBT") | December 2022 (a) | ||||
| Passenger Service - United Ground Express, Inc. | 4,155 | IAM | March 2025 | ||||
| Catering | 2,577 | UNITE HERE | N/A | ||||
| Storekeepers | 989 | IAM | December 2021 | ||||
| Dispatchers | 412 | Professional Airline Flight Control Association | December 2021 | ||||
| Fleet Tech Instructors | 130 | IAM | December 2021 | ||||
| Load Planners | 62 | IAM | December 2021 | ||||
| Security Officers | 45 | IAM | December 2021 | ||||
| Maintenance Instructors | 40 | IAM | December 2021 |
(a) The collective bargaining agreement with the IBT contains provisions that require the Company to align contract terms with other airlines' workgroups under certain conditions.
Information about Our Executive Officers
Kate Gebo. Age 51. Ms. Gebo has served as Executive Vice President Human Resources and Labor Relations of UAL and United since December 2017. From November 2016 to November 2017, Ms. Gebo served as Senior Vice President, Global Customer Service Delivery and Chief Customer Officer of United. From October 2015 to November 2016, Ms. Gebo served as Vice President of the Office of the Chief Executive Officer. From November 2009 to October 2015, Ms. Gebo served as Vice President of Corporate Real Estate of United.
Brett J. Hart. Age 50. Mr. Hart has served as Executive Vice President and Chief Administrative Officer of UAL and United since March 2019. From May 2017 to March 2019, he served as Executive Vice President, Chief Administrative Officer and General Counsel of UAL and United. From February 2012 to May 2017, he served as Executive Vice President and General Counsel of UAL and United. Mr. Hart served as acting Chief Executive Officer and principal executive officer of the Company, on an interim basis, from October 2015 to March 2016. From December 2010 to February 2012, he served as Senior Vice President, General Counsel and Secretary of UAL, United and Continental Airlines, Inc. ("Continental"). From June 2009 to December 2010, Mr. Hart served as Executive Vice President, General Counsel and Corporate Secretary at Sara Lee Corporation, a consumer food and beverage company. From March 2005 to May 2009, Mr. Hart served as Deputy General Counsel and Chief Global Compliance Officer of Sara Lee Corporation.
Gregory L. Hart. Age 54. Mr. Hart has served as Executive Vice President and Chief Operations Officer of UAL and United since February 2014. From December 2013 to February 2014, he served as Senior Vice President Operations of UAL and United. From September 2012 to December 2013, Mr. Hart served as Senior Vice President Technical Operations of United. From October 2010 to September 2012, Mr. Hart served as Senior Vice President Network of United and Continental. From
September 2008 to September 2010, Mr. Hart served as Vice President Network Strategy of Continental. Mr. Hart joined Continental in 1997.
Linda P. Jojo. Age 54. Ms. Jojo has served as Executive Vice President Technology and Chief Digital Officer of UAL and United since May 2017. From November 2014 to May 2017, Ms. Jojo served as Executive Vice President and Chief Information Officer of UAL and United. From July 2011 to October 2014, Ms. Jojo served as Executive Vice President and Chief Information Officer of Rogers Communications, Inc., a Canadian communications and media company. From October 2008 to June 2011, Ms. Jojo served as Chief Information Officer of Energy Future Holdings, a Dallas-based privately held energy company and electrical utility provider.
Chris Kenny. Age 55. Mr. Kenny has served as Vice President and Controller of UAL and United since October 2010. From September 2003 to September 2010, Mr. Kenny served as Vice President and Controller of Continental. Mr. Kenny joined Continental in 1997.
J. Scott Kirby. Age 52. Mr. Kirby has served as President of UAL and United since August 2016. Prior to joining the Company, from December 2013 to August 2016, Mr. Kirby served as President of American Airlines Group and American Airlines, Inc. Mr. Kirby also previously served as President of US Airways from October 2006 to December 2013. Mr. Kirby held significant other leadership roles at US Airways and at America West prior to the 2005 merger of those carriers, including Executive Vice President—Sales and Marketing (2001 to 2006); Senior Vice President, e-business (2000 to 2001); Vice President, Revenue Management (1998 to 2000); Vice President, Planning (1997 to 1998); and Senior Director, Scheduling and Planning (1995 to 1998). Prior to joining America West, Mr. Kirby worked for American Airlines Decision Technologies and at the Pentagon.
In December 2019, the Company announced that Mr. Kirby will become Chief Executive Officer of UAL and United following UAL's 2020 Annual Meeting of Stockholders, scheduled for May 20, 2020 (the "2020 Annual Meeting").
Gerald Laderman. Age 62**.** Mr. Laderman has served as Executive Vice President and Chief Financial Officer since August 2018. Mr. Laderman served as Senior Vice President Finance, Procurement and Treasurer for UAL and United from 2013 to August 2015, and again from August 2016 to May 2018. Mr. Laderman additionally was acting Chief Financial Officer from August 2015 to August 2016 and from May 2018 to August 2018. Mr. Laderman served as Senior Vice President Finance and Treasurer for the Company from 2010 to 2013. From 2001 to 2010, Mr. Laderman served as Senior Vice President of Finance and Treasurer for Continental. Mr. Laderman joined Continental in 1988 as senior director legal affairs, finance and aircraft programs.
Oscar Munoz. Age 61. Mr. Munoz has served as Chief Executive Officer of UAL and United since September 2015, and also as President of UAL and United from September 2015 until August 2016. From February 2015 to September 2015, Mr. Munoz served as President and Chief Operating Officer of CSX Corporation ("CSX"), a railroad and intermodal transportation services company, overseeing operations, sales and marketing, human resources, service design and information technology. Prior to his appointment as President and Chief Operating Officer of CSX, Mr. Munoz served as Executive Vice President and Chief Operating Officer of CSX from January 2012 to February 2015 and as Executive Vice President and Chief Financial Officer of CSX from 2003 to 2012. Mr. Munoz has been a member of the UAL Board of Directors since 2010.
In December 2019, the Company announced that Mr. Munoz will transition from the role of Chief Executive Officer of UAL and United following UAL's 2020 Annual Meeting and assume the role of Executive Chairman of the Board of Directors of UAL.
Andrew Nocella. Age 50. Mr. Nocella has served as Executive Vice President and Chief Commercial Officer of UAL and United since September 2017. From February 2017 to September 2017, he served as Executive Vice President and Chief Revenue Officer of UAL and United. Prior to joining the Company, from August 2016 to February 2017, Mr. Nocella served as Senior Vice President, Alliances and Sales of American Airlines, Inc. From December 2013 to August 2016, he served as Senior Vice President and Chief Marketing Officer of American Airlines, Inc. From August 2007 to December 2013, he served as Senior Vice President, Marketing and Planning of US Airways.
Item 1A. RISK FACTORS.
The following risk factors should be read carefully when evaluating the Company's business and the forward-looking statements contained in this report and other statements the Company or its representatives make from time to time. Any of the following risks could materially and adversely affect the Company's business, operating results, financial condition and the actual outcome of matters as to which forward-looking statements are made in this report.
If we do not successfully execute our strategic operating plan, or if our strategic operating plan is unsuccessful, our business, operating results and financial condition could be materially and adversely affected.
We have announced several strategic plans in recent years, including several revenue-generating initiatives and plans to optimize our revenue, such as our plans to add capacity, including international expansion and new or increased service to mid-size airports, and initiatives and plans to optimize and control our costs. We also continue to explore opportunities to enhance our segmentation, including the introduction of Polaris, Basic Economy and United Premium Plus, and are implementing many programs and policies to improve the customer experience at all points in air travel. In developing our strategic operating plan, we make certain assumptions, including, but not limited to, those related to customer demand, competition, market consolidation, the availability of aircraft and the global economy. Actual economic, market and other conditions may be different from our assumptions. In 2019, our capacity growth was lower than planned due to the grounding of Boeing 737 MAX aircraft, among other factors, which adversely impacted our ability to execute our strategic operating plans. If we do not successfully execute our strategic operating plan, or if actual results vary significantly from our assumptions, our business, operating results and financial condition could be materially and adversely impacted.
Unfavorable economic and political conditions, in the United States and globally, may have a material adverse effect on our business, operating results and financial condition.
The Company's business and operating results are significantly impacted by U.S. and global economic and political conditions. The airline industry is highly cyclical, and the level of demand for air travel is correlated to the strength of the U.S. and global economies. Robust demand for the Company's air transportation services depends largely on favorable economic conditions, including the strength of the domestic and foreign economies, low unemployment levels, strong consumer confidence levels and the availability of consumer and business credit. Air transportation is often a discretionary purchase that leisure travelers may limit or eliminate during difficult economic times. Short-haul travelers, in particular, have the option to replace air travel with surface travel. In addition, during periods of unfavorable economic conditions, business travelers historically have reduced the volume of their travel, either due to cost-saving initiatives, the replacement of travel with alternatives such as videoconferencing, or as a result of decreased business activity requiring travel. During such periods, the Company's business and operating results may be adversely affected due to significant declines in industry passenger demand, particularly with respect to the Company's business and premium cabin travelers, and a reduction in fare levels.
As a global business with operations outside of the United States from which it derives significant operating revenues, volatile conditions in certain international regions may have a negative impact on the Company's operating results and its ability to achieve its business objectives. The Company's international operations are a vital part of its worldwide airline network. Political disruptions and instability in certain regions can negatively impact the demand and network availability for air travel. Additionally, any deterioration in global trade relations, such as increased tariffs or other trade barriers, could result in a decrease in the demand for international air travel.
Stagnant or weakening global economic conditions either in the United States or in other geographic regions may have a material adverse effect on the Company's revenues, operating results and liquidity.
The global airline industry is highly competitive and susceptible to price discounting and changes in capacity, which could have a material adverse effect on our business, operating results and financial condition.
The airline industry is highly competitive, marked by significant competition with respect to routes, fares, schedules (both timing and frequency), services, products, customer service and frequent flyer programs. Consolidation in the airline industry, the rise of well-funded government sponsored international carriers, changes in international alliances and the creation of immunized JBAs have altered and are expected to continue to alter the competitive landscape in the industry, resulting in the formation of airlines and alliances with increased financial resources, more extensive global networks and services and competitive cost structures.
Airlines also compete by increasing or decreasing their capacity, including route systems and the number of destinations served. Several of the Company's domestic and international competitors have increased their international capacity by including service to some destinations that the Company currently serves, causing overlap in destinations served, and therefore, increasing competition for those destinations. This increased competition in both domestic and international markets may have
a material adverse effect on the Company's business, operating results and financial condition.
The Company's U.S. operations are subject to competition from traditional network carriers, national point-to-point carriers, and discount carriers, including low-cost carriers and ultra-low-cost carriers. Such carriers may have lower costs and provide service at lower fares to destinations also served by the Company. The significant presence of low-cost carriers and ultra-low-cost carriers, which engage in substantial price discounting, may diminish our ability to achieve sustained profitability on domestic and international routes. Our ability to compete in the domestic market effectively depends, in part, on our ability to maintain a competitive cost structure. If we cannot maintain our costs at a competitive level, then our business, operating results and financial condition could be materially and adversely affected.
Our international operations are subject to competition from both foreign and domestic carriers. Competition is significant from government subsidized competitors from certain Middle East countries. These carriers have large numbers of international widebody aircraft on order and are increasing service to the U.S. from their hubs in the Middle East. The government support provided to these carriers has allowed them to grow quickly, reinvest in their product, invest in other airlines and expand their global presence. We also face competition from foreign carriers operating under "fifth freedom" rights permitted under international treaties that allow certain carriers to provide service to and from stopover points between their home country and ultimate destination, including points in the United States, in competition with service provided by us.
Through alliance and other marketing and codesharing agreements with foreign carriers, U.S. carriers have increased their ability to sell international transportation, such as services to and beyond traditional global gateway cities. Similarly, foreign carriers have obtained increased access to interior U.S. passenger traffic beyond traditional U.S. gateway cities through these relationships. In add
Showing the first 8K of 76K characters. Open the full section
Item 1B. UNRESOLVED STAFF COMMENTS.
None.
Item 2. PROPERTIES.
Fleet. As of December 31, 2019, United's mainline and regional fleets consisted of the following:
| Aircraft Type | Total | Owned | Leased | Seats in Standard Configuration | Average Age (In Years) | |||||||||||
| Mainline: | ||||||||||||||||
| 777-300ER | 20 | 20 | — | 350 | 2.2 | |||||||||||
| 777-200ER | 55 | 51 | 4 | 267-276 | 19.8 | |||||||||||
| 777-200 | 19 | 19 | — | 364 | 22.5 | |||||||||||
| 787-10 | 11 | 11 | — | 318 | 0.7 | |||||||||||
| 787-9 | 25 | 25 | — | 252 | 3.8 | |||||||||||
| 787-8 | 12 | 12 | — | 219 | 6.5 | |||||||||||
| 767-400ER | 16 | 14 | 2 | 240 | 18.3 | |||||||||||
| 767-300ER | 38 | 25 | 13 | 167-214 | 23.9 | |||||||||||
| 757-300 | 21 | 9 | 12 | 234 | 17.3 | |||||||||||
| 757-200 | 53 | 48 | 5 | 142-176 | 23.5 | |||||||||||
| 737-900ER | 136 | 136 | — | 179 | 7.0 | |||||||||||
| 737-900 | 12 | 8 | 4 | 179 | 18.3 | |||||||||||
| 737-800 | 141 | 95 | 46 | 166 | 15.8 | |||||||||||
| 737-700 | 41 | 29 | 12 | 126 | 20.8 | |||||||||||
| A320-200 | 97 | 76 | 21 | 150 | 21.3 | |||||||||||
| A319-100 | 80 | 57 | 23 | 126-128 | 18.1 | |||||||||||
| Total mainline | 777 | 635 | 142 | 15.6 |
In addition to the aircraft presented in the table above, United owned or leased the following mainline aircraft as of December 31, 2019:
| • | Fourteen Boeing 737 MAX 9s, which are temporarily grounded pursuant to the FAA Order; |
| • | Four Boeing 747-400s, which are permanently grounded; |
| • | Three Airbus A320s, which are temporarily grounded; and |
| • | One Boeing 767-200, which is being subleased to another airline. |
| Aircraft Type | Total | Owned | Owned or Leased by Regional Carrier | Regional Carrier Operator and Number of Aircraft | Seats in Standard Configuration | |||||||||||
| Regional: | ||||||||||||||||
| Embraer E175/E175LL | 170 | 71 | 99 | SkyWest: Mesa: Republic: ExpressJet: | 65 60 28 17 | 70-76 | ||||||||||
| Embraer 170 | 38 | — | 38 | Republic: | 38 | 70 | ||||||||||
| CRJ700 | 47 | — | 47 | Mesa: SkyWest: GoJet: | 20 19 8 | 70 | ||||||||||
| CRJ550 | 18 | — | 18 | GoJet: | 18 | 50 | ||||||||||
| CRJ200 | 133 | — | 133 | SkyWest: Air Wisconsin: | 70 63 | 50 | ||||||||||
| Embraer ERJ 145 (XR/LR/ER) | 175 | 168 | 7 | ExpressJet: Trans States: CommutAir: | 95 43 37 | 50 | ||||||||||
| Total regional | 581 | 239 | 342 |
In addition to the aircraft presented in the table above, United owned the following regional aircraft as of December 31, 2019:
| • | Eight Embraer E175LLs, which were delivered but not yet in service; and |
| • | Three Embraer ERJ145s, which are temporarily grounded. |
Firm Order and Option Aircraft. As of December 31, 2019, United had firm commitments and options to purchase new aircraft from Boeing, Airbus and Embraer as presented in the table below:
| Scheduled Aircraft Deliveries | |||||||||
| Aircraft Type | Number of Firm Commitments (a) | 2020 | After 2020 | ||||||
| Airbus A321XLR | 50 | — | 50 | ||||||
| Airbus A350 | 45 | — | 45 | ||||||
| Boeing 737 MAX | 171 | 44 | 127 | ||||||
| Boeing 777-300ER | 2 | 2 | — | ||||||
| Boeing 787 | 16 | 15 | 1 | ||||||
| Embraer E175 | 20 | 20 | — |
(a) United also has options and purchase rights for additional aircraft.
The aircraft listed in the table above are scheduled for delivery through 2030. The Company expects to assign the purchase obligation for each of the 20 Embraer E175 aircraft to one of its regional partners at the time of such aircraft's delivery, subject to certain conditions. To the extent the Company and the aircraft manufacturers with which the Company has existing orders for new aircraft agree to modify the contracts governing those orders, the amount and timing of the Company's future capital commitments could change. United also has agreements to purchase 20 used Airbus A319 aircraft with expected delivery dates through 2022 and 19 used Boeing 737-700 aircraft with expected delivery dates through 2021.
The 44 Boeing 737 MAX aircraft in the table above include 16 Boeing B737 MAX aircraft of which the Company planned to take delivery in 2019, and 28 aircraft of which the Company planned to take delivery of in 2020; however, following the FAA Order, Boeing suspended deliveries of new Boeing 737 MAX aircraft. The extent of the delay to the scheduled deliveries of new 737 MAX aircraft is expected to be impacted by the length of time the FAA Order remains in place, Boeing's production rate and the pace at which Boeing can deliver aircraft following the lifting of the FAA Order, among other factors. As a result, the Company is unable to estimate the number of Boeing 737 MAX aircraft of which it will take delivery in 2020.
See Notes 10 and 13 to the financial statements included in Part II, Item 8 of this report for additional information.
Facilities. United leases gates, hangar sites, terminal buildings and other airport facilities in the municipalities it serves. United has major terminal facility leases at SFO, Washington Dulles, Chicago O'Hare, LAX, Denver, Newark, Houston Bush and Guam with expiration dates ranging from 2020 through 2053. Substantially all of these facilities are leased on a net-rental basis, resulting in the Company's responsibility for maintenance, insurance and other facility-related expenses and services.
United also maintains administrative, catering, cargo, training, maintenance and other facilities to support its operations in the cities it serves. In addition, United has multiple leases, which expire from 2020 through 2033, for its principal executive office and operations center in downtown Chicago and administrative offices in downtown Houston.
Item 3. LEGAL PROCEEDINGS.
On June 30, 2015, UAL received a Civil Investigative Demand ("CID") from the Antitrust Division of the DOJ seeking documents and information from the Company in connection with a DOJ investigation related to statements and decisions about airline capacity. The Company has completed its response to the CID. The Company is not able to predict what action, if any, might be taken in the future by the DOJ or other governmental authorities as a result of the investigation. Beginning on July 1, 2015, subsequent to the announcement of the CID, UAL and United were named as defendants in multiple class action lawsuits that asserted claims under the Sherman Antitrust Act, which have been consolidated in the United States District Court for the District of Columbia. The complaints generally allege collusion among U.S. airlines on capacity impacting airfares and seek treble damages. The Company intends to vigorously defend against the class action lawsuits.
On October 13, 2015, United received a CID from the Civil Division of the DOJ. The CID requested documents and oral testimony from United in connection with an industry-wide DOJ investigation related to delivery scan and other data purportedly required for payment for the carriage of mail under United's International Commercial Air Contracts with the U.S. Postal Service. The Company has been responding to the DOJ's request and cooperating in the investigation since that time. On November 8, 2016, the DOJ Criminal Division met with representatives from the Company and advised they are conducting an industry-wide investigation into the same matter. The Company continues to cooperate with the government in their investigation and representatives from the Company have met with both the Civil and Criminal Divisions to provide additional information. The Company cannot predict what action, if any, might be taken in the future by the DOJ or other governmental authorities as a result of these investigations.
Other Legal Proceedings. The Company is involved in various other claims and legal actions involving passengers, customers, suppliers, employees and government agencies arising in the ordinary course of business. Additionally, from time to time, the Company becomes aware of potential non-compliance with applicable environmental regulations, which have either been identified by the Company (through internal compliance programs such as its environmental compliance audits) or through notice from a governmental entity. In some instances, these matters could potentially become the subject of an administrative or judicial proceeding and could potentially involve monetary sanctions. After considering a number of factors, including (but not limited to) the views of legal counsel, the nature of contingencies to which the Company is subject and prior experience, management believes that the ultimate disposition of these other claims and legal actions will not materially affect its consolidated financial position or results of operations. However, the ultimate resolutions of these matters are inherently unpredictable. As such, the Company's financial condition and results of operations could be adversely affected in any particular period by the unfavorable resolution of one or more of these matters.
Item 4. MINE SAFETY DISCLOSURES.
Not applicable.
PART II
Item 5. MARKET FOR REGISTRANT'S COMMON EQUITY, RELATED STOCKHOLDER MATTERS AND ISSUER PURCHASES OF EQUITY SECURITIES.
UAL's common stock is listed on the Nasdaq Global Select Market ("Nasdaq") under the symbol "UAL." As of February 18, 2020, there were 5,073 holders of record of UAL common stock.
The following graph shows the cumulative total stockholder return for UAL's common stock during the period from December 31, 2014 to December 31, 2019. The graph also shows the cumulative returns of the Standard and Poor's 500 Index ("SPX") and the NYSE Arca Airline Index ("XAL") of 14 investor-owned airlines over the same five-year period. The comparison assumes $100 was invested on December 31, 2014 in each of UAL common stock, the SPX and the XAL.
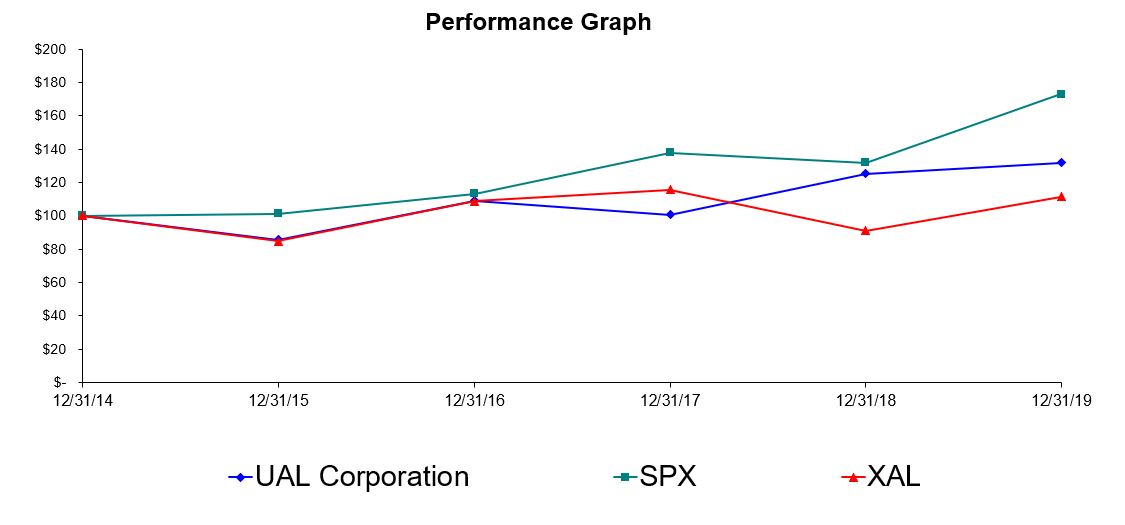
Note: The stock price performance shown in the graph above should not be considered indicative of potential future stock price performance. The foregoing performance graph is being furnished as part of this report solely in accordance with the requirement under Rule 14a-3(b)(9) to furnish our stockholders with such information, and therefore, shall not be deemed to be filed or incorporated by reference into any filings by the Company under the Securities Act or the Exchange Act.
The following table presents repurchases of UAL common stock made in the fourth quarter of 2019:
| Period | Total number of shares purchased (a) (b) | Average price paid per share (b)(c) | Total number of shares purchased as part of publicly announced plans or programs (a) | Approximate dollar value of shares that may yet be purchased under the plans or programs (in millions) (a) | ||||||||||
| October 2019 | 1,071,915 | $ | 87.65 | 1,071,915 | $ | 3,231 | ||||||||
| November 2019 | 430,400 | 92.70 | 430,400 | 3,191 | ||||||||||
| December 2019 | 922,600 | 88.72 | 922,600 | 3,109 | ||||||||||
| Total | 2,424,915 | 2,424,915 |
(a) In 2019, UAL repurchased approximately 19.2 million shares of UAL common stock for $1.6 billion. In December 2017, UAL's Board of Directors authorized a $3.0 billion share repurchase program to acquire UAL's common stock. In July 2019, UAL's Board of Directors authorized a new $3.0 billion share repurchase program to acquire UAL's common stock, in addition to any amounts remaining under the prior program. As of December 31, 2019, the Company had approximately $3.1 billion remaining to purchase shares under its repurchase programs. UAL may repurchase shares through the open market, privately negotiated transactions, block trades or accelerated share repurchase transactions from time to time in accordance with applicable securities laws.
(b) The table does not include shares withheld from employees to satisfy certain tax obligations due upon the vesting of restricted stock. The United Continental Holdings, Inc. 2017 Incentive Compensation Plan and the United Continental Holdings, Inc. 2008 Incentive Compensation Plan, each provide for the withholding of shares to satisfy tax obligations due upon the vesting of restricted stock. However, these plans do not specify a maximum number of shares that may be withheld for this purpose. A total of 1,930 shares were withheld under the plans in the fourth quarter of 2019 at an average price of $89.67 per share. These shares of common stock withheld to satisfy tax withholding obligations may be deemed to be "issuer purchases" of shares that are required to be disclosed pursuant to this Item.
(c) Average price paid per share is calculated on a settlement basis and excludes commission.
Item 6. SELECTED FINANCIAL DATA.
UAL's consolidated financial statements and statistical data are provided in the tables below:
| Year Ended December 31, | ||||||||||||||||||||
| 2019 | 2018 (a) | 2017 (a) | 2016 | 2015 | ||||||||||||||||
| Income Statement Data (in millions, except per share amounts): | ||||||||||||||||||||
| Operating revenue | $ | 43,259 | $ | 41,303 | $ | 37,784 | $ | 36,558 | $ | 37,864 | ||||||||||
| Operating expense | 38,958 | 38,074 | 34,166 | 32,214 | 32,698 | |||||||||||||||
| Operating income | 4,301 | 3,229 | 3,618 | 4,344 | 5,166 | |||||||||||||||
| Net income | 3,009 | 2,122 | 2,143 | 2,234 | 7,340 | |||||||||||||||
| Basic earnings per share | 11.63 | 7.70 | 7.08 | 6.77 | 19.52 | |||||||||||||||
| Diluted earnings per share | 11.58 | 7.67 | 7.06 | 6.76 | 19.47 | |||||||||||||||
| Balance Sheet Data at December 31 (in millions): | ||||||||||||||||||||
| Unrestricted cash, cash equivalents and short-term investments | $ | 4,944 | $ | 3,950 | $ | 3,798 | $ | 4,428 | $ | 5,196 | ||||||||||
| Total assets | 52,611 | 49,024 | 47,469 | 40,208 | 40,861 | |||||||||||||||
| Debt and finance lease obligations (b) | 14,818 | 13,792 | 13,576 | 11,705 | 11,759 |
(a) Amounts adjusted due to the adoption of Accounting Standard Update No. 2016-02, Leases (Topic 842). See Note 1 to the financial statements contained in Part II, Item 8 of this report for additional information.
(b) Finance leases, under Topic 842, are the equivalent of capital leases under Financial Accounting Standards Board Accounting Standards Codification Topic 840, Leases.
| Year Ended December 31, | ||||||||||||||||||||
| 2019 | 2018 | 2017 | 2016 | 2015 | ||||||||||||||||
| Select operating statistics (a) | ||||||||||||||||||||
| Passengers (thousands) (b) | 162,443 | 158,330 | 148,067 | 143,177 | 140,369 | |||||||||||||||
| Revenue passenger miles ("RPMs") (millions) (c) | 239,360 | 230,155 | 216,261 | 210,309 | 208,611 | |||||||||||||||
| Available seat miles ("ASMs") (millions) (d) | 284,999 | 275,262 | 262,386 | 253,590 | 250,003 | |||||||||||||||
| Cargo revenue ton miles (millions) (e) | 3,329 | 3,425 | 3,316 | 2,805 | 2,614 | |||||||||||||||
| Passenger load factor (f) | 84.0 | % | 83.6 | % | 82.4 | % | 82.9 | % | 83.4 | % | ||||||||||
| Passenger revenue per available seat mile ("PRASM") (cents) | 13.90 | 13.70 | 13.13 | 13.18 | 13.11 | |||||||||||||||
| Total revenue per available seat mile ("TRASM") (cents) | 15.18 | 15.00 | 14.40 | 14.42 | 15.15 | |||||||||||||||
| Average yield per revenue passenger mile ("Yield") (cents) (g) | 16.55 | 16.38 | 15.93 | 15.90 | 15.72 | |||||||||||||||
| Cost per available seat mile ("CASM") (cents) | 13.67 | 13.83 | 13.02 | 12.70 | 13.08 | |||||||||||||||
| Average price per gallon of fuel, including fuel taxes | $ | 2.09 | $ | 2.25 | $ | 1.74 | $ | 1.49 | $ | 1.94 | ||||||||||
| Fuel gallons consumed (millions) | 4,292 | 4,137 | 3,978 | 3,904 | 3,886 | |||||||||||||||
| Average stage length (miles) (h) | 1,460 | 1,446 | 1,460 | 1,473 | 1,487 | |||||||||||||||
| Average daily utilization of each mainline aircraft (hours:minutes) (i) | 10:39 | 10:45 | 10:27 | 10:06 | 10:24 |
(a) Includes data from our regional carriers operating under CPAs unless otherwise noted.
(b) The number of revenue passengers measured by each flight segment flown.
(c) The number of scheduled miles flown by revenue passengers.
(d) The number of seats available for passengers multiplied by the number of scheduled miles those seats are flown.
(e) The number of cargo revenue tons transported multiplied by the number of miles flown.
(f) RPM divided by ASM.
(g) The average passenger revenue received for each revenue passenger mile flown.
(h) Average stage length equals the average distance a flight travels weighted for size of aircraft.
(i) The average number of hours per day that an aircraft flown in revenue service is operated (from gate departure to gate arrival).
Item 7. MANAGEMENT'S DISCUSSION AND ANALYSIS OF FINANCIAL CONDITION AND RESULTS OF OPERATIONS.
Overview
United Airlines Holdings, Inc. (together with its consolidated subsidiaries, "UAL" or the "Company") is a holding company and its principal, wholly-owned subsidiary is United Airlines, Inc. (together with its consolidated subsidiaries, "United"). As UAL consolidates United for financial statement purposes, disclosures that relate to activities of United also apply to UAL, unless otherwise noted. United's operating revenues and operating expenses comprise nearly 100% of UAL's revenues and operating expenses. In addition, United comprises approximately the entire balance of UAL's assets, liabilities and operating cash flows. When appropriate, UAL and United are named specifically for their individual contractual obligations and related disclosures and any significant differences between the operations and results of UAL and United are separately disclosed and explained. We sometimes use the words "we," "our," "us," and the "Company" in this report for disclosures that relate to all of UAL and United.
2019 Highlights
| • | 2019 net income was $3.0 billion, or $11.58 diluted earnings per share, as compared to $2.1 billion, or $7.67 diluted earnings per share, in 2018. |
| • | Revenue for 2019 increased $1.9 billion over 2018 due to a 3.5% growth in ASMs and a PRASM increase of 1.5% in 2019 compared to 2018. |
| • | In 2019, UAL repurchased approximately 19.2 million of its common stock for $1.6 billion. As of December 31, 2019, the Company had approximately $3.1 billion remaining to purchase shares under its share repurchase programs. |
| • | UAL ended 2019 with $6.9 billion in unrestricted liquidity, which consisted of unrestricted cash, cash equivalents, short-term investments and available capacity under the revolving credit facility of its Amended and Restated Credit and Guaranty Agreement (as amended, the "Credit Agreement"). |
| • | RPMs for 2019 increased 4.0% as compared to 2018, and ASMs increased 3.5% from the prior year, resulting in a load factor of 84.0% in 2019 versus 83.6% in 2018. |
| • | For 2019 and 2018, the Company recorded U.S. Department of Transportation on-time arrival rates of 77.9% and 79.8%, respectively, and mainline completion factors of 99.2%. |
Results of Operations
The following discussion provides an analysis of our results of operations and reasons for material changes therein for 2019 as compared to 2018. See "Results of Operations" in Part II, Item 7. Management's Discussion and Analysis of Financial Condition and Results of Operations in the Company's 2018 Annual Report on Form 10-K, filed with the SEC on February 28, 2019 (the "2018 Annual Report"), for analysis of the 2018 results as compared to 2017.
Operating Revenue. The table below illustrates the year-over-year percentage change in the Company's operating revenues for the years ended December 31 (in millions, except percentage changes):
| 2019 | 2018 | Increase (Decrease) | % Change | |||||||||||
| Passenger revenue | $ | 39,625 | $ | 37,706 | $ | 1,919 | 5.1 | |||||||
| Cargo | 1,179 | 1,237 | (58 | ) | (4.7 | ) | ||||||||
| Other operating revenue | 2,455 | 2,360 | 95 | 4.0 | ||||||||||
| Total operating revenue | $ | 43,259 | $ | 41,303 | $ | 1,956 | 4.7 |
The table below presents selected passenger revenue and operating data of the Company, broken out by geographic region, expressed as year-over-year changes:
| Increase (decrease) from 2018 (a): | |||||||||||||||
| Domestic | Atlantic | Pacific | Latin | Total | |||||||||||
| Average fare per passenger | 3.4 | % | (1.9 | )% | (4.0 | )% | 5.9 | % | 2.4 | % | |||||
| Passengers | 2.1 | % | 6.5 | % | 4.0 | % | 3.9 | % | 2.6 | % | |||||
| RPMs (traffic) | 3.5 | % | 6.9 | % | 2.4 | % | 4.0 | % | 4.0 | % | |||||
| ASMs (capacity) | 3.8 | % | 5.8 | % | 0.5 | % | 2.9 | % | 3.5 | % | |||||
| Passenger load factor (points) | (0.2 | ) | 0.8 | 1.5 | 0.9 | 0.4 | |||||||||
| (a) See Part II, Item 6. Selected Financial Data, of this report for the definition of these statistics. |
Passenger revenue increased $1.9 billion, or 5.1%, in 2019 as compared to 2018, primarily due to a 4.0% increase in traffic, continuing strong domestic demand, improvements in average fares in the Latin and Domestic markets, and increases in ancillary fees driven by improved product offerings.
Cargo revenue decreased $58 million, or 4.7%, in 2019 as compared to 2018, primarily due to an approximately 3% decrease in cargo ton miles and a 2% decline in cargo ton mile yield.
In December 2019, a novel strain of coronavirus ("COVID-19") was reported in Wuhan, China. The World Health Organization has declared COVID-19 to constitute a "Public Health Emergency of International Concern." On January 30, 2020, the U.S. Department of State issued a Level 4 "do not travel" advisory for China. The U.S. government has also implemented enhanced screenings, quarantine requirements and travel restrictions in connection with the COVID-19 outbreak. The Company has suspended its flights between the United States and each of Beijing, Chengdu, Shanghai and Hong Kong through April 24, 2020. These routes represented approximately 5% of the Company's 2020 planned capacity and the Company's other trans-Pacific routes represented an additional 10% of the Company's 2020 planned capacity. As of the date of this report, the Company is experiencing an approximately 100% decline in near-term demand to China and an approximately 75% decline in near-term demand on the rest of the Company's trans-Pacific routes. The extent of the impact of the COVID-19 on the Company's operational and financial performance will depend on future developments, including the duration and spread of the outbreak and related travel advisories and restrictions and the impact of the COVID-19 on overall demand for air travel, all of which are highly uncertain and cannot be predicted. If traffic on the Company's trans-Pacific routes were to remain at these levels for an extended period, and/or routes in other parts of the Company's network begin to see significant declines in demand, our results of operations for full year 2020 may be materially adversely affected.
Operating Expense. The table below includes data related to the Company's operating expense for the years ended December 31 (in millions, except percentage changes):
| 2019 | 2018 | Increase (Decrease) | % Change | |||||||||||
| Salaries and related costs | $ | 12,071 | $ | 11,458 | $ | 613 | 5.3 | |||||||
| Aircraft fuel | 8,953 | 9,307 | (354 | ) | (3.8 | ) | ||||||||
| Regional capacity purchase | 2,849 | 2,649 | 200 | 7.6 | ||||||||||
| Landing fees and other rent | 2,543 | 2,449 | 94 | 3.8 | ||||||||||
| Depreciation and amortization | 2,288 | 2,165 | 123 | 5.7 | ||||||||||
| Aircraft maintenance materials and outside repairs | 1,794 | 1,767 | 27 | 1.5 | ||||||||||
| Distribution expenses | 1,651 | 1,558 | 93 | 6.0 | ||||||||||
| Aircraft rent | 288 | 433 | (145 | ) | (33.5 | ) | ||||||||
| Special charges | 246 | 487 | (241 | ) | NM | |||||||||
| Other operating expenses | 6,275 | 5,801 | 474 | 8.2 | ||||||||||
| Total operating expenses | $ | 38,958 | $ | 38,074 | $ | 884 | 2.3 |
Salaries and related costs increased $613 million, or 5.3%, in 2019 as compared to 2018, primarily due to higher contractual pay rates, higher benefit expenses, higher employee incentives and a 4.0% increase in average full-time equivalent employees. Employee incentives included $157 million increase in profit sharing in 2019 as compared to 2018.
Aircraft fuel expense decreased $354 million, or 3.8%, in 2019 as compared to 2018, primarily due to a 7.1% decrease in fuel prices, partially offset by a 3.5% increase in capacity. The table below presents the significant changes in aircraft fuel cost per
gallon for the years ended December 31 (in millions, except percentage changes and per gallon data):
| 2019 | 2018 | % Change | |||||||||
| Fuel expense | $ | 8,953 | $ | 9,307 | (3.8 | ) | |||||
| Total fuel consumption (gallons) | 4,292 | 4,137 | 3.7 | ||||||||
| Average price per gallon | $ | 2.09 | $ | 2.25 | (7.1 | ) |
Regional capacity purchase costs increased $200 million, or 7.6%, in 2019 as compared to 2018, primarily due to a rate increase under various capacity purchase agreements with regional carriers and a 4.1% increase in regional flying.
Depreciation and amortization increased $123 million, or 5.7%, in 2019 as compared to 2018, primarily due to the additions of new and used aircraft and new capital projects related both to infrastructure and information technology.
Aircraft rent decreased $145 million, or 33.5%, in 2019 as compared to 2018, primarily due to the purchase of leased aircraft and the conversion of certain operating leases to finance leases.
The table below presents special charges incurred by the Company during the years ended December 31 (in millions):
| 2019 | 2018 | ||||||
| Impairment of assets | $ | 171 | $ | 377 | |||
| Severance and benefit costs | 16 | 41 | |||||
| Termination of an engine maintenance service agreement | — | 64 | |||||
| (Gains) losses on sale of assets and other special charges | 59 | 5 | |||||
| Total special charges | $ | 246 | $ | 487 |
See Note 14 to the financial statements included in Part II, Item 8 of this report for additional information.
Other operating expenses increased $474 million, or 8.2%, in 2019 as compared to 2018, primarily due to increased purchased services related to airport operations weather-related costs, technology initiatives, catering costs, facility projects and crew-related expenses.
Nonoperating Income (Expense). The following table illustrates the year-over-year dollar and percentage changes in the Company's nonoperating income (expense) for the years ended December 31 (in millions, except percentage changes):
| 2019 | 2018 | Increase (Decrease) | % Change | |||||||||||
| Interest expense | $ | (731 | ) | $ | (670 | ) | $ | 61 | 9.1 | |||||
| Interest capitalized | 85 | 65 | 20 | 30.8 | ||||||||||
| Interest income | 133 | 101 | 32 | 31.7 | ||||||||||
| Unrealized gains (losses) on investments, net | 153 | (5 | ) | 158 | NM | |||||||||
| Miscellaneous, net | (27 | ) | (72 | ) | (45 | ) | (62.5 | ) | ||||||
| Total nonoperating expense, net | $ | (387 | ) | $ | (581 | ) | $ | (194 | ) | (33.4 | ) |
Interest expense increased $61 million, or 9.1%, in 2019 as compared to 2018, primarily due to the conversion of certain operating leases to finance leases and debt issued for the acquisition of new aircraft.
Interest income increased $32 million, or 31.7%, in 2019 as compared to 2018, primarily due to higher levels of cash balances throughout the year.
Unrealized gains (losses) on investments, net increased $158 million in 2019 as compared to 2018, primarily due to the change in market value of certain of its equity investments and derivative assets. See Notes 9 and 14 to the financial statements included in Part II, Item 8 of this report for additional information.
Miscellaneous, net decreased $45 million, or 62.5%, in 2019 as compared to 2018, primarily due to more favorable foreign exchange rates and the remeasurement of postretirement plans due to a plan change.
Income Taxes. See Note 6 to the financial statements included in Part II, Item 8 of this report for information related to income taxes.
Liquidity and Capital Resources
As of December 31, 2019, the Company had $4.9 billion in unrestricted cash, cash equivalents and short-term investments, an increase of approximately $1.0 billion from December 31, 2018. The Company had its entire commitment capacity of $2.0 billion under the revolving credit facility of the Credit Agreement available for borrowings as of December 31, 2019.
We have a significant amount of fixed obligations, including debt, aircraft leases, leases of airport property and other facilities and pension funding obligations. At December 31, 2019, the Company had approximately $14.8 billion of debt and finance lease obligations, including $1.5 billion that are due within the next 12 months. In addition, we have substantial noncancelable commitments for capital expenditures, including the acquisition of new aircraft and related spare engines. As of December 31, 2019, our current liabilities exceeded our current assets by approximately $6.7 billion. However, approximately $7.3 billion of our current liabilities are related to our advance ticket sales and frequent flyer deferred revenue, both of which largely represent revenue to be recognized for travel in the near future and not cash outlays. The deficit in working capital does not have an adverse impact to our cash flows, liquidity or operations.
For 2020, the Company expects approximately $7.0 billion of gross capital expenditures. See Note 13 to the financial statements included in Part II, Item 8 of this report for additional information on commitments.
As of December 31, 2019, a substantial portion of the Company's assets, principally aircraft, route authorities and airport slots, was pledged under various loan and other agreements. Collateral pledged under these loans continues to be sufficient to satisfy the loan covenants. We must sustain our profitability and/or access the capital markets to meet our significant long-term debt and finance lease obligations and future commitments for capital expenditures, including the acquisition of aircraft and related spare engines. See Note 10 to the financial statements included in Part II, Item 8 of this report for additional information on assets provided as collateral by the Company.
The following is a discussion of the Company's sources and uses of cash for 2019 as compared to 2018. See "Liquidity and Capital Resources" in Part II, Item 7. Management's Discussion and Analysis of Financial Condition and Results of Operations in the 2018 Annual Report for a discussion of the Company's sources and uses of cash in 2018 as compared to 2017.
Operating Activities. Cash flow provided by operations for the year ended December 31, 2019 was $6.9 billion compared to $6.2 billion in the same period in 2018. The increase is primarily attributable to an increase in operating income which was $4.3 billion for 2019 as compared to $3.2 billion for 2018.
Investing Activities. The Company's capital expenditures were $4.5 billion and $4.1 billion in 2019 and 2018, respectively. The Company's capital expenditures for both years were primarily attributable to the purchase of aircraft, aircraft improvements, facility and fleet-related costs and the purchase of information technology assets.
In December 2019, United issued the AVH Convertible Loan. For additional information regarding the AVH Convertible Loan, see Note 8 to the financial statements included in Part II, Item 8 of this report.
In November 2018, United, as lender, entered into a Term Loan Agreement (the "BRW Term Loan Agreement") with, among others, BRW Aviation Holding LLC and BRW Aviation LLC ("BRW"), as guarantor and borrower, respectively. BRW Aviation Holding LLC and BRW are affiliates of Synergy Aerospace Corporation, and BRW is the majority shareholder of AVH. Pursuant to the BRW Term Loan Agreement, United provided to BRW a $456 million term loan (the "BRW Term Loan"), secured by a pledge of BRW's equity, as well as BRW's 516 million common shares of AVH (which are eligible to be converted into the same number of preferred shares, which may be deposited with the depositary for AVH's American Depositary Receipts ("ADRs"), the class of AVH securities that trades on the New York Stock Exchange (the "NYSE"), in exchange for 64.5 million ADRs) (such equity and shares, collectively, the "BRW Loan Collateral"). BRW is currently in default under the BRW Term Loan Agreement. The BRW Term Loan was made in conjunction with a revenue-sharing joint business agreement among United, Aerovías del Continente Americano S.A ("Avianca"), a subsidiary of AVH, and Copa as described in Part 1, Item 1 of this report. For additional information regarding the BRW Term Loan Agreement and related agreements, see Notes 8, 9 and 13 to the financial statements included in Part II, Item 8 of this report.
In April 2018, through a wholly-owned subsidiary, the Company invested $138 million in Azul Linhas Aéreas Brasileiras S.A. ("Azul") thus increasing its preferred equity stake in Azul to approximately 8% (representing approximately 2% of the total capital stock of Azul).
Financing Activities. Significant financing events in 2019 were as follows:
Share Repurchases. The Company used $1.6 billion of cash to purchase approximately 19.2 million shares of its common stock during 2019. In December 2017, UAL's Board of Directors authorized a $3.0 billion share repurchase program to acquire UAL's common stock. In July 2019, UAL's Board of Directors authorized a new $3.0 billion share repurchase program to acquire UAL's common stock. As of December 31, 2019, the Company had approximately $3.1 billion remaining to purchase shares under its share repurchase programs.
Debt Issuances. During 2019, United received and recorded $1.8 billion of proceeds as debt related to enhanced equipment trust certificate ("EETC") offerings created in 2019 to finance the purchase of aircraft. Also, United received and recorded $350 million of proceeds from the 4.875% Senior Notes due January 15, 2025 and borrowed approximately $105 million aggregate principal amount from various financial institutions to finance the purchase of several aircraft delivered in 2019. As of December 31, 2019, United had recorded approximately $39 million of debt to finance the construction of an aircraft maintenance and ground service equipment complex at Los Angeles International Airport.
Debt and Finance Lease Principal Payments. During the year ended December 31, 2019, the Company made debt and finance lease principal payments of $1.4 billion.
Significant financing events in 2018 were as follows:
Share Repurchases. The Company used $1.2 billion of cash to purchase approximately 17.5 million shares of its common stock during 2018.
Debt Issuances. During 2018, United received and recorded $1.2 billion of proceeds as debt related to EETC offerings created in 2018 to finance the purchase of aircraft. Also, United borrowed approximately $424 million aggregate principal amount from various financial institutions to finance the purchase of several aircraft delivered in 2018.
Debt and Finance Lease Principal Payments. During the year ended December 31, 2018, the Company made debt and finance lease principal payments of $1.8 billion.
For additional information regarding these Liquidity and Capital Resource matters, see Notes 2, 10, 11 and 13 to the financial statements included in Part II, Item 8 of this report. For information regarding non-cash investing and financing activities, see the Company's statements of consolidated cash flows.
Credit Ratings. As of the filing date of this report, UAL and United had the following corporate credit ratings:
| S&P | Moody's | Fitch | |||
| UAL | BB | Ba2 | BB | ||
| United | BB | * | BB | ||
| *The credit agency does not issue corporate credit ratings for subsidiary entities. |
These credit ratings are below investment grade levels; however, the Company has been able to secure financing with investment grade credit ratings for certain EETCs and term loans. Downgrades from these rating levels, among other things, could restrict the availability, or increase the cost, of future financing for the Company.
Other Liquidity Matters
Below is a summary of additional liquidity matters. See the indicated notes to our consolidated financial statements included in Part II, Item 8 of this report for additional details related to these and other matters affecting our liquidity and commitments.
| Pension and other postretirement plans | Note 7 |
| Long-term debt and debt covenants | Note 10 |
| Leases and capacity purchase agreements | Note 11 |
| Commitments and contingencies | Note 13 |
Contractual Obligations. The Company's business is capital intensive, requiring significant amounts of capital to fund the acquisition of assets, particularly aircraft. In the past, the Company has funded the acquisition of aircraft with cash, by using EETC financing, by entering into finance or operating leases, or through other financings. The Company also often enters into long-term lease commitments with airports to ensure access to terminal, cargo, maintenance and other required facilities.
The table below provides a summary of the Company's material contractual obligations as of December 31, 2019 (in billions):
| 2020 | 2021 | 2022 | 2023 | 2024 | After 2024 | Total | ||||||||||||||||||||||
| Long-term debt (a) | $ | 1.4 | $ | 1.4 | $ | 1.8 | $ | 0.8 | $ | 3.1 | $ | 6.2 | $ | 14.7 | ||||||||||||||
| Finance lease obligations—principal portion | 0.1 | 0.1 | — | — | — | 0.1 | 0.3 | |||||||||||||||||||||
| Total debt and finance lease obligations | 1.5 | 1.5 | 1.8 | 0.8 | 3.1 | 6.3 | 15.0 | |||||||||||||||||||||
| Interest on debt and finance lease obligations (b) | 0.6 | 0.5 | 0.4 | 0.4 | 0.3 | 0.7 | 2.9 | |||||||||||||||||||||
| Operating lease obligations | 0.9 | 0.8 | 0.6 | 0.6 | 0.6 | 4.2 | 7.7 | |||||||||||||||||||||
| Regional CPAs (c) | 2.9 | 2.9 | 2.4 | 1.5 | 1.3 | 4.7 | 15.7 | |||||||||||||||||||||
| Postretirement obligations (d) | 0.1 | 0.1 | 0.1 | 0.1 | 0.1 | 0.3 | 0.8 | |||||||||||||||||||||
| Pension obligations (e) | — | — | — | — | 0.4 | 0.6 | 1.0 | |||||||||||||||||||||
| Capital purchase obligations (f) | 6.9 | 4.3 | 2.0 | 1.0 | 1.2 | 11.3 | 26.7 | |||||||||||||||||||||
| Total contractual obligations | $ | 12.9 | $ | 10.1 | $ | 7.3 | $ | 4.4 | $ | 7.0 | $ | 28.1 | $ | 69.8 |
(a) Long-term debt presented in the Company's financial statements is net of $181 million of debt discount, premiums and debt issuance costs which are being amortized over the debt terms. Contractual payments do not include the debt discount, premiums and debt issuance costs.
(b) Includes interest portion of finance lease obligations of $14 million in 2020, $11 million in 2021, $8 million in 2022, $6 million in 2023, $4 million in 2024 and $5 million thereafter. Interest payments on variable interest rate debt were calculated using London interbank offered rates ("LIBOR") applicable at December 31, 2019.
(c) Represents our estimates of future minimum noncancelable commitments under our CPAs and does not include the portion of the underlying obligations for aircraft and facility rent that is disclosed as part of operating lease obligations. Amounts also exclude a portion of United's finance lease obligation recorded for certain of its CPAs. See Note 11 to the financial statements included in Part II, Item 8 of this report for the significant assumptions used to estimate the payments.
(d) Amounts represent postretirement benefit payments through 2029. Benefit payments approximate plan contributions as plans are substantially unfunded.
(e) Represents an estimate of the minimum funding requirements as determined by government regulations for United's U.S. pension plans. Amounts are subject to change based on numerous assumptions, including the performance of assets in the plans and bond rates.
(f) Represents contractual commitments for firm order aircraft, spare engines and other capital purchase commitments. See Note 13 to the financial statements included in Part II, Item 8 of this report for a discussion of our purchase commitments.
Off-Balance Sheet Arrangements. An off-balance sheet arrangement is any transaction, agreement or other contractual arrangement involving an unconsolidated entity under which a company has (1) made guarantees, (2) a retained or a contingent interest in transferred assets, (3) an obligation under derivative instruments classified as equity, or (4) any obligation arising out of a material variable interest in an unconsolidated entity that provides financing, liquidity, market risk or credit risk support, or that engages in leasing, hedging or research and development arrangements. The Company's primary off-balance sheet arrangements include guarantees that are discussed below and variable-rate operating leases. See Note 11 to the financial statements included in Part II, Item 8 of this report for more information related to variable-rate operating leases.
Letters of Credit and Surety Bonds. As of December 31, 2019, United had cash collateralized $73 million of letters of credit, which generally have evergreen clauses and are expected to be renewed on an annual basis. As of December 31, 2019, United also had $414 million of surety bonds securing various obligations with expiration dates through 2023.
Guarantee of BRW Commitment. In connection with funding the BRW Term Loan Agreement, the Company entered into an agreement with Kingsland, pursuant to which, in return for Kingsland's pledge of its 144.8 million common shares of AVH (which are eligible to be converted into the same number of preferred shares, which may be deposited with the depositary for AVH's ADRs, the class of AVH securities that trades on the NYSE, in exchange for 18.1 million ADRs) and its consent to BRW's pledge of its AVH common shares to United under the BRW Term Loan Agreement and related agreements, United (1) granted to Kingsland the right to put its AVH common shares to United at market price on the fifth anniversary of the BRW Term Loan Agreement or upon certain sales of AVH common shares owned by BRW, including upon a foreclosure, and (2) guaranteed BRW's obligation to pay Kingsland the difference (which amount, if paid by United, will increase the BRW Term Loan by such amount) if the market price of AVH common shares on the fifth anniversary, or upon any such sale, as applicable, is less than $12 per ADR, for an aggregate maximum possible combined put payment and guarantee amount on the fifth anniversary, or upon such sale, as applicable, of $217 million. In 2018, the Company recorded a liability of $31 million for the fair value of its guarantee to loan additional funds to BRW if required. Any such additional loans to BRW would be collateralized by BRW's AVH shares and other collateral.
Guarantee of Debt of Others. As of December 31, 2019, United is the guarantor of $132 million of aircraft mortgage debt issued by one of United's regional carriers. The aircraft mortgage debt is subject to increased cost provisions and the Company would potentially be responsible for those costs under the guarantees. The increased cost provisions in the $132 million of aircraft mortgage debt are similar to those in certain of the Company's debt agreements. See discussion under Increased Cost Provisions, below, for additional information on increased cost provisions related to the Company's debt.
EETCs. As of December 31, 2019, United had $9.6 billion principal amount of equipment notes outstanding issued under EETC financings. Generally, the structure of these EETC financings consists of pass-through trusts created by United to issue pass-through certificates, which represent fractional undivided interests in the respective pass-through trusts and are not obligations of United. The proceeds of the issuance of the pass-through certificates are used to purchase equipment notes which are issued by United and secured by its aircraft. The payment obligations under the equipment notes are those of United. Proceeds received from the sale of pass-through certificates are initially held by a depositary in escrow for the benefit of the certificate holders until United issues equipment notes to the trust, which purchases such notes with a portion of the escrowed funds. These escrowed funds are not guaranteed by United and are not reported as debt on United's consolidated balance sheet because the proceeds held by the depositary are not United's assets. The total amount of EETC funds held in escrow was $328 million as of December 31, 2019. See Note 10 to the financial statements included in Part II, Item 8 of this report for additional information.
Fuel Consortia. United participates in numerous fuel consortia with other air carriers at major airports to reduce the costs of fuel distribution and storage. Interline agreements govern the rights and responsibilities of the consortia members and provide for the allocation of the overall costs to operate the consortia based on usage. The consortia (and in limited cases, the participating carriers) have entered into long-term agreements to lease certain airport fuel storage and distribution facilities that are typically financed through tax-exempt bonds, either special facilities lease revenue bonds or general airport revenue bonds, issued by various local municipalities. In general, each consortium lease agreement requires the consortium to make lease payments in amounts sufficient to pay the maturing principal and interest payments on the bonds. As of December 31, 2019, approximately $1.9 billion principal amount of such bonds were secured by significant fuel facility leases in which United participates, as to which United and each of the signatory airlines has provided indirect guarantees of the debt. As of December 31, 2019, the Company's contingent exposure was approximately $175 million principal amount of such bonds based on its recent consortia participation. The Company's contingent exposure could increase if the participation of other air carriers decreases. The guarantees will expire when the tax-exempt bonds are paid in full, which ranges from 2022 to 2051. The Company did not record a liability at the time these indirect guarantees were made.
Increased Cost Provisions. In United's financing transactions that include loans in which United is the borrower, United typically agrees to reimburse lenders for any reduced returns with respect to the loans due to any change in capital requirements and, in the case of loans with respect to which the interest rate is based on LIBOR, for certain other increased costs that the lenders incur in carrying these loans as a result of any change in law, subject, in most cases, to obligations of the lenders to take certain limited steps to mitigate the requirement for, or the amount of, such increased costs. At December 31, 2019, the Company had $3.4 billion of floating rate debt with remaining terms of up to 11 years that are subject to these increased cost provisions. In several financing transactions involving loans or leases from non-U.S. entities, with remaining terms of up to 11 years and an aggregate balance of $3.2 billion, the Company bears the risk of any change in tax laws that would subject loan or lease payments thereunder to non-U.S. entities to withholding taxes, subject to customary exclusions.
Critical Accounting Policies
Critical accounting policies are defined as those that are affected by significant judgments and uncertainties which potentially could result in materially different accounting under different assumptions and conditions. The Company has prepared the financial statements in conformity with accounting principles generally accepted in the United States of America ("GAAP"), which requires management to make estimates and assumptions that affect the reported amounts in the financial statements. Actual results could differ from those estimates under different assumptions or conditions. The Company has identified the following critical accounting policies that impact the preparation of the financial statements.
Frequent Flyer Accounting. United's MileagePlus loyalty program builds customer loyalty by offering awards, benefits and services to program participants. Members in this program earn miles for travel on United, United Express, Star Alliance members and certain other airlines that participate in the program. Members can also earn miles by purchasing goods and services from our network of non-airline partners. We have contracts to sell miles to these partners with the terms extending from one to nine years. These partners include domestic and international credit card issuers, retail merchants, hotels, car rental companies and our participating airline partners. Miles can be redeemed for free (other than taxes and government-imposed fees), discounted or upgraded air travel and non-travel awards.
Miles Earned in Conjunction with Travel. When frequent flyers earn miles for flights, the Company recognizes a portion of the ticket sales as revenue when the travel occurs and defers a portion of the ticket sale representing the value of the related miles as a separate performance obligation. The Company determines the estimated selling price of travel and miles as if each element is sold on a separate basis. The total consideration from each ticket sale is then allocated to each of these elements, individually, on a pro-rata basis. At the time of travel, the Company records the portion allocated to the miles to Frequent flyer deferred revenue on the Company's consolidated balance sheet and subsequently recognizes it into revenue when miles are redeemed for air travel and non-air travel awards.
Co-Brand Agreement. United has a significant contract (the "Co-Brand Agreement") to sell MileagePlus miles to its co-branded credit card partner JPMorgan Chase Bank, N.A. ("Chase"). Chase awards miles to MileagePlus members based on their credit card activity. United identified the following significant separately identifiable performance obligations in the Co-Brand Agreement:
| • | MileagePlus miles awarded – United has a performance obligation to provide MileagePlus cardholders with miles to be used for air travel and non-travel award redemptions. The Company records Passenger revenue related to the travel awards when the transportation is provided and records Other revenue related to the non-travel awards when the goods or services are delivered. The Company records the cost associated with non-travel awards in Other operating revenue. |
| • | Marketing – United has a performance obligation to provide Chase access to United's customer list and the use of United's brand. Marketing revenue is recorded to Other operating revenue as miles are delivered to Chase. |
| • | Advertising – United has a performance obligation to provide advertising in support of the MileagePlus card in various customer contact points such as United's website, email promotions, direct mail campaigns, airport advertising and in-flight advertising. Advertising revenue is recorded to Other operating revenue as miles are delivered to Chase. |
| • | Other travel-related benefits – United's performance obligations are comprised of various items such as waived bag fees, seat upgrades and lounge passes. Lounge passes are recorded to Other operating revenue as customers use the lounge passes. Bag fees and seat upgrades are recorded to Passenger revenue at the time of the associated travel. |
We account for all the payments received (including monthly and one-time payments) under the Co-Brand Agreement by allocating them to the separately identifiable performance obligations. The fair value of the separately identifiable performance obligations is determined using management's estimated selling price of each component. The objective of using the estimated selling price based methodology is to determine the price at which we would transact a sale if the product or service were sold on a stand-alone basis. Accordingly, we determine our best estimate of selling price by considering multiple inputs and methods including, but not limited to, discounted cash flows, brand value, volume discounts, published selling prices, number of miles awarded and number of miles redeemed. The Company estimated the selling prices and volumes over the term of the Co-Brand Agreement in order to determine the allocation of proceeds to each of the components to be delivered. We also evaluate volumes on an annual basis, which may result in a change in the allocation of the estimated consideration from the Co-Brand Agreement on a prospective basis.
In February 2020, the Company announced that they had entered into a Third Amended and Restated Co-Branded Card Marketing Services Agreement (as amended from time to time, the "Agreement") with Chase. The Agreement, which replaces the Co-Brand Agreement, also extends the term into 2029 and modifies certain other terms. We will continue to account for the considerations received under the Agreement to the separately identifiable performance obligations using the estimated selling price allocation methodology explained above. In connection with the Agreement the Company, entered into an Amended and Restated Co-Branded Card Strategic Alliance Agreement with Visa U.S.A. Inc.
Estimate of Miles Not Expected to be Redeemed. The Company's estimated selling price of miles is based on an equivalent ticket value less breakage, which incorporates the expected redemption of miles, as the best estimate of selling price for these miles. The equivalent ticket value is based on the prior 12 months' weighted average equivalent ticket value of similar fares as those used to settle award redemptions while taking into consideration such factors as redemption pattern, cabin class, loyalty status and geographic region. The estimated selling price of miles is adjusted by breakage that considers a number of factors, including redemption patterns of various customer groups. The Company's breakage model is based on the assumption that the likelihood that an account will redeem its miles can be estimated based on a consideration of the account's historical behavior. The Company uses a logit regression model to estimate the probability that an account will redeem its current miles balance. The Company reviews its breakage estimates annually based upon the latest available information. The Company's estimate of the expected breakage of miles requires significant management judgment. Current and future changes to breakage assumptions, or to program rules and program redemption opportunities, may result in material changes to the deferred revenue balance as well as recognized revenues from the program. For the portion of the outstanding miles that we estimate will not be redeemed, we recognize the associated value proportionally as the remaining miles are redeemed.
The following table summarizes information related to the Company's Frequent flyer deferred revenue liability:
| Frequent flyer deferred revenue at December 31, 2019 (in millions) | $ | 5,276 | ||
| Percentage of miles earned not expected to be redeemed | 14 | % | ||
| Impact of 1% change in outstanding miles expected to be redeemed or weighted average ticket value on deferred revenue (in millions) | $ | 53 |
BRW Notes Receivable. The BRW Term Loan, currently in default, is secured by a pledge of BRW's equity, as well as BRW's 516 million common shares of AVH. In order to protect the value of its collateral, on May 24, 2019, United began to exercise certain remedies available to it under the terms of the BRW Term Loan Agreement and related documents. In connection with the delivery by United of a notice of default to BRW, Kingsland Holdings Limited ("Kingsland"), AVH's largest minority shareholder, was granted, in accordance with the agreements related to the BRW Term Loan Agreement, authority to manage BRW, which remains the majority shareholder of AVH. In addition, Kingsland is pursuing a foreclosure process which is expected to result in a judicially supervised sale of the collateral, following the grant of summary judgment by a New York state court on September 26, 2019.
United evaluated the $499 million carrying value of the BRW Term Loan as of December 31, 2019 using the fair value of the collateral and determined that the value of the collateral is sufficient to recover the carrying value of the BRW Term Loan. As a result, the Company concluded that the BRW Term Loan is not impaired. The carrying value of the BRW Term Loan represents the original loan amount plus accrued and unpaid interest and certain expenses associated with the loan origination.
The fair market value of AVH equity was estimated using an income approach and a market approach with equal weight applied to each approach. Under the income approach, the value was estimated by discounting expected future cash flows at a weighted average cost of capital to a single present value amount. Under the market approach, the value was estimated by reference to multiples of enterprise value to earnings before interest, taxes, depreciation, amortization and rent ("EBITDAR") for a group of publicly-traded market comparable companies, along with AVH's own EBITDAR levels.
See Note 8 to the financial statements included in Part II, Item 8 of this report for additional information.
Indefinite-lived intangible assets. The Company has indefinite-lived intangible assets, including goodwill. Goodwill and indefinite-lived intangible assets are not amortized but are reviewed for impairment on an annual basis as of October 1, or on an interim basis whenever a triggering event occurs. An impairment occurs when the fair value of an intangible asset is less than its carrying value. The Company determines the fair value using a variation of the income approach known as the excess earnings method, which discounts an asset's projected future net cash flows to determine the current fair value. Assumptions used in the discounted cash flow methodology include a discount rate, which is based upon the Company's current weighted average cost of capital plus an asset-specific risk factor, and a projection of sales, expenses, gross margin, tax rates and contributory asset charges for several future years and a terminal growth rate. The assumptions used for future projections are determined based upon the Company's asset-specific forecasts along with the Company's strategic plan. These assumptions are inherently uncertain as they relate to future events and circumstances. Actual results will be influenced by the competitive environment, fuel costs and other expenses, and potentially other unforeseen events or circumstances that could have a material impact on future results.
See Note 1 and 14 to the financial statements included in Part II, Item 8 of this report for additional information.
Forward-Looking Information
Certain statements throughout Part II, Item 7. Management's Discussion and Analysis of Financial Condition and Results of Operations, and elsewhere in this report are forward-looking and thus reflect the Company's current expectations and beliefs with respect to certain current and future events and anticipated financial and operating performance. Such forward-looking statements are and will be subject to many risks and uncertainties relating to the Company's operations and business environment that may cause actual results to differ materially from any future results expressed or implied in such forward-looking statements. Words such as "expects," "will," "plans," "anticipates," "indicates," "believes," "estimates," "forecast," "guidance," "outlook," "goals", "targets" and similar expressions are intended to identify forward-looking statements.
Additionally, forward-looking statements include statements that do not relate solely to historical facts, such as statements which identify uncertainties or trends, discuss the possible future effects of current known trends or uncertainties, or which indicate that the future effects of known trends or uncertainties cannot be predicted, guaranteed or assured. All forward-looking statements in this report are based upon information available to us on the date of this report. We undertake no obligation to publicly update or revise any forward-looking statement, whether as a result of new information, future events, changed circumstances or otherwise, except as required by applicable law.
Our actual results could differ materially from these forward-looking statements due to numerous factors including, without limitation, the following: our ability to execute our strategic operating plan, including our growth, revenue-generating and cost-control initiatives; general economic conditions (including interest rates, foreign currency exchange rates, investment or credit market conditions, crude oil prices, costs of aircraft fuel and energy refining capacity in relevant markets); risks of doing business globally, including instability and political developments that may impact our operations in certain countries; demand for travel and the impact that global economic and political conditions have on customer travel patterns; our capacity decisions and the capacity decisions of our competitors; competitive pressures on pricing and on demand; changes in aircraft fuel prices; disruptions in our supply of aircraft fuel; our ability to cost-effectively hedge against increases in the price of aircraft fuel, if we decide to do so; the effects of any technology failures, cybersecurity or significant data breaches; disruptions to services provided by third-party service providers; potential reputational or other impact from adverse events involving our aircraft or operations, the aircraft or operations of our regional carriers or our code share partners or the aircraft or operations of another airline; our ability to attract and retain customers; the effects of any terrorist attacks, international hostilities or other security events, or the fear of such events; the mandatory grounding of aircraft in our fleet; disruptions to our regional network; the
impact of regulatory, investigative and legal proceedings and legal compliance risks; the success of our investments in other airlines, including in other parts of the world; industry consolidation or changes in airline alliances; the ability of other air carriers with whom we have alliances or partnerships to provide the services contemplated by the respective arrangements with such carriers; costs associated with any modification or termination of our aircraft orders; disruptions in the availability of aircraft, parts or support from our suppliers; our ability to maintain satisfactory labor relations and the results of any collective bargaining agreement process with our union groups; any disruptions to operations due to any potential actions by our labor groups; labor costs; an outbreak of a disease that affects travel demand or travel behavior, such as the existing threat of COVID-19; the impact of any management changes; extended interruptions or disruptions in service at major airports where we operate; U.S. or foreign governmental legislation, regulation and other actions (including Open Skies agreements, environmental regulations and the United Kingdom's withdrawal from the European Union); the seasonality of the airline industry; weather conditions; the costs and availability of aviation and other insurance; the costs and availability of financing; our ability to maintain adequate liquidity; our ability to comply with the terms of our various financing arrangements; our ability to realize the full value of our intangible assets and long-lived assets; any impact to our reputation or brand image and other risks and uncertainties set forth under Part I, Item 1A., Risk Factors, of this report, as well as other risks and uncertainties set forth from time to time in the reports we file with the SEC.
Item 7A. QUANTITATIVE AND QUALITATIVE DISCLOSURES ABOUT MARKET RISK.
Interest Rates. Our net income is affected by fluctuations in interest rates (e.g. interest expense on variable rate debt and interest income earned on short-term investments). The Company's policy is to manage interest rate risk through a combination of fixed and variable rate debt. The following table summarizes information related to the Company's interest rate market risk at December 31 (in millions):
| 2019 | 2018 | ||||||
| Variable rate debt | |||||||
| Carrying value of variable rate debt at December 31 | $ | 3,408 | $ | 3,500 | |||
| Impact of 100 basis point increase on projected interest expense for the following year | 33 | 35 | |||||
| Fixed rate debt | |||||||
| Carrying value of fixed rate debt at December 31 | 11,144 | 9,945 | |||||
| Fair value of fixed rate debt at December 31 | 11,736 | 9,901 | |||||
| Impact of 100 basis point increase in market rates on fair value | (458 | ) | (378 | ) |
As announced in July 2017, LIBOR is expected to be phased out by the end of 2021. Uncertainty as to the nature of alternative reference rates and as to potential changes or other reforms to LIBOR may adversely impact our interest rates and related interest expense. As of December 31, 2019, the Company had $3.4 billion in variable rate indebtedness. See Part II, Item 7. Management's Discussion and Analysis of Financial Condition and Results of Operations—Other Liquidity Matters, of this report, for more information on interest expense.
A change in market interest rates would also impact interest income earned on our cash, cash equivalents and short-term investments. Assuming our cash, cash equivalents and short-term investments remain at their average 2019 levels, a 100 basis point increase in interest rates would result in a corresponding increase in the Company's interest income of approximately $47 million during 2020.
Commodity Price Risk (Aircraft Fuel). The price of aircraft fuel can significantly affect the Company's operations, results of operations, financial position and liquidity.
Our operational and financial results can be significantly impacted by changes in the price and availability of aircraft fuel. To provide adequate supplies of fuel, the Company routinely enters into purchase contracts that are customarily indexed to market prices for aircraft fuel, and the Company generally has some ability to cover short-term fuel supply and infrastructure disruptions at some major demand locations. The Company's current strategy is to not enter into transactions to hedge fuel price volatility, although the Company regularly reviews its policy based on market conditions and other factors. The Company's 2020 forecasted fuel consumption is presently approximately 4.5 billion gallons, and based on this forecast, a one-dollar change in the price of a barrel of crude oil would change the Company's annual fuel expense by approximately $108 million.
Foreign Currency. The Company generates revenues and incurs expenses in numerous foreign currencies. Changes in foreign currency exchange rates impact the Company's results of operations through changes in the dollar value of foreign currency-denominated operating revenues and expenses. Some of the Company's more significant foreign currency exposures include the Canadian dollar, Chinese renminbi, European euro, British pound and Japanese yen. The Company's current strategy is to not enter into transactions to hedge its foreign currency sales, although the Company regularly reviews its policy based on market conditions and other factors.
The result of a uniform 1% strengthening in the value of the U.S. dollar from December 31, 2019 levels relative to each of the currencies in which the Company has foreign currency exposure would result in a decrease in pre-tax income of approximately $23 million for the year ending December 31, 2020. This sensitivity analysis was prepared based upon projected 2020 foreign currency-denominated revenues and expenses as of December 31, 2019.
Item 8. FINANCIAL STATEMENTS AND SUPPLEMENTARY DATA.
REPORT OF INDEPENDENT REGISTERED PUBLIC ACCOUNTING FIRM
To the Stockholders and the Board of Directors of United Airlines Holdings, Inc.
Opinion on the Financial Statements
We have audited the accompanying consolidated balance sheets of United Airlines Holdings, Inc. (the "Company") as of December 31, 2019 and 2018, the related statements of consolidated operations, comprehensive income (loss), cash flows, and stockholders' equity for each of the three years in the period ended December 31, 2019, and the related notes and financial statement schedule listed in the Index at Item 15(a) (collectively referred to as the "consolidated financial statements"). In our opinion, the consolidated financial statements present fairly, in all material respects, the financial position of the Company at December 31, 2019 and 2018, and the results of its operations and its cash flows for each of the three years in the period ended December 31, 2019, in conformity with U.S. generally accepted accounting principles.
We also have audited, in accordance with the standards of the Public Company Accounting Oversight Board (United States) ("PCAOB"), the Company's internal control over financial reporting as of December 31, 2019, based on criteria established in Internal Control-Integrated Framework issued by the Committee of Sponsoring Organizations of the Treadway Commission (2013 framework) and our report dated February 24, 2020, expressed an unqualified opinion thereon.
Adoption of ASU No. 2016-02
As discussed in Note 1 to the consolidated financial statements, the Company changed its method of accounting for leases in 2019, 2018 and 2017 due to the adoption of ASU No. 2016-02, Leases (Topic 842).
Basis for Opinion
These financial statements are the responsibility of the Company's management. Our responsibility is to express an opinion on the Company's financial statements based on our audits. We are a public accounting firm registered with the PCAOB and are required to be independent with respect to the Company in accordance with the U.S. federal securities laws and the applicable rules and regulations of the Securities and Exchange Commission and the PCAOB.
We conducted our audits in accordance with the standards of the PCAOB. Those standards require that we plan and perform the audit to obtain reasonable assurance about whether the financial statements are free of material misstatement, whether due to error or fraud. Our audits included performing procedures to assess the risks of material misstatement of the financial statements, whether due to error or fraud, and performing procedures that respond to those risks. Such procedures included examining, on a test basis, evidence regarding the amounts and disclosures in the financial statements. Our audits also included evaluating the accounting principles used and significant estimates made by management, as well as evaluating the overall presentation of the financial statements. We believe that our audits provide a reasonable basis for our opinion.
Critical Audit Matters
The critical audit matters communicated below are matters arising from the current period audit of the financial statements that were communicated or required to be communicated to the audit committee and that: (1) relate to accounts or disclosures that are material to the financial statements and (2) involved our especially challenging, subjective or complex judgments. The communication of critical audit matters does not alter in any way our opinion on the consolidated financial statements, taken as a whole, and we are not, by communicating the critical audit matters below, providing separate opinions on the critical audit matters or on the accounts or disclosures to which they relate.
| Frequent Flyer Deferred Revenue Estimate of Miles not Expected to be Redeemed | ||
| Description of the Matter | At December 31, 2019, the Company's frequent flyer deferred revenue liability was $5.3 billion. As described in Note 1 of the consolidated financial statements, members of the Company's MileagePlus program earn miles through the Company's flights, purchases with other airlines or non-airline partners or through co-branded credit card partnerships. Consideration is attributed to the miles earned or sold and deferred until the miles are redeemed and air travel is completed, or non-air awards are shipped. Miles can be redeemed for air travel and non-travel awards. | |
| Auditing management's breakage estimate (the estimate of miles earned that will not be redeemed) was complex and highly judgmental due to the significant assumptions used in the estimate. Breakage is estimated annually using prior years' data and a regression analysis to estimate future breakage, which can be impacted by changes in customer behavior driven by program changes or redemption opportunities that would not be reflected in historical redemption data. | ||
| How We Addressed the Matter in Our Audit | We tested the Company's design and operating effectiveness of internal controls that address the risk of material misstatement relating to the breakage estimate. This included testing controls over management's review of the significant assumptions and other inputs used in the estimate, including redemption patterns of various customer groups. | |
| Our audit procedures included, among others, testing the methodology and assumptions used to develop the breakage estimate, including testing the completeness and accuracy of the underlying data used to develop these assumptions. In addition, we assessed the trending of the breakage rate over time to ensure changes were in line with expectations. We involved a valuation specialist to test management's statistical analysis supporting the breakage assumption. | ||
| BRW Term Loan Impairment Analysis | ||
| Description of the Matter | At December 31, 2019, the Company had a term loan agreement with, among others, BRW Aviation Holdings LLC and BRW Aviation LLC, dated as of November 29, 2018 (the "BRW Term Loan"), which had a carrying value of $499 million. The BRW Term Loan is collateralized by common shares of Avianca Holdings S.A. ("AVH") and the equity of BRW (such shares and equity, collectively, the "BRW Loan Collateral"). As discussed in Note 8 of the consolidated financial statements, the fair market value of the BRW Loan Collateral is estimated using an income approach and a market approach, with equal weight applied to each approach. Under the income approach, the value was estimated by discounting expected future cash flows to a single present value amount. Under the market approach, the value was estimated by reference to multiples of enterprise value to earnings before interest, taxes, depreciation, amortization and rent ("EBITDAR") for a group of publicly-traded market comparable companies, along with AVH's own EBITDAR levels. | |
| Auditing management's valuation of the BRW Loan Collateral was highly judgmental due to the significant estimation required in determining the fair value. The fair value estimate was sensitive to significant assumptions such as multiples of enterprise value to EBITDAR, revenue and cost growth rates and the discount rate, each of which is affected by expectations about future market or economic conditions. As a result of the subjectivity of the assumptions, adverse changes to management's estimates could reduce the underlying cash flows used to estimate fair value and trigger impairment of the loan. | ||
| How We Addressed the Matter in Our Audit | We tested the Company's design and operating effectiveness of internal controls that address the risk of material misstatement relating to the fair market value of the BRW Loan Collateral. This included testing controls over management's review of the significant as |
Showing the first 8K of 203K characters. Open the full section
Item 9. CHANGES IN AND DISAGREEMENTS WITH ACCOUNTANTS ON ACCOUNTING AND FINANCIAL DISCLOSURE.
None.
Item 9A. CONTROLS AND PROCEDURES
Evaluation of Disclosure Control and Procedures
UAL and United each maintain controls and procedures that are designed to ensure that information required to be disclosed in the reports filed or submitted by UAL and United to the SEC is recorded, processed, summarized and reported, within the time periods specified by the SEC's rules and forms, and is accumulated and communicated to management including the Chief Executive Officer and Chief Financial Officer, as appropriate, to allow timely decisions regarding required disclosure. The management of UAL and United, including the Chief Executive Officer and Chief Financial Officer, performed an evaluation to conclude with reasonable assurance that UAL's and United's disclosure controls and procedures were designed and operating effectively to report the information each company is required to disclose in the reports they file with the SEC on a timely basis. Based on that evaluation, the Chief Executive Officer and the Chief Financial Officer of UAL and United have concluded that as of December 31, 2019, disclosure controls and procedures were effective.
Changes in Internal Control over Financial Reporting during the Quarter Ended December 31, 2019
During the three months ended December 31, 2019, there was no change in UAL's or United's internal control over financial reporting that materially affected, or is reasonably likely to materially affect, their internal control over financial reporting.
REPORT OF INDEPENDENT REGISTERED PUBLIC ACCOUNTING FIRM
To the Stockholders and Board of Directors of United Airlines Holdings, Inc.
Opinion on Internal Control over Financial Reporting
We have audited United Airlines Holdings, Inc.'s (the "Company") internal control over financial reporting as of December 31, 2019, based on criteria established in Internal Control-Integrated Framework issued by the Committee of Sponsoring Organizations of the Treadway Commission (2013 framework) (the "COSO criteria"). In our opinion, the Company maintained, in all material respects, effective internal control over financial reporting as of December 31, 2019, based on the COSO criteria.
We also have audited, in accordance with the standards of the Public Company Accounting Oversight Board (United States) ("PCAOB"), the consolidated financial statements as of and for the year ended December 31, 2019 of the Company and our report dated February 24, 2020 expressed an unqualified opinion thereon.
Basis for Opinion
The Company's management is responsible for maintaining effective internal control over financial reporting and for its assessment of the effectiveness of internal control over financial reporting included in the accompanying Management Report on Internal Control over Financial Reporting in Item 9A. Our responsibility is to express an opinion on the Company's internal control over financial reporting based on our audit. We are a public accounting firm registered with the PCAOB and are required to be independent with respect to the Company in accordance with the U.S. federal securities laws and the applicable rules and regulations of the Securities and Exchange Commission and the PCAOB.
We conducted our audit in accordance with the standards of the PCAOB. Those standards require that we plan and perform the audit to obtain reasonable assurance about whether effective internal control over financial reporting was maintained in all material respects.
Our audit included obtaining an understanding of internal control over financial reporting, assessing the risk that a material weakness exists, testing and evaluating the design and operating effectiveness of internal control based on the assessed risk, and performing such other procedures as we considered necessary in the circumstances. We believe that our audit provides a reasonable basis for our opinion.
Definition and Limitations of Internal Control Over Financial Reporting
A company's internal control over financial reporting is a process designed to provide reasonable assurance regarding the reliability of financial reporting and the preparation of financial statements for external purposes in accordance with generally accepted accounting principles. A company's internal control over financial reporting includes those policies and procedures that (1) pertain to the maintenance of records that, in reasonable detail, accurately and fairly reflect the transactions and dispositions of the assets of the company; (2) provide reasonable assurance that transactions are recorded as necessary to permit preparation of financial statements in accordance with generally accepted accounting principles, and that receipts and expenditures of the company are being made only in accordance with authorizations of management and directors of the company; and (3) provide reasonable assurance regarding prevention or timely detection of unauthorized acquisition, use, or disposition of the company's assets that could have a material effect on the financial statements.
Because of its inherent limitations, internal control over financial reporting may not prevent or detect misstatements. Also, projections of any evaluation of effectiveness to future periods are subject to the risk that controls may become inadequate because of changes in conditions, or that the degree of compliance with the policies or procedures may deteriorate.
/s/ Ernst & Young LLP
Chicago, Illinois
February 24, 2020
United Airlines Holdings, Inc. Management Report on Internal Control Over Financial Reporting
February 24, 2020
To the Stockholders of United Airlines Holdings, Inc.
Chicago, Illinois
The management of United Airlines Holdings, Inc. ("UAL") is responsible for establishing and maintaining adequate internal control over financial reporting, as such term is defined in Exchange Act Rules 13a-15(f). Our internal control over financial reporting is designed to provide reasonable assurance regarding the reliability of financial reporting and the preparation of financial statements for external purposes in accordance with generally accepted accounting principles. Because of its inherent limitations, our internal control over financial reporting may not prevent or detect misstatements. Also, projections of any evaluation of effectiveness to future periods are subject to the risk that controls may become inadequate because of changes in conditions, or that the degree of compliance with the policies or procedures may deteriorate.
Under the supervision and with the participation of management, including our Chief Executive Officer and Chief Financial Officer, we conducted an evaluation of the design and operating effectiveness of our internal control over financial reporting as of December 31, 2019. In making this assessment, management used the framework set forth in Internal Control—Integrated Framework (2013 Framework) issued by the Committee of the Sponsoring Organizations of the Treadway Commission. Based on this evaluation, our Chief Executive Officer and Chief Financial Officer concluded that our internal control over financial reporting was effective as of December 31, 2019.
Our independent registered public accounting firm, Ernst & Young LLP, who audited UAL's consolidated financial statements included in this Form 10-K, has issued a report on UAL's internal control over financial reporting, which is included herein.
United Airlines, Inc. Management Report on Internal Control Over Financial Reporting
February 24, 2020
To the Stockholder of United Airlines, Inc.
Chicago, Illinois
The management of United Airlines, Inc. ("United") is responsible for establishing and maintaining adequate internal control over financial reporting, as such term is defined in Exchange Act Rules 13a-15(f). United's internal control over financial reporting is designed to provide reasonable assurance regarding the reliability of financial reporting and the preparation of financial statements for external purposes in accordance with generally accepted accounting principles. Because of its inherent limitations, United's internal control over financial reporting may not prevent or detect misstatements. Also, projections of any evaluation of effectiveness to future periods are subject to the risk that controls may become inadequate because of changes in conditions, or that the degree of compliance with the policies or procedures may deteriorate.
Under the supervision and with the participation of management, including United's Chief Executive Officer and Chief Financial Officer, United conducted an evaluation of the design and operating effectiveness of its internal control over financial reporting as of December 31, 2019. In making this assessment, management used the framework set forth in Internal Control—Integrated Framework (2013 Framework) issued by the Committee of the Sponsoring Organizations of the Treadway Commission. Based on this evaluation, United's Chief Executive Officer and Chief Financial Officer concluded that its internal control over financial reporting was effective as of December 31, 2019.
This annual report does not include an attestation report of United's registered public accounting firm regarding internal control over financial reporting. Management's report was not subject to attestation by United's registered public accounting firm pursuant to the rules of the Securities and Exchange Commission that permit United to provide only management's report in this annual report.
Item 9B. OTHER INFORMATION.
None.
PART III
Item 10. DIRECTORS, EXECUTIVE OFFICERS AND CORPORATE GOVERNANCE.
Certain information required by this item with respect to UAL is incorporated by reference from UAL's definitive proxy statement for its 2020 Annual Meeting of Stockholders under the captions "Election of Directors" and "Corporate Governance." Information regarding the executive officers of UAL is presented in Part I, Item 1 of this report. There are no family relationships among the executive officers or the directors of UAL. The executive officers are elected by UAL's Board of Directors each year and hold office until the next annual meeting of stockholders, until their successors are elected and qualified, or until their earlier death, resignation or removal.
Information required by this item with respect to United is omitted pursuant to General Instruction I(2)(c) of Form 10-K.
Code of Ethics. The Company has a code of ethics, the "Code of Ethics and Business Conduct," for its directors, officers and employees. The code serves as a "Code of Ethics" as defined by SEC regulations, and as a "Code of Conduct" under Nasdaq Listing Rule 5610. The code is available on the Company's investor relations website at ir.united.com. Waivers granted to certain officers from compliance with or future amendments to the code will be disclosed on the Company's investor relations website in accordance with Item 5.05 of Form 8-K.
Item 11. EXECUTIVE COMPENSATION.
Information required by this item with respect to UAL is incorporated by reference from UAL's definitive proxy statement for its 2020 Annual Meeting of Stockholders under the captions "Executive Compensation," "2019 Director Compensation" and "Corporate Governance—Compensation Committee Interlocks and Insider Participation."
Information required by this item with respect to United is omitted pursuant to General Instruction I(2)(c) of Form 10-K.
Item 12. SECURITY OWNERSHIP OF CERTAIN BENEFICIAL OWNERS AND MANAGEMENT AND RELATED STOCKHOLDER MATTERS.
Information required by this item with respect to UAL is incorporated by reference from UAL's definitive proxy statement for its 2020 Annual Meeting of Stockholders under the caption "Beneficial Ownership of Securities."
Information required by this item with respect to United is omitted pursuant to General Instruction I(2)(c) of Form 10-K.
Item 13. CERTAIN RELATIONSHIPS AND RELATED TRANSACTIONS, AND DIRECTOR INDEPENDENCE.
Information required by this item with respect to UAL is incorporated by reference from UAL's definitive proxy statement for its 2020 Annual Meeting of Stockholders under the captions "Corporate Governance—Certain Relationships and Related Transactions," "Corporate Governance—Committees of the Board" and "Corporate Governance—Director Independence."
Information required by this item with respect to United is omitted pursuant to General Instruction I(2)(c) of Form 10-K.
Item 14. PRINCIPAL ACCOUNTANT FEES AND SERVICES.
The Audit Committee of the UAL Board of Directors has adopted a policy on pre-approval of services of the Company's independent registered public accounting firm. As a wholly-owned subsidiary of UAL, United's audit services are determined by UAL. The policy provides that the Audit Committee shall pre-approve all audit and non-audit services to be provided to UAL and its subsidiaries and affiliates by its independent auditors. The process by which this is carried out is as follows:
For recurring services, the Audit Committee reviews and pre-approves the independent registered public accounting firm's annual audit services in conjunction with the annual appointment of the outside auditors. The reviewed materials include a description of the services along with related fees. The Audit Committee also reviews and pre-approves other classes of recurring services along with fee thresholds for pre-approved services. In the event that the additional services are required prior to the next scheduled Audit Committee meeting, pre-approvals of additional services follow the process described below.
Any requests for audit, audit related, tax and other services not contemplated with the recurring services approval described above must be submitted to the Audit Committee for specific pre-approval and cannot commence until such approval has been granted. Normally, pre-approval is provided at regularly scheduled meetings. However, the authority to grant specific pre-approval between meetings, as necessary, has been delegated to the Chair of the Audit Committee. The Chair must update the Audit Committee at the next regularly scheduled meeting of any services that were granted specific pre-approval.
On a periodic basis, the Audit Committee reviews the status of services and fees incurred year-to-date and a list of newly pre-approved services since its last regularly scheduled meeting. The Audit Committee has considered whether the 2019 and 2018 non-audit services provided by Ernst & Young LLP, the Company's independent registered public accounting firm, are compatible with maintaining auditor independence.
All of the services in 2019 and 2018 under the Audit Fees, Audit Related Fees, Tax Fees and All Other Fees categories below have been approved by the Audit Committee pursuant to paragraph (c)(7) of Rule 2-01 of Regulation S-X of the Exchange Act.
The aggregate fees billed for professional services rendered by the Company's independent auditors in 2019 and 2018 are as follows (in thousands):
| Service | 2019 | 2018 | ||||||
| Audit Fees | $ | 4,323 | $ | 3,992 | ||||
| Audit Related Fees | 403 | 375 | ||||||
| Tax Fees | 174 | 166 | ||||||
| All Other Fees | — | 2 | ||||||
| Total Fees | $ | 4,900 | $ | 4,535 | ||||
| Note: UAL and United amounts are the same. |
Audit Fees. For 2019 and 2018, audit fees consist primarily of the audit and quarterly reviews of the consolidated financial statements and the audit of the effectiveness of internal control over financial reporting of United Airlines Holdings, Inc. and its wholly-owned subsidiaries. Audit fees also include the audit of the consolidated financial statements of United, attestation services required by statute or regulation, comfort letters, consents, assistance with and review of documents filed with the SEC, and accounting and financial reporting consultations and research work necessary to comply with generally accepted auditing standards.
Audit Related Fees. For 2019, fees for audit-related services primarily consisted of accounting consultations for proposed or future transactions and identifying and testing changes in the internal control environment prior to the implementation of the new revenue accounting system, which went into effect during the third quarter of 2019. For 2018, fees for audit-related services consisted of consultations related to the adoption of new accounting standards prior to adoption.
Tax Fees. Tax fees for 2019 and 2018 relate to professional services provided for research and consultations regarding tax accounting and tax compliance matters and review of U.S. and international tax impacts of certain transactions, exclusive of tax services rendered in connection with the audit.
All Other Fees. Fees for all other services billed in 2018 consist of subscriptions to Ernst & Young LLP's on-line accounting research tool.
PART IV
Item 15. EXHIBITS AND FINANCIAL STATEMENT SCHEDULES.
| (a) | List of documents filed as part of this report: | |
| (1) | Financial Statements. The financial statements required by this item are listed in Part II, Item 8, Financial Statements and Supplementary Data herein. | |
| (2) | Financial Statement Schedules. The financial statement schedule required by this item is listed below and included in this report after the signature page hereto. |
| Schedule II-Valuation and Qualifying Accounts for the years ended December 31, 2019, 2018 and 2017. | ||
| All other schedules are omitted because they are not applicable, not required or the required information is shown in the consolidated financial statements or notes thereto. | ||
| (b) | Exhibits. The exhibits required by this item are provided in the Exhibit Index. |
Item 16. FORM 10-K SUMMARY.
None.
EXHIBIT INDEX
| Interactive Data File | ||
| 101 | UAL United | The following financial statements from the combined Annual Report of UAL and United on Form 10-K for the year ended December, 2019, formatted in Inline XBRL: (i) the Statements of Consolidated Operations, (ii) the Statements of Consolidated Comprehensive Income (Loss), (iii) the Consolidated Balance Sheets, (iv) the Statements of Consolidated Cash Flows, (v) the Statements of Consolidated Stockholders' Equity (Deficit) and (vi) the Combined Notes to Condensed Consolidated Financial Statements, tagged as blocks of text and including detailed tags. |
| 104 | UAL United | Cover Page Interactive Data File - the cover page XBRL tags are embedded within the Inline XBRL document |
| † | Indicates management contract or compensatory plan or arrangement. Pursuant to Item 601(b)(10), United is permitted to omit certain compensation-related exhibits from this report and therefore only UAL is identified as the registrant for purposes of those items. |
| ^ | Portions of the referenced exhibit have been omitted pursuant to Item 601(b) of Regulation S-K. |
SIGNATURES
Pursuant to the requirements of Section 13 or 15(d) of the Securities Exchange Act of 1934, each registrant has duly caused this report to be signed on its behalf by the undersigned, thereunto duly authorized.
| UNITED AIRLINES HOLDINGS, INC. UNITED AIRLINES, INC. (Registrants) | ||
| By: | /s/ Gerald Laderman | |
| Gerald Laderman | ||
| Executive Vice President and Chief Financial Officer | ||
| Date: | February 24, 2020 |
Pursuant to the requirements of the Securities Exchange Act of 1934, this report has been signed below by the following persons on behalf of United Airlines Holdings, Inc. and in the capacities and on the date indicated.
| Signature | Capacity | |
| /s/ Oscar Munoz | Chief Executive Officer, Director | |
| Oscar Munoz | (Principal Executive Officer) | |
| /s/ Gerald Laderman | Executive Vice President and Chief Financial Officer | |
| Gerald Laderman | (Principal Financial Officer) | |
| /s/ Chris Kenny | Vice President and Controller | |
| Chris Kenny | (Principal Accounting Officer) | |
| /s/ Carolyn Corvi | Director | |
| Carolyn Corvi | ||
| /s/ Jane C. Garvey | Director | |
| Jane C. Garvey | ||
| /s/ Barney Harford | Director | |
| Barney Harford | ||
| /s/ Michele J. Hooper | Director | |
| Michele J. Hooper | ||
| /s/ Todd M. Insler | Director | |
| Todd M. Insler |
| /s/ Walter Isaacson | Director | |
| Walter Isaacson | ||
| /s/ James A.C. Kennedy | Director | |
| James A.C. Kennedy | ||
| /s/ Sito Pantoja | Director | |
| Sito Pantoja | ||
| /s/ Edward M. Philip | Director | |
| Edward M. Philip | ||
| /s/ Edward L. Shapiro | Director | |
| Edward L. Shapiro | ||
| /s/ David J. Vitale | Director | |
| David J. Vitale | ||
| /s/ James M. Whitehurst | Director | |
| James M. Whitehurst |
| Date: | February 24, 2020 |
Pursuant to the requirements of the Securities Exchange Act of 1934, this report has been signed below by the following persons on behalf of United Airlines, Inc. and in the capacities and on the date indicated.
| Signature | Capacity | |
| /s/ Oscar Munoz | Chief Executive Officer, Director | |
| Oscar Munoz | (Principal Executive Officer) | |
| /s/ Gerald Laderman | Executive Vice President and Chief Financial Officer, Director | |
| Gerald Laderman | (Principal Financial Officer) | |
| /s/ Chris Kenny | Vice President and Controller | |
| Chris Kenny | (Principal Accounting Officer) | |
| /s/ Gregory L. Hart | Director | |
| Gregory L. Hart | ||
| /s/ J. Scott Kirby | Director | |
| J. Scott Kirby | ||
| Date: | February 24, 2020 |
Schedule II
Valuation and Qualifying Accounts
For the Years Ended December 31, 2019**,** 2018 and 2017
| (In millions) Description | Balance at Beginning of Period | Additions Charged to Costs and Expenses | Deductions | Other | Balance at End of Period | ||||||||||||||
| Allowance for doubtful accounts: | |||||||||||||||||||
| 2019 | $ | 8 | $ | 17 | $ | 16 | $ | — | $ | 9 | |||||||||
| 2018 | 7 | 17 | 16 | — | 8 | ||||||||||||||
| 2017 | 10 | 20 | 23 | — | 7 | ||||||||||||||
| Obsolescence allowance—spare parts: | |||||||||||||||||||
| 2019 | $ | 412 | $ | 76 | $ | 63 | $ | — | $ | 425 | |||||||||
| 2018 | 354 | 73 | 15 | — | 412 | ||||||||||||||
| 2017 | 295 | 75 | 17 | 1 | 354 | ||||||||||||||
| Valuation allowance for deferred tax assets: | |||||||||||||||||||
| 2019 | $ | 59 | $ | — | $ | 1 | $ | — | $ | 58 | |||||||||
| 2018 | 63 | 2 | 6 | — | 59 | ||||||||||||||
| 2017 | 68 | 11 | 27 | 11 | 63 |