 filings.tools
Item 2. MANAGEMENT’S DISCUSSION AND ANALYSIS OF FINANCIAL CONDITION AND RESULTS OF OPERATIONS
79K characters. Original on sec.gov · Markdown
Item 2. MANAGEMENT’S DISCUSSION AND ANALYSIS OF FINANCIAL CONDITION AND RESULTS OF OPERATIONS
The following discussion and analysis of our financial condition and results of operations should be read in conjunction with our condensed consolidated financial statements and the related notes and other financial information included elsewhere in this Quarterly Report on Form 10-Q and our audited consolidated financial statements included in our 2022 Annual Report on Form 10-K. In addition to historical consolidated financial information, the following discussion contains forward-looking statements that reflect our plans, estimates, and beliefs. Our actual results could differ materially from those discussed in the forward-looking statements. You should review the sections titled “Special Note Regarding Forward-Looking Statements” for a discussion of forward-looking statements and Part II, Item 1A, “Risk Factors” for a discussion of factors that could cause actual results to differ materially from the results described in or implied by the forward-looking statements contained in the following discussion and analysis and elsewhere in this Quarterly Report on Form 10-Q.
Overview
We are a technology platform that uses a massive network, leading technology, operational excellence, and product expertise to power movement from point A to point B. We develop and operate proprietary technology applications supporting a variety of offerings on our platform. We connect consumers with providers of ride services, merchants as well as delivery service providers for meal preparation, grocery and other delivery services. Uber also connects consumers with public transportation networks. We use this same network, technology, operational excellence, and product expertise to connect Shippers with Carriers in the freight industry by providing Carriers with the ability to book a shipment, transportation management and other logistics services. We are also developing technologies designed to provide new solutions to everyday problems.
Driver Classification Developments
The classification of Drivers is currently being challenged in courts, by legislators and by government agencies in the United States and abroad. We are involved in numerous legal proceedings globally, including putative class and collective class action lawsuits, demands for arbitration, charges and claims before administrative agencies, and investigations or audits by labor, social security, and tax authorities that claim that Drivers should be treated as our employees (or as workers or quasi-employees where those statuses exist), rather than as independent contractors. Of particular note are proceedings in California, where on May 5, 2020, the California Attorney General, in conjunction with the city attorneys for San Francisco, Los Angeles and San Diego, filed a complaint in San Francisco Superior Court (the “Court”) against Uber and Lyft, Inc., alleging that drivers are misclassified, and sought an injunction and monetary damages related to the alleged competitive advantage caused by the alleged misclassification of drivers.
On August 10, 2020, the Court issued a preliminary injunction order prohibiting us from classifying Drivers as independent contractors and from violating various wage and hour laws. Following a stay of the injunction and our unsuccessful appeal of the injunction to a Court of Appeal, we were ordered to comply with the preliminary injunction. In November 2020, California voters approved Proposition 22, a state ballot initiative that provides a framework for drivers that use platforms like ours for independent work. Proposition 22 went into effect in December 2020. Although our stipulation to dissolve the California Attorney General’s preliminary injunction was granted in April 2021, that litigation remains pending, and we also may face liability relating to periods before the effective date of Proposition 22.
In January 2021, a petition was filed with the California Supreme Court by several drivers and a labor union alleging that Proposition 22 is unconstitutional, which was denied. The same drivers and labor union have since filed a similar challenge in California Superior Court, and in August 2021, the Alameda County Superior Court ruled that Proposition 22 is unconstitutional. On September 21, 2021, the State of California filed an appeal of that decision with the California Court of Appeal, and the Protect App-Based Drivers and Services organization, who intervened in the matter, has also filed an appeal. Oral argument was heard on December 13, 2022.
On March 13, 2023, the California Court of Appeal overturned a lower court’s ruling that Prop 22 is unconstitutional, which means that Prop 22 remains in effect. The ruling struck down part of Prop 22 that intruded on the legislature and judiciary’s power. The court ruled that a section of the measure that defined legislation on certain topics (i.e., unions for gig workers) as amendments to the Proposition was invalid. Service Employees International Union has petitioned the California Supreme Court for appellate review.
To comply with Proposition 22, we have incurred and expect to incur additional expenses, including expenses associated with a guaranteed minimum earnings floor for Drivers, insurance for injury protection and subsidies for health care. We do not expect these changes will have a material impact on our business, results of operations, financial position, or cash flows.
Also of note, on October 28, 2015, a claim by 25 Drivers, including Mr. Y. Aslam and Mr. J. Farrar, was brought in the United Kingdom (“UK”) Employment Tribunal against us asserting that they should be classified as “workers” (a separate category between independent contractors and employees) in the UK rather than independent contractors. The tribunal ruled on October 28, 2016 that the Drivers were workers whenever our App is switched on and they are ready and able to take trips, based on an assessment of the App in July 2016. The Court of Appeal rejected our appeal in a majority decision on December 19, 2018. We appealed to the Supreme Court and a hearing at the Supreme Court took place in July 2020.
On February 19, 2021, the Supreme Court of the UK upheld the tribunal ruling that the Drivers using the App in 2016 were workers for UK employment law purposes. Damages include back pay including holiday pay and minimum wage, which will be assessed and quantified at a future hearing.
On March 16, 2021, we announced that more than 70,000 drivers in the UK will be treated as workers, earning at least the National Living Wage when driving with Uber. They will also be paid for holiday time and all those eligible will be automatically enrolled into a pension plan. We have also completed a settlement process with drivers in the UK to proactively resolve historical claims relating to their classification under UK law. Our portal for drivers to register for a settlement of historical holiday pay and national minimum wage liabilities closed on July 22, 2021 and we have extended offers to all drivers eligible for settlement who are not already represented by an attorney and have made payments to the drivers who accepted our offers. Compensation hearings will take place for claimants who have not settled their historic claims, where the tribunal will assess our position on the correct approach to working time, expenses, and holiday pay.
On June 23, 2021, we received a compliance notice from the UK pension regulator to facilitate our auto-enrollment implementation. We have completed the enrollment of eligible drivers in the UK into a pension plan. While the ultimate resolution of these matters is uncertain, we have recorded an immaterial accrual for these matters within accrued and other current liabilities on the condensed consolidated balance sheets as of March 31, 2023.
If, as a result of legislation or judicial decisions, we are required to classify Drivers as employees, workers or quasi-employees where those statuses exist, we would incur significant additional expenses for compensating Drivers, including expenses associated with the application of wage and hour laws (including minimum wage, overtime, and meal and rest period requirements), employee benefits, social security contributions, taxes (direct and indirect), and potential penalties. Additionally, we may not have adequate Driver supply as Drivers may opt out of our platform given the loss of flexibility under an employment model, and we may not be able to hire a majority of the Drivers currently using our platform. Any of these events could negatively impact our business, results of operations, financial position, and cash flows.
For a discussion of risk factors related to how misclassification challenges may impact our business, result of operations, financial position and operating condition and cash flows, see the risk factor titled “-Our business would be adversely affected if Drivers were classified as employees, workers or quasi-employees” included in Part II, Item 1A, “Risk Factors”, and Note 11 – Commitments and Contingencies in the notes to the condensed consolidated financial statements included in Part I, Item 1, of this Quarterly Report on Form 10-Q.
In addition, if we are required to classify Drivers as employees, this may impact our current financial statement presentation including revenue, cost of revenue, incentives and promotions as further described in our significant and critical accounting policies in the section titled “Critical Accounting Policies and Estimates” and Note 1 in the section titled “Notes to the Consolidated Financial Statements” included in our Annual Report on Form 10-K for the year ended December 31, 2022.
Financial and Operational Highlights
| Three Months Ended March 31, | ||||||||||||||||||||||||||
| (In millions, except percentages) | 2022 | 2023 | 2022 to 2023 % Change | % Change (Constant Currency (1)****) | ||||||||||||||||||||||
| Monthly Active Platform Consumers (“MAPCs”) (2) | 115 | 130 | 13 | % | ||||||||||||||||||||||
| Trips (2) | 1,713 | 2,124 | 24 | % | ||||||||||||||||||||||
| Gross Bookings (2) | $ | 26,449 | $ | 31,408 | 19 | % | 22 | % | ||||||||||||||||||
| Revenue | $ | 6,854 | $ | 8,823 | 29 | % | 33 | % | ||||||||||||||||||
| Loss from operations | $ | (482) | $ | (262) | 46 | % | ||||||||||||||||||||
| Net loss attributable to Uber Technologies, Inc. (3) | $ | (5,930) | $ | (157) | ** | |||||||||||||||||||||
| Mobility Adjusted EBITDA | $ | 618 | $ | 1,060 | 72 | % | ||||||||||||||||||||
| Delivery Adjusted EBITDA | $ | 30 | $ | 288 | ** | |||||||||||||||||||||
| Adjusted EBITDA (1), (2) | $ | 168 | $ | 761 | 353 | % | ||||||||||||||||||||
| Net cash provided by operating activities | $ | 15 | $ | 606 | ** | |||||||||||||||||||||
| Free cash flow (1) | $ | (47) | $ | 549 | ** |
(1) See the section titled “Reconciliations of Non-GAAP Financial Measures” for more information and reconciliations to the most directly comparable GAAP financial measure.
(2) See the section titled “Certain Key Metrics and Non-GAAP Financial Measures” for more information.
(3) Net loss attributable to Uber Technologies, Inc. included stock-based compensation expense of $359 million and $470 million in the first quarter of 2022 and 2023, respectively.
** Percentage not meaningful.
Highlights for the First Quarter 2023
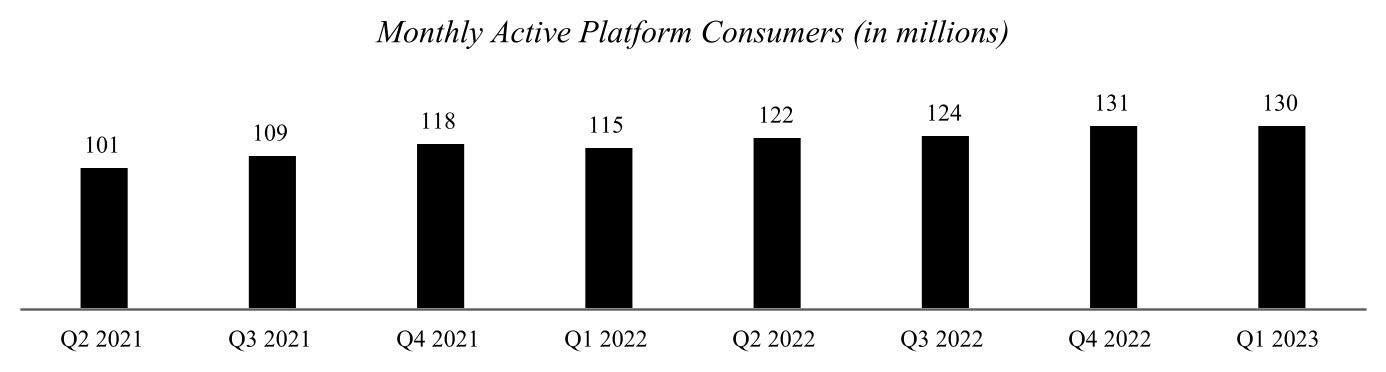
In the first quarter of 2023, our MAPCs were 130 million, declining 1 million, or 1%, quarter-over-quarter, but growing 13% compared to the same period in 2022. The quarter-over-quarter decline in MAPCs was related to the seasonal decline in activity following the fourth quarter of 2022. The year-over-year growth was driven by continued improvement in consumer activity for our Mobility offerings.
Overall Gross Bookings increased to $31.4 billion in the first quarter of 2023, up 19% or 22% on a constant currency basis, compared to the same period in 2022. Mobility Gross Bookings grew 43% year-over-year, on a constant currency basis primarily due to increases in Trip volumes. Delivery Gross Bookings grew 12% year-over-year, on a constant currency basis, primarily driven by a 6% increase in basket sizes globally, on a constant currency basis. Freight Gross Bookings declined 23% year-over-year, on a constant currency basis, primarily attributable to macroeconomic headwinds impacting the broader freight industry.
Revenue was $8.8 billion, up 29% year-over-year. Revenue growth outpaced Gross Bookings growth primarily due to the net favorable impact to Mobility revenue of $925 million as a result of business model changes in some countries that classify certain payments and incentives as cost of revenue, exclusive of depreciation and amortization.
Net loss attributable to Uber Technologies, Inc. was $157 million, which includes the favorable impact of a pre-tax unrealized gain on debt and equity securities, net of $320 million primarily related to a $357 million unrealized gain on our Didi investment and a $54 million unrealized gain on our Aurora investment, partially offset by a $113 million unrealized loss on our Grab investment. Net loss attributable to Uber Technologies, Inc. also includes $470 million of stock-based compensation expense.
Adjusted EBITDA was $761 million, up $593 million compared to the same period in 2022. Mobility Adjusted EBITDA profit was $1.1 billion, up $442 million from the same period in 2022. Delivery Adjusted EBITDA profit was $288 million, up $258 million from the same period in 2022.
We ended the quarter with $4.2 billion in unrestricted cash, cash equivalents and short-term investments.
Components of Results of Operations
Revenue
We generate substantially all of our revenue from fees paid by Drivers and Merchants for use of our platform. We have concluded that we are an agent in these arrangements as we arrange for other parties to provide the service to the end-user. Under this model, revenue is net of Driver and Merchant earnings and Driver incentives. We act as an agent in these transactions by connecting consumers to Drivers and Merchants to facilitate a Trip, meal or grocery delivery service.
In 2022, we modified our arrangements in certain markets and, as a result, concluded we are responsible for the provision of Mobility services to end-users in those markets. We have determined that in these transactions, end-users are our customers and our sole performance obligation in the transaction is to provide transportation services to the end-user. We recognize revenue when a trip is complete. In these markets where we are responsible for Mobility services, we present revenue from end-users on a gross basis, as we control the service provided by Drivers to end-users, while payments to Drivers in exchange for Mobility services are recognized in cost of revenue, exclusive of depreciation and amortization.
For additional discussion related to our revenue, see the section titled “Management’s Discussion and Analysis of Financial Condition and Results of Operations - Critical Accounting Policies and Estimates - Revenue Recognition,” “Note 1 - Description of Business and Summary of Significant Accounting Policies - Revenue Recognition,” and “Note 2 - Revenue” to our audited consolidated financial statements included in our Annual Report Form 10-K for the year ended December 31, 2022 and Note 2 – Revenue in this Quarterly Report in Form 10-Q.
Cost of Revenue, Exclusive of Depreciation and Amortization
Cost of revenue, exclusive of depreciation and amortization, primarily consists of certain insurance costs related to our Mobility and Delivery offerings, credit card processing fees, bank fees, data center and networking expenses, mobile device and service costs, costs incurred with Carriers for Uber Freight transportation services, amounts related to fare chargebacks and other credit card losses as well as costs incurred for certain Mobility and Delivery transactions where we are primarily responsible for Mobility or Delivery services and pay Drivers and Couriers for services.
We expect that cost of revenue, exclusive of depreciation and amortization, will fluctuate on an absolute dollar basis for the foreseeable future in line with Trip volume changes on the platform. As Trips increase or decrease, we expect related changes for insurance costs, credit card processing fees, hosting and co-located data center expenses, maps license fees, and other cost of revenue, exclusive of depreciation and amortization.
Operations and Support
Operations and support expenses primarily consist of compensation expenses, including stock-based compensation, for employees that support operations in cities, including the general managers, Driver operations, platform user support representatives and community managers. Also included is the cost of customer support, Driver background checks and the allocation of certain corporate costs.
As our business recovers from the impacts of COVID-19 and Trip volume increases, we would expect operations and support expenses to increase on an absolute dollar basis for the foreseeable future, but decrease as a percentage of revenue as we become more efficient in supporting platform users.
Sales and Marketing
Sales and marketing expenses primarily consist of compensation costs, including stock-based compensation to sales and marketing employees, advertising costs, product marketing costs and discounts, loyalty programs, promotions, refunds, and credits provided to end-users who are not customers, and the allocation of certain corporate costs. We expense advertising and other promotional expenditures as incurred.
As our business recovers from the impacts of COVID-19, we would anticipate sales and marketing expenses to increase on an absolute dollar basis for the foreseeable future but vary from period to period as a percentage of revenue due to timing of marketing campaigns.
Research and Development
Research and development expenses primarily consist of compensation costs, including stock-based compensation, for employees in engineering, design and product development. Expenses include ongoing improvements to, and maintenance of, existing products and services, and allocation of certain corporate costs. We expense substantially all research and development expenses as incurred.
We expect research and development expenses to increase and vary from period to period as a percentage of revenue as we continue to invest in research and development activities relating to ongoing improvements to and maintenance of our platform offerings and other research and development programs.
General and Administrative
General and administrative expenses primarily consist of compensation costs, including stock-based compensation, for executive management and administrative employees, including finance and accounting, human resources, policy and communications, legal, and certain impairment charges, as well as allocation of certain corporate costs, occupancy, and general corporate insurance costs. General and administrative expenses also include certain legal settlements.
As our business recovers from the impacts of COVID-19 and Trip volume increases, we expect that general and administrative expenses will increase on an absolute dollar basis for the foreseeable future, but decrease as a percentage of revenue as we achieve improved fixed cost leverage and efficiencies in our internal support functions.
Depreciation and Amortization
Depreciation and amortization expenses primarily consist of depreciation on buildings, site improvements, computer and network equipment, software, leasehold improvements, furniture and fixtures, and amortization of intangible assets. Depreciation includes expenses associated with buildings, site improvements, computer and network equipment, and furniture, fixtures, as well as leasehold improvements. Amortization includes expenses associated with our capitalized internal-use software and acquired intangible assets.
Interest Expense
Interest expense consists primarily of interest expense associated with our outstanding debt, including accretion of debt discount. For additional detail related to our debt obligations, see Note 5 – Long-Term Debt and Revolving Credit Arrangements in the notes to the condensed consolidated financial statements included in Part I, Item 1, of this Quarterly Report on Form 10-Q.
Other Income (Expense), Net
Other income (expense), net primarily includes the following items:
-
Interest income, which consists primarily of interest earned on our cash and cash equivalents, short-term investments, restricted cash and cash equivalents and restricted investments.
-
Foreign currency exchange gains (losses), net, which consist primarily of remeasurement of transactions and monetary assets and liabilities denominated in currencies other than the functional currency at the end of the period.
-
Unrealized gain (loss) on debt and equity securities, net, which consists primarily of gains (losses) from fair value adjustments relating to our marketable and non-marketable securities.
-
Impairment of equity method investment.
-
Revaluation of MLU B.V. call option, which represents changes in fair value recorded on the call option granted to Yandex (“MLU B.V. Call Option”).
-
Other, net.
Provision for (Benefit from) Income Taxes
We are subject to income taxes in the United States and foreign jurisdictions in which we do business. These foreign jurisdictions have different statutory tax rates than those in the United States. Additionally, certain of our foreign earnings may also be taxable in the United States. Accordingly, our effective tax rate will vary depending on the relative proportion of foreign to domestic income, changes in the valuation allowance on our U.S. and Netherlands' deferred tax assets, and changes in tax laws.
Equity Method Investments
Equity method investments primarily includes the results of our share of income or loss from our Yandex.Taxi joint venture.
Results of Operations
The following table summarizes our condensed consolidated statements of operations for each of the periods presented (in millions):
| Three Months Ended March 31, | ||||||||||||||||||||||||||
| 2022 | 2023 | |||||||||||||||||||||||||
| Revenue | $ | 6,854 | $ | 8,823 | ||||||||||||||||||||||
| Costs and expenses | ||||||||||||||||||||||||||
| Cost of revenue, exclusive of depreciation and amortization shown separately below | 4,026 | 5,259 | ||||||||||||||||||||||||
| Operations and support | 574 | 640 | ||||||||||||||||||||||||
| Sales and marketing | 1,263 | 1,262 | ||||||||||||||||||||||||
| Research and development | 587 | 775 | ||||||||||||||||||||||||
| General and administrative | 632 | 942 | ||||||||||||||||||||||||
| Depreciation and amortization | 254 | 207 | ||||||||||||||||||||||||
| Total costs and expenses | 7,336 | 9,085 | ||||||||||||||||||||||||
| Loss from operations | (482) | (262) | ||||||||||||||||||||||||
| Interest expense | (129) | (168) | ||||||||||||||||||||||||
| Other income (expense), net | (5,557) | 292 | ||||||||||||||||||||||||
| Loss before income taxes and income from equity method investments | (6,168) | (138) | ||||||||||||||||||||||||
| Provision for (benefit from) income taxes | (232) | 55 | ||||||||||||||||||||||||
| Income from equity method investments | 18 | 36 | ||||||||||||||||||||||||
| Net loss including non-controlling interests | (5,918) | (157) | ||||||||||||||||||||||||
| Less: net income (loss) attributable to non-controlling interests, net of tax | 12 | — | ||||||||||||||||||||||||
| Net loss attributable to Uber Technologies, Inc. | $ | (5,930) | $ | (157) |
The following table sets forth the components of our condensed consolidated statements of operations for each of the periods presented as a percentage of revenue (1):
| Three Months Ended March 31, | ||||||||||||||||||||||||||
| 2022 | 2023 | |||||||||||||||||||||||||
| Revenue | 100 | % | 100 | % | ||||||||||||||||||||||
| Costs and expenses | ||||||||||||||||||||||||||
| Cost of revenue, exclusive of depreciation and amortization shown separately below | 59 | % | 60 | % | ||||||||||||||||||||||
| Operations and support | 8 | % | 7 | % | ||||||||||||||||||||||
| Sales and marketing | 18 | % | 14 | % | ||||||||||||||||||||||
| Research and development | 9 | % | 9 | % | ||||||||||||||||||||||
| General and administrative | 9 | % | 11 | % | ||||||||||||||||||||||
| Depreciation and amortization | 4 | % | 2 | % | ||||||||||||||||||||||
| Total costs and expenses | 107 | % | 103 | % | ||||||||||||||||||||||
| Loss from operations | (7) | % | (3) | % | ||||||||||||||||||||||
| Interest expense | (2) | % | (2) | % | ||||||||||||||||||||||
| Other income (expense), net | (81) | % | 3 | % | ||||||||||||||||||||||
| Loss before income taxes and income from equity method investments | (90) | % | (2) | % | ||||||||||||||||||||||
| Provision for (benefit from) income taxes | (3) | % | 1 | % | ||||||||||||||||||||||
| Income from equity method investments | — | % | — | % | ||||||||||||||||||||||
| Net loss including non-controlling interests | (86) | % | (2) | % | ||||||||||||||||||||||
| Less: net income (loss) attributable to non-controlling interests, net of tax | — | % | — | % | ||||||||||||||||||||||
| Net loss attributable to Uber Technologies, Inc. | (87) | % | (2) | % |
(1) Totals of percentage of revenues may not foot due to rounding.
The following discussion and analysis is for the three months ended March 31, 2023 compared to the same period in 2022.
Revenue
| Three Months Ended March 31, | ||||||||||||||||||||||||||||||||||||||
| (In millions, except percentages) | 2022 | 2023 | % Change | |||||||||||||||||||||||||||||||||||
| Revenue | $ | 6,854 | $ | 8,823 | 29 | % |
Revenue increased $2.0 billion, or 29%, primarily attributable to an increase in Gross Bookings of 22%, on a constant currency basis. The increase in Gross Bookings was primarily driven by an increase in Mobility Trip volumes. Additionally, during the first quarter of 2023, we saw a $925 million net increase in Mobility revenue as a result of business model changes in the UK. We also saw a $98 million increase in Delivery revenue resulting from an increase in certain Courier payments and incentives that are recorded in cost of revenue, exclusive of depreciation and amortization, for certain markets where we are primarily responsible for Delivery services and pay Couriers for services provided.
Cost of Revenue, Exclusive of Depreciation and Amortization
| Three Months Ended March 31, | ||||||||||||||||||||||||||||||||||||||
| (In millions, except percentages) | 2022 | 2023 | % Change | |||||||||||||||||||||||||||||||||||
| Cost of revenue, exclusive of depreciation and amortization | $ | 4,026 | $ | 5,259 | 31 | % | ||||||||||||||||||||||||||||||||
| Percentage of revenue | 59 | % | 60 | % |
Cost of revenue, exclusive of depreciation and amortization, increased $1.2 billion, or 31%, mainly due to a $687 million increase in Driver payments and incentives that are recorded in cost of revenue, exclusive of depreciation and amortization, as a result of business model changes in the UK, a $399 million increase in insurance expense primarily due to an increase in miles driven in our Mobility business, and a $382 million net increase in Courier payments and incentives that are recorded in cost of revenue, exclusive of depreciation and amortization, for certain markets where we are primarily responsible for Delivery services and pay Couriers for services provided, partially offset by a $427 million decrease in Freight Carrier payments due to reduced Freight Gross Bookings.
Operations and Support
| Three Months Ended March 31, | ||||||||||||||||||||||||||||||||||||||
| (In millions, except percentages) | 2022 | 2023 | % Change | |||||||||||||||||||||||||||||||||||
| Operations and support | $ | 574 | $ | 640 | 11 | % | ||||||||||||||||||||||||||||||||
| Percentage of revenue | 8 | % | 7 | % |
Operations and support expenses increased $66 million, or 11%, primarily attributable to a $40 million increase in employee headcount costs, a $9 million increase in external contractor expenses, and a $9 million increase in Driver background checks.
Sales and Marketing
| Three Months Ended March 31, | ||||||||||||||||||||||||||||||||||||||
| (In millions, except percentages) | 2022 | 2023 | % Change | |||||||||||||||||||||||||||||||||||
| Sales and marketing | $ | 1,263 | $ | 1,262 | — | % | ||||||||||||||||||||||||||||||||
| Percentage of revenue | 18 | % | 14 | % |
Sales and marketing expenses decreased $1 million, primarily attributable to a $15 million decrease in indirect advertising and marketing and an $8 million decrease in consumer discounts, rider facing loyalty expense, promotions, credits and refunds to $641 million compared to $649 million in the same period in 2022, partially offset by a $22 million increase in employee headcount costs.
Research and Development
| Three Months Ended March 31, | ||||||||||||||||||||||||||||||||||||||
| (In millions, except percentages) | 2022 | 2023 | % Change | |||||||||||||||||||||||||||||||||||
| Research and development | $ | 587 | $ | 775 | 32 | % | ||||||||||||||||||||||||||||||||
| Percentage of revenue | 9 | % | 9 | % |
Research and development expenses increased $188 million, or 32%, primarily attributable to a $94 million increase in stock-based compensation and a $94 million increase in employee headcount costs.
General and Administrative
| Three Months Ended March 31, | ||||||||||||||||||||||||||||||||||||||
| (In millions, except percentages) | 2022 | 2023 | % Change | |||||||||||||||||||||||||||||||||||
| General and administrative | $ | 632 | $ | 942 | 49 | % | ||||||||||||||||||||||||||||||||
| Percentage of revenue | 9 | % | 11 | % |
General and administrative expenses increased $310 million, or 49%, primarily attributable to a $250 million increase in legal, tax, and regulatory reserve changes and settlements and a $56 million increase in employee headcount costs.
Depreciation and Amortization
| Three Months Ended March 31, | ||||||||||||||||||||||||||||||||||||||
| (In millions, except percentages) | 2022 | 2023 | % Change | |||||||||||||||||||||||||||||||||||
| Depreciation and amortization | $ | 254 | $ | 207 | (19) | % | ||||||||||||||||||||||||||||||||
| Percentage of revenue | 4 | % | 2 | % |
Depreciation and amortization expenses decreased $47 million, or 19%, primarily attributable to a $53 million decrease in amortization expenses due to acquired Postmates intangible assets being fully amortized in 2022.
Interest Expense
| Three Months Ended March 31, | ||||||||||||||||||||||||||||||||||||||
| (In millions, except percentages) | 2022 | 2023 | % Change | |||||||||||||||||||||||||||||||||||
| Interest expense | $ | (129) | $ | (168) | 30 | % | ||||||||||||||||||||||||||||||||
| Percentage of revenue | (2) | % | (2) | % |
Interest expense increased by $39 million, or 30%, primarily due to a $28 million increase in interest expense on our term loans due to higher LIBOR and SOFR rates and $5 million increase from finance leases with higher interest rates.
Other Income (Expense), Net
| Three Months Ended March 31, | ||||||||||||||||||||||||||||||||||||||
| (In millions, except percentages) | 2022 | 2023 | % Change | |||||||||||||||||||||||||||||||||||
| Interest income | $ | 11 | $ | 87 | ** | |||||||||||||||||||||||||||||||||
| Foreign currency exchange gains (losses), net | 10 | (94) | ** | |||||||||||||||||||||||||||||||||||
| Unrealized gain (loss) on debt and equity securities, net | (5,570) | 320 | ** | |||||||||||||||||||||||||||||||||||
| Impairment of equity method investment | (182) | — | 100 | % | ||||||||||||||||||||||||||||||||||
| Revaluation of MLU B.V. call option | 181 | — | (100) | % | ||||||||||||||||||||||||||||||||||
| Other, net | (7) | (21) | (200) | % | ||||||||||||||||||||||||||||||||||
| Other income (expense), net | $ | (5,557) | $ | 292 | ** | |||||||||||||||||||||||||||||||||
| Percentage of revenue | (81) | % | 3 | % |
** Percentage not meaningful.
Unrealized gain (loss) on debt and equity securities, net increased by $5.9 billion primarily represents changes in the fair value of our equity securities. In the first quarter of 2022, unrealized loss on debt and equity securities, net, includes: a $1.9 billion unrealized loss on our Grab investment, a $1.7 billion unrealized loss on our Aurora investments, a $1.4 billion unrealized loss on our Didi investment, and a $462 million change of fair value on our Zomato investment. In the first quarter of 2023, unrealized gain on debt and equity securities, net, includes: a $357 million unrealized gain on our Didi investment, a $54 million unrealized gain on our Aurora investments, partially offset by a $113 million unrealized loss on our Grab investment. For additional information, refer to Note 3 – Investments and Fair Value Measurement in the notes to the condensed consolidated financial statements included in Part I, Item 1, of this Quarterly Report on Form 10-Q.
Impairment of equity method investment represents a $182 million impairment loss recorded on our MLU B.V. equity method investment during the first quarter of 2022.
Revaluation of MLU B.V. call option represents a $181 million gain for the change in fair value of the call option granted to
Yandex (“MLU B.V. Call Option”) during the first quarter of 2022.
Provision for (Benefit from) Income Taxes
| Three Months Ended March 31, | ||||||||||||||||||||||||||||||||||||||
| (In millions, except percentages) | 2022 | 2023 | % Change | |||||||||||||||||||||||||||||||||||
| Provision for (benefit from) income taxes | $ | (232) | $ | 55 | ** | |||||||||||||||||||||||||||||||||
| Effective tax rate | 4 | % | (40) | % |
** Percentage not meaningful.
Income tax provision (benefit) decreased by $287 million primarily due to the deferred U.S. tax impact related to our investments and, to a lesser extent, the tax expense driven by our foreign operations.
Income from Equity Method Investments
| Three Months Ended March 31, | ||||||||||||||||||||||||||||||||||||||
| (In millions, except percentages) | 2022 | 2023 | % Change | |||||||||||||||||||||||||||||||||||
| Income from equity method investments | $ | 18 | $ | 36 | 100 | % | ||||||||||||||||||||||||||||||||
| Percentage of revenue | — | % | — | % |
Income from equity method investments increased by an immaterial amount.
Segment Results of Operations
We operate our business as three operating and reportable segments: Mobility, Delivery and Freight. For additional information about our segments, see Note 10 – Segment Information and Geographic Information in the notes to the condensed consolidated financial statements included in Part I, Item 1 of this Quarterly Report on Form 10-Q.
Revenue
| Three Months Ended March 31, | ||||||||||||||||||||||||||||||||||||||
| (In millions, except percentages) | 2022 | 2023 | % Change | |||||||||||||||||||||||||||||||||||
| Mobility | $ | 2,518 | $ | 4,330 | 72 | % | ||||||||||||||||||||||||||||||||
| Delivery | 2,512 | 3,093 | 23 | % | ||||||||||||||||||||||||||||||||||
| Freight | 1,824 | 1,400 | (23) | % | ||||||||||||||||||||||||||||||||||
| Total revenue | $ | 6,854 | $ | 8,823 | 29 | % |
Segment Adjusted EBITDA
Segment Adjusted EBITDA is defined as revenue less the following expenses: cost of revenue, exclusive of depreciation and amortization, operations and support, sales and marketing, and general and administrative and research and development expenses associated with our segments. Segment Adjusted EBITDA also excludes non-cash items, certain transactions that are not indicative of ongoing segment operating performance and/or items that management does not believe are reflective of our ongoing core operations. For additional information, see Note 10 – Segment Information and Geographic Information in the notes to the condensed consolidated financial statements included in Part I, Item 1 of this Quarterly Report on Form 10-Q.
| Three Months Ended March 31, | ||||||||||||||||||||||||||||||||||||||
| (In millions, except percentages) | 2022 | 2023 | % Change | |||||||||||||||||||||||||||||||||||
| Mobility | $ | 618 | $ | 1,060 | 72 | % | ||||||||||||||||||||||||||||||||
| Delivery | 30 | 288 | ** | |||||||||||||||||||||||||||||||||||
| Freight | 2 | (23) | ** | |||||||||||||||||||||||||||||||||||
| Corporate G&A and Platform R&D (1) | (482) | (564) | (17) | % | ||||||||||||||||||||||||||||||||||
| Adjusted EBITDA (2) | $ | 168 | $ | 761 | 353 | % |
(1) Includes costs that are not directly attributable to our reportable segments. Corporate G&A also includes certain shared costs such as finance, accounting, tax, human resources, information technology and legal costs. Platform R&D also includes mapping and payment technologies and support and development of the internal technology infrastructure. Our allocation methodology is periodically evaluated and may change.
(2) See the section titled “Reconciliations of Non-GAAP Financial Measures” for more information and reconciliations to the most directly comparable GAAP financial measure.
** Percentage not meaningful.
Mobility Segment
For the three months ended March 31, 2023 compared to the same period in 2022, Mobility revenue increased $1.8 billion, or 72%, and Mobility Adjusted EBITDA profit increased $442 million, or 72%.
Mobility revenue increased primarily attributable to an increase in Mobility Gross Bookings due to increases in Trip volumes. Mobility revenue also had a net increase of $925 million as a result of business model changes in the UK.
Mobility Adjusted EBITDA profit increased primarily attributable to an increase in Mobility revenue, partially offset by a $399 million increase in insurance expense as a result of an increase in miles driven and an $84 million increase in credit card processing costs.
Delivery Segment
For the three months ended March 31, 2023 compared to the same period in 2022, Delivery revenue increased $581 million, or 23%, and Delivery Adjusted EBITDA profit increased $258 million.
Delivery revenue increased primarily attributable to an increase in Delivery Gross Bookings of 12%, on a constant currency basis, driven by an increase in food delivery orders and 6% increase in basket sizes globally, on a constant currency basis. Delivery Take Rate improved to 20.6% from 18.1% compared to the same period in 2022 driven by an overall improvement in basket sizes and
increase in orders. Additionally, we saw a $98 million increase in Delivery revenue resulting from an increase in certain Courier payments and incentives that are recorded in cost of revenue, where we are primarily responsible for delivery services and pay Couriers for services provided.
Delivery Adjusted EBITDA profit increased primarily attributable to an increase in Delivery revenue including advertising, partially offset by (i) a $416 million increase in cost of revenue, exclusive of depreciation and amortization, driven by a $382 million net increase in Courier payments and incentives that are recorded in cost of revenue, exclusive of depreciation and amortization, for certain markets where we are primarily responsible for Delivery services and pay Couriers for services provided, and (ii) a $51 million increase in employee headcount costs.
Freight Segment
For the three months ended March 31, 2023 compared to the same period in 2022, Freight revenue decreased $424 million, or 23%, and Freight Adjusted EBITDA declined $25 million.
Freight revenue decreased primarily attributable to a decrease in Freight Gross Bookings due to macroeconomic headwinds in the wider freight brokerage industry.
Freight Adjusted EBITDA declined primarily attributable to the $424 million decrease in Freight revenue, partially offset by a $427 million decrease in certain Shipper payments recorded in cost of revenue, exclusive of depreciation and amortization.
Certain Key Metrics and Non-GAAP Financial Measures
Adjusted EBITDA, revenue growth rates in constant currency and free cash flow are non-GAAP financial measures. For more information about how we use these non-GAAP financial measures in our business, the limitations of these measures, and reconciliations of these measures to the most directly comparable GAAP financial measures, see the section titled “Reconciliations of Non-GAAP Financial Measures.”
Monthly Active Platform Consumers. MAPCs is the number of unique consumers who completed a Mobility ride or received a Delivery order on our platform at least once in a given month, averaged over each month in the quarter. While a unique consumer can use multiple product offerings on our platform in a given month, that unique consumer is counted as only one MAPC. We use MAPCs to assess the adoption of our platform and frequency of transactions, which are key factors in our penetration of the countries in which we operate.
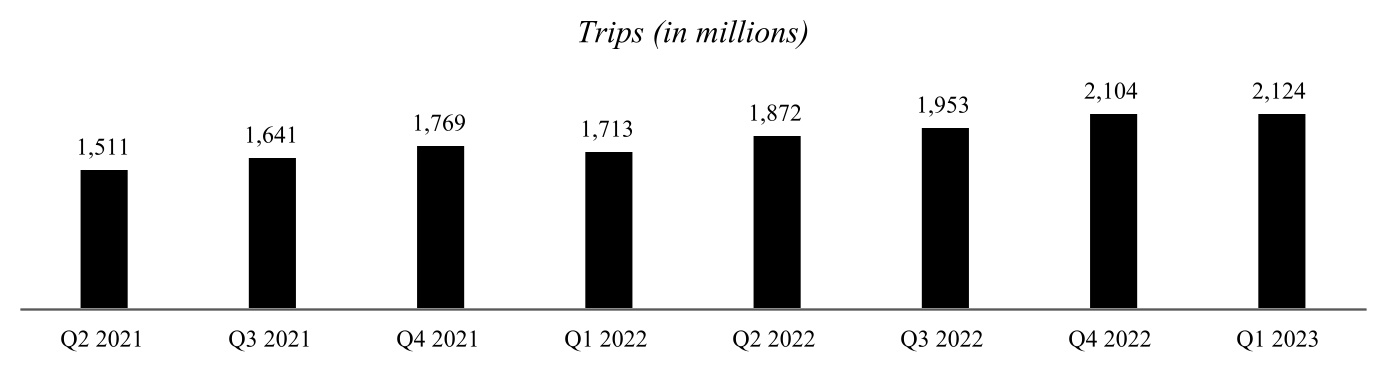
Trips. We define Trips as the number of completed consumer Mobility rides and Delivery orders in a given period. For example, an UberX Share ride with three paying consumers represents three unique Trips, whereas an UberX ride with three passengers represents one Trip. We believe that Trips are a useful metric to measure the scale and usage of our platform.
Gross Bookings. We define Gross Bookings as the total dollar value, including any applicable taxes, tolls, and fees, of: Mobility rides, Delivery orders (in each case without any adjustment for consumer discounts and refunds); Driver and Merchant earnings;
Driver incentives and Freight revenue. Gross Bookings do not include tips earned by Drivers. Gross Bookings are an indication of the scale of our current platform, which ultimately impacts revenue.
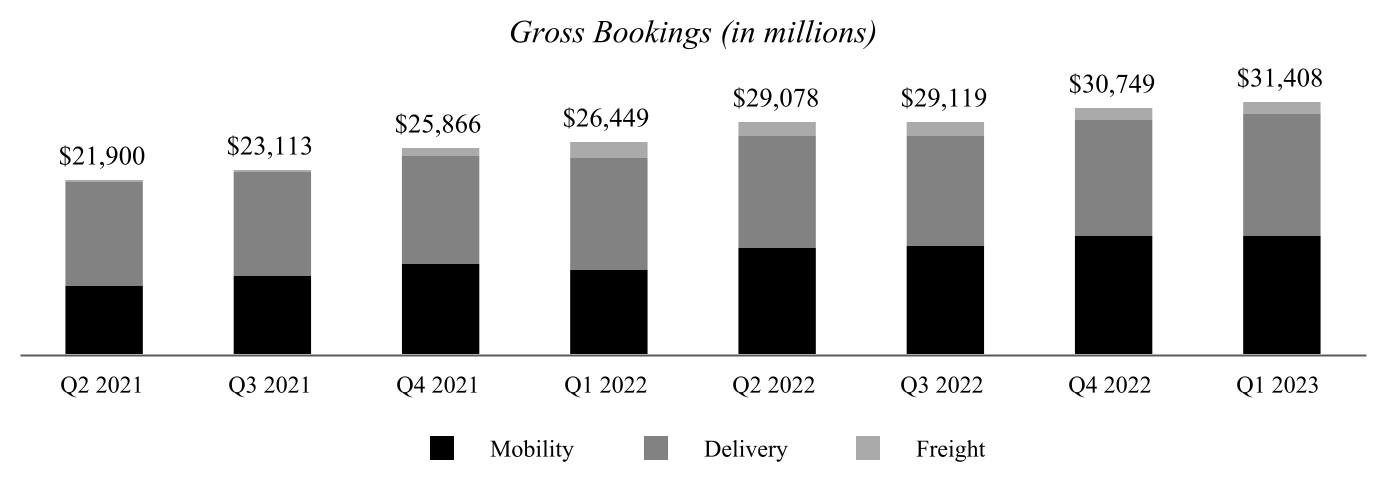
| Q2 2021 | Q3 2021 | Q4 2021 | Q1 2022 | Q2 2022 | Q3 2022 | Q4 2022 | Q1 2023 | |||||||||||||||||||||||||||||||||||||||||||
| Mobility | $ | 8,640 | $ | 9,883 | $ | 11,340 | $ | 10,723 | $ | 13,364 | $ | 13,684 | $ | 14,894 | $ | 14,981 | ||||||||||||||||||||||||||||||||||
| Delivery | 12,912 | 12,828 | 13,444 | 13,903 | 13,876 | 13,684 | 14,315 | 15,026 | ||||||||||||||||||||||||||||||||||||||||||
| Freight | 348 | 402 | 1,082 | 1,823 | 1,838 | 1,751 | 1,540 | 1,401 |
Take Rate is an operating metric and defined as revenue as a percentage of Gross Bookings.
Adjusted EBITDA. See the section titled “Reconciliations of Non-GAAP Financial Measures” for our definition and a reconciliation of net loss attributable to Uber Technologies, Inc. to Adjusted EBITDA.
| Three Months Ended March 31, | ||||||||||||||||||||
| (In millions, except percentages) | 2022 | 2023 | % Change | |||||||||||||||||
| Adjusted EBITDA | $ | 168 | $ | 761 | 353 | % |
Three Months Ended March 31, 2023 Compared with the Same Period in 2022
Adjusted EBITDA was $761 million, improving $593 million from an Adjusted EBITDA of $168 million from the same period in 2022. The improvement was primarily attributable to a $442 million increase in Mobility Adjusted EBITDA profit and a $258 million improvement in Delivery Adjusted EBITDA profit, partially offset by a $82 million increase in Corporate G&A and Platform R&D costs and a $25 million decline in Freight Adjusted EBITDA.
Reconciliations of Non-GAAP Financial Measures
We collect and analyze operating and financial data to evaluate the health of our business and assess our performance. In addition to revenue, net income (loss), income (loss) from operations, and other results under GAAP, we use Adjusted EBITDA, revenue growth rates in constant currency and free cash flow, which are described below, to evaluate our business. We use these non-GAAP financial measures for financial and operational decision-making and as a means to evaluate period-to-period comparisons. We believe that these non-GAAP financial measures provide meaningful supplemental information regarding our performance by excluding certain items that may not be indicative of our recurring core business operating results.
We believe that both management and investors benefit from referring to these non-GAAP financial measures in assessing our performance and when planning, forecasting, and analyzing future periods. These non-GAAP financial measures also facilitate management’s internal comparisons to our historical performance. We believe these non-GAAP financial measures are useful to investors both because (1) they allow for greater transparency with respect to key metrics used by management in its financial and operational decision-making and (2) they are used by our institutional investors and the analyst community to help them analyze the health of our business. Accordingly, we believe that these non-GAAP financial measures provide useful information to investors and others in understanding and evaluating our operating results in the same manner as our management team and board of directors. Our calculation of these non-GAAP financial measures may differ from similarly-titled non-GAAP measures, if any, reported by our peer companies. These non-GAAP financial measures should not be considered in isolation from, or as substitutes for, financial information prepared in accordance with GAAP.
Adjusted EBITDA
We define Adjusted EBITDA as net income (loss), excluding (i) income (loss) from discontinued operations, net of income taxes, (ii) net income (loss) attributable to non-controlling interests, net of tax, (iii) provision for (benefit from) income taxes, (iv) income (loss) from equity method investments, (v) interest expense, (vi) other income (expense), net, (vii) depreciation and amortization, (viii) stock-based compensation expense, (ix) certain legal, tax, and regulatory reserve changes and settlements, (x) goodwill and asset impairments/loss on sale of assets, (xi) acquisition, financing and divestitures related expenses, (xii) restructuring and related charges and (xiii) other items not indicative of our ongoing operating performance, including COVID-19 response initiatives related payments for financial assistance to Drivers personally impacted by COVID-19, the cost of personal protective equipment distributed to Drivers, Driver reimbursement for their cost of purchasing personal protective equipment, the costs related to free rides and food deliveries to healthcare workers, seniors, and others in need as well as charitable donations.
We have included Adjusted EBITDA in this Quarterly Report on Form 10-Q because it is a key measure used by our management team to evaluate our operating performance, generate future operating plans, and make strategic decisions, including those relating to operating expenses. Accordingly, we believe that Adjusted EBITDA provides useful information to investors and others in understanding and evaluating our operating results in the same manner as our management team and board of directors. In addition, it provides a useful measure for period-to-period comparisons of our business, as it removes the effect of certain non-cash expenses and certain variable charges. To help our board, management and investors assess the impact of COVID-19 on our results of operations, we are excluding the impacts of COVID-19 response initiatives related payments for financial assistance to Drivers personally impacted by COVID-19, the cost of personal protective equipment distributed to Drivers, Driver reimbursement for their cost of purchasing personal protective equipment, the costs related to free rides and food deliveries to healthcare workers, seniors, and others in need as well as charitable donations from Adjusted EBITDA. Our board and management find the exclusion of the impact of these COVID-19 response initiatives from Adjusted EBITDA to be useful because it allows us and our investors to assess the impact of these response initiatives on our results of operations.
COVID-19 Response Initiatives
To support those whose earning opportunities have been depressed as a result of COVID-19, as well as communities hit hard by the pandemic, we have announced and implemented several initiatives, including, in particular, payments for financial assistance to Drivers personally impacted by COVID-19, the cost of personal protective equipment distributed to Drivers, Driver reimbursement for their cost of purchasing personal protective equipment, the costs related to free rides and food deliveries to healthcare workers, seniors, and others in need as well as charitable donations. The payments for financial assistance to Drivers personally impacted by COVID-19 and Driver reimbursement for their cost of purchasing personal protective equipment are recorded as a reduction to revenue. The cost of personal protective equipment distributed to Drivers, the costs related to free rides and food deliveries to healthcare workers, seniors, and others in need as well as charitable donations are recorded as an expense in our costs and expenses.
Limitations of Non-GAAP Financial Measures and Adjusted EBITDA Reconciliation
Adjusted EBITDA has limitations as a financial measure, should be considered as supplemental in nature, and is not meant as a substitute for the related financial information prepared in accordance with GAAP. These limitations include the following:
-
Adjusted EBITDA excludes certain recurring, non-cash charges, such as depreciation of property and equipment and amortization of intangible assets, and although these are non-cash charges, the assets being depreciated and amortized may have to be replaced in the future, and Adjusted EBITDA does not reflect all cash capital expenditure requirements for such replacements or for new capital expenditure requirements;
-
Adjusted EBITDA excludes stock-based compensation expense, which has been, and will continue to be for the foreseeable future, a significant recurring expense in our business and an important part of our compensation strategy;
-
Adjusted EBITDA excludes certain restructuring and related charges, part of which may be settled in cash;
-
Adjusted EBITDA excludes other items not indicative of our ongoing operating performance, including COVID-19 response initiatives related payments for financial assistance to Drivers personally impacted by COVID-19, the cost of personal protective equipment distributed to Drivers, Driver reimbursement for their cost of purchasing personal protective equipment, the costs related to free rides and food deliveries to healthcare workers, seniors, and others in need as well as charitable donations;
-
Adjusted EBITDA does not reflect period-to-period changes in taxes, income tax expense or the cash necessary to pay income taxes;
-
Adjusted EBITDA does not reflect the components of other income (expense), net, which primarily includes: interest income; foreign currency exchange gains (losses), net; gain (loss) on business divestitures, net; unrealized gain (loss) on debt and equity securities, net; and impairment of debt and equity securities; and
-
Adjusted EBITDA excludes certain legal, tax, and regulatory reserve changes and settlements that may reduce cash available to us.
The following table presents a reconciliation of net loss attributable to Uber Technologies, Inc., the most directly comparable GAAP financial measure, to Adjusted EBITDA for each of the periods indicated:
| Three Months Ended March 31, | ||||||||||||||||||||||||||
| (In millions) | 2022 | 2023 | ||||||||||||||||||||||||
| Adjusted EBITDA reconciliation: | ||||||||||||||||||||||||||
| Net loss attributable to Uber Technologies, Inc. | $ | (5,930) | $ | (157) | ||||||||||||||||||||||
| Add (deduct): | ||||||||||||||||||||||||||
| Net income (loss) attributable to non-controlling interests, net of tax | 12 | — | ||||||||||||||||||||||||
| Provision for (benefit from) income taxes | (232) | 55 | ||||||||||||||||||||||||
| Income from equity method investments | (18) | (36) | ||||||||||||||||||||||||
| Interest expense | 129 | 168 | ||||||||||||||||||||||||
| Other (income) expense, net | 5,557 | (292) | ||||||||||||||||||||||||
| Depreciation and amortization | 254 | 207 | ||||||||||||||||||||||||
| Stock-based compensation expense | 359 | 470 | ||||||||||||||||||||||||
| Legal, tax, and regulatory reserve changes and settlements | — | 250 | ||||||||||||||||||||||||
| Goodwill and asset impairments/loss on sale of assets | 13 | 67 | ||||||||||||||||||||||||
| Acquisition, financing and divestitures related expenses | 14 | 8 | ||||||||||||||||||||||||
| COVID-19 response initiatives | 1 | — | ||||||||||||||||||||||||
| (Gain) loss on lease arrangement, net | 7 | (1) | ||||||||||||||||||||||||
| Restructuring and related charges | 2 | 22 | ||||||||||||||||||||||||
| Adjusted EBITDA | $ | 168 | $ | 761 |
Constant Currency
We compare the percent change in our current period results from the corresponding prior period using constant currency disclosure. We present constant currency growth rate information to provide a framework for assessing how our underlying revenue performed excluding the effect of foreign currency rate fluctuations. We calculate constant currency by translating our current period financial results using the corresponding prior period’s monthly exchange rates for our transacted currencies other than the U.S. dollar.
Free Cash Flow
We define free cash flow as net cash flows from operating activities less capital expenditures. The following table presents a reconciliation of free cash flow to the most directly comparable GAAP financial measure for each of the periods indicated:
| Three Months Ended March 31, | ||||||||||||||
| (In millions) | 2022 | 2023 | ||||||||||||
| Free cash flow reconciliation: | ||||||||||||||
| Net cash provided by operating activities | $ | 15 | $ | 606 | ||||||||||
| Purchases of property and equipment | (62) | (57) | ||||||||||||
| Free cash flow | $ | (47) | $ | 549 |
Liquidity and Capital Resources
| Three Months Ended March 31, | ||||||||||||||
| (In millions) | 2022 | 2023 | ||||||||||||
| Net cash provided by operating activities | $ | 15 | $ | 606 | ||||||||||
| Net cash used in investing activities | (135) | (399) | ||||||||||||
| Net cash used in financing activities | (113) | (107) |
Operating Activities
Net cash provided by operating activities was $606 million for the three months ended March 31, 2023, primarily consisting of $157 million of net loss, adjusted for certain non-cash items, which primarily included $470 million of stock-based compensation expense, $320 million in unrealized gains from equity securities, and $207 million depreciation and amortization expense as well as a $258 million decrease in cash consumed by working capital. The decrease in cash consumed by working capital was primarily driven by an increase in our insurance reserves and a decrease in accounts receivable, partially offset by a decrease in accrued expenses and other current liabilities.
Net cash provided by operating activities was $15 million for the three months ended March 31, 2022, primarily consisting of $5.9 billion of net loss, adjusted for certain non-cash items, which primarily included $5.6 billion in unrealized losses from equity securities, $359 million of stock-based compensation expense and $254 million depreciation and amortization as well as a $27 million decrease in cash consumed by working capital primarily driven by an increase in our accrued insurance reserves.
Investing Activities
Net cash used in investing activities was $399 million for the three months ended March 31, 2023, primarily consisting of purchases of marketable securities of $846 million, and $57 million in purchases of property and equipment, partially offset by proceeds from maturities and sales of marketable securities of $500 million.
Net cash used in investing activities was $135 million for the three months ended March 31, 2022, primarily consisting of $62 million in purchases of property and equipment and $59 million in acquisition of business, net of cash acquired.
Financing Activities
Net cash used in financing activities was $107 million for the three months ended March 31, 2023, primarily consisting of $40 million of principal payments of finance leases and a $16 million net cash outflow related to our 2030 Refinanced Term Loans, comprised of (i) $1.1 billion cash inflow from the issuance of the 2030 Refinanced Term Loans, net of issuance costs, from new lenders and additional principal from existing lenders; (ii) a $1.1 billion cash outflow of principal payments on the 2025 Refinanced Term Loan and 2027 Refinanced Term Loan to exiting lenders and lower principal from existing lenders. For additional information on our 2030 Refinanced Term Loans, see Note 5 – Long-Term Debt and Revolving Credit Arrangements in the notes to the condensed consolidated financial statements included in Part I, Item 1 of this Quarterly Report on Form 10-Q.
Net cash used in financing activities was $113 million for the three months ended March 31, 2022, primarily consisting of $62 million of principal payments on finance leases.
Other Information
As of March 31, 2023, $2.6 billion of our $4.0 billion in cash and cash equivalents was held by our foreign subsidiaries. Cash held outside the United States may be repatriated, subject to certain limitations, and would be available to be used to fund our domestic operations. Repatriation of funds may result in immaterial tax liabilities. We believe that our existing cash balance in the United States is sufficient to fund our working capital needs in the United States. We are in compliance with our debt and line of credit covenants as of March 31, 2023, including by meeting our reporting obligations. We also believe that our sources of funding and our available line of credit will be sufficient to satisfy our currently anticipated cash requirements including capital expenditures, working capital requirements, collateral requirements, potential acquisitions, potential prepayments of contested indirect tax assessments (“pay-to-play”), and other liquidity requirements through at least the next 12 months. We intend to continue to evaluate and may, in certain circumstances, take preemptive action to preserve liquidity.
Commitments
We have non-cancelable commitments which primarily relate to network and cloud services and other items in the ordinary course of business. These amounts are determined based on the non-cancelable quantities to which we are contractually obligated. As of March 31, 2023, there have been no material changes outside the ordinary course of business to the contractual obligations, as disclosed in our Annual Report on Form 10-K for the year ended December 31, 2022.
Critical Accounting Policies and Estimates
Our condensed consolidated financial statements and accompanying notes have been prepared in accordance with GAAP. The preparation of these condensed consolidated financial statements requires us to make estimates and assumptions that affect the reported amounts of assets, liabilities, revenue and expenses, and related disclosures. We base our estimates on historical experience and on various other assumptions that we believe are reasonable under the circumstances. We evaluate our estimates and assumptions on an ongoing basis. Actual results may differ from these estimates. To the extent that there are material differences between these estimates and our actual results, our future financial statements will be affected.
For additional information about our critical accounting policies and estimates, see the disclosure included in our Annual Report on Form 10-K as well as Note 1 – Description of Business and Summary of Significant Accounting Policies in the notes to the condensed consolidated financial statements included in Part I, Item 1, of this Quarterly Report on Form 10-Q.
Recent Accounting Pronouncements
See Note 1 – Description of Business and Summary of Significant Accounting Policies, in the notes to the condensed consolidated financial statements included in Part I, Item 1 of this Quarterly Report on Form 10-Q.
Previous: Item 1. FINANCIAL STATEMENTS · Next: Item 3. QUANTITATIVE AND QUALITATIVE DISCLOSURES ABOUT MARKET RISK