 filings.tools
UDR (UDR) 10-K risk factor changes: FY2020 vs FY2019
The 2020-12-31 10-K against the 2019-12-31 one, compared heading by heading and sentence by sentence.
All filing items1,564 rewritten1,103 added705 removed3,395 unchanged
Summary
counted, not written
- Item 1A headings could not be compared: the parser did not find an Item 1A in both filings.
- Sentence by sentence, 1,103 added, 705 removed, 1,564 rewritten and 3,395 unchanged across 13 items that differ.
Sentences by item
20 items, with every count and a link to each item that changed
Underlined words on a shaded ground are new in FY2020; struck-through words were in FY2019. Sentences that are wholly new or wholly gone are labelled rather than marked.
Item 1. BUSINESS
100 rewritten, 157 added, 27 removed, 581 unchanged
At December 31, [removed: 2019,] [added: 2020,] our consolidated real estate portfolio consisted of [removed: 148] [added: 149] communities located in [removed: 20] [added: 21] markets, consisting of [removed: 47,010] [added: 48,283] completed apartment homes, which are held directly or through our subsidiaries, including the Operating Partnership and the DownREIT Partnership, and consolidated joint ventures.
In addition, we have an ownership interest in [removed: 5,268] [added: 5,295] completed or to-be-completed apartment homes through unconsolidated joint ventures or partnerships, including [removed: 2,138] [added: 2,165] apartment homes owned by entities in which we hold preferred equity investments.
At December 31, [removed: 2019,] [added: 2020,] the Company was developing [removed: three] [added: five] wholly-owned communities totaling [removed: 878] [added: 1,378] homes, [removed: none] [added: 202] of which have been completed.
At December 31, [removed: 2019,] [added: 2020,] the Operating Partnership’s consolidated real estate portfolio included [removed: 52] [added: 53] communities located in 15 markets, with a total of [removed: 16,434] [added: 17,174] completed apartment homes.
During the year ended December 31, [removed: 2019,] [added: 2020,] rental revenues of the Operating Partnership represented approximately [removed: 39%] [added: 35%] of our total rental revenues.
In [removed: 2019,] [added: 2020,] we declared total distributions of [removed: $1.37] [added: $1.44] per common share and paid dividends of [removed: $1.35] [added: $1.4225] per common share.
| First Quarter | | $ | [removed: 0.3425] [added: 0.3600] | | $ | [removed: 0.3225] [added: 0.3425] |
| Second Quarter | | | [removed: 0.3425] [added: 0.3600] | | | [removed: 0.3425] [added: 0.3600] |
| Third Quarter | | | [removed: 0.3425] [added: 0.3600] | | | [removed: 0.3425] [added: 0.3600] |
| Fourth Quarter | | | [removed: 0.3425] [added: 0.3600] | | | [removed: 0.3425] [added: 0.3600] |
As of February [removed: 17, 2020,] [added: 16, 2021,] we had [removed: 1,330] [added: 1,263] full-time associates and [removed: 21] [added: 8] part-time associates, all of whom were employed by UDR.
[removed: Reporting Segments][added: Reporting Segments]
Our S_ame-Store Communities_ segment represents those communities acquired, developed, and stabilized prior to January 1, [removed: 2018,] [added: 2019,] and held as of December 31, [removed: 2019.][added: 2020.]
● In July [removed: 2019,] [added: 2020,] the Company marked its [removed: 47th] [added: 48th] year as a REIT and, in October [removed: 2019,] [added: 2020,] paid its [removed: 188th] [added: 192nd] consecutive quarterly dividend.
The Company’s annualized declared [removed: 2019] [added: 2020] dividend of [removed: $1.37] [added: $1.44] represented a [removed: 6.2%] [added: 5.1%] increase over the previous year.
| | ● | Total revenues increased [removed: 10.1%] [added: 7.7% and total NOI increased 5.6%] over the prior year primarily due to communities acquired during [removed: 2019] [added: 2020] and [added: 2019, partially offset by negative] rent [removed: growth.] [added: growth in the San Francisco, New York, and Boston markets.] |
● We commenced the development of [removed: three] [added: two] communities located in [removed: Denver, Colorado, Dublin, California,] [added: Washington, D.C.,] and [removed: Addison, Texas,] [added: King of Prussia, Pennsylvania,] with a total of [removed: 878] [added: 500] apartment homes.
● We increased our ownership interest in [removed: two communities] [added: one community] from our West Coast Development joint venture with a total of [removed: 541] [added: 276] apartment homes, located in [removed: Anaheim, California and Seattle, Washington,] [added: Hillsboro, Oregon,] for a total cash purchase price of approximately [removed: $53.5] [added: $21.6] million after the repayment of joint venture construction financing.
● We contributed [removed: $67.0] [added: $66.3] million to four investments under our Developer Capital Program, which earn preferred returns ranging between [removed: 9.0%] [added: 8.5%] to [removed: 12.5%.][added: 13.0%.]
| | ● | We issued [removed: $1.1 billion] [added: $950.0 million] of senior unsecured medium-term notes (including a [removed: $300.0] [added: $350.0] million “green bond”) at a weighted average [added: contractual] interest rate of [removed: 3.2%,] [added: 2.3%,] and prepaid [removed: $700.0] [added: $300.0] million of senior unsecured medium-term notes at a weighted average interest rate of [removed: 4.2%.] [added: 3.69%.] |
● We sold [removed: 7.0 million shares of common stock for aggregate net proceeds of $312.3 million at a weighted average price per share of $45.29 under our ATM program, and sold 1.3] [added: 2.1] million shares of common stock through a forward sales agreement for aggregate net proceeds of [removed: $63.5] [added: $102.2] million at a weighted average price per share of [removed: $47.41, which was also] [added: $48.23] under our ATM program.
Refer to Item 7, _Management’s Discussion and Analysis of Financial Condition and Results of Operations,_ for further information on the Company’s and the Operating Partnership’s activities in [removed: 2019.][added: 2020.]
| | ● | our consolidated apartment portfolio includes [removed: 148] [added: 149] communities located in [removed: 20] [added: 21] markets throughout the U.S., including both coastal and sunbelt locations; and |
| | ● | our mix of urban/suburban communities is approximately [removed: 43%/57%] [added: 37%/63%] and our mix of A/B quality properties is approximately [removed: 57%/43%.] [added: 55%/45%.] |
| | | [added: 2020 | | |] 2019 | | | 2018 | | | 2017 | | | 2016 | | [removed: | 2015 | |]
| Homes acquired | | | [removed: 7,079] [added: 1,642] | | | [removed: —] [added: 7,079] | | | [removed: 462] [added: —] | | | [removed: 508] [added: 462] | | | [removed: 3,246] [added: 508] |
| Homes disposed | | | [removed: —] [added: 599] | | | [removed: 868] [added: —] | | | [removed: 218] [added: 868] | | | [removed: 1,782] [added: 218] | | | [removed: 2,735] [added: 1,782] |
| Homes owned at December 31, | | | [removed: 47,010] [added: 48,283] | | | [removed: 39,931] [added: 47,010] | | | [removed: 39,998] [added: 39,931] | | | [removed: 39,454] [added: 39,998] | | | [removed: 40,728] [added: 39,454] |
| Total real estate owned, at cost | | $ | [removed: 12,602,101] [added: 13,071,472] | | $ | [removed: 10,196,159] [added: 12,602,101] | | $ | [removed: 10,177,206] [added: 10,196,159] | | $ | [removed: 9,615,753] [added: 10,177,206] | | $ | [removed: 9,190,276] [added: 9,615,753] |
| | | [added: 2020 | | |] 2019 | | | 2018 | | | 2017 | | | 2016 | | | [removed: 2015 | | |]
| Homes acquired | | | [removed: —] [added: 1,072] | | | — | | | [removed: 218] [added: —] | | | [removed: —] [added: 218] | | | [removed: 421] [added: —] | |
| Homes disposed | | | [removed: —] [added: 332] | | | [removed: 264] [added: —] | | | [removed: 218] [added: 264] | | | [removed: 276] [added: 218] | | | [removed: 4,256] [added: 276] | [removed: (a)] [added: ] |
| Homes owned at December 31, | | | [removed: 16,434] [added: 17,174] | | | 16,434 | | | [removed: 16,698] [added: 16,434] | | | 16,698 | | | [removed: 16,974] [added: 16,698] | |
| Total real estate owned, at cost | | $ | [removed: 3,875,160] [added: 4,043,725] | | $ | [removed: 3,811,985] [added: 3,875,160] | | $ | [removed: 3,816,956] [added: 3,811,985] | | $ | [removed: 3,674,704] [added: 3,816,956] | | $ | [removed: 3,630,905] [added: 3,674,704] | |
At December 31, [removed: 2019,] [added: 2020,] the Company was developing [removed: three] [added: five] wholly-owned communities located in [removed: Denver, Colorado,] Addison, Texas, [removed: and] [added: Denver, Colorado,] Dublin, California, [added: Washington, D.C., and King of Prussia, Pennsylvania,] totaling [removed: 878] [added: 1,378] homes, [removed: none] [added: 202] of which have been completed, with a budget of [removed: $278.5] [added: $491.5] million, in which we have [removed: a carrying value] [added: an investment] of [removed: $69.8] [added: $247.9] million.
The communities are estimated to be completed between the first quarter of 2021 and the second quarter of [removed: 2022.][added: 2023.]
During the year ended December 31, [removed: 2019,] [added: 2020,] we incurred [removed: $35.6] [added: $48.3] million in major renovations, which [removed: include] [added: included] major structural changes and/or architectural revisions to existing buildings.
| | ● | geographic diversification with a presence in [removed: 20] [added: 21] markets across the country; and |
At December 31, [removed: 2019,] [added: 2020,] our consolidated real estate portfolio included [removed: 148] [added: 149] communities with a total of [removed: 47,010] [added: 48,283] completed apartment homes, which included the Operating Partnership’s consolidated real estate portfolio of [removed: 52] [added: 53] communities with a total of [removed: 16,434] [added: 17,174] completed apartment homes.
The overall quality of our portfolio [added: generally] enables us to raise rents and to attract residents with higher levels of disposable income who are more likely to absorb such rents.
| | | 2020 | | | 2020 | |
| Total | | $ | 1.4400 | | $ | 1.4225 |
Human Capital Management
Of such number 994 associates are employed in roles that are located at or that are solely related to our communities and the remainder are employed in corporate roles.
Recruiting and retaining our associates, as well as assisting them in their professional development, are critically important in successfully managing our business.
UDR’s culture is one based on innovation, inclusion, empowerment, adaptability, and execution, and understanding and maintaining our culture is fundamental to recruiting and retaining associates.
To that end, in 2020 we updated our culture statement and launched an associate facing culture website to ensure that our associates understand our culture and have an opportunity to participate in its evolution.
_Associate Compensation_
Attracting, developing, and retaining high-quality, and diverse associates across our business is critical to the long-term success of the Company.
A crucial factor in ensuring this occurs is compensation practices that are attractive and that are fair and non-biased.
We use a number of recruiting methods depending on the job function for which candidates are needed including an associate referral program, internet-based recruiting platforms, and third-party recruiting agencies.
With respect to compensation, we utilize market surveys and other third party information when determining salary ranges and we design our compensation programs to include bonus potential in order to incentivize performance.
In addition, we annually evaluate and analyze our compensation on gender and diversity bases for each job title in order to monitor pay equity and to identify areas for further action.
The results of our evaluation and analysis are provided annually to our Board of Directors.
_Associate Growth and Development_
We believe that training is important to our associates’ job satisfaction, is essential to furthering their effectiveness, and assists in associate career advancement and retention, helping us to create a more efficient workforce.
Accordingly, we offer a wide variety of training opportunities.
In addition to required training designed to address regulatory and statutory matters (e.g., harassment, cybersecurity, fair housing, etc.), associates have the option of participating in management development through our Certified Manager and Career Mobility Programs.
These programs are designed to enable our associates to acquire skills that will be useful to them as they progress in their career.
Our training program also includes annual “refreshment” training, as appropriate.
In total, there are over 5,000 courses available to our associates.
Examples of program topics include: leasing skills, basic property maintenance, customer service, project management, and system applications.
In 2020, we enhanced our training through creating a better process to ensure required training is taken in a timely manner and by increasing or modifying training availability and training programs, including in the areas of safety and cybersecurity.
Certifications are important in the apartment business and we encourage our associates to become professionally certified in areas that interest them and are beneficial to the Company.
Certifications range from master’s degree programs to certified property manager programs, to technical licenses for HVAC systems, all of which equip our associates with knowledge and the potential for career-expansion opportunities.
UDR offers partial tuition reimbursement related to attaining these certifications.
Each UDR associate is required to engage in an annual performance review with their direct supervisor.
Among other things, the performance review establishes the associate’s training plans for the upcoming year and provides feedback on career development for each associate.
In addition, we monitor associate turnover and take action when issues are identified if appropriate.
_Diversity and Inclusion_
We are committed to creating and maintaining a diverse and inclusive workplace environment that supports the development and advancement of all associates.
As of December 31, 2020, our total workforce is 61% male and 39% female.
The ethnicity of our workforce is 55% White, 26% Hispanic/Latino, 11% Black, 3% Asian and 5% Other.
“Other” includes: American Indian, Alaska Native, Native Hawaiian, Pacific Islander, Not Specified or two or more races.
As of December 31, 2020, our management team (associates with the title of community director or director and higher job classifications) is 45% male and 55% female.
The ethnicity of our management team is 80% White and 20% non-White.
Over the three-year period ending December 31, 2020, 740 associates were promoted.
Of the associates that were promoted to the positions of community director, director, or a higher job classification during the period, 60% were female and 15% were non-White.
_Associate Engagement and Outreach_
| | | 2019 | | | 2019 | |
| Total | | $ | 1.3700 | | $ | 1.3500 |
2019 Highlights
● We achieved Same-Store revenue growth of 3.6% and Same-Store net operating income (“NOI”) growth of 4.0%.
● We acquired eight communities with a total of 2,919 apartment homes located in Brooklyn, New York, St. Petersburg, Florida, Towson, Maryland, King of Prussia, Pennsylvania, Waltham, Massachusetts, Norwood, Massachusetts, and Englewood, New Jersey, for a total of approximately $911.9 million.
● We acquired two to-be-developed land parcels located in Washington, D.C., and Denver, Colorado, for a total of approximately $40.8 million.
● We increased our ownership interest in one community from our UDR/KFH joint venture with a total of 292 apartment homes, located in Washington, D.C., for a total of $186.8 million and sold our 30% ownership interest in two communities from our UDR/KFH joint venture with a total of 368 apartment homes, located in Arlington, Virginia and Silver Spring, Maryland, for a collective sales price of $118.3 million, resulting in a gain on sale of approximately $10.6 million.
● We acquired the approximately 50% ownership interest not previously owned in 10 UDR/MetLife joint venture operating communities, one development community and four land parcels valued at $1.1 billion, or $564.2 million at our share, and sold our approximately 50% ownership interest in five UDR/MetLife joint venture operating communities valued at $645.8 million, or $322.9 million at our share, to MetLife, and recognized a net gain on sale of $114.9 million at our share.
● We recognized a gain of $5.3 million from the sale of a parcel of land in Los Angeles, California.
● We sold an additional 7.5 million shares of common stock in an underwritten public offering for net proceeds of $349.8 million at a price per share of $46.65.
| (a) | Includes 3,107 homes deconsolidated in 2015 upon contribution of communities by the Operating Partnership to the DownREIT Partnership. |
| --- | --- |
As of December 31, 2019, the Company was redeveloping 653 apartment homes, 250 of which have been completed, at two wholly-owned communities, located in Boston, Massachusetts and New York, New York, both of which are expected to be completed in the first quarter of 2021.
The redevelopments include the renovation of building exteriors, corridors, and common area amenities as well as individual apartment homes.
Financing Activities
At December 31, 2019, the Company was redeveloping 653 apartment homes, 250 of which have been completed, at two wholly-owned communities, located in Boston, Massachusetts and New York, New York, both of which are expected to be completed in the first quarter of 2021.
Material losses
ability to make distributions to stockholders.
_Risk of Pandemics or Other Health Crisis_.
A pandemic, epidemic, or other health crisis where our communities are located or areas in which vendors on which we rely are located, could have an adverse effect on our business and results of operations.
not have full recourse to the assets of such entity, or the assets of the entity may not be sufficient to satisfy our mezzanine loan.
During the global financial crisis and the economic recession that followed it, the United States stock and credit markets experienced significant price volatility, dislocations and liquidity disruptions, which caused market prices of many stocks to fluctuate substantially and the spreads on debt financings to widen considerably.
acquisitions, development of our properties and other purposes at reasonable terms or at all, which may negatively affect our business and the market price of UDR’s common stock.
Also, unless the
U.S. Treasury Department, which may result in revisions to regulations and interpretations in addition to statutory changes.
As a result, the market price of UDR’s
in UDR’s stockholders’ best interests.
An excerpt. Shown here: 40 of 100 rewritten, 40 of 157 added and all 27 removed. The counts are complete. For every sentence, read Item 1. BUSINESS in the FY2020 filing and the FY2019 filing.
Cover and table of contents
29 rewritten, 52 added, 0 removed, 156 unchanged
For the fiscal year ended December 31, [removed: 2019][added: 2020]
The aggregate market value of the shares of common stock of UDR, Inc. held by non-affiliates on June [removed: 28, 2019] [added: 30, 2020] was approximately [removed: $4.9] [added: $5.8] billion.
As of February [removed: 17, 2020,] [added: 16, 2021,] there were [removed: 294,631,463] [added: 296,820,995] shares of UDR, Inc.’s common stock outstanding.
| [Item 1. Business](#Item1BUSINESS_859249) | [removed: 3] [added: 4] |
| [Item 1A. Risk Factors](#Item1ARISKFACTORS_636215) | [removed: 11] [added: 15] |
| [Item 1B. Unresolved Staff Comments](#Item1BUNRESOLVEDSTAFFCOMMENTS_896565) | [removed: 26] [added: 31] |
| [Item 2. Properties](#Item2PROPERTIES_95714) | [removed: 27] [added: 32] |
| [Item 3. Legal Proceedings](#Item3LEGALPROCEEDINGS_348868) | [removed: 28] [added: 33] |
| [Item 4. Mine Safety Disclosures](#Item4MINESAFETYDISCLOSURES_885915) | [removed: 28] [added: 33] |
| [Item 5. Market for Registrant’s Common Equity, Related Stockholder Matters and Issuer Purchases of Equity Securities](#Item5MARKETFORREGISTRANTSCOMMONEQUITY_10) | [removed: 29] [added: 34] |
| [Item 6. Selected Financial Data](#Item6SELECTEDFINANCIALDATA_894695) | [removed: 31] [added: 36] |
| [Item 7. Management’s Discussion and Analysis of Financial Condition and Results of Operations](#Item7MANAGEMENTSDISCUSSIONANDANALYSISOFF) | [removed: 35] [added: 37] |
| [Item 7A. Quantitative and Qualitative Disclosures about Market Risk](#Item7AQUANTITATIVEANDQUALITATIVEDISCLOSU) | [removed: 63] [added: 67] |
| [Item 8. Financial Statements and Supplementary Data](#Item8FINANCIALSTATEMENTSANDSUPPLEMENTARY) | [removed: 63] [added: 67] |
| [Item 9. Changes in and Disagreements with Accountants on Accounting and Financial Disclosure](#Item9CHANGESINANDDISAGREEMENTSWITHACCOUN) | [removed: 63] [added: 67] |
| [Item 9A. Controls and Procedures](#Item9ACONTROLSANDPROCEDURES_165525) | [removed: 63] [added: 67] |
| [Item 9B. Other Information](#Item9BOTHERINFORMATION_382828) | [removed: 64] [added: 68] |
| [Item 10. Directors, Executive Officers and Corporate Governance](#Item10DIRECTORSEXECUTIVEOFFICERSANDCORPO) | [removed: 65] [added: 69] |
| [Item 11. Executive Compensation](#Item11EXECUTIVECOMPENSATION_1191) | [removed: 65] [added: 69] |
| [Item 12. Security Ownership of Certain Beneficial Owners and Management and Related Stockholder Matters](#Item12SECURITYOWNERSHIPOFCERTAINBENEFICI) | [removed: 65] [added: 69] |
| [Item 13. Certain Relationships and Related Transactions, and Director Independence](#Item13CERTAINRELATIONSHIPSANDRELATEDTRAN) | [removed: 65] [added: 69] |
| [Item 14. Principal Accountant Fees and Services](#Item14PRINCIPALACCOUNTANTFEESANDSERVICES) | [removed: 65] [added: 69] |
| [Item 15. Exhibits, Financial Statement Schedules](#Item15EXHIBITSFINANCIALSTATEMENTSCHEDULE) | [removed: 66] [added: 70] |
| [Item 16. Form 10-K Summary](#Item16FORM10KSUMMARY_948218) | [removed: 73] [added: 78] |
This Report combines the annual reports on Form 10-K for the fiscal year ended December 31, [removed: 2019] [added: 2020] of UDR, Inc., a Maryland corporation, and United Dominion Realty, L.P., a Delaware limited partnership, of which UDR, Inc. is the parent company and sole general partner.
As of December 31, [removed: 2019,] [added: 2020,] UDR owned 0.1 million units (100%) of the general partnership interests of the Operating Partnership and 176.1 million OP Units, representing approximately [removed: 95.7%] [added: 95.3%] of the total outstanding OP Units in the Operating Partnership.
Such forward-looking statements include, without limitation, statements concerning property acquisitions and dispositions, development activity and capital expenditures, capital raising activities, rent growth, occupancy, [removed: and] rental expense [removed: growth.][added: growth and expected or potential impacts of the novel coronavirus disease (“COVID-19”) pandemic.]
Such factors include, among other things, [added: the impact of the COVID-19 pandemic and measures intended to prevent its spread or address its effects,] unfavorable changes in the apartment market, changing economic conditions, the impact of inflation/deflation on rental rates and property operating expenses, expectations concerning the availability of capital and the stability of the capital markets, the impact of competition and competitive pricing, acquisitions, developments and redevelopments not achieving anticipated results, delays in completing developments and redevelopments, delays in completing lease-ups on schedule or at expected rent and occupancy levels, expectations on job growth, home affordability and demand/supply ratio for multifamily housing, expectations concerning development and redevelopment activities, expectations on occupancy levels and rental rates, expectations concerning joint ventures and partnerships with third parties, expectations that automation will help grow net operating income, and expectations on annualized net operating income.
● unfavorable changes in apartment market and economic conditions that could adversely affect occupancy levels and rental [removed: rates;][added: rates, including as a result of COVID-19;]
Indicate by check mark whether the registrant has filed a report on and attestation to its management’s assessment of the effectiveness of its internal control over financial reporting under Section 404(b) of the Sarbanes-Oxley Act (15 U.S.C. 7262(b)) by the registered public accounting firm that prepared or issued its audit report.
| | | | | | | |
| UDR, Inc. | | Yes þ | | No ☐ | | |
| | | | | | | |
| --- | --- | --- | --- | --- | --- | --- |
| United Dominion Realty, L.P. | | Yes ☐ | | No þ | | |
● the impact of the COVID-19 pandemic and measures intended to prevent its spread or address its effects;
Summary of Risk Factors
Our business is subject to a number of risks, including risks that may prevent us from achieving our business objectives or may adversely affect our business, financial condition, results of operations, cash flows and prospects.
These risks are discussed more fully in Item 1A.
Risk Factors herein.
These risks include, but are not limited to, the following:
| | ● | The Ongoing COVID-19 Pandemic and Measures Intended to Prevent its Spread Could Have a Material Adverse Effect on our Business, Results of Operations, Cash Flows and Financial Condition. |
| --- | --- | --- |
| | ● | Unfavorable Apartment Market and Economic Conditions Could Adversely Affect Occupancy Levels, Rental Revenues and the Value of Our Real Estate Assets. |
| --- | --- | --- |
| | ● | The Geographic Concentration of Our Communities in Certain Markets Could Have an Adverse Effect on Our Operations if a Particular Market is Adversely Impacted by Economic or Other Conditions. |
| --- | --- | --- |
| | ● | We May Be Unable to Renew Leases or Relet Apartment Units as Leases Expire, or the Terms of Renewals or New Leases May Be Less Favorable Than Current Leases. |
| --- | --- | --- |
| | ● | Competition Could Limit Our Ability to Lease Apartment Homes or Increase or Maintain Rents. |
| --- | --- | --- |
| | ● | We May Not Realize the Anticipated Benefits of Past or Future Acquisitions, and the Failure to Integrate Acquired Communities and New Personnel Successfully Could Create Inefficiencies. |
| --- | --- | --- |
| | ● | Competition Could Adversely Affect Our Ability to Acquire Properties. |
| --- | --- | --- |
| | ● | Development and Construction Risks Could Impact Our Profitability. |
| --- | --- | --- |
| | ● | Bankruptcy or Defaults of Our Counterparties Could Adversely Affect Our Performance. |
| --- | --- | --- |
| | ● | We Could Incur Significant Insurance Costs and Some Potential Losses May Not Be Adequately Covered by Insurance. |
| --- | --- | --- |
| | ● | The Adoption of, or Changes to, Rent Control, Rent Stabilization, Eviction, Tenants’ Rights and Similar Laws and Regulations in Our Markets Could Have an Adverse Effect on Our Results of Operations and Property Values. |
| --- | --- | --- |
| | ● | Insufficient Cash Flow Could Affect Our Debt Financing and Create Refinancing Risk. |
| --- | --- | --- |
| | ● | Failure to Generate Sufficient Income Could Impair Debt Service Payments and Distributions to Stockholders. |
| --- | --- | --- |
| | ● | Changing Interest Rates Could Increase Interest Costs and Adversely Affect Our Cash Flow and the Market Price of Our Securities. |
| --- | --- | --- |
An excerpt. Shown here: all 29 rewritten, 40 of 52 added and all 0 removed. The counts are complete. For every sentence, read Cover and table of contents in the FY2020 filing and the FY2019 filing.
Item 2. PROPERTIES
8 rewritten, 41 added, 39 removed, 25 unchanged
At December 31, [removed: 2019,] [added: 2020,] our consolidated apartment portfolio included [removed: 148] [added: 149] communities located in [removed: 20] [added: 21] markets, with a total of [removed: 47,010] [added: 48,283] completed apartment homes.
The tables below set forth a summary of real estate portfolio by geographic market of the Company and of the Operating Partnership at December 31, [removed: 2019.][added: 2020.]
SUMMARY OF REAL ESTATE PORTFOLIO BY GEOGRAPHIC MARKET AT DECEMBER 31, [removed: 2019][added: 2020]
| Real Estate Under Development (a) | | — | | [removed: —] [added: 202] | | [removed: 0.6] [added: 1.9] | % | | [removed: 69,777] [added: 247,877] | | | — | | | | | | | |
| | (a) | As of December 31, [removed: 2019,] [added: 2020,] the Company was developing [removed: three] [added: five] wholly owned communities with a total of [removed: 878] [added: 1,378] apartment homes, [removed: none] [added: 202] of which have been completed. |
| Orange County, CA | | 5 | | 3,119 | | 19.3 | % | $ | [removed: 746,564] [added: 753,801] | | $ | — | | $ | [removed: 239,360] [added: 241,680] | | 96.6 | % | 805 |
| Monterey Peninsula, CA | | 7 | | 1,565 | | 4.7 | % | | [removed: 182,630] [added: 185,224] | | | — | | | [removed: 116,696] [added: 118,353] | | 96.6 | % | 729 |
| Total Real Estate Owned | | [removed: 52] [added: 149] | | [removed: 16,434] [added: 48,283] | | 100.0 | % | $ | [removed: 3,875,160] [added: 13,071,472] | | $ | [removed: 99,071] [added: 862,147] | | | | | | | |
| Orange County, CA | | 11 | | 4,950 | | 11.5 | % | $ | 1,500,611 | | $ | — | | $ | 303,154 | | 96.4 | % | 872 |
| San Francisco, CA | | 11 | | 2,751 | | 6.8 | % | | 888,683 | | | 27,000 | | | 323,041 | | 91.5 | % | 841 |
| Seattle, WA | | 14 | | 2,725 | | 7.3 | % | | 957,686 | | | — | | | 351,444 | | 96.7 | % | 887 |
| Monterey Peninsula, CA | | 7 | | 1,565 | | 1.4 | % | | 185,224 | | | — | | | 118,353 | | 96.6 | % | 729 |
| Los Angeles, CA | | 4 | | 1,225 | | 3.5 | % | | 463,166 | | | — | | | 378,094 | | 95.5 | % | 967 |
| Other Southern California | | 3 | | 817 | | 1.6 | % | | 211,285 | | | — | | | 258,611 | | 97.2 | % | 1,018 |
| Portland, OR | | 3 | | 752 | | 0.9 | % | | 120,324 | | | — | | | 160,005 | | 96.6 | % | 903 |
| Metropolitan D.C. | | 23 | | 8,402 | | 18.1 | % | | 2,350,124 | | | 288,530 | | | 279,710 | | 96.5 | % | 915 |
| Baltimore, MD | | 5 | | 1,597 | | 2.6 | % | | 338,347 | | | 58,600 | | | 211,864 | | 97.1 | % | 938 |
| Richmond, VA | | 4 | | 1,358 | | 1.2 | % | | 153,906 | | | — | | | 113,333 | | 97.8 | % | 1,018 |
| New York, NY | | 6 | | 2,318 | | 11.9 | % | | 1,552,358 | | | — | | | 669,697 | | 92.5 | % | 754 |
| Boston, MA | | 11 | | 4,298 | | 12.8 | % | | 1,669,381 | | | 271,550 | | | 388,409 | | 94.4 | % | 987 |
| Philadelphia, PA | | 1 | | 313 | | 0.8 | % | | 107,736 | | | — | | | 344,204 | | 96.1 | % | 1,054 |
| Tampa, FL | | 11 | | 3,874 | | 4.8 | % | | 625,752 | | | — | | | 161,526 | | 97.0 | % | 996 |
| Orlando, FL | | 9 | | 2,500 | | 1.8 | % | | 240,102 | | | — | | | 96,041 | | 96.8 | % | 946 |
| Nashville, TN | | 8 | | 2,260 | | 1.7 | % | | 223,827 | | | — | | | 99,038 | | 97.8 | % | 933 |
| Other Florida | | 1 | | 636 | | 0.7 | % | | 89,630 | | | — | | | 140,928 | | 97.2 | % | 1,130 |
| Dallas, TX | | 11 | | 3,864 | | 4.4 | % | | 581,118 | | | 205,870 | | | 150,393 | | 96.8 | % | 868 |
| Austin, TX | | 4 | | 1,272 | | 1.3 | % | | 171,482 | | | — | | | 134,813 | | 97.6 | % | 913 |
| Denver, CO | | 1 | | 218 | | 1.1 | % | | 144,998 | | | — | | | 665,128 | | 93.1 | % | 955 |
| Total Operating Communities | | 148 | | 47,695 | | 96.2 | % | | 12,575,740 | | | 851,550 | | $ | 263,670 | | 96.0 | % | 908 |
| Land | | — | | — | | 0.5 | % | | 61,682 | | | — | | | | | | | |
| Held for Disposition | | 1 | | 386 | | 0.9 | % | | 116,655 | | | — | | | | | | | |
| Other | | — | | — | | 0.5 | % | | 69,518 | | | 10,597 | | | | | | | |
SUMMARY OF REAL ESTATE PORTFOLIO BY GEOGRAPHIC MARKET AT DECEMBER 31, 2020
| San Francisco, CA | | 9 | | 2,185 | | 15.8 | % | | 617,359 | | | 27,000 | | | 282,546 | | 93.6 | % | 829 |
| Seattle, WA | | 5 | | 932 | | 5.9 | % | | 233,963 | | | — | | | 251,033 | | 97.0 | % | 874 |
| Los Angeles, CA | | 2 | | 344 | | 3.0 | % | | 118,281 | | | — | | | 343,837 | | 96.4 | % | 976 |
| Other Southern California | | 1 | | 414 | | 1.9 | % | | 76,906 | | | — | | | 185,763 | | 97.6 | % | 996 |
| Portland, OR | | 2 | | 476 | | 1.3 | % | | 52,126 | | | — | | | 109,508 | | 97.1 | % | 903 |
| Metropolitan D.C. | | 6 | | 2,136 | | 14.7 | % | | 568,202 | | | — | | | 266,012 | | 95.6 | % | 919 |
| Baltimore, MD | | 2 | | 540 | | 2.8 | % | | 108,779 | | | — | | | 201,443 | | 97.8 | % | 967 |
| New York, NY | | 2 | | 996 | | 16.0 | % | | 624,255 | | | — | | | 626,762 | | 90.0 | % | 687 |
| Boston, MA | | 1 | | 387 | | 1.9 | % | | 76,059 | | | 72,500 | | | 196,535 | | 95.5 | % | 1,069 |
| Tampa, FL | | 3 | | 1,614 | | 2.8 | % | | 233,991 | | | — | | | 144,976 | | 97.7 | % | 1,068 |
| Nashville, TN | | 6 | | 1,612 | | 3.9 | % | | 157,415 | | | — | | | 97,652 | | 97.6 | % | 925 |
| Other Florida | | 1 | | 636 | | 2.3 | % | | 89,630 | | | — | | | 140,928 | | 97.2 | % | 1,130 |
| Denver, CO | | 1 | | 218 | | 3.7 | % | | 144,998 | | | — | | | 665,128 | | 93.1 | % | 955 |
| Total Operating Communities | | 53 | | 17,174 | | 100.0 | % | | 4,040,989 | | | 99,500 | | $ | 235,297 | | 96.0 | % | 884 |
| Other | | — | | — | | — | % | | 2,736 | | | (396) | | | | | | | |
| Orange County, CA | | 12 | | 5,336 | | 12.8 | % | $ | 1,607,866 | | $ | — | | $ | 301,324 | | 95.9 | % | 868 |
| San Francisco, CA | | 11 | | 2,751 | | 7.0 | % | | 881,394 | | | 27,000 | | | 320,390 | | 96.8 | % | 841 |
| Seattle, WA | | 16 | | 2,992 | | 8.4 | % | | 1,063,695 | | | 70,931 | | | 355,513 | | 96.6 | % | 890 |
| Los Angeles, CA | | 4 | | 1,225 | | 3.6 | % | | 458,189 | | | — | | | 374,032 | | 96.6 | % | 967 |
| Monterey Peninsula, CA | | 7 | | 1,565 | | 1.5 | % | | 182,630 | | | — | | | 116,696 | | 96.6 | % | 729 |
| Other Southern California | | 3 | | 817 | | 1.6 | % | | 207,986 | | | 42,698 | | | 254,573 | | 95.8 | % | 1,014 |
| Portland, OR | | 2 | | 476 | | 0.4 | % | | 50,395 | | | — | | | 105,872 | | 96.6 | % | 903 |
| Metropolitan D.C. | | 23 | | 8,305 | | 18.3 | % | | 2,322,872 | | | 252,067 | | | 279,696 | | 97.4 | % | 909 |
| Richmond, VA | | 4 | | 1,358 | | 1.2 | % | | 151,726 | | | — | | | 111,728 | | 97.4 | % | 1,018 |
| Baltimore, MD | | 5 | | 1,597 | | 2.6 | % | | 331,777 | | | 58,600 | | | 207,750 | | 95.3 | % | 938 |
| Orlando, FL | | 9 | | 2,500 | | 1.9 | % | | 233,098 | | | — | | | 93,239 | | 96.4 | % | 946 |
| Nashville, TN | | 8 | | 2,260 | | 1.8 | % | | 220,566 | | | — | | | 97,596 | | 97.5 | % | 933 |
| Tampa, FL | | 9 | | 2,908 | | 3.3 | % | | 411,847 | | | — | | | 141,626 | | 96.6 | % | 979 |
| Other Florida | | 1 | | 636 | | 0.7 | % | | 87,518 | | | — | | | 137,607 | | 96.1 | % | 1,130 |
| New York, NY | | 6 | | 2,318 | | 12.3 | % | | 1,543,545 | | | — | | | 665,895 | | 97.0 | % | 754 |
| Boston, MA | | 11 | | 4,299 | | 13.0 | % | | 1,640,478 | | | 389,639 | | | 381,595 | | 95.1 | % | 987 |
| Philadelphia, PA | | 1 | | 313 | | 0.9 | % | | 107,350 | | | — | | | 342,971 | | 82.7 | % | 1,054 |
| Dallas, TX | | 11 | | 3,864 | | 4.5 | % | | 565,356 | | | 275,524 | | | 146,314 | | 96.3 | % | 868 |
| Austin, TX | | 4 | | 1,272 | | 1.3 | % | | 167,217 | | | — | | | 131,460 | | 97.3 | % | 913 |
| Denver, CO | | 1 | | 218 | | 1.1 | % | | 144,252 | | | — | | | 661,706 | | 94.6 | % | 955 |
| Total Operating Communities | | 148 | | 47,010 | | 98.2 | % | | 12,379,757 | | | 1,116,459 | | $ | 263,343 | | 96.4 | % | 908 |
| Land | | — | | — | | 0.7 | % | | 87,615 | | | — | | | | | | | |
| Other | | — | | — | | 0.5 | % | | 64,952 | | | 32,982 | | | | | | | |
| Total Real Estate Owned | | 148 | | 47,010 | | 100.0 | % | $ | 12,602,101 | | $ | 1,149,441 | | | | | | | |
| San Francisco, CA | | 9 | | 2,185 | | 15.8 | % | | 611,361 | | | 27,000 | | | 279,799 | | 96.7 | % | 829 |
| Seattle, WA | | 5 | | 932 | | 5.9 | % | | 229,423 | | | — | | | 246,162 | | 96.4 | % | 869 |
| Los Angeles, CA | | 2 | | 344 | | 3.0 | % | | 116,446 | | | — | | | 338,506 | | 96.5 | % | 976 |
| Other Southern California | | 1 | | 414 | | 1.9 | % | | 75,187 | | | — | | | 181,611 | | 96.7 | % | 989 |
| Portland, OR | | 2 | | 476 | | 1.3 | % | | 50,395 | | | — | | | 105,872 | | 96.6 | % | 903 |
| Metropolitan D.C. | | 6 | | 2,068 | | 14.7 | % | | 564,334 | | | — | | | 272,889 | | 96.9 | % | 894 |
| Baltimore, MD | | 2 | | 540 | | 2.8 | % | | 106,373 | | | — | | | 196,987 | | 96.7 | % | 967 |
| Nashville, TN | | 6 | | 1,612 | | 3.9 | % | | 155,207 | | | — | | | 96,282 | | 97.5 | % | 925 |
| Tampa, FL | | 2 | | 942 | | 2.8 | % | | 110,065 | | | — | | | 116,842 | | 97.4 | % | 1,043 |
| Other Florida | | 1 | | 636 | | 2.3 | % | | 87,518 | | | — | | | 137,607 | | 96.1 | % | 1,130 |
| New York, NY | | 2 | | 996 | | 16.0 | % | | 619,246 | | | — | | | 621,733 | | 96.3 | % | 687 |
| Boston, MA | | 1 | | 387 | | 1.9 | % | | 74,757 | | | 72,500 | | | 193,171 | | 95.3 | % | 1,069 |
| Denver, CO | | 1 | | 218 | | 3.7 | % | | 144,252 | | | — | | | 661,706 | | 94.6 | % | 955 |
| Total Operating Communities | | 52 | | 16,434 | | 100.0 | % | | 3,873,758 | | | 99,500 | | $ | 235,716 | | 96.7 | % | 871 |
| Other | | — | | — | | — | % | | 1,402 | | | (429) | | | | | | | |
An excerpt. Shown here: all 8 rewritten, 40 of 41 added and all 39 removed. The counts are complete. For every sentence, read Item 2. PROPERTIES in the FY2020 filing and the FY2019 filing.
Item 5. MARKET FOR REGISTRANT’S COMMON EQUITY, RELATED STOCKHOLDER MATTERS AND ISSUER PURCHASES OF EQUITY SECURITIES
15 rewritten, 6 added, 6 removed, 52 unchanged
On February [removed: 17, 2020,] [added: 16, 2021,] there were [removed: 3,255] [added: 3,173] holders of record of the [removed: 294,631,463] [added: 296,820,995] outstanding shares of our common stock.
We have determined that, for federal income tax purposes, approximately 73% of the distributions for [removed: 2019] [added: 2020] represented ordinary income, less than 1% represented qualified ordinary income, [removed: 1%] [added: 21%] represented long-term capital [removed: gain, 5%] [added: gain and 6%] represented unrecaptured section 1250 [removed: gain, and 21% represented nondividend distributions.][added: gain.]
Distributions declared on the Series E for the years ended December 31, [removed: 2019] [added: 2020] and [removed: 2018] [added: 2019] were [removed: $1.4832] [added: $1.5592] per share, or [removed: $0.3708] [added: $0.3898] per quarter, and [removed: $1.3968] [added: $1.4832] per share, or [removed: $0.3492] [added: $0.3708] per quarter, respectively.
At December 31, [removed: 2019,] [added: 2020,] a total of [removed: 2.8] [added: 2.7] million shares of the Series E were outstanding.
As of December 31, [removed: 2019,] [added: 2020,] a total of [removed: 14.7] [added: 14.4] million shares of the Series F were outstanding.
As of February [removed: 17, 2020,] [added: 16, 2021,] there were approximately [removed: 1,935] [added: 1,911] participants in the plan.
At December 31, [removed: 2019,] [added: 2020,] there were [removed: 184.1] [added: 184.8] million OP Units outstanding in the Operating Partnership, of which 176.2 million OP Units or [removed: 95.7%] [added: 95.3%] were owned by UDR and affiliated entities and [removed: 7.9] [added: 8.6] million OP Units or [removed: 4.3%] [added: 4.7%] were owned by non-affiliated limited partners.
During the three months ended December 31, [removed: 2019,] [added: 2020,] we [removed: issued less than 0.1 million] [added: did not issue any] shares of our common stock upon redemption of OP Units in reliance upon an exemption from registration provided by Section 4(a)(2) of the Securities Act of 1933.
The following table summarizes all of UDR’s repurchases of shares of common stock under these programs during the quarter ended December 31, [removed: 2019] [added: 2020] (_shares in thousands_):
| Beginning Balance | [removed: 10,561] [added: 11,158] | | $ | [removed: 22.66] [added: 23.75] | | [removed: 10,561] [added: 11,158] | | 14,439 |
| October 1, [removed: 2019] [added: 2020] through October 31, [removed: 2019] [added: 2020] | — | | | — | | — | | 14,439 |
| November 1, [removed: 2019] [added: 2020] through November 30, [removed: 2019] [added: 2020] | — | | | — | | — | | 14,439 |
| December 1, [removed: 2019] [added: 2020] through December 31, [removed: 2019] [added: 2020] | — | | | — | | — | | 14,439 |
[removed: 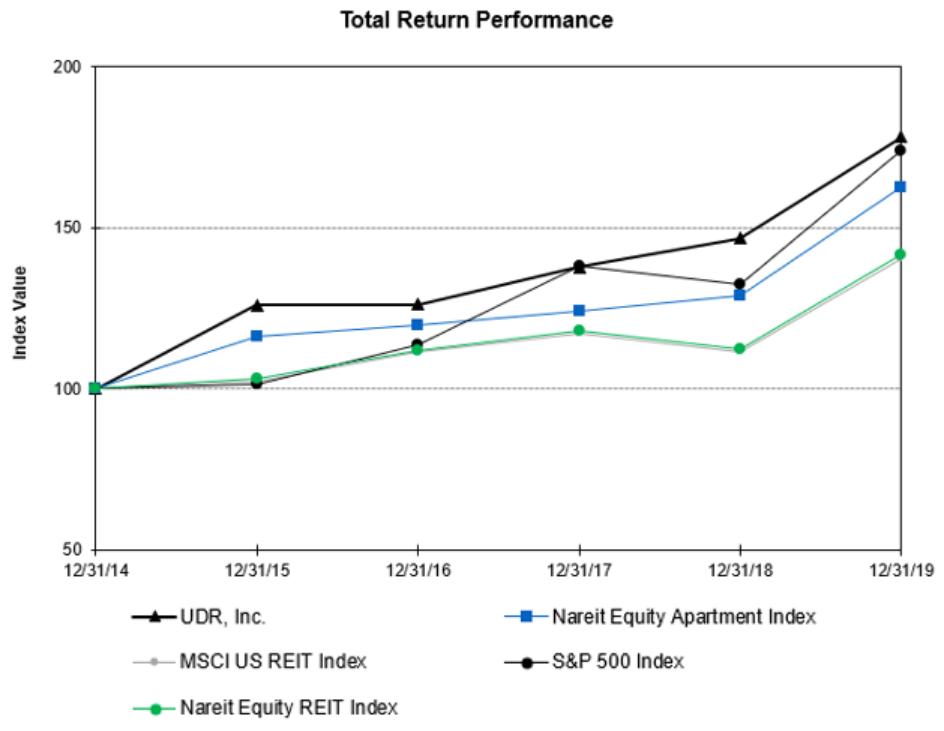][added: 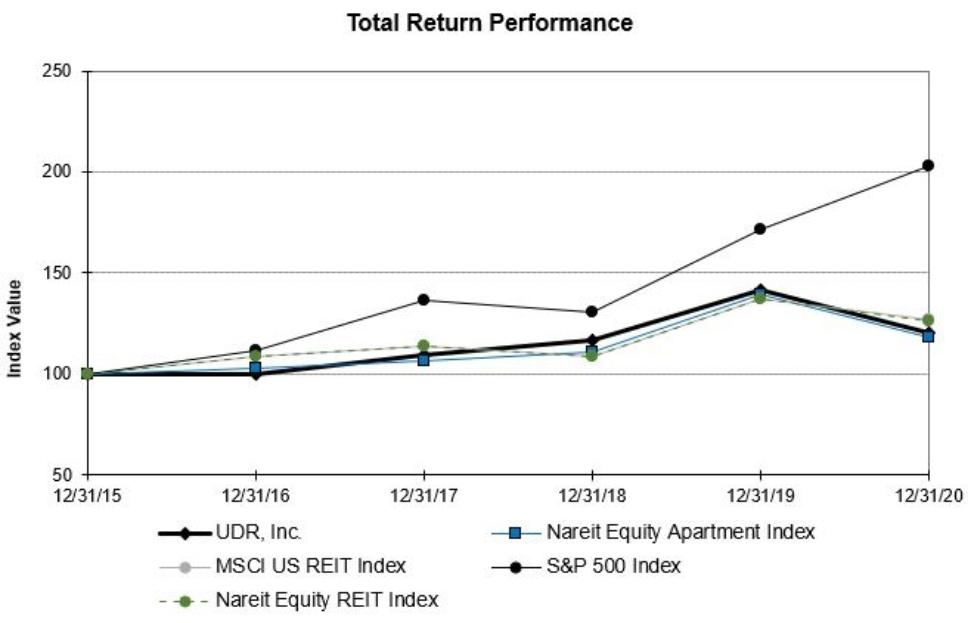]
| Index | | [removed: 12/31/2014 | |] 12/31/2015 | | 12/31/2016 | | 12/31/2017 | | 12/31/2018 | | 12/31/2019 | [added: | 12/31/2020 |]
| Balance as of December 31, 2020 | 11,158 | | $ | 23.75 | | 11,158 | | 14,439 |
| UDR, Inc. | | 100.00 | | 100.27 | | 109.41 | | 116.42 | | 141.42 | | 120.74 |
| Nareit Equity Apartment Index | | 100.00 | | 102.86 | | 106.68 | | 110.63 | | 139.75 | | 118.30 |
| MSCI U.S. REIT Index | | 100.00 | | 108.60 | | 114.11 | | 108.89 | | 137.03 | | 126.65 |
| S&P 500 Index | | 100.00 | | 111.96 | | 136.40 | | 130.42 | | 171.49 | | 203.04 |
| Nareit Equity REIT Index | | 100.00 | | 108.52 | | 114.19 | | 108.91 | | 137.23 | | 126.25 |
| Balance as of December 31, 2019 | 10,561 | | $ | 22.66 | | 10,561 | | 14,439 |
| UDR, Inc. | | 100.00 | | 125.96 | | 126.30 | | 137.81 | | 146.64 | | 178.14 |
| Nareit Equity Apartment Index | | 100.00 | | 116.45 | | 119.78 | | 124.24 | | 128.83 | | 162.74 |
| MSCI U.S. REIT Index | | 100.00 | | 102.52 | | 111.34 | | 116.98 | | 111.64 | | 140.48 |
| S&P 500 Index | | 100.00 | | 101.38 | | 113.51 | | 138.29 | | 132.23 | | 173.86 |
| Nareit Equity REIT Index | | 100.00 | | 103.20 | | 111.99 | | 117.84 | | 112.39 | | 141.61 |
Item 6. SELECTED FINANCIAL DATA
262 rewritten, 177 added, 186 removed, 526 unchanged
| | | Year Ended December 31, | | | | | [removed: | | | | | | | | |]
| Distributions to preferred stockholders [removed: | | | 4,104 | | | 3,868] [added: — Series E (Convertible)] | | | [removed: 3,708] [added: 4,230] | | | [removed: 3,717] [added: 4,104] | | | [removed: 3,722] [added: 3,868] |
| [removed: Net] [added: Net] income/(loss) attributable to common [removed: stockholders | | | 180,861 | | | 199,238] [added: stockholders] | | [added: $] | [removed: 117,850] [added: 60,036] | | [added: $] | [removed: 289,001] [added: 180,861] | | [added: $] | [removed: 336,661] [added: 199,238] |
| [removed: Income/(loss)] [added: Income/(loss)] per weighted average common [removed: share — basic] [added: share, diluted] | | $ | [removed: 0.63 | | $ | 0.74 | | $ | 0.44] [added: 0.20] | | $ | [removed: 1.09] [added: 0.63] | | $ | [removed: 1.30] [added: 0.74] |
| Weighted average number of [removed: Common Shares] [added: common shares] outstanding — basic [added: per the Consolidated Statements of Operations] | [removed: ] | [added: 294,545] | [removed: 285,247] | [removed: ] [added: 285,247] | | 268,179 | [removed: | | 267,024 | | | 265,386 | | | 258,669 |]
| Weighted average number of [removed: Common Shares] [added: common shares] outstanding — diluted [added: per the Consolidated Statements of Operations] | [removed: ] | [added: 294,927] | [removed: 286,015] | [removed: ] [added: 286,015] | | 269,483 | [removed: | | 268,830 | | | 267,311 | | | 263,752 |]
| Weighted average number of [removed: Common Shares outstanding, OP Units/DownREIT Units] [added: common shares, OP/DownREIT Units,] and [removed: Common Stock] [added: common stock] equivalents outstanding — diluted | [removed: | | 311,799 |] | | [removed: 297,042 | | | 296,672] [added: 320,187] | | | [removed: 295,469] [added: 311,799] | | | [removed: 276,699] [added: 297,042] |
| [removed: Funds from operations] [added: FFO] attributable to common stockholders and [removed: unitholders — basic | | $ | 629,279 | | $ | 570,254] [added: unitholders, basic] | | [removed: $] [added: $] | [removed: 538,916] [added: 589,527] | | $ | [removed: 527,096] [added: 629,279] | | $ | [removed: 455,565] [added: 570,254] |
| [removed: Funds from operations] [added: FFO] attributable to common stockholders and [removed: unitholders — diluted | | | 633,383 | | | 574,122] [added: unitholders, diluted] | | [added: $] | [removed: 542,624] [added: 593,757] | | [added: $] | [removed: 530,813] [added: 633,383] | | [added: $] | [removed: 459,287] [added: 574,122] |
[added: | | |] Year Ended December 31, [added: | | | | |]
| Net income/(loss) attributable to OP unitholders | [removed: | | 102,163 |] | [removed: | 229,763 | |] [added: $] | [removed: 106,307] [added: 134,229] | | [added: $] | [removed: 77,818] [added: 102,163] | | [added: $] | [removed: 213,301] [added: 229,763] |
| [removed: Cash] [added: Net cash] provided by/(used in) operating activities | | $ | [removed: 255,093 | | $ | 255,668 | | $ | 235,257 | | $ | 228,941] [added: 217,683] | | $ | [removed: 224,396] [added: 255,093] |
| [removed: Cash] [added: Net cash] provided by/(used in) investing activities | | | [removed: (43,906) | | | 71,683 | | | (105,989) | | | (9,455)] [added: (140,039)] | | | [removed: 23,485] [added: (43,906)] |
| [removed: Cash] [added: Net cash] provided by/(used in) financing activities | | | [removed: (210,853) | | | (326,535) | | | (128,846) | | | (221,483)] [added: (76,578)] | | | [removed: (247,747)] [added: (210,853)] |
Such forward-looking statements include, without limitation, statements concerning property acquisitions and dispositions, development activity and capital expenditures, capital raising activities, rent growth, occupancy, [removed: and] rental expense [removed: growth.][added: growth and expected or potential impacts of the novel coronavirus disease (“COVID-19”) pandemic.]
Such factors include, among other things, [added: the impact of the COVID-19 pandemic and measures intended to prevent its spread or address its effect,] unfavorable changes in the apartment market, changing economic conditions, the impact of inflation/deflation on rental rates and property operating expenses, expectations concerning the availability of capital and the stability of the capital markets, the impact of competition and competitive pricing, acquisitions, developments and redevelopments not achieving anticipated results, delays in completing developments and redevelopments, delays in completing lease-ups on schedule or at expected rent and occupancy levels, expectations on job growth, home affordability and demand/supply ratio for multifamily housing, expectations concerning development and redevelopment activities, expectations on occupancy levels and rental rates, expectations concerning joint ventures and partnerships with third parties, expectations that automation will help grow net operating income, and expectations on annualized net operating income.
| | ● | unfavorable changes in apartment market and economic conditions that could adversely affect occupancy levels and rental [removed: rates;] [added: rates, including as a result of COVID-19;] |
The following discussion should be read in conjunction with the consolidated financial statements appearing elsewhere herein and is based primarily on the consolidated financial statements for the years ended December 31, [removed: 2019,] [added: 2020,] and [removed: 2018] [added: 2019] of each UDR, Inc. and United Domination Realty, L.P.
This section of this Form 10-K generally discusses [removed: 2019] [added: 2020] and [removed: 2018] [added: 2019] items and year-to-year comparisons between [removed: 2019] [added: 2020] and [removed: 2018] [added: 2019] of UDR, Inc. and United Domination Realty, L.P. Discussions of [removed: 2017] [added: 2018] items and year-to-year comparisons between [removed: 2018] [added: 2019] and [removed: 2017] [added: 2018] that are not included in this Form 10-K can be found in “Management’s Discussion and Analysis of Financial Condition and Results of Operations” in Part II, Item 7 of the Company’s Annual Report on Form 10-K for the fiscal year ended December 31, [removed: 2018.][added: 2019.]
At December 31, [removed: 2019,] [added: 2020,] our consolidated real estate portfolio [removed: consisted] [added: included] of [removed: 148] [added: 149] communities [removed: located] in 13 states plus the District of Columbia [removed: consisting] [added: totaling] of [removed: 47,010] [added: 48,283] apartment homes.
In addition, we have an ownership interest in [removed: 5,268] [added: 5,295] completed or to-be-completed apartment homes through unconsolidated joint ventures or partnerships, including [removed: 2,138] [added: 2,165] apartment homes owned by entities in which we hold preferred equity investments.
The costs capitalized are reported on the Consolidated Balance Sheets as _Total [removed: Real Estate Owned, Net] [added: real estate owned, net] of [removed: Accumulated Depreciation._] [added: accumulated depreciation._] Amounts capitalized during the years ended December 31, [added: 2020,] 2019, [removed: 2018,] and [removed: 2017] [added: 2018] were [removed: $13.5] [added: $19.0] million, [removed: $18.1] [added: $13.5] million, and [removed: $27.4] [added: $18.1] million, respectively.
Our [added: future] cash flow estimates are based upon historical results adjusted to reflect our best estimate of future market and operating conditions and our estimated holding periods.
[added: Our estimates of fair] value represent our best estimate based primarily upon unobservable inputs [removed: (defined as Level 3 inputs in the fair value hierarchy)] related to rental rates, operating costs, growth rates, discount rates, capitalization rates, industry trends and reference to market rates and transactions.
Based on the net earnings reported for the year ended December 31, [removed: 2019] [added: 2020] in our Consolidated Statements of Operations, we would have incurred federal and state GAAP income taxes if we had failed to qualify as a REIT.
The following table summarizes our market information by major geographic markets as of and for the year ended December 31, [removed: 2019:][added: 2020:]
| | | | | December 31, [removed: 2019] [added: 2020] | | | | | | | Year Ended December 31, [removed: 2019] [added: 2020] | | | | | | |
| Total Real Estate Owned | | [removed: 148] [added: 53] | | [removed: 47,010] [added: 17,174] | | 100.0 | % | [added: ] | [removed: 12,602,101] [added: 4,043,725] | [added: ] | | [removed: ] | [added: ] | [added: ] | | $ | [removed: 808,303] [added: 303,287] |
| Total Accumulated Depreciation | | | | | | | | | [removed: (4,131,353)] [added: (4,605,366)] | | | | | | | | |
| Total Real Estate Owned, Net of Accumulated Depreciation | | | | | | | | $ | [removed: 8,470,748] [added: 8,466,106] | | | | | | | | |
| (b) | As of December 31, [removed: 2019,] [added: 2020,] the Company was developing [removed: three] [added: five] wholly owned communities with a total of [removed: 878] [added: 1,378] apartment homes, [removed: none] [added: 202] of which have been completed. |
Our _Same-Store Communities_ segment represents those communities acquired, developed, and stabilized prior to January 1, [removed: 2018] [added: 2019] and held as of December 31, [removed: 2019.][added: 2020.]
We routinely use our working capital credit [removed: facility and commercial paper program, and may use] [added: facility,] our unsecured revolving credit [removed: facility,] [added: facility and issuances of commercial paper] to temporarily fund certain investing and financing activities prior to arranging for longer-term financing or the issuance of equity or debt securities.
During the year ended December 31, [removed: 2019,] [added: 2020,] the Company [removed: sold 7.0 million shares of common stock through] [added: entered into forward sales agreements under] its ATM program for [removed: aggregate gross proceeds] [added: a total] of [removed: approximately $316.5] [added: 2.1] million [added: shares of common stock] at a weighted average [added: initial forward] price per share of [removed: $45.29.][added: $49.56.]
As of December 31, [removed: 2019,] [added: 2020,] we had [removed: 11.7] [added: 9.6] million shares of common stock available for future issuance under the ATM program.
In [removed: July 2019,] [added: February 2020,] the Company issued [removed: $300.0] [added: $200.0] million of 3.20% senior unsecured medium-term notes due [removed: January 15, 2030.][added: 2030 (the “2030 Notes”).]
Interest is payable semi-annually in arrears on January 15 and July 15 of each year, beginning on [removed: January] [added: July] 15, 2020.
The notes were priced at [removed: 99.66%] [added: 105.660%] of the principal amount at issuance.
In [removed: August 2019,] [added: July 2020,] the Company issued $400.0 million of [removed: 3.00%] [added: 2.10%] senior unsecured medium-term notes due August [removed: 15, 2031.][added: 1, 2032.]
Interest is payable semi-annually in arrears on February [removed: 15] [added: 1] and August [removed: 15 of each year, beginning on February 15, 2020.][added: 1.]
Not Applicable.
| | ● | the impact of the COVID-19 pandemic and measures intended to prevent its spread or address its effects; |
COVID-19 Update
See Part I, Item 1.
“Business – COVID-19 Update” above for more information on the impact of COVID-19 on the Company.
The _Same-Store Community_ apartment home population for the year ended December 31, 2020, was 37,607.
Quarterly or when changes in circumstances warrant, we will assess our real estate properties for indicators
of impairment.
The judgments regarding the existence of impairment indicators are based on certain factors.
Such factors include, among other things, operational performance, market conditions, the Company’s intent and ability to hold the related asset, as well as any significant cost overruns on development properties.
If a real estate property has indicators of impairment, we assess whether the long-lived asset’s carrying value exceeds the community’s undiscounted future cash flows, which is representative of projected net operating income (“NOI”) plus the residual value of the community.
If such indicators of impairment are present and the carrying value exceeds the undiscounted cash flows of the community, an impairment loss is recognized equal to the excess of the carrying amount of the asset over its estimated fair value.
For long-lived assets to be disposed of, impairment losses are recognized when the fair value of the asset less estimated cost to sell is less than the carrying value of the asset.
Properties classified as real estate held for disposition generally represent properties that are actively marketed or contracted for sale with the closing expected to occur within the next twelve months.
Real estate held for disposition is carried at the lower of cost, net of accumulated depreciation, or fair value, less the cost to sell, determined on an asset-by-asset basis.
Expenditures for ordinary repair and maintenance costs on held for disposition properties are charged to expense as incurred.
Expenditures for improvements, renovations, and replacements related to held for disposition properties are capitalized at cost.
Depreciation is not recorded on real estate held for disposition.
| Orange County, CA | | 10 | | 4,434 | | 8.8 | % | $ | 1,145,371 | | 96.5 | % | $ | 2,328 | | $ | 91,704 |
| San Francisco, CA | | 11 | | 2,751 | | 6.8 | % | | 885,036 | | 91.5 | % | | 3,501 | | | 76,760 |
| Seattle, WA | | 13 | | 2,570 | | 6.8 | % | | 889,749 | | 96.7 | % | | 2,471 | | | 53,010 |
| Monterey Peninsula, CA | | 7 | | 1,565 | | 1.4 | % | | 185,224 | | 96.6 | % | | 1,940 | | | 27,587 |
| Los Angeles, CA | | 4 | | 1,225 | | 3.5 | % | | 463,167 | | 95.5 | % | | 2,765 | | | 27,585 |
| Other Southern California | | 2 | | 654 | | 0.9 | % | | 111,656 | | 97.7 | % | | 2,038 | | | 11,796 |
| Portland, OR | | 2 | | 476 | | 0.4 | % | | 52,126 | | 97.1 | % | | 1,637 | | | 6,623 |
| Metropolitan D.C. | | 20 | | 7,496 | | 14.9 | % | | 1,944,746 | | 96.8 | % | | 2,077 | | | 125,654 |
| Baltimore, MD | | 3 | | 720 | | 1.2 | % | | 156,797 | | 97.9 | % | | 1,720 | | | 9,603 |
| Richmond, VA | | 4 | | 1,358 | | 1.2 | % | | 153,906 | | 97.8 | % | | 1,422 | | | 16,874 |
| Boston, MA | | 4 | | 1,388 | | 3.6 | % | | 470,541 | | 95.1 | % | | 2,783 | | | 32,372 |
| New York, NY | | 3 | | 1,452 | | 7.9 | % | | 1,037,337 | | 92.6 | % | | 4,135 | | | 33,181 |
| Tampa, FL | | 7 | | 2,287 | | 2.1 | % | | 274,126 | | 97.1 | % | | 1,484 | | | 25,949 |
| Orlando, FL | | 9 | | 2,500 | | 1.8 | % | | 240,100 | | 96.8 | % | | 1,413 | | | 28,541 |
| Nashville, TN | | 8 | | 2,260 | | 1.7 | % | | 223,827 | | 97.8 | % | | 1,378 | | | 25,943 |
| Other Florida | | 1 | | 636 | | 0.7 | % | | 89,630 | | 97.2 | % | | 1,656 | | | 8,085 |
| Dallas, TX | | 7 | | 2,345 | | 2.3 | % | | 298,205 | | 97.3 | % | | 1,382 | | | 24,124 |
| Austin, TX | | 4 | | 1,272 | | 1.3 | % | | 171,483 | | 97.6 | % | | 1,548 | | | 13,607 |
| Denver, CO | | 1 | | 218 | | 1.1 | % | | 144,959 | | 93.1 | % | | 3,012 | | | 5,200 |
| Total/Average Same-Store Communities | | 120 | | 37,607 | | 68.4 | % | | 8,937,986 | | 96.3 | % | $ | 2,126 | | | 644,198 |
| Non-Mature, Commercial Properties & Other | | 28 | | 10,088 | | 28.8 | % | | 3,768,954 | | | | | | | | 196,868 |
| Total Real Estate Held for Investment | | 148 | | 47,695 | | 97.2 | % | | 12,706,940 | | | | | | | | 841,066 |
The following tables set forth selected consolidated financial and other information of UDR, Inc. and of the Operating Partnership as of and for each of the years in the five-year period ended December 31, 2019.
The tables should be read in conjunction with each of UDR, Inc.’s and the Operating Partnership’s respective consolidated financial
statements and the notes thereto, and Item 7.
Management’s Discussion and Analysis of Financial Condition and Results of Operations, included elsewhere in this Report.
| | | | | | | | | | | | | | | | |
| --- | --- | --- | --- | --- | --- | --- | --- | --- | --- | --- | --- | --- | --- | --- | --- |
| | | UDR, Inc. | | | | | | | | | | | | | |
| | | (In thousands, except per share data | | | | | | | | | | | | | |
| | | and apartment homes owned) | | | | | | | | | | | | | |
| | | 2019 | | | 2018 | | | 2017 | | | 2016 | | | 2015 | |
| OPERATING DATA: | | | | | | | | | | | | | | | |
| Rental income | | $ | 1,138,138 | | $ | 1,035,105 | | $ | 984,309 | | $ | 948,461 | | $ | 871,928 |
| Net income/(loss) | | | 199,579 | | | 221,542 | | | 132,655 | | | 320,380 | | | 357,159 |
| Common stock distributions declared | | | 395,113 | | | 348,079 | | | 331,974 | | | 315,102 | | | 289,500 |
| Income/(loss) per weighted average common share — diluted | | $ | 0.63 | | $ | 0.74 | | $ | 0.44 | | $ | 1.08 | | $ | 1.29 |
| Common stock distributions declared - per share | | $ | 1.37 | | $ | 1.29 | | $ | 1.24 | | $ | 1.18 | | $ | 1.11 |
| Balance Sheet Data: | | | | | | | | | | | | | | | |
| Real estate owned, at cost (a) | | $ | 12,602,101 | | $ | 10,196,159 | | $ | 10,177,206 | | $ | 9,615,753 | | $ | 9,190,276 |
| Accumulated depreciation (a) | | | 4,131,353 | | | 3,654,160 | | | 3,330,166 | | | 2,923,625 | | | 2,646,874 |
| Total real estate owned, net of accumulated depreciation (a) | | | 8,470,748 | | | 6,541,999 | | | 6,847,040 | | | 6,692,128 | | | 6,543,402 |
| Total assets | | | 9,636,472 | | | 7,711,728 | | | 7,733,273 | | | 7,679,584 | | | 7,663,844 |
| Secured debt, net (a) | | | 1,149,441 | | | 601,227 | | | 803,269 | | | 1,130,858 | | | 1,376,945 |
| Unsecured debt, net | | | 3,558,083 | | | 2,946,560 | | | 2,868,394 | | | 2,270,620 | | | 2,193,850 |
| Total liabilities | | | 5,228,493 | | | 3,816,211 | | | 3,949,771 | | | 3,673,132 | | | 3,816,797 |
| Total stockholders’ equity | | | 3,358,542 | | | 2,905,625 | | | 2,825,800 | | | 3,093,110 | | | 2,899,755 |
| Number of Common Shares outstanding | | | 294,588 | | | 275,546 | | | 267,822 | | | 267,259 | | | 261,845 |
| Other Data (a) | | | | | | | | | | | | | | | |
| Total consolidated apartment homes owned (at end of year) | | | 47,010 | | | 39,931 | | | 39,998 | | | 39,454 | | | 40,728 |
| Weighted average number of consolidated apartment homes owned during the year | | | 42,579 | | | 39,406 | | | 39,692 | | | 40,543 | | | 39,501 |
| Cash Flow Data: | | | | | | | | | | | | | | | |
| Cash provided by/(used in) operating activities | | $ | 630,704 | | $ | 560,676 | | $ | 518,915 | | $ | 536,568 | | $ | 457,162 |
| Cash provided by/(used in) investing activities | | | (1,686,687) | | | (113,548) | | | (407,406) | | | (112,720) | | | (265,538) |
| Cash provided by/(used in) financing activities | | | 880,383 | | | (260,067) | | | (111,785) | | | (429,282) | | | (201,648) |
| Funds from Operations (b): | | | | | | | | | | | | | | | |
| (a) | Includes amounts classified as Held for Disposition, where applicable. |
| --- | --- |
| (b) | Funds from operations (“FFO”) attributable to common stockholders and unitholders is defined as _Net income/(loss) attributable to common stockholders_ (computed in accordance with GAAP), excluding impairment write-downs of depreciable real estate related to the main business of the Company or of investments in non-consolidated investees that are directly attributable to decreases in the fair value of depreciable real estate held by the investee, gains and losses from sales of depreciable real estate related to the main business of the Company and income taxes directly associated with those gains and losses, plus real estate depreciation and amortization, and after adjustments for noncontrolling interests, and the Company’s share of unconsolidated partnerships and joint ventures. This definition conforms with the National Association of Real Estate Investment Trust’s (“Nareit”) definition issued in April 2002 and restated in November 2018. Historical cost accounting for real estate assets in accordance with GAAP implicitly assumes that the value of real estate assets diminishes predictably over time. Since real estate values instead have historically risen or fallen with market conditions, many industry investors and analysts have considered the presentation of operating results for real estate companies that use historical cost accounting to be insufficient by themselves. Thus, Nareit created FFO as a supplemental measure of a REIT’s operating performance. In the computation of diluted FFO, if OP Units, DownREIT Units, unvested restricted stock, unvested LTIP Units, stock options, and the shares of Series E Cumulative Convertible Preferred Stock are dilutive, they are included in the diluted share count. |
Management considers FFO a useful metric for investors as the Company uses FFO in evaluating property acquisitions and its operating performance, and believes that FFO should be considered along with, but not as an alternative to, net income and cash flow as a measure of the Company’s activities in accordance with GAAP.
FFO does not represent cash generated from operating activities in accordance with GAAP and is not necessarily indicative of funds available to fund our cash needs.
See “Funds from Operations” in Item 7.
An excerpt. Shown here: 40 of 262 rewritten, 40 of 177 added and 40 of 186 removed. The counts are complete. For every sentence, read Item 6. SELECTED FINANCIAL DATA in the FY2020 filing and the FY2019 filing.
Item 9A. CONTROLS AND PROCEDURES
4 rewritten, 0 added, 1 removed, 12 unchanged
As of December 31, [removed: 2019,] [added: 2020,] we carried out an evaluation, under the supervision and with the participation of the Chief Executive Officer and Chief Financial Officer of the Company, which is the sole general partner of the Operating [added: Partnership, of the effectiveness of the design and operation of the disclosure controls and procedures of the Company and the Operating Partnership.]
Based on such evaluation, management concluded that the Company’s and the Operating Partnership’s internal control over financial reporting was effective as of December 31, [removed: 2019.][added: 2020.]
Ernst & Young LLP, the independent registered public accounting firm that audited our consolidated financial statements included in this Report, has audited UDR, Inc.’s internal control over financial reporting as of December 31, [removed: 2019.][added: 2020.]
The report of Ernst & Young LLP, which expresses an unqualified opinion on UDR, Inc.’s internal control over financial reporting as of December 31, [removed: 2019,] [added: 2020,] is included under the heading “Report of Independent Registered Public Accounting Firm” of UDR, Inc. contained in this Report.
Partnership, of the effectiveness of the design and operation of the disclosure controls and procedures of the Company and the Operating Partnership.
Item 10. DIRECTORS, EXECUTIVE OFFICERS AND CORPORATE GOVERNANCE
2 rewritten, 0 added, 0 removed, 4 unchanged
The information required by this item is incorporated by reference to the information set forth under the headings “Proposal No. 1 Election of Directors,” “Corporate Governance Matters,” “Audit Committee Report,” “Corporate Governance Matters-Board Leadership Structure and Committees-Audit Committee Financial Expert,” “Corporate Governance Matters-Identification and Selection of Nominees for Directors,” “Corporate Governance Matters-Board of Directors and Committee Meetings” and “Executive Officers” in UDR, Inc.’s definitive proxy statement (our “definitive proxy statement”) for its [removed: 2020] [added: 2021] Annual Meeting of Stockholders.
Information regarding our codes is available on our website, _www.udr.com_, and is incorporated by reference to the information set forth under the heading “Corporate Governance Matters” in our definitive proxy statement for UDR’s [removed: 2020] [added: 2021] Annual Meeting of Stockholders.
Item 11. EXECUTIVE COMPENSATION
1 rewritten, 0 added, 0 removed, 1 unchanged
The information required by this item is incorporated by reference to the information set forth under the headings “Security Ownership of Certain Beneficial Owners and Management,” “Corporate Governance Matters-Board Leadership Structure and Committees-Compensation Committee Interlocks and Insider Participation,” “Executive Compensation,” “Compensation of Directors” and “Executive Compensation-Compensation Committee Report” in the definitive proxy statement for UDR’s [removed: 2020] [added: 2021] Annual Meeting of Stockholders.
Item 12. SECURITY OWNERSHIP OF CERTAIN BENEFICIAL OWNERS AND MANAGEMENT AND RELATED STOCKHOLDER MATTERS
1 rewritten, 0 added, 0 removed, 1 unchanged
The information required by this item is incorporated by reference to the information set forth under the headings “Security Ownership of Certain Beneficial Owners and Management,” “Executive Compensation” and “Executive Compensation-Equity Compensation Plan Information” in the definitive proxy statement for UDR’s [removed: 2020] [added: 2021] Annual Meeting of Stockholders.
Item 13. CERTAIN RELATIONSHIPS AND RELATED TRANSACTIONS, AND DIRECTOR INDEPENDENCE
1 rewritten, 0 added, 0 removed, 2 unchanged
The information required by this item is incorporated by reference to the information set forth under the heading “Security Ownership of Certain Beneficial Owners and Management,” “Corporate Governance Matters-Corporate Governance Overview,” “Corporate Governance Matters-Director Independence,” “Corporate Governance Matters-Board Leadership Structure and Committees-Independence of the Audit, Compensation, Governance and Nominating Committees,” and “Executive Compensation” in the definitive proxy statement for UDR’s [removed: 2020] [added: 2021] Annual Meeting of Stockholders.
Item 14. PRINCIPAL ACCOUNTANT FEES AND SERVICES
1 rewritten, 0 added, 0 removed, 2 unchanged
The information required by this item is incorporated by reference to the information set forth under the headings “Audit Matters-Audit Fees” and “Audit Matters-Pre-Approval Policies and Procedures” in the definitive proxy statement for UDR’s [removed: 2020] [added: 2021] Annual Meeting of Stockholders.
Item 15. EXHIBITS, FINANCIAL STATEMENT SCHEDULES
26 rewritten, 19 added, 0 removed, 179 unchanged
| [removed: 4.14] [added: 4.15] | | [UDR, Inc. [removed: 3.75%] [added: 2.950%] Medium-Term Note, Series A due [removed: October 2024,] [added: September 2026,] issued [removed: June 26, 2014.](http://www.sec.gov/Archives/edgar/data/74208/000007420814000019/exhibit41.htm)] [added: August 23, 2016.](http://www.sec.gov/Archives/edgar/data/74208/000007420816000212/exhibit41-mtnofferingx9x30.htm)] | | Exhibit 4.1 to UDR, Inc.’s Quarterly Report on Form 10-Q for the quarter ended [removed: June] [added: September] 30, [removed: 2014.] [added: 2016.] |
| [removed: 4.15] [added: 4.14] | | [UDR, Inc. 4.00% Medium-Term Note, Series A due October 2025, issued September 22, 2015.](http://www.sec.gov/Archives/edgar/data/74208/000007420816000140/exhibit423-12312015.htm) | | Exhibit 4.23 to UDR, Inc.’s Annual Report on Form 10-K for the year ended December 31, 2015. |
| [removed: 4.16] [added: 4.20] | [removed: ] | [UDR, Inc. [removed: 2.950%] [added: 3.000%] Medium-Term Note, Series A due [removed: September 2026,] [added: August 2031,] issued August [removed: 23, 2016.](http://www.sec.gov/Archives/edgar/data/74208/000007420816000212/exhibit41-mtnofferingx9x30.htm)] [added: 15, 2019](http://www.sec.gov/Archives/edgar/data/74208/000007420819000092/udr-20190930ex423c33996.htm).] | | Exhibit [removed: 4.1] [added: 4.2] to UDR, [removed: Inc.’s] [added: Inc’s] Quarterly Report on Form 10-Q for the quarter ended September 30, [removed: 2016.] [added: 2019.] |
| [removed: 4.17] [added: 4.16] | | [UDR, Inc. 3.500% Medium-Term Note, Series A due July 2027, issued June 16, 2017.](http://www.sec.gov/Archives/edgar/data/74208/000007420817000086/c208-20170630ex102626761.htm) | | Exhibit 10.2 to UDR, Inc.’s Quarterly Report on Form 10-Q for the quarter ended June 30, 2017. |
| [removed: 4.18] [added: 4.17] | | [UDR, Inc. 3.500% Medium-Term Note, Series A due January 2028, issued December 13, 2017](http://www.sec.gov/Archives/edgar/data/74208/000007420818000024/c208-20171231ex4218ef02b.htm). | | Exhibit 4.21 to UDR, Inc.’s Annual Report on Form 10-K for the year ended December 31, 2017. |
| [removed: 4.19] [added: 4.18] | | [UDR, Inc. 4.400% Medium-Term Note, Series A due January 2029, issued October 26, 2018](http://www.sec.gov/Archives/edgar/data/74208/000007420819000028/c208-20181231ex421c8318a.htm). | | Exhibit 4.21 to UDR, Inc’s Annual Report on Form 10-K for the year ended December 31, 2018. |
| [removed: 4.20] [added: 4.19] | | [UDR, Inc. 3.200% Medium-Term Note, Series A due January 2030, issued July 2, 2019](http://www.sec.gov/Archives/edgar/data/74208/000007420819000092/udr-20190930ex4120fa2a8.htm). | | Exhibit 4.1 to UDR, Inc’s Quarterly Report on Form 10-Q for the quarter ended September 30, 2019. |
| [removed: 4.21] [added: 4.25] | | [UDR, Inc. [removed: 3.000%] [added: 2.100%] Medium-Term Note, Series A due August [removed: 2031,] [added: 2032,] issued [removed: August 15, 2019](http://www.sec.gov/Archives/edgar/data/74208/000007420819000092/udr-20190930ex423c33996.htm).] [added: July 21, 2020](https://www.sec.gov/Archives/edgar/data/74208/000007420820000094/udr-20200930ex419bf3384.htm).] | | Exhibit [removed: 4.2] [added: 4.1] to UDR, [removed: Inc’s] [added: Inc.’s] Quarterly Report on Form 10-Q for the [removed: quarter] [added: Quarter] ended September 30, [removed: 2019.] [added: 2020.] |
| [removed: 4.22] [added: 4.21] | | [UDR, Inc. 3.100% Medium-Term Note, Series A due November 2034, issued October 11, 2019](https://www.sec.gov/Archives/edgar/data/74208/000007420820000031/udr-20191231ex422d0fba5.htm). | | [removed: Filed herewith.] [added: Exhibit 4.22 to UDR, Inc.’s Annual Report on Form 10-K for the year ended December 31, 2019.] |
| [removed: 4.23] [added: 4.22] | | [UDR, Inc. 3.200% Medium-Term Note, Series A due January 2030, issued October 11, 2019](https://www.sec.gov/Archives/edgar/data/74208/000007420820000031/udr-20191231ex423124175.htm). | | [removed: Filed herewith.] [added: Exhibit 4.23 to UDR, Inc.’s Annual Report on Form 10-K for the year ended December 31, 2019.] |
| [removed: 4.24] [added: 4.23] | | [Description of UDR, Inc’s Securities](https://www.sec.gov/Archives/edgar/data/74208/000007420820000031/udr-20191231ex4249bf316.htm). | | [removed: Filed herewith.] [added: Exhibit 4.24 to UDR, Inc.’s Annual Report on Form 10-K for the year ended December 31, 2019.] |
| 10.02* | | [Form of UDR, Inc. Restricted Stock Award Agreement under the 1999 Long-Term Incentive Plan](https://www.sec.gov/Archives/edgar/data/74208/000007420820000031/udr-20191231ex10024c1de.htm). | | [removed: Filed herewith.] [added: Exhibit 10.2 to UDR, Inc.’s Annual Report on Form 10-K for the year ended December 31, 2019.] |
| [removed: 10.16*] [added: 10.22] | [added: ] | [removed: [Notice of Class 2] [added: [Class 1 Performance] LTIP Unit [removed: Award](https://www.sec.gov/Archives/edgar/data/74208/000007420820000031/udr-20191231ex1016e4b53.htm).] [added: Award Agreement](https://www.sec.gov/Archives/edgar/data/74208/000007420821000025/udr-20201231ex102275133.htm).] | | Filed herewith. |
| 10.17* | | [Notice of Restricted Stock Unit Award](https://www.sec.gov/Archives/edgar/data/74208/000007420820000031/udr-20191231ex10175ea73.htm). | | [removed: Filed herewith.] [added: Exhibit 10.17 to UDR, Inc.’s Annual Report on Form 10-K for the year ended December 31, 2019.] |
| 21 | | [Subsidiaries of UDR, Inc. and United Dominion Realty, [removed: L.P.](https://www.sec.gov/Archives/edgar/data/74208/000007420820000031/udr-20191231ex214ded164.htm)] [added: L.P.](https://www.sec.gov/Archives/edgar/data/74208/000007420821000025/udr-20201231ex21ea607be.htm)] | | Filed herewith. |
| 23.1 | | [Consent of Independent Registered Public Accounting Firm for UDR, [removed: Inc.](https://www.sec.gov/Archives/edgar/data/74208/000007420820000031/udr-20191231ex2314421d3.htm)] [added: Inc.](https://www.sec.gov/Archives/edgar/data/74208/000007420821000025/udr-20201231ex231501d59.htm)] | | Filed herewith. |
| 23.2 | | [Consent of Independent Registered Public Accounting Firm for United Dominion Realty, [removed: L.P.](https://www.sec.gov/Archives/edgar/data/74208/000007420820000031/udr-20191231ex2329467aa.htm)] [added: L.P.](https://www.sec.gov/Archives/edgar/data/74208/000007420821000025/udr-20201231ex232ab1e4d.htm)] | | Filed herewith. |
| 31.1 | | [Rule 13a-14(a) Certification of the Chief Executive Officer of UDR, [removed: Inc.](https://www.sec.gov/Archives/edgar/data/74208/000007420820000031/udr-20191231ex3113a17ad.htm)] [added: Inc.](https://www.sec.gov/Archives/edgar/data/74208/000007420821000025/udr-20201231ex31128ac65.htm)] | | Filed herewith. |
| 31.2 | | [Rule 13a-14(a) Certification of the Chief Financial Officer of UDR, [removed: Inc.](https://www.sec.gov/Archives/edgar/data/74208/000007420820000031/udr-20191231ex31210d2d1.htm)] [added: Inc.](https://www.sec.gov/Archives/edgar/data/74208/000007420821000025/udr-20201231ex312c4f751.htm)] | | Filed herewith. |
| 31.3 | | [Rule 13a-14(a) Certification of the Chief Executive Officer of United Dominion Realty, [removed: L.P.](https://www.sec.gov/Archives/edgar/data/74208/000007420820000031/udr-20191231ex3133272b7.htm)] [added: L.P.](https://www.sec.gov/Archives/edgar/data/74208/000007420821000025/udr-20201231ex3133dcd28.htm)] | | Filed herewith. |
| 31.4 | | [Rule 13a-14(a) Certification of the Chief Financial Officer of United Dominion Realty, [removed: L.P.](https://www.sec.gov/Archives/edgar/data/74208/000007420820000031/udr-20191231ex3141a052f.htm)] [added: L.P.](https://www.sec.gov/Archives/edgar/data/74208/000007420821000025/udr-20201231ex3141ac51e.htm)] | | Filed herewith. |
| 32.1 | | [Section 1350 Certification of the Chief Executive Officer of UDR, [removed: Inc.](https://www.sec.gov/Archives/edgar/data/74208/000007420820000031/udr-20191231ex3217377be.htm)] [added: Inc.](https://www.sec.gov/Archives/edgar/data/74208/000007420821000025/udr-20201231ex321a4c4e7.htm)] | | Filed herewith. |
| 32.2 | | [Section 1350 Certification of the Chief Financial Officer of UDR, [removed: Inc.](https://www.sec.gov/Archives/edgar/data/74208/000007420820000031/udr-20191231ex322ad94e8.htm)] [added: Inc.](https://www.sec.gov/Archives/edgar/data/74208/000007420821000025/udr-20201231ex322d15d5d.htm)] | | Filed herewith. |
| 32.3 | | [Section 1350 Certification of the Chief Executive Officer of United Dominion Realty, [removed: L.P.](https://www.sec.gov/Archives/edgar/data/74208/000007420820000031/udr-20191231ex3235d52be.htm)] [added: L.P.](https://www.sec.gov/Archives/edgar/data/74208/000007420821000025/udr-20201231ex323f817f3.htm)] | | Filed herewith. |
| 32.4 | | [Section 1350 Certification of the Chief Financial Officer of United Dominion Realty, [removed: L.P.](https://www.sec.gov/Archives/edgar/data/74208/000007420820000031/udr-20191231ex3244c428e.htm)] [added: L.P.](https://www.sec.gov/Archives/edgar/data/74208/000007420821000025/udr-20201231ex324277067.htm)] | | Filed herewith. |
| 101 | | Inline XBRL (Extensible Business Reporting Language). The following materials from this Annual Report on Form 10-K for the period ended December 31, [removed: 2019,] [added: 2020,] formatted in Inline XBRL: (i) consolidated balance sheets of UDR, Inc., (ii) consolidated statements of operations of UDR, Inc., (iii) consolidated statements of comprehensive income/(loss) of UDR, Inc., (iv) consolidated statements of changes in equity of UDR, Inc., (v) consolidated statements of cash flows of UDR, Inc., (vi) notes to consolidated financial statements of UDR, Inc., (vii) consolidated balance sheets of United Dominion Realty, L.P., (viii) consolidated statements of operations of United Dominion Realty, L.P., (ix) consolidated statements of comprehensive income/(loss) of United Dominion Realty, L.P.; (x) consolidated statements of changes in capital of United Dominion Realty, L.P., (xi) consolidated statements of cash flows of United Dominion Realty, L.P. and (xii) notes to consolidated financial statements of United Dominion Realty, L.P. The instance document does not appear in the interactive data file because its XBRL tags are embedded within the Inline XBRL document. | | Filed herewith. |
| 3.19 | | [Eleventh Amendment to the Amended and Restated Agreement of Limited Partnership of United Dominion Realty, L.P., dated as of December 16, 2020](https://www.sec.gov/Archives/edgar/data/74208/000007420820000105/udr-20201216ex101f47733.htm). | | Exhibit 10.1 to UDR, Inc.’s Current Report on Form 8-K dated and filed with the Commission on December 16, 2020. |
| 4.24 | | [UDR, Inc. 3.200% Medium-Term Note, Series A due January 2030, issued February 28, 2020](https://www.sec.gov/Archives/edgar/data/74208/000007420820000056/udr-20200331ex410efb5ce.htm). | | Exhibit 4.1 to UDR, Inc.’s Quarterly Report on Form 10-Q for the Quarter ended March 31, 2020. |
| 4.26 | | [UDR, Inc. 1.900% Medium-Term Note, Series A due March 2033, issued December 14, 2020](https://www.sec.gov/Archives/edgar/data/74208/000007420821000025/udr-20201231ex426267700.htm). | | Filed herewith. |
| 10.16* | | [Notice of Class 2 LTIP Unit Award](https://www.sec.gov/Archives/edgar/data/74208/000007420820000031/udr-20191231ex1016e4b53.htm). | | Exhibit 10.16 to UDR, Inc.’s Annual Report on Form 10-K for the year ended December 31, 2019. |
| 10.20 | | [Letter Agreement, between UDR, Inc. and Jerry A. Davis (including the related release agreement and Consulting Agreement as exhibits thereto), dated December 16, 2020](https://www.sec.gov/Archives/edgar/data/74208/000007420820000105/udr-20201216ex10296423f.htm). | | Exhibit 10.2 to UDR Inc.’s Current Report on Form 8-K dated and filed with the Commission on December 16, 2020. |
| | | | | |
| 10.21 | | [Amendment No. 3, dated May 7, 2020, to the Third Amended and Restated Distribution Agreement, dated September 1, 2011 and as amended July 29, 2014 and April 27, 2017](https://www.sec.gov/Archives/edgar/data/74208/000007420820000058/udr-20200507ex12a72b2b0.htm). | | Exhibit 1.2 to UDR, Inc.’s Current Report on Form 8-K dated and filed with the Commission on May 7, 2020. |
| | | | | |
| | | | | |
| 10.23 | | [Class 2 Performance LTIP Unit Award Agreement](https://www.sec.gov/Archives/edgar/data/74208/000007420821000025/udr-20201231ex1023e2e7b.htm). | | Filed herewith. |
| | | | | |
| 10.24 | | [Class 2 Performance LTIP Unit Award Agreement, STI](https://www.sec.gov/Archives/edgar/data/74208/000007420821000025/udr-20201231ex1024d4ea2.htm). | | Filed herewith. |
| | | | | |
| | | | | |
| --- | --- | --- | --- | --- |
| Exhibit | | Description | | Location |
| | | | | |
| | | | | |
| | | | | |
Item 16. FORM 10-K SUMMARY
1,114 rewritten, 651 added, 446 removed, 1,841 unchanged
| Date: February 18, [removed: 2020] [added: 2021] | By: | /s/ Thomas W. Toomey |
Pursuant to the requirements of the Securities Exchange Act of 1934, this Report has been signed below on February 18, [removed: 2020] [added: 2021] by the following persons on behalf of the registrant and in the capacities indicated.
| [added: Senior] Vice President – Chief Accounting Officer | | Director |
| [added: Senior] Vice President – Chief Accounting Officer of the General Partner | | Director of the General Partner |
| [Consolidated Balance Sheets at December 31, [removed: 2019] [added: 2020] and [removed: 2018](#BALANCESHEETS_439565)] [added: 2019](#BALANCESHEETS_439565)] | [removed: F-5] [added: F-6] |
| [Consolidated Statements of Operations for the years ended December 31, [added: 2020,] 2019, [removed: 2018,] and [removed: 2017](#STATEMENTSOFOPERATIONS_417018)] [added: 2018](#STATEMENTSOFOPERATIONS_417018)] | [removed: F-6] [added: F-7] |
| [Consolidated Statements of Comprehensive Income/(Loss) for the years ended December 31, [added: 2020,] 2019, [removed: 2018,] and [removed: 2017](#COMPREHENSIVEINCOMELOSS_987542)] [added: 2018](#COMPREHENSIVEINCOMELOSS_987542)] | [removed: F-7] [added: F-8] |
| [Consolidated Statements of Changes in Equity for the years ended December 31, [added: 2020,] 2019, [removed: 2018,] and [removed: 2017](#CHANGESINEQUITY_994858)] [added: 2018](#CHANGESINEQUITY_994858)] | [removed: F-8] [added: F-9] |
| [Consolidated Statements of Cash Flows for the years ended December 31, [added: 2020,] 2019, [removed: 2018,] and [removed: 2017](#CASHFLOWS_264688)] [added: 2018](#CASHFLOWS_264688)] | [removed: F-9] [added: F-10] |
| [Notes to Consolidated Financial Statements](#a1CONSOLIDATIONANDBASISOFPRESENTATION_86) | [removed: F-11] [added: F-12] |
| [Report of Independent Registered Public Accounting Firm](#LPREPORTOFINDEPENDENTEY) | [removed: F-61] [added: F-58] |
| [Consolidated Balance Sheets at December 31, [removed: 2019] [added: 2020] and [removed: 2018](#LP_BalanceSheet)] [added: 2019](#LP_BalanceSheet)] | [removed: F-62] [added: F-61] |
| [Consolidated Statements of Operations for the years ended December 31, [added: 2020,] 2019, [removed: 2018,] and [removed: 2017](#LP_StatementOfOperation)] [added: 2018](#LP_StatementOfOperation)] | [removed: F-63] [added: F-62] |
| [Consolidated Statements of Comprehensive Income/(Loss) for the years ended December 31, [added: 2020,] 2019, [removed: 2018,] and [removed: 2017](#LP_ComprehensiveIncome)] [added: 2018](#LP_ComprehensiveIncome)] | [removed: F-64] [added: F-63] |
| [Consolidated Statements of Changes in Capital for the years ended December 31, [added: 2020,] 2019, [removed: 2018,] and [removed: 2017](#LP_ChangesInCapital)] [added: 2018](#LP_ChangesInCapital)] | [removed: F-65] [added: F-64] |
| [Consolidated Statements of Cash Flows for the years ended December 31, [added: 2020,] 2019, [removed: 2018,] and [removed: 2017](#LP_CashFlow)] [added: 2018](#LP_CashFlow)] | [removed: F-66] [added: F-65] |
| [Notes to Consolidated Financial Statements](#LP_CONSOLIDATANDBASISOFPRESENT) | [removed: F-67] [added: F-66] |
To the Stockholders and [added: the] Board of Directors of UDR, Inc.
We have audited the accompanying consolidated balance sheets of UDR, Inc. (the [removed: “Company”)] [added: Company)] as of December 31, [removed: 2019] [added: 2020] and [removed: 2018,] [added: 2019,] the related consolidated statements of operations, comprehensive income/(loss), changes in [removed: equity,] [added: equity] and cash flows for each of the three years in the period ended December 31, [removed: 2019,] [added: 2020,] and the related notes and the financial statement schedule listed in the accompanying Index at Item 15(a) (collectively referred to as the “consolidated financial statements”).
In our opinion, the consolidated financial statements present fairly, in all material respects, the financial position of the Company at December 31, [removed: 2019] [added: 2020] and [removed: 2018,] [added: 2019,] and the results of its operations and its cash flows for each of the three years in the period ended December 31, [removed: 2019,] [added: 2020,] in conformity with U.S. generally accepted accounting principles.
We also have audited, in accordance with the standards of the Public Company Accounting Oversight Board (United States) (PCAOB), the Company's internal control over financial reporting as of December 31, [removed: 2019,] [added: 2020,] based on criteria established in Internal Control-Integrated Framework issued by the Committee of Sponsoring Organizations of the Treadway Commission (2013 [removed: framework)] [added: framework),] and our report dated February 18, [removed: 2020] [added: 2021] expressed an unqualified opinion thereon.
Critical Audit [removed: Matter][added: Matters]
The critical audit [removed: matter] [added: matters] communicated below [removed: is a matter] [added: are matters] arising from the current period audit of the financial statements that [removed: was] [added: were] communicated or required to be communicated to the audit committee and that: (1) [removed: relates] [added: relate] to accounts or disclosures that are material to the financial statements and (2) involved our especially challenging, subjective or complex judgments.
The communication of [removed: the] critical audit [removed: matter] [added: matters] does not alter in any way our opinion on the consolidated financial statements, taken as a whole, and we are not, by communicating the critical audit [removed: matter] [added: matters] below, providing [removed: a] separate [removed: opinion] [added: opinions] on the critical audit [removed: matter] [added: matters] or on the accounts or disclosures to which [removed: it relates.][added: they relate.]
| [removed: **] | [removed: |] Accounting for acquisitions of real estate investment properties |
| _Description of the Matter_ | [removed: |] During [removed: 2019,] [added: 2020,] the Company acquired [removed: multiple] real estate investment properties, including [removed: certain] [added: one] real estate investment [removed: properties] [added: property] for which the Company held a previous unconsolidated equity interest. These transactions were accounted for as asset acquisitions. The aggregate increase in real estate [added: and other assets] due to these acquisitions was approximately [removed: $2.2 billion.] [added: $422.0 million.] As more fully described in Note 3 to the consolidated financial statements, the total consideration was allocated to land, land improvements, buildings and improvements, and real estate intangible assets based on their relative fair value. [added: Auditing the Company’s acquisition of real estate investment properties is complex and requires a higher degree of auditor judgment due to the significant assumptions that are utilized in the determination of the relative fair values of the assets acquired. The significant assumptions used in management’s analysis to estimate the fair value of these components includes capitalization rates, market comparable prices for similar land parcels, market rental rates, leasing commission rates as well as the time it would take to lease any acquired buildings that were vacant at acquisition.] |
| [removed: |] [added: _Description of the Matter_] | [added: During 2020, the Partnership acquired real estate investment properties. These transactions were accounted for as asset acquisitions. The aggregate increase in real estate and other assets due to these acquisitions was approximately $251.1 million. As more fully described in Note 3 to the consolidated financial statements, the total consideration was allocated to land, land improvements, buildings and improvements, and real estate intangible assets based on their relative fair value.] Auditing the [removed: Company’s] [added: Partnership’s] acquisition of real estate investment properties is complex and requires a higher degree of auditor judgment due to the significant assumptions that are utilized in the determination of the relative fair values of the assets acquired. The significant assumptions used in management’s analysis to estimate the fair value of these components includes capitalization rates, market comparable prices for similar land parcels, market rental rates, leasing commission rates as well as the time it would take to lease any acquired buildings [removed: if it] [added: that] were vacant at acquisition. |
| _How We Addressed the Matter in Our Audit_ | [removed: |] We tested the Company’s internal controls over the acquisition of real estate investment properties and the resulting purchase price allocations. This included testing controls over management’s identification of the assets acquired and liabilities assumed and evaluating the methods and significant assumptions used by the Company to develop such estimates. Our testing of the fair values of the assets acquired included, among others, evaluating the selection of the Company's valuation model and testing the significant assumptions discussed above as well as the completeness and accuracy of the underlying data. For example, we compared management’s assumptions to observable market transactions and replacement costs associated with the fair value of the land and buildings and improvements. For in-place leases, we compared management’s assumptions to published market data for comparable leases, related leasing commissions and the amount of time it would take to lease up the space to stabilization assuming the space was vacant at acquisition. We involved our real estate valuation specialists to assist in evaluating the significant assumptions listed above. In addition, we performed sensitivity tests on the significant assumptions to evaluate the change in the fair value resulting from changes in the assumptions. [removed: ] |
We have audited UDR, Inc.’s internal control over financial reporting as of December 31, [removed: 2019,] [added: 2020,] based on criteria established in Internal [removed: Control—Integrated] [added: Control-Integrated] Framework issued by the Committee of Sponsoring Organizations of the Treadway Commission (2013 framework) (the COSO criteria).
In our opinion, UDR, Inc. (the Company) maintained, in all material respects, effective internal control over financial reporting as of December 31, [removed: 2019,] [added: 2020,] based on the COSO criteria.
We also have audited, in accordance with the standards of the Public Company Accounting Oversight Board (United States) (PCAOB), the consolidated balance sheets of the Company as of December 31, [removed: 2019] [added: 2020] and [removed: 2018,] [added: 2019,] and the related consolidated statements of operations, comprehensive income/(loss), changes in [removed: equity,] [added: equity] and cash flows for each of the three years in the period ended December 31, [removed: 2019,] [added: 2020,] and the related notes and [added: the] financial statement schedule listed in the [added: accompanying] Index at Item 15(a) and our report dated February 18, [removed: 2020] [added: 2021] expressed an unqualified opinion thereon.
| [removed: ] [added: ] | | [added: 2020 | | |] 2019 | | | 2018 | |
| Real estate held for investment | | $ | [removed: 12,532,324] [added: 12,706,940] | | $ | [removed: 10,196,159] [added: 12,532,324] |
| Less: accumulated depreciation | | | [removed: (4,131,330)] [added: (4,590,577)] | | | [removed: (3,654,160)] [added: (4,131,330)] |
| Real estate held for investment, net | | | [removed: 8,400,994] [added: 8,116,363] | | | [removed: 6,541,999] [added: 8,400,994] |
| Real estate under development (net of accumulated depreciation of [removed: $23] [added: $1,010] and [removed: $0,] [added: $23,] respectively) | | | [removed: 69,754] [added: 246,867] | | | [removed: —] [added: 69,754] |
| Total real estate owned, net of accumulated depreciation | | | [removed: 8,470,748] [added: 8,466,106] | | | [removed: 6,541,999] [added: 8,470,748] |
| Cash and cash equivalents | [removed: ] [added: ] | [added: $] | [removed: 8,106] [added: 1,409] | | [added: $] | [added: 8,106 | | $ |] 185,216 |
| Restricted cash | [added: |] | [added: 22,762] | [removed: 25,185] [added: ] | | [added: 25,185] | [added: | |] 23,675 |
| Notes receivable, net | | | [removed: 153,650] [added: 157,992] | | | [removed: 42,259] [added: 153,650] |
| | | /s/ Diane M. Morefield |
| | | Diane M. Morefield |
| | | Director |
| Date: February 18, 2021 | By: | /s/ Thomas W. Toomey |
Pursuant to the requirements of the Securities Exchange Act of 1934, this Report has been signed below on February 18, 2021 by the following persons on behalf of the registrant and in the capacities indicated.
| | | /s/ Diane M. Morefield |
| | | Diane M. Morefield |
| | | Director |
| | |
| | Indicators of Impairment of Real Estate Owned and Investment in Unconsolidated Joint Ventures |
| _Description of the Matter_ | At December 31, 2020, the Company’s real estate owned, net and investment in and advances to unconsolidated joint ventures, net were approximately $8.5 billion and $600.2 million, respectively. As more fully described in Note 2 to the consolidated financial statements, the Company periodically evaluates these assets for indicators of impairment, and this includes, among other things, judgments based on factors such as operational performance, market conditions, the Company’s intent and ability to hold each asset, as well as any significant cost overruns on development or redevelopment |
| | communities. During 2020, the Company did not recognize an impairment related to real estate owned, net or any other than temporary impairments related to its investment in unconsolidated joint ventures. Auditing the Company’s evaluation for indicators of impairment was complex due to a high degree of subjectivity in the identification of events or changes in circumstances that may indicate an impairment of its real estate owned or that the value of its investment in unconsolidated joint ventures may be other than temporarily impaired. Differences or changes in these judgments could have a material impact on the Company’s analysis. |
| _How We Addressed the Matter in Our Audit_ | We tested the Company’s internal controls over the asset impairment evaluation process. This included testing controls over management’s determination and review of the considerations used in the impairment indicator analysis. Our procedures with regards to the Company’s evaluation for indicators of impairment included, among others, testing the completeness and accuracy of management’s impairment analysis and evaluating management’s judgments determining whether indicators of impairment were present. For example, we performed inquires of management, considered historical operating results and the current market conditions, performed an independent assessment using both internally and externally available information, read the minutes of the meetings of the Board of Directors, and reviewed the Company’s development and redevelopment costs. |
February 18, 2021
February 18, 2021
| Real estate held for disposition (net of accumulated depreciation of $13,779 and $0, respectively) | | | 102,876 | | | — |
| Cash and cash equivalents | | | 1,409 | | | 8,106 |
| Restricted cash | | | 22,762 | | | 25,185 |
| Repurchase of common shares | | | | | | (6) | | | (19,789) | | | — | | | — | | | — | | | (19,795) |
| Balance at December 31, 2020 | | $ | 44,765 | | $ | 2,966 | | $ | 5,881,383 | | $ | (2,685,770) | | $ | (9,144) | | $ | 24,391 | | $ | 3,258,591 |
| Loss on extinguishment of debt, net | | | 49,190 | | | 29,594 | | | 3,299 |
| Other | | | 12,193 | | | 10,364 | | | 1,699 |
| Payment of prepayment and extinguishment costs | | | (62,645) | | | (27,782) | | | (3,178) |
| Other | | | (12,734) | | | (13,943) | | | (38,307) |
| Acquisition of intellectual property in exchange for cancellation of secured note receivable | | | 2,250 | | | — | | | |
| Recognition of allowance for credit losses | | | 2,182 | | | — | | | |
CONSOLIDATED STATEMENTS OF CASH FLOWS – (Continued)
(In thousands, except for share data)
Certain previously reported amounts have been reclassified to conform to the current financial statement presentation.
In August 2020, the Financial Accounting Standards Board (“FASB”) issued Accounting Standards Update (“ASU”) 2020-06, _Debt—Debt With Conversion and Other Options (Subtopic 470-20) and Derivatives and Hedging—Contracts in Entity’s Own Equity (Subtopic 815-40): Accounting for Convertible Instruments and Contracts in an Entity’s Own Equity_.
The ASU simplifies the accounting for certain financial instruments with characteristics of liabilities and equity, including convertible instruments and contracts on an entity’s own equity.
The updated standard will be effective for the Company on January 1, 2022; however, early adoption of the ASU is permitted on January 1, 2021.
In April 2020, the FASB issued a Staff Q&A on accounting for leases during the COVID-19 pandemic, focused on the application of lease guidance in ASC 842, _Leases_.
The Q&A states that some lease contracts may contain explicit or implicit enforceable rights and obligations that require lease concessions if certain circumstances arise that are beyond the control of the parties to the contract.
Therefore, entities would need to perform a lease-by-lease analysis to determine
DECEMBER 31, 2020
whether contractual provisions in an existing lease agreement provide enforceable rights and obligations related to lease concessions.
The FASB determined it would be acceptable for entities to not perform a lease-by-lease analysis regarding rent concessions resulting from COVID-19, and to instead make a policy election regarding rent concessions, which would give entities the option to account or not to account for these rent concessions as lease modifications if the total payments required by the modified contract are substantially the same or less than the total payments required by the original contract.
Entities making the election to account for these rent concessions as lease modifications would recognize the effects of rent abatements and rent deferrals on a prospective straight-line basis over the remainder of the modified contract.
We have made the election to not perform a lease-by-lease analysis to determine whether contractual provisions in an existing lease agreement provide enforceable rights and obligations related to lease concessions.
| | | |
| --- | --- | --- |
| | | |

February 18, 2020
UDR, INC.
| | | | | | | | | | |
| --- | --- | --- | --- | --- | --- | --- | --- | --- | --- |
| | | | | | | | | | | | | | | | | | | | | | |
| --- | --- | --- | --- | --- | --- | --- | --- | --- | --- | --- | --- | --- | --- | --- | --- | --- | --- | --- | --- | --- | --- |
| Balance at December 31, 2016 | | $ | 46,458 | | $ | 2,673 | | $ | 4,635,413 | | $ | (1,585,825) | | $ | (5,609) | | $ | 3,860 | | $ | 3,096,970 |
| Other | | | 39,958 | | | 4,998 | | | 20,467 |
| Other | | | (41,725) | | | (41,485) | | | (21,361) |
DECEMBER 31, 2019
| Restricted cash | | | 23,675 | | | 19,792 | | | 19,994 |
While we are currently evaluating the impact ASU 2016-13 will have on our consolidated financial statements and related disclosures, we expect that the adoption will result in recording an allowance for credit losses for our notes receivable.
However, we do not expect the updated standard to have a material impact on the consolidated financial statements.
In February 2016, the FASB issued ASU 2016-02, _Leases_.
The standard amended the existing lease accounting guidance and required lessees to recognize a lease liability and a right-of-use asset for all leases on their balance sheets.
Lessees of operating leases continued to recognize lease expense in a manner similar to previous accounting.
For lessors, accounting for leases under the new guidance was substantially the same as in prior periods, but eliminated current real estate-specific provisions and changed the treatment of initial direct costs.
The standard was effective for the Company on January 1, 2019.
The Company elected the following package of practical expedients provided by the standard: (i) an entity need not reassess whether any expired or existing contract is a lease or contains a lease, (ii) an entity need not reassess the lease classification of any expired or existing leases, and (iii) an entity need not reassess initial direct costs for any existing leases.
Upon adoption of the standard on January 1, 2019, the Company recognized right-of-use assets of $94.3 million and lease liabilities of $88.3 million.
The right-of-use assets included $6.0 million of prepaid rent and intangible assets that was included within _Other assets_ on our Consolidated Balance Sheets as of December 31, 2018.
The lease liabilities represent the present value of the remaining minimum lease payments as of January 1, 2019 and primarily relate to ground leases for communities where we are the lessee.
The right-of-use assets represent our right to use an underlying asset for the lease term, which are calculated utilizing the lease liabilities plus any prepaid lease payments and intangible assets for ground leases acquired in the purchase of real estate.
Our right-of-use assets and related lease liabilities recognized as of January 1, 2019 may change as a result of updates to the projected future minimum lease payments.
Certain of our ground lease agreements where we are the lessee have future minimum lease payments that reset in the future based upon a percentage of the fair market value of the land at the time of the reset.
The Company will continue to recognize lease expense for these leases in a manner similar to previous accounting based on our election of the package of practical expedients.
However, in the event we modify existing ground leases and/or enter into new ground leases subsequent to the adoption of the standard, such leases would likely be classified as finance leases under the standard and require expense recognition based on the effective interest method.
Under the standard, initial direct costs for both lessees and lessors will include only those costs that are incremental to the arrangement and would not have been incurred if the lease had not been obtained.
As a result, subsequent to the adoption of the standard, we are expensing non-incremental leasing costs as incurred.
In July 2018, the FASB issued ASU 2018-11, _Leases – Targeted Improvements_, which provided entities with relief from the costs of implementing certain aspects of ASU 2016-02, _Leases_.
The Company elected the practical expedient to account for lease and non-lease components as a single component in lease contracts where we are the lessor.
The ASU also provided a transition option that permitted entities to not recast the comparative periods presented when transitioning to the standard, which the Company also elected.
associated with our portfolio is the value of existing lease agreements.
| | | | | | | | | |
| --- | --- | --- | --- | --- | --- | --- | --- | --- |
| Note due March 2020 (b) | | 12.00 | % | | 20,000 | | | 20,000 |
An excerpt. Shown here: 40 of 1,114 rewritten, 40 of 651 added and 40 of 446 removed. The counts are complete. For every sentence, read Item 16. FORM 10-K SUMMARY in the FY2020 filing and the FY2019 filing.