 filings.tools
Item 5. Market for Registrant’s Common Equity, Related Stockholder Matters and Issuer Purchases of Equity Securities
6K characters. Original on sec.gov · Markdown
Item 5. Market for Registrant’s Common Equity, Related Stockholder Matters and Issuer Purchases of Equity Securities
| --- | --- |
Our Class B Common Stock is traded on the New York Stock Exchange under the symbol UHS. Shares of our Class A, Class C and Class D Common Stock are not traded in any public market, but are each convertible into shares of our Class B Common Stock on a share-for-share basis.
The number of stockholders of record as of January 31, 2022, were as follows:
| Class A Common | 17 | |||
|---|---|---|---|---|
| Class B Common | 814 | |||
| Class C Common | 1 | |||
| Class D Common | 90 |
Stock Repurchase Programs
On February 24, 2022, our Board of Directors authorized a $1.4 billion increase to our stock repurchase program. Pursuant to this program, shares of our Class B Common Stock may be repurchased, from time to time as conditions allow, on the open market or in negotiated private transactions. There is no expiration date for our stock repurchase programs.
As reflected below, during the fourth quarter of 2021, pursuant to previous share repurchase authorizations, including a $1.0 billion increase to the program approved by our Board of Directors in July, 2021, we have repurchased approximately 3.43 million shares at an aggregate cost of approximately $432.3 million. For the year ended December 31, 2021, we have repurchased approximately 8.41 million shares at an aggregate cost of approximately $1.201 billion. As of December 31, 2021, prior to the above-mentioned increased authorization approved in February, 2022, we had an aggregate available repurchase authorization of $358.2 million.
During the period of October 1, 2021 through December 31, 2021, we repurchased the following shares:
| Additional Dollars Authorized For Repurchase (in thousands) | Total number of shares purchased (1) | Total number of shares cancelled | Average price paid per share for forfeited restricted shares | Total Number of shares purchased as part of publicly announced programs (2) | Average price paid per share for shares purchased as part of publicly announced program | Aggregate purchase price paid (in thousands) | Maximum number of dollars that may yet be purchased under the program (in thousands) | |||||||||||||||||||||||||
|---|---|---|---|---|---|---|---|---|---|---|---|---|---|---|---|---|---|---|---|---|---|---|---|---|---|---|---|---|---|---|---|---|
| October, 2021 | — | 29 | 731 | $ | 0.01 | — | $ | — | $ | — | $ | 790,495 | ||||||||||||||||||||
| November, 2021 | — | 2,222,037 | 1,206 | $ | 0.01 | 2,221,796 | $ | 126.53 | $ | 281,125 | $ | 509,370 | ||||||||||||||||||||
| December, 2021 | — | 1,203,913 | 1,301 | $ | 0.01 | 1,203,595 | $ | 125.57 | $ | 151,137 | $ | 358,233 | ||||||||||||||||||||
| Total October through December | $ | - | 3,425,979 | 3,238 | $ | 0.01 | 3,425,391 | $ | 126.19 | $ | 432,262 |
| (1) | During the three-month period ended December 31, 2021, 588 shares were repurchased in connection with income tax withholding obligations resulting from the exercise of stock options and the vesting of restricted stock grants. |
|---|
| (2) | The only publicly announced program pursuant to which the shares were repurchased was the share repurchase program described above. There is no other plan or program that has expired during this time period. Also, there is no other plan or program that we have determined to terminate prior to expiration, or under which we do not intend to make further purchases. |
|---|
Dividends
Our Board of Directors approved the resumption of quarterly dividend payments of $0.20 per share beginning in the first quarter of 2021 (after being temporarily suspended during 2020 as part of various COVID-19 initiatives). During the year ended December 31, 2021 we paid dividends of $0.80 per share. Dividend equivalents are accrued on unvested restricted stock units and are paid upon vesting of the restricted stock unit.
Our Credit Agreement contains covenants that include limitations on, among other things, dividends and stock repurchases (see below in Capital Resources-Credit Facilities and Outstanding Debt Securities).
Equity Compensation
Refer to Item 12. Security Ownership of Certain Beneficial Owners and Management and Related Stockholder Matters, of this report for information regarding securities authorized for issuance under our equity compensation plans.
Stock Price Performance Graph
The following graph compares the cumulative total stockholder return on our common stock with the cumulative total return on the stock included in the Standard & Poor’s 500 Index and a Peer Group Index during the five-year period ended December 31, 2021. The graph assumes an investment of $100 made in our common stock and each Index as of January 1, 2017 and has been weighted based on market capitalization. Note that our common stock price performance shown below should not be viewed as being indicative of future performance.
Companies in the peer group, which consist of companies in the S&P 500 Index or S&P MidCap 400 Index are as follows: Acadia Healthcare Company, Inc., Community Health Systems, Inc., HCA Healthcare, Inc., LifePoint Health, Inc. (included until November, 2018, when it was acquired by Apollo Management) and Tenet Healthcare Corporation.
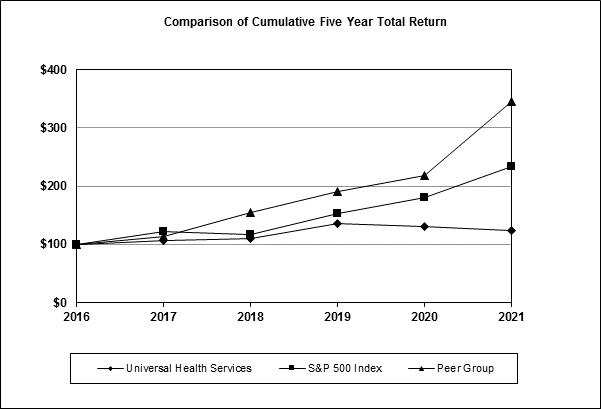
| Company Name / Index | 2016 Base | 2017 | 2018 | 2019 | 2020 | 2021 | ||||||||||||||||||
|---|---|---|---|---|---|---|---|---|---|---|---|---|---|---|---|---|---|---|---|---|---|---|---|---|
| Universal Health Services, Inc. | $ | 100.00 | $ | 106.93 | $ | 110.31 | $ | 136.36 | $ | 130.90 | $ | 124.14 | ||||||||||||
| S&P 500 Index | $ | 100.00 | $ | 121.83 | $ | 116.49 | $ | 153.17 | $ | 181.35 | $ | 233.41 | ||||||||||||
| Peer Group | $ | 100.00 | $ | 113.54 | $ | 154.00 | $ | 191.48 | $ | 218.39 | $ | 345.88 |
Previous: Item 4. Mine Safety Disclosures · Next: Item 6. [RESERVED]