 filings.tools
Ulta Beauty (ULTA) 10-K risk factor changes: FY2011 vs FY2010
The 2011-01-29 10-K against the 2010-01-30 one, compared heading by heading and sentence by sentence. One of these filings carries no fiscal year tag, so its year is the calendar year of the period end.
Item 1A31 rewritten23 added10 removed249 unchanged
All filing items539 rewritten390 added417 removed1,412 unchanged
Summary
counted, not written
- Item 1A lists 28 risk factor headings: 0 new, 4 reworded and 24 unchanged since FY2010. 0 headings from FY2010 no longer appear.
- Sentence by sentence, 390 added, 417 removed, 539 rewritten and 1,412 unchanged across 19 items that differ.
New Item 1A headings (0)
No risk factor heading in this filing is absent from FY2010.
Removed Item 1A headings (0)
Every FY2010 risk factor heading is still here, word for word or reworded.
Reworded Item 1A headings (4)
- _The recent global economic crisis and
[removed: continued]volatility in global economic conditions and the financial markets as well as[removed: prolonged]declines in consumer spending may adversely affect our liquidity and financial condition._ [removed: _A further downturn in the economy][added: _Continued economic uncertainty] may affect consumer purchases of discretionary beauty products and salon services, which could delay our growth strategy and have a material adverse effect on our business, financial condition, profitability and cash flows._- _We
[removed: will][added: may] need to raise additional funds to pursue our growth strategy, and we may be unable to raise capital when needed, which could have a material adverse effect on our business, financial condition and results of operations._ - _Our current principal
[removed: stockholders have][added: stockholder has] significant influence over us and they could delay, deter, or prevent a change of control or other business combination or otherwise cause us to take action with which you might not agree._
A heading is new when no FY2010 heading matches it after ignoring case and punctuation, and reworded when it shares at least 60 percent of its words with one that went away. All current risk factor headings.
Sentences by item
21 items, with every count and a link to each item that changed
Underlined words on a shaded ground are new in FY2011; struck-through words were in FY2010. Sentences that are wholly new or wholly gone are labelled rather than marked.
Item 1A. Risk Factors
31 rewritten, 23 added, 10 removed, 249 unchanged
In these circumstances, the market price of our common stock could decline, and you may lose all or part of your [removed: investment.][added: investment._]
_The recent global economic crisis and [removed: continued] volatility in global economic conditions and the financial markets as well as [removed: prolonged] declines in consumer spending may adversely affect our liquidity and financial condition._
The global economic crisis and [removed: the continued] volatility and disruption to the capital and credit markets have had a significant, adverse impact on global economic conditions, resulting in [removed: additional significant] recessionary pressures and declines in consumer confidence and economic growth.
[removed: Such reduced] consumer spending could cause changes in customer order patterns and changes in the level of inventory purchased by our customers, [added: and may signify a reset of consumer spending habits, all of] which may adversely affect our industry, business and financial [removed: condition.][added: condition]
Economic conditions have also resulted in a [removed: substantial] tightening of the credit markets, including lending by financial institutions, which is a source of capital for our borrowing and liquidity.
It is difficult to predict how long the current economic and capital and credit market conditions will continue, the extent to which they will continue to [removed: deteriorate,] [added: recover,] if at all, and which aspects of our products or business may be adversely affected.
Current market and credit conditions could [added: continue to] make it more difficult for developers and landlords to obtain the necessary credit to build new retail centers.
Continued turbulence in the United States and international markets and economies and [removed: prolonged] declines in consumer spending may adversely affect our liquidity and financial condition, including our ability to refinance maturing liabilities and access the capital markets to meet liquidity needs.
[removed: _A further downturn in the economy] [added: _Continued economic uncertainty] may affect consumer purchases of discretionary beauty products and salon services, which could delay our growth strategy and have a material adverse effect on our business, financial condition, profitability and cash flows._
Concerns over inflation, energy costs, geopolitical issues, the availability and cost of credit, [added: and] the U.S. mortgage [removed: market] and [removed: a declining] real estate [removed: market in the U.S.] [added: markets] have contributed to [removed: increased] volatility and diminished expectations for the economy.
We believe the principal bases upon which we compete are the quality of merchandise, our value proposition, the quality of our customers’ shopping experience and the convenience of our stores as one-stop destinations for [removed: beauty products and salon services.]
During fiscal [removed: 2009,] [added: 2010,] we opened [removed: 37] [added: 47] new stores.
During fiscal [removed: 2009,] [added: 2010,] the average investment required to open a typical new store [removed: is] [added: was] approximately [removed: $1.1] [added: $0.9] million.
In order to support our recent and expected future growth and to maintain the efficient operation of our business, [removed: additional distribution centers may need] [added: we intend] to [removed: be added] [added: open a third distribution center] in [removed: the future.][added: fiscal 2012.]
During fiscal [removed: 2009,] [added: 2010,] merchandise supplied to Ulta by our top ten vendors accounted for approximately [removed: 46%] [added: 48%] of our net sales.
In addition, sanctions under [removed: the FDC Act] [added: various laws] may include seizure of products, injunctions against future shipment of products, restitution and disgorgement of profits, operating restrictions and criminal prosecution.
These events could interrupt the marketing and sale of our Ulta products, severely [added: damage our brand reputation and]
[removed: damage our brand reputation and] image in the marketplace, increase the cost of our products, cause us to fail to meet customer expectations or cause us to be unable to deliver merchandise in sufficient quantities or of sufficient quality to our stores, any of which could result in lost sales, which could have a material adverse effect on our business, financial condition and results of operations.
Our store leases generally require us to provide a certificate of occupancy with respect to the interior build-out of our stores (landlords generally provide the certificate of occupancy with respect to the shell of the store and the larger shopping area and common areas), and while we strive to remain in compliance with local building codes relating to the interior buildout of our stores, the constantly increasing number of local jurisdictions in which [added: we operate makes it increasingly difficult to stay abreast of changes in, and requirements of, local building codes and local building and fire inspectors’ interpretations of such building codes.]
As the number of local building codes and local building and fire inspectors to which we and our landlords are subject [added: to] increases, we may be increasingly vulnerable to increased construction costs and delays in store openings caused by our or our landlords’ compliance with local building codes and local building and fire inspectors’ interpretations of such building codes, which increased construction costs and/or delays in store openings could increase our store opening costs, cause us to incur lost sales and profits, and damage our public reputation.
As a result of intellectual property infringement claims, or to avoid potential claims, we may choose to seek, or be required to seek, a license from the third party and would most likely be required to pay license fees or [removed: royalties or both.]
[added: Some of our competitors] may be able to sustain the costs of such litigation or proceedings better than us because of their substantially greater financial resources.
We have a $200 million secured revolving credit facility, or credit facility, with a term expiring May [removed: 2011.][added: 2013.]
Outstanding borrowings bear interest at the prime rate or [removed: the Eurodollar rate] [added: Libor] plus [removed: 1.00% up to $100 million] [added: 2.00%] and [removed: 1.25% thereafter.][added: the unused line fee is 0.25%.]
These covenants, among other things, [removed: restrict] [added: limit] our ability to grant liens on our assets, incur additional indebtedness, pay cash dividends and redeem our stock, enter into transactions with affiliates and merge or consolidate with another entity.
_We [removed: will] [added: may] need to raise additional funds to pursue our growth strategy, and we may be unable to raise capital when needed, which could have a material adverse effect on our business, financial condition and results of operations._
From time to time we [removed: will] [added: may] seek additional equity or debt financing to provide for capital expenditures and working capital consistent with our growth strategy.
_Our current principal [removed: stockholders have] [added: stockholder has] significant influence over us and they could delay, deter, or prevent a change of control or other business combination or otherwise cause us to take action with which you might not agree._
Our principal [removed: stockholders own] [added: stockholder owns] or [removed: control,] [added: controls,] in the aggregate, approximately [removed: 35%] [added: 18%] of our outstanding common stock.
As a result, [removed: these stockholders] [added: this stockholder] will be able to exercise significant influence over all matters requiring stockholder approval, including the election of directors, amendment of our certificate of incorporation and approval of significant corporate transactions and will have significant influence over our management and policies.
In addition, the significant concentration of share ownership may adversely affect the trading price of our common stock because investors often perceive disadvantages in owning shares in companies with [removed: stockholders] [added: a stockholder] holding such significant influence.
While this decline has recently moderated, the level of consumer spending is not where it was prior to the global recession, and economic conditions could lead to further declines in consumer spending in the future.
Additionally, there can be no assurance that various governmental activities to stabilize the markets and stimulate the economy will restore consumer confidence or change spending habits.
Reduced
##### [Table of Contents](#C63694tocpage)
While global credit and financial markets appear to be recovering from extreme disruptions experienced over the past few years, uncertainty about continuing economic stability remains.
The stress experienced by global capital markets in 2008 and 2009 persisted into 2010.
##### [Table of Contents](#C63694tocpage)
beauty products and salon services.
Chuck Rubin was appointed President, Chief Operating Officer and a member of the Board of Directors effective May 10, 2010 and assumed the role of Chief Executive Officer on September 2, 2010.
Any significant leadership or executive management transition involves inherent risks.
##### [Table of Contents](#C63694tocpage)
##### [Table of Contents](#C63694tocpage)
##### [Table of Contents](#C63694tocpage)
However, cosmetic products may become subject to more extensive regulation in the future.
##### [Table of Contents](#C63694tocpage)
| | • | In March 2010, comprehensive healthcare reform legislation under the Patient Protection and Affordable Care Act and the Health Care Education and Affordability Reconciliation Act (collectively, the “Acts”) was passed and signed into law. This healthcare reform legislation significantly expands healthcare coverage to many uninsured individuals and to those already insured. Due to the breadth and complexity of the healthcare reform legislation and the lack of implementing regulations and interpretive guidance, it is difficult to predict the overall impact of the healthcare reform legislation on our business over the coming years. Possible adverse effects include increased costs, exposure to expanded liability and requirements for us to revise the ways in which we conduct business. Additionally, because significant provisions of the Acts will become effective on various dates over the next several years, future changes could significantly impact any effects on our business that we previously anticipated. |
##### [Table of Contents](#C63694tocpage)
##### [Table of Contents](#C63694tocpage)
royalties or both.
##### [Table of Contents](#C63694tocpage)
##### [Table of Contents](#C63694tocpage)
##### [Table of Contents](#C63694tocpage)
| | | |
The risks described below are not the only ones facing our company.
Additional risks not presently known to us or which we currently consider immaterial also may adversely affect our company._
Although there has been limited recent improvement in some of these measures, the level of consumer spending is not where it was prior to the global recession.
The stress experienced by global capital markets that began in the second half of 2007 continued and substantially increased during 2008 and 2009.
Ms. Kirby, our President and Chief Executive Officer since December 1999, is important to our business, including her relationships with our vendors and influence on our sales and marketing.
Ms. Kirby has an agreement to remain employed with us through March 2011, and if we lost Ms. Kirby’s services before the conclusion of this agreement, it could have a material adverse effect on our business, financial condition and results of operations.
However, the FDA may in the future determine to regulate our cosmetics or the ingredients included in our cosmetics as drugs.
we operate makes it increasingly difficult to stay abreast of changes in, and requirements of, local building codes and local building and fire inspectors’ interpretations of such building codes.
Some of our competitors
In addition, when our current facility matures in May 2011, we may be unable to obtain similar terms on a new credit facility due to the uncertainty and volatility in the credit markets.
Item 7. Management’s Discussion and Analysis of Financial Condition and Results of Operations
84 rewritten, 64 added, 73 removed, 241 unchanged
Such forward-looking statements are subject to various risks and uncertainties, which include, without limitation: the impact of weakness in the economy; changes in the overall level of consumer spending; changes in the wholesale cost of our products; the possibility that we may be unable to compete effectively in our highly competitive markets; the possibility that our continued opening of new stores could strain our resources and have a material adverse effect on our business and financial performance; the possibility that new store openings [added: and existing locations] may be impacted by developer or co-tenant issues; the possibility that the capacity of our distribution and order fulfillment infrastructure may not be adequate to support our recent growth and expected future growth plans; the possibility of material disruptions to our information systems; weather conditions that could negatively impact sales; and other risk factors detailed in our public filings with the Securities and Exchange Commission (the “SEC”), including risk factors contained in Item 1A, “Risk Factors” of this Annual Report on Form 10-K for the year ended January [removed: 30, 2010.][added: 29, 2011.]
[removed: We pioneered] [added: After extensive research, we recognized an opportunity to better satisfy how a woman wanted to shop for beauty products, which led to] what we believe to be our unique combination of beauty superstore and specialty store attributes.
As of January [removed: 30, 2010,] [added: 29, 2011,] we operated [removed: 346] [added: 389] stores across [removed: 38] [added: 40] states.
The continued growth of our business and any future increases in net sales, net income and cash flows is dependent on our ability to execute our growth strategy, including growing our store base, expanding our [removed: prestige] [added: product,] brand [added: and service] offerings, [removed: driving incremental salon traffic,] [added: enhancing our loyalty program, broadening our marketing channels,] expanding our [removed: online] [added: e-commerce] business and [removed: continuing to enhance] [added: improving] our [removed: brand awareness.][added: profitability by leveraging our fixed costs.]
Gross profit as a percentage of net sales is expected to increase as a result of our ability to [added: expand merchandise margin and] leverage our supply chain infrastructure and fixed store costs with comparable store sales [removed: increases.][added: increases and operating efficiencies.]
The global economic crisis and [removed: the continued] [added: resulting] volatility and disruption to the capital and credit markets have had a significant, adverse impact on global economic conditions, resulting in [removed: additional significant] recessionary pressures and declines in consumer confidence and economic growth.
As a result of [removed: these] market conditions, the cost and availability of credit has been and may continue to be adversely affected by [removed: illiquid] [added: decreased liquidity in] credit markets and wider credit spreads.
Continued turbulence in the United States and international markets and economies and [removed: prolonged] declines in business and consumer spending may adversely affect our liquidity and financial condition, and the liquidity and [removed: financial condition of our customers, including our ability to refinance maturing liabilities and access the capital markets to meet liquidity needs.]
[removed: Our comparable] [added: Comparable] store [removed: increases] [added: sales] for the first, second, [removed: and] third [added: and fourth] quarters of fiscal [removed: 2008] [added: 2010] were [removed: 3.9%, 3.7%,] [added: 10.8%, 10.8%, 12.2%] and [removed: 2.0%,] [added: 10.4%,] respectively.
[removed: Comparables] [added: Our comparable] store sales for [removed: the] first, second, third and fourth quarters of fiscal 2009 were -2.3%, -1.7%, 1.5% and 6.2%, respectively.
We believe the improvement in our comparable store sales trends is due to a combination of factors including [removed: our ability to better plan our] [added: effective] marketing and merchandise programs [removed: for the challenging economic environment] and the relatively lower comparable [added: store sales level] in the prior [removed: year fourth quarter period.][added: year.]
We also believe that overall consumer sentiment and shopping patterns improved [removed: somewhat] in [removed: the second half of] [added: 2010 when compared to] 2009 which may have contributed to our improving [removed: trends when compared to 2008.][added: trends.]
Pre-opening expense includes non-capital expenditures during the period prior to store opening for [removed: new and] [added: new,] remodeled [added: and relocated] stores including rent during the construction period for new [added: and relocated] stores, store set-up labor, management and employee training, and grand opening advertising.
Interest expense includes interest costs [added: and unused facility fees] associated with our credit facility, which is structured as an asset based lending instrument.
[added: Our interest expense will fluctuate based on the seasonal borrowing requirements] associated with acquiring inventory in advance of key holiday selling periods and fluctuation in the variable interest rates we are charged on outstanding balances.
The Company’s fiscal years ended January [added: 29, 2011, January] 30, [removed: 2010,] [added: 2010 and] January 31, 2009 [removed: and February 2, 2008] were 52 week years and are hereafter referred to as fiscal [removed: 2009,] [added: 2010,] fiscal [removed: 2008] [added: 2009] and fiscal [removed: 2007.][added: 2008.]
| | | January [removed: 30,] [added: 29,] | | | | January [removed: 31,] [added: 30,] | | | | [removed: February 2,] [added: January 31,] | | |
| | | [removed: 2010] [added: 2011] | | | | [removed: 2009] [added: 2010] | | | | [removed: 2008] [added: 2009] | | |
| Net sales | | $ | [removed: 1,222,771] [added: 1,454,838] | | | $ | [removed: 1,084,646] [added: 1,222,771] | | | $ | [removed: 912,141] [added: 1,084,646] | |
| Pre-opening expenses | | | [removed: 6,003] [added: 7,095] | | | | [removed: 14,311] [added: 6,003] | | | | [removed: 11,758] [added: 14,311] | |
| Operating income | | | [removed: 68,153] [added: 118,884] | | | | [removed: 46,301] [added: 68,153] | | | | [removed: 46,721] [added: 46,301] | |
| Interest expense | | | [removed: 2,202] [added: 755] | | | | [removed: 3,943] [added: 2,202] | | | | [removed: 4,542] [added: 3,943] | |
| Income before income taxes | | | [removed: 65,951] [added: 118,129] | | | | [removed: 42,358] [added: 65,951] | | | | [removed: 42,179] [added: 42,358] | |
| Income tax expense | | | [removed: 26,595] [added: 47,099] | | | | [removed: 17,090] [added: 26,595] | | | | [removed: 16,844] [added: 17,090] | |
| Net income | | $ | [removed: 39,356] [added: 71,030] | | | $ | [removed: 25,268] [added: 39,356] | | | $ | [removed: 25,335] [added: 25,268] | |
| Number of stores end of period | | | [removed: 346] [added: 389] | | | | [removed: 311] [added: 346] | | | | [removed: 249] [added: 311] | |
| Comparable store sales increase | | | [removed: 1.4] [added: 11.0] | % | | | [removed: 0.2] [added: 1.4] | % | | | [removed: 6.4] [added: 0.2] | % |
| (Percentage of Net Sales) | | [removed: 2010] [added: 2011] | | | | [removed: 2009] [added: 2010] | | | | [removed: 2008] [added: 2009] | | |
| Selling, general and [removed: administrative] [added: adminstrative] expenses | | | [removed: 24.4] [added: 24.6] | % | | | [removed: 24.6] [added: 24.7] | % | | | [removed: 24.7] [added: 25.0] | % |
| Pre-opening expenses | | | 0.5 | % | | | [removed: 1.3] [added: 0.5] | % | | | 1.3 | % |
| Operating income | | | [removed: 5.6] [added: 8.2] | % | | | [removed: 4.3] [added: 5.6] | % | | | [removed: 5.1] [added: 4.3] | % |
| Interest expense | | | [removed: 0.2] [added: 0.1] | % | | | [removed: 0.4] [added: 0.2] | % | | | [removed: 0.5] [added: 0.4] | % |
| Income before income taxes | | | [removed: 5.4] [added: 8.1] | % | | | [removed: 3.9] [added: 5.4] | % | | | [removed: 4.6] [added: 3.9] | % |
| Income tax expense | | | [removed: 2.2] [added: 3.2] | % | | | [removed: 1.6] [added: 2.2] | % | | | [removed: 1.8] [added: 1.6] | % |
| Net income | | | [removed: 3.2] [added: 4.9] | % | | | [removed: 2.3] [added: 3.2] | % | | | [removed: 2.8] [added: 2.3] | % |
[removed: This increase is] [added: The sales increases are] due to the opening of 35 net new stores in 2009 and a 1.4% increase in comparable store sales which was primarily due to a 3.6% increase in store traffic.
Gross profit increased [removed: $45.1] [added: $44.9] million, or [removed: 13.8%,] [added: 13.5%,] to [removed: $373.0] [added: $376.6] million in fiscal 2009, compared to [removed: $327.9] [added: $331.7] million, in fiscal 2008.
Gross profit as a percentage of net sales increased [removed: 30] [added: 20] basis points to [removed: 30.5%] [added: 30.8%] in fiscal 2009 compared to [removed: 30.2%] [added: 30.6%] in fiscal 2008.
| | • | [removed: a] 70 basis [removed: point] [added: points] improvement due to supply chain efficiencies including labor and freight; offset by |
Selling, general and administrative (SG&A) expenses increased [removed: $31.6] [added: $55.7] million, or [removed: 11.8%,] [added: 18.4%,] to [removed: $298.9] [added: $358.1] million in fiscal [removed: 2009] [added: 2010] compared to [removed: $267.3] [added: $302.4] million in fiscal [removed: 2008.][added: 2009.]
##### [Table of Contents](#C63694tocpage)
Our comparable store sales have fluctuated in the past and we expect them to continue to fluctuate in the future.
A variety of factors affect our comparable store sales, including general U.S. economic conditions, changes in merchandise strategy or mix, and timing and effectiveness of our marketing activities, among others.
We do not expect our 11.0% fiscal 2010 comparable store sales increase to continue into the future.
Our long-term annual comparable store sales increase target is 3% to 5%.
While economic conditions have begun to show signs of improvement, the recovery has proceeded at a sluggish rate and the retail environment has remained weak.
While global credit and financial markets appear to be recovering from the extreme disruptions experienced over the past few years, uncertainty about continuing economic stability remains.
##### [Table of Contents](#C63694tocpage)
financial condition of our customers, including our ability to refinance maturing liabilities and access the capital markets to meet liquidity needs.
Fiscal 2010 two year comparable store sales for the respective quarters were 8.5%, 9.1%, 13.7%, and 16.6%, respectively.
We believe the improvement in our comparable store sales trends is due to a combination of factors including effective marketing and merchandising programs as well as improved consumer sentiment and shopping patterns due to a general improvement in U.S. economic conditions compared to fiscal 2009 and 2008.
We do not expect the low double digit comparable store increases of fiscal 2010 to continue into the future.
Our long-term annual net income growth target of 25% to 30% is based on comparable store sales increases of 3% to 5%.
The Company has determined its operating segments on the same basis that it uses to internally evaluate performance.
We have combined our three operating segments: retail stores, salon services and e-commerce, into one reportable segment because they have a similar class of consumer, economic characteristics, nature of products and distribution methods.
##### [Table of Contents](#C63694tocpage)
| | • | stock-based compensation expense; |
##### [Table of Contents](#C63694tocpage)
| Cost of sales(1) | | | 970,753 | | | | 846,202 | | | | 752,939 | |
| Gross profit | | | 484,085 | | | | 376,569 | | | | 331,707 | |
| Selling, general and administrative expenses(1) | | | 358,106 | | | | 302,413 | | | | 271,095 | |
| | | January 29, | | | | January 30, | | | | January 31, | | |
| Cost of sales | | | 66.7 | % | | | 69.2 | % | | | 69.4 | % |
| Gross profit | | | 33.3 | % | | | 30.8 | % | | | 30.6 | % |
| (1) | | The Company made reclassifications in the consolidated income statements for the fiscal years ended January 30, 2010 (fiscal 2009) and January 31, 2009 (fiscal 2008) to decrease cost of sales and increase selling, general and administrative expenses by $3,520 and $3,773, respectively, to conform to the fiscal 2010 presentation. |
Net sales increased $232.0 million, or 19.0%, to $1,454.8 million in fiscal 2010 compared to $1,222.8 million in fiscal 2009.
Salon service sales increased $9.8 million, or 12.8%, to $86.4 million compared to $76.6 million in fiscal 2009.
Non-comparable stores, which include stores opened in fiscal 2010 as well as stores opened in fiscal 2009 which
##### [Table of Contents](#C63694tocpage)
Gross profit increased $107.5 million, or 28.6%, to $484.1 million in fiscal 2010, compared to $376.6 million, in fiscal 2009.
| | • | 120 basis points of leverage in fixed store costs attributed to the impact of significantly higher sales levels in fiscal 2010; |
| | • | 80 basis points improvement in merchandise margin due to improved promotional pricing and a shift in category mix towards higher margin product compared with fiscal 2009; and |
| | • | 20 basis points of supply chain efficiencies on product handling automation, engineering efforts and higher sales volume. |
| | • | 40 basis points improvement in marketing expense leverage attributed to costs efficiencies and higher sales volume; offset by |
| | • | 30 basis points deleverage due to the non-recurring executive compensation charge related to our newly appointed President and Chief Executive Officer. |
Pre-opening expenses increased $1.1 million, or 18.2%, to $7.1 million in fiscal 2010 compared to $6.0 million in fiscal 2009.
Interest expense decreased $1.4 million, or 65.7%, to $0.8 million in fiscal 2010 compared to $2.2 million in fiscal 2009.
Fiscal 2010 interest expense represents fees associated with the credit facility.
We did not utilize the credit facility in fiscal 2010.
Income tax expense of $47.1 million in fiscal 2010 represents an effective tax rate of 39.9%, compared to fiscal 2009 tax expense of $26.6 million and an effective tax rate of 40.3%.
In 1999 we embarked on a multi-year strategy to understand and embrace what women want in a beauty retailer and transform Ulta into the shopping experience that it is
today.
In addition to these fundamental elements of a beauty superstore, we strive to offer an uplifting shopping experience through what we refer to as “The Five E’s”: Escape, Education, Entertainment, Esthetics and Empowerment.
We do not expect our comparable store sales increases over the next five years to reflect the sustained high single digit to low double digit increases we experienced in 2005 through early 2007.
We believe the sequential decline in our quarterly comparable store sales during 2008 and the comparable store sales declines in first and second quarter 2009 were due primarily to the difficult economic environment.
While we have experienced some level of stabilization in our comparable store sales during the course of 2009, and recorded a positive comparable store sales increase in the third and fourth quarters of 2009, the continuing economic uncertainty may impact the level of comparable store sales we can achieve.
The Company adopted a structured stock option compensation program in July 2007.
The award of stock options under this program will result in increased stock-based compensation expense in future periods as compared to the expense reflected in our historical financial statements.
On October 30, 2007, we completed an initial public offering in which we sold 7,666,667 shares of common stock resulting in net proceeds of $123.5 million after deducting underwriting discounts and commissions and offering expenses.
Selling stockholders sold 2,153,928 additional shares of common stock.
We did not receive any proceeds from the sale of shares by the selling stockholders.
We used the net proceeds from the offering to pay $93.0 million of accumulated dividends in arrears on our preferred stock, which satisfied all amounts due with respect to accumulated dividends, $4.8 million to redeem our Series III preferred stock, and $25.7 million to reduce our borrowings under our third amended and restated loan and security agreement and for general corporate purposes.
Also in connection with the offering, we converted preferred shares into 41,524,002 common shares and restated the par value of our common stock to $0.01 per share.
During fiscal 2008, we experienced a deceleration of our comparable store sales increases.
The deceleration was especially apparent during the fourth quarter when we reported a comparable store sales decrease of 5.5%.
We believe that the deterioration of the U.S. economy was the primary contributing factor to our comparable store sales deceleration throughout fiscal 2008.
During fiscal 2009, we experienced a sequential improvement in our comparable store sales.
Salon service revenue represents less than 10% of our combined product sales and services revenues and therefore, these revenues are combined with product sales.
| | | |
| | • | stock-based compensation expense related to option grants which will result in increases in expense as we implemented a structured stock option compensation program in 2007; |
Our interest expense will fluctuate based on the seasonal borrowing requirements
| Cost of sales | | | 849,722 | | | | 756,712 | | | | 628,495 | |
| Gross profit | | | 373,049 | | | | 327,934 | | | | 283,646 | |
| Selling, general and administrative expenses | | | 298,893 | | | | 267,322 | | | | 225,167 | |
| Cost of sales | | | 69.5 | % | | | 69.8 | % | | | 68.9 | % |
| Gross profit | | | 30.5 | % | | | 30.2 | % | | | 31.1 | % |
Net sales increased $172.5 million, or 18.9%, to $1,084.6 million in fiscal 2008 compared to $912.1 million in fiscal 2007.
Fiscal 2008 comparable store sales were significantly affected by the 5.5% decrease in comparable store sales in the fourth quarter.
We believe the continued deterioration and uncertainty in the United States economy were significant contributing factors to our decreased comparable store sales during fiscal 2008, especially during the holiday season when consumers significantly reduced discretionary spending.
Gross profit increased $44.3 million, or 15.6%, to $327.9 million in fiscal 2008, compared to $283.6 million, in fiscal 2007.
| | • | a 90 basis point deleverage of fixed store costs primarily driven by the acceleration of our new store program over the last two years; |
| | • | a 20 basis point deleverage of distribution center costs due to one-time start-up costs and fixed on-going operating costs of our new Phoenix distribution center opened in the first quarter fiscal 2008; and |
| | • | a 20 basis point improvement in freight cost leverage due to an improved transportation network due to the addition of our new Phoenix distribution center and other cost management strategies. |
Selling, general and administrative (SG&A) expenses increased $42.1 million, or 18.7%, to $267.3 million in fiscal 2008 compared to $225.2 million in fiscal 2007.
SG&A expenses were primarily impacted by:
| | • | operating expenses from new stores opened in fiscal 2008 and 2007; |
| | • | a 60 basis point improvement in leverage of corporate overhead and store variable costs, including a 40 basis point decrease in incentive compensation expense as compared to fiscal 2007; |
| | • | a 40 basis point increase in marketing expense driven by an increased number of advertising vehicles and circulation to drive customer traffic in a weaker economic environment; and |
| | • | a 20 basis point increase in stock compensation expense. |
Pre-opening expenses increased $2.5 million, or 21.7%, to $14.3 million in fiscal 2008 compared to $11.8 million in fiscal 2007.
An excerpt. Shown here: 40 of 84 rewritten, 40 of 64 added and 40 of 73 removed. The counts are complete. For every sentence, read Item 7. Management’s Discussion and Analysis of Financial Condition and Results of Operations in the FY2011 filing and the FY2010 filing.
Item 7A. Quantitative and Qualitative Disclosures about Market Risk
1 rewritten, 4 added, 7 removed, 8 unchanged
The [removed: change in market] [added: interest rate swap was recorded at fair] value [removed: during] [added: in] fiscal 2009 and 2008 [added: and changes in market value] related to the effective portion of the cash flow hedge was recorded as [removed: an] unrecognized gain or loss [added: in accumulated other comprehensive income (loss) section of the stockholders’ equity in the balance sheets.]
We did not utilize the credit facility during fiscal 2010.
##### [Table of Contents](#C63694tocpage)
The Company had an interest rate swap agreement with a notional amount of $25 million which was designated as a cash flow hedge.
The agreement expired on January 31, 2010.
On January 31, 2007, we entered into an interest rate swap agreement with a notional amount of $25,000 that qualified as a cash flow hedge to obtain a fixed interest rate on variable rate debt and reduce certain exposures to interest rate fluctuations.
The swap resulted in fixed rate payments at an interest rate of 5.11% for a term of three years, ending on January 31, 2010.
As of January 30, 2010 and January 31, 2009, the interest rate swap had a negative fair value of zero and $1.0 million, respectively, and is included in accrued liabilities.
in the accumulated other comprehensive loss section of stockholders’ equity in the balance sheets.
Amounts related to any ineffectiveness, which are insignificant, are recorded as interest expense.
Our weighted average debt for fiscal 2009 was $37.6 million, adjusted to exclude the $25.0 million hedged amount.
A hypothetical 1% increase or decrease in interest rates would have resulted in a $0.4 million change to our interest expense for fiscal 2009.
Item 1. Business
73 rewritten, 59 added, 51 removed, 221 unchanged
In addition to [removed: the fundamental elements] [added: offering one] of [removed: a beauty superstore,] [added: the most extensive product and brand selections in our industry,] we strive to offer an uplifting shopping experience through what we refer to as “The Five E’s”: Escape, Education, Entertainment, Esthetics and Empowerment.
[added: | | • | _Escape._] We [added: strive to offer our customers a timely escape from the stresses of daily life in a welcoming and approachable environment. Our customer can immerse herself in our extensive product selection, indulge herself in our hair or skin treatments, or discover new and exciting products in an interactive setting. We] provide a shopping experience without the intimidating, commission-oriented and brand-dedicated sales approach that we believe is found in most department stores and with a level of service that we believe is typically unavailable in drug stores and mass merchandisers. [added: |]
[added: | | • | _Entertainment._ The entertainment experience for our customer begins at home when she receives our catalogs or visits our website. They are designed to introduce our customers to our newest products and promotions and to be invitations to come to Ulta to play, touch, test, learn and explore. A significant percentage of our sales throughout the year is derived from new products, making every visit to Ulta an opportunity to discover something new and exciting.] In addition to providing over 4,500 testers in categories such as fragrance, cosmetics, skincare, and salon styling tools, we further enhance the shopping experience and store atmosphere through live demonstrations from our licensed salon professionals and beauty consultants, and through customer makeovers and in-store videos. [added: |]
[added: | | • | _Esthetics._ We strive to create a visually pleasing and inviting store and salon environment that exemplifies and reinforces the quality of our products and services.] Our [added: stores are brightly lit, spacious and attractive on the inside and outside of the store. Our] store and salon design features sleek, modern lines that reinforce our status as a fashion authority, together with wide aisles that make the store easy to navigate and pleasant lighting to create a luxurious and welcoming environment. [added: This strategy enables us to provide an extensive product selection in a well-organized store and to offer a salon experience that is both fashionable and contemporary. |]
[added: | | • |] _Empowerment._ We are committed to creating an environment in which women feel empowered by both their inner and outer beauty; we take honor in providing our guests with opportunities to showcase how they have empowered themselves and others. [added: Ulta is committed to positively impacting the lives of women through our work on empowerment initiatives such as the Ulta Enrich, Empower and Enlighten Scholarship Fund which grants deserving high school senior girls scholarships to the educational institution of their choice. |]
[removed: Based on our research and customer surveys, we pioneered] [added: This led to] what we believe to be a unique retail approach that focuses on all aspects of how women prefer to shop for beauty products by combining the fundamental elements of a beauty superstore, including one-stop shopping, a compelling value proposition and convenient locations, together with an uplifting specialty retail [removed: experience through our][added: experience.]
[removed: emphasis on “The] [added: _The] Five [removed: E’s”.][added: E’s_]
_Retail format poised to benefit from shifting channel dynamics._ Over the past several years, the approximately [removed: $80] [added: $96] billion beauty products and salon services industry has experienced significant changes, including a shift in how manufacturers distribute and customers purchase beauty products.
_Experienced management team._ We have an experienced senior management team with extensive [removed: beauty and] retail experience that brings a creative merchandising approach and a disciplined operating philosophy to our [removed: business.]
[removed: Additionally, over] [added: Over] the past several years, we have significantly expanded the depth of our management team at all levels and in all functional areas to support our growth strategy.
We intend to expand our presence as a leading retailer of beauty products and salon services [removed: by:][added: by pursuing the following primary growth strategies:]
[removed: Due] [added: The 2009 new store program was reduced primarily due] to the [removed: economic downturn,] [added: uncertainty in] the [removed: number of] [added: economy and the decline in] high-quality commercial real estate projects [removed: of the size and with the co-tenant mix] that we typically target for our new store [removed: locations has significantly declined.][added: locations.]
As the economy [removed: stabilizes and begins to recover,] [added: recovers,] we believe our successful track record of opening new stores in diverse markets across the United States will allow us to increase our new store growth rates back to historical levels consistent with our long-term target of 15% to 20%.
[added: _Growing our store base to over 1,000 stores in the United States._] We continue to believe that over the long-term, we have the potential to grow our store base to over 1,000 Ulta stores in the United States.
| | | [removed: 2005 | | | |] 2006 | | | | 2007 | | | | 2008 | | | | 2009 | | | [added: | 2010 | | |]
| Total stores beginning of period | | | [removed: 142 | | | |] 167 | | | | 196 | | | | 249 | | | | 311 | | [added: | | 346 | |]
| Stores opened | | | [removed: 25 | | | |] 31 | | | | 53 | | | | 63 | | | | 37 | | [added: | | 47 | |]
| Stores closed | | | [removed: — | | | |] (2 | ) | | | — | | | | (1 | ) | | | (2 | ) | [added: | | (4 | ) |]
| Total stores end of period | | | [removed: 167 | | | |] 196 | | | | 249 | | | | 311 | | | | 346 | | [added: | | 389 | |]
| Stores remodeled | | | [removed: 1 | | | |] 7 | | | | 17 | | | | 8 | | | | 6 | | [added: | | 13 | |]
| Total square footage | | | [removed: 1,726,563 | | | |] 2,023,305 | | | | 2,589,244 | | | | 3,240,579 | | | | 3,613,840 | | [added: | | 4,094,808 | |]
| Average square footage per store | | | [removed: 10,339 | | | |] 10,323 | | | | 10,399 | | | | 10,420 | | | | 10,445 | | [added: | | 10,526 | |]
_Increasing our sales and profitability by expanding our [removed: prestige] [added: product,] brand [added: and service] offerings._ Our strategy is to continue to expand our portfolio of [removed: products] [added: products, brands] and [removed: brands, in particular to enhance our offering of prestige brands,] [added: services] both by capitalizing on the success of our existing vendor relationships and by identifying and developing new supply sources.
We believe we will continue to improve our profitability by reducing our operating [removed: expenses,] [added: expenses as a percentage of net sales,] in particular [added: supply chain,] general corporate overhead and fixed [removed: costs, as a percentage of sales.][added: store expenses.]
Our national magazine print advertising campaign exposes potential new customers to our retail [removed: concept by conveying an attractive] and [removed: sophisticated brand message.][added: e-commerce businesses.]
[added: We also believe we have an opportunity to] increase our in-store marketing efforts as an additional means of educating our customers and increasing the frequency of their visits to our stores.
[removed: _Expanding our e-commerce business._ In addition to re-launching our Ulta.com website and e-commerce platform in November 2007, we] [added: We] continue to aggressively develop and add new website features and functionality, marketing programs, product assortment and new brands, and multi-channel integration [removed: points to drive increased visitor traffic and revenue to this channel.][added: points.]
This market represents approximately [removed: $80] [added: $96] billion in retail sales, according to [removed: a 2008 report by Kline & Company] [added: Euromonitor International] and [removed: IBISWorld] [added: IBIS World] Inc. The approximately [removed: $36] [added: $52] billion beauty products industry includes color cosmetics, haircare, fragrance, bath and body, skincare, salon styling tools and other toiletries.
[removed: We believe the principal bases upon which we compete are the quality and assortment of merchandise, our value proposition, the quality of our] customers’ shopping experience and the convenience of our stores as one-stop destinations for beauty products and salon services.
Our competitors for salon services and products include Regis Corp., Sally Beauty, JCPenney [removed: salons, Premier Salons] [added: salons] and independent salons.
According to [removed: NPD,] [added: industry sources,] 55% of women aged 18 to 24 shop in specialty stores, compared to 40% of women [added: aged 18 to 64.]
As a result of this market transformation, there has been an increase in the number of [removed: prestige] beauty brands pursuing new distribution channels for their products, such as specialty retail, spas and salons, direct response television (i.e., home shopping and infomercials) and the Internet.
In addition, many smaller [removed: prestige] brands are selling their products through these channels due to the high fixed costs associated with operating in most department stores and to capitalize on consumers’ growing propensity to shop in these channels.
[removed: Also, there] [added: There] are a growing number of brands that have built significant consumer awareness and sales by initially offering their products on direct response television.
| | • | Generation X (born between 1965 and 1976): Generation X is entering their peak earning years and represents a significant contributor to overall consumer spending, including beauty products. A recent survey by American Express showed that Generation X spends 60% more on beauty products than Baby Boomers. In addition, while prior generations grew up shopping in department stores and general [removed: merchandisers, Generation X has grown up shopping in specialty stores and we believe seeks a retail environment that combines a compelling experience, functionality, variety and location.] |
We opened [removed: 37] [added: 47] stores in fiscal [removed: 2009] [added: 2010] and the average investment required to open a new Ulta store is approximately [removed: $1.1] [added: $0.9] million, which includes capital investments, net of landlord contributions, pre-opening expenses, and initial inventory, net of payables.
As of January [removed: 30, 2010,] [added: 29, 2011,] we operated [removed: 346] [added: 389] stores in [removed: 38] [added: 40] states.
In fiscal 2006, we developed and initiated a store remodel program to update our [removed: older] [added: oldest] stores to provide a consistent shopping experience across all of our locations.
We remodeled [removed: 6] [added: 13] stores in fiscal [removed: 2009.][added: 2010.]
We [removed: believe] [added: continue to evolve] this program [removed: will improve the appeal of our stores,] [added: to update older stores with a consistent look and experience to] drive additional customer traffic and increase our sales and profitability.
We also maintain a strategic value relationship with others in the category through competitive pricing and promotion.
##### [Table of Contents](#C63694tocpage)
After extensive research, we recognized an opportunity to better satisfy how a woman wanted to shop for beauty products.
_Loyal and active customer base._ We have almost 8 million customer loyalty program members.
##### [Table of Contents](#C63694tocpage)
business.
Chuck Rubin was appointed President, Chief Operating Officer and a member of the Board of Directors effective May 10, 2010 and assumed the role of Chief Executive Officer on September 2, 2010.
Mr. Rubin has over 30 years of experience in the retail industry including senior executive level operating, merchandising and marketing management roles as well as partner level consulting roles across retail formats and e-commerce businesses.
Mr. Rubin along with Gregg Bodnar, our Chief Financial Officer, lead our senior management team.
We opened 47 new stores during fiscal 2010, representing a 13% increase in square footage growth and a 27% increase in the number of new stores opened compared to 37 in fiscal 2009.
We also remodeled 13 stores and relocated 5 stores in fiscal 2010.
Our fiscal 2010 new store program represents primarily new stores opened in existing centers compared to prior years when the new store openings were more balanced between new and existing centers.
This trend is expected to continue for several more years.
The shift to more existing centers had no impact on new store performance.
Over the last several years we have added new products from existing vendors across product categories.
We have also added a number of new brands in recent years, most notably in our prestige category which is currently the beauty industry’s highest growth category.
Brand additions include Juicy Couture, Dolce and Gabanna, and Coach Poppy in fragrance, Dermalogica, Murad and Philosophy in skin care, Benefit, Cargo and Tarte in cosmetics and Pureology in hair care.
We also offer haircare services in our full service salons as well as skin and brow services in each of our stores.
We plan to continue expanding our portfolio of services in the future by establishing Ulta as a leading salon authority providing high quality and consistent services from our licensed stylists and introducing new beauty-related services.
_Enhancing our successful loyalty program._ We have almost 8 million active customer loyalty members who are enrolled in our loyalty programs.
Loyalty member transactions represent more than 50% of our annual
##### [Table of Contents](#C63694tocpage)
total net sales, and the transaction data demonstrates that loyalty members shop with higher frequency and spend more per visit as compared to non-members.
We have been converting loyalty members from our National certificate program to the ULTAmate Rewards program which is a points-based program.
Currently slightly more than 20% of our stores are on the points-based program.
Both loyalty programs provide a robust database of information relative to customer information and shopping behavior which provides a significant long-term opportunity for CRM applications including enabling customer segmentation and one-on-one marketing communications tailored to our customers’ unique beauty needs.
_Broaden our marketing channels._ We believe a key component of our success is the brand exposure we get from our marketing initiatives, which provide an effective means to introduce new products, brands and services to our existing and potential new customers.
We have, historically, utilized primarily direct mail advertising, catalogues and newspaper inserts to communicate with our customers.
We plan to continue to leverage our print marketing while expanding our reach into other marketing channels including television, digital, social media and e-mail marketing.
_Enhancing and expanding our e-commerce business._ Our website serves two roles: to generate direct channel sales and profits and as a vehicle to communicate with our customers in an interactive, enjoyable way to reinforce the Ulta brand and drive traffic to our stores.
We believe the principal bases upon which we compete are the quality and assortment of merchandise, our value proposition, the quality of our
##### [Table of Contents](#C63694tocpage)
##### [Table of Contents](#C63694tocpage)
| | | merchandisers, Generation X has grown up shopping in specialty stores and we believe seeks a retail environment that combines a compelling experience, functionality, variety and location. |
| --- | --- | --- |
Our newest store prototype, including new stores and remodels after 2005, represents approximately 75% of our store base.
##### [Table of Contents](#C63694tocpage)
| --- | --- | --- |
| | • | _Education._ We staff our stores with a team of well-trained beauty consultants and professionally licensed estheticians and stylists whose mission is to educate, inform and advise our customers regarding their beauty needs. We also provide product education through demonstrations, in-store videos and informational displays. Our focus on educating our customer reinforces our authority as her primary resource for beauty products and our credibility as a provider of consistent, high-quality salon services. Our beauty consultants are trained to service customers across all prestige lines and within our prestige “boutiques” where customers can receive a makeover or skin analysis. |
##### [Table of Contents](#C63694tocpage)
_Escape._ We strive to offer our customers a timely escape from the stresses of daily life in a welcoming and approachable environment.
Our customer can immerse herself in our extensive product selection, indulge herself in our hair or skin treatments, or discover new and exciting products in an interactive setting.
_Education._ We staff our stores with a team of well-trained beauty consultants and professionally licensed estheticians and stylists whose mission is to educate, inform and advise our customers regarding their beauty needs.
We also provide product education through demonstrations, in-store videos and informational displays.
Our focus on educating our customer reinforces our authority as her primary resource for beauty products and our credibility as a provider of consistent, high- quality salon services.
Our beauty consultants are trained to service customers across all prestige lines and within our prestige “boutiques” where customers can receive a makeover or skin analysis.
_Entertainment._ The entertainment experience for our customer begins at home when she receives our catalogs.
Our catalogs are designed to introduce our customers to our newest products and promotions and to be invitations to come to Ulta to play, touch, test, learn and explore.
A significant percentage of our sales throughout the year is derived from new products, making every visit to Ulta an opportunity to discover something new and exciting.
_Esthetics._ We strive to create a visually pleasing and inviting store and salon environment that exemplifies and reinforces the quality of our products and services.
Our stores are brightly lit, spacious and attractive on the inside and outside of the store.
This strategy enables us to provide an extensive product selection in a well-organized store and to offer a salon experience that is both fashionable and contemporary.
Ulta is committed to positively impacting the lives of women through our work on two empowerment initiatives.
The first is the Ulta Enrich, Empower and Enlighten Scholarship Fund which grants deserving high school senior girls scholarships to the educational institution of their choice.
The second is our annual Windows of Love campaign that recognizes the “unsung heroes” who are affected by breast cancer.
It is our hope that through these stories of empowerment women everywhere become one step closer to achieving their dreams and positively impacting others.
When Lyn Kirby, our current President and Chief Executive Officer, joined us in December 1999, we embarked on a multi-year strategy to understand and embrace what women want in a beauty retailer and transform Ulta into the shopping experience that it is today.
We conducted extensive research and surveys to analyze customer response and our effectiveness in areas such as in-store experience, merchandise selection, salon services and marketing strategies.
The “Five E’s” provide the foundation for our operating strategy.
_Loyal and active customer base._ We have approximately seven million customer loyalty program members, the majority of whom have shopped at one of our stores within the past 12 months.
Our senior management team is led by Lyn Kirby, our President and Chief Executive Officer, and Gregg Bodnar, our Chief Financial Officer.
_Growing our store base._ We opened 37 stores, representing square footage growth of 12%, and remodeled 6 stores in fiscal 2009.
As a result, we reduced our new store program for 2009.
We plan to continue to expand and attract additional prestige brands to our stores by increasing education for our beauty consultants, providing high levels of customer service, and tailoring the presentation and merchandising of these products in our stores to appeal to prestige vendors.
For example, as of January 30, 2010, we have installed “boutique” areas of approximately 200 square feet in 215 of our stores to showcase and build brand equity for key vendors and to provide our customers with a place to experiment and learn about these products.
We intend to install this feature in most of our stores over time.
Over the last several years we have added several prestige brands including Juicy Couture, Ed Hardy and Marc Jacobs Lola fragrances, Pureology and Liquid Keratin hair care, Dermalogica, Korres, and Mario Badescu skin care, Benefit, Cargo, and Lorac cosmetics and Philosophy fragrance and bath.
We continue to seek opportunities to test prestige brands in our stores in order to expand our prestige brand offerings.
We believe this strategy will positively influence our number of customer transactions and their average transaction value.
_Continuing to enhance our brand awareness to generate sales growth._ We believe a key component of our success is the brand exposure we get from our marketing initiatives.
Our direct mail advertising programs are designed to drive additional traffic to our stores by highlighting current promotional events and new product offerings.
We believe we have an opportunity to
_Driving increased customer traffic to our salons._ We are committed to establishing Ulta as a leading salon authority.
We seek to increase salon traffic and grow salon revenues by providing high quality and consistent services from our licensed stylists, who are knowledgeable about the newest hair fashion trends.
Our objective is to create customer loyalty, increase conversion of our retail customers to our salon services, encourage referrals and distinguish our salons from those of our competitors.
Our stylists are trained to sell haircare products to their customers by demonstrating the products while styling their customers’ hair.
Additionally, we have refined our recruiting methods, hiring procedures and training programs to enhance stylist retention, which is an important factor in salon productivity.
aged 18 to 64.
We believe that, based on our recent success in attracting new prestige brands, we are well-positioned to continue to capture additional prestige brands as they expand into specialty stores.
merchandising planners.
An excerpt. Shown here: 40 of 73 rewritten, 40 of 59 added and 40 of 51 removed. The counts are complete. For every sentence, read Item 1. Business in the FY2011 filing and the FY2010 filing.
Item 3. Legal Proceedings
1 rewritten, 15 added, 20 removed, 8 unchanged
_General litigation —_ In July [removed: 2009,] [added: 2009] a putative employment class action lawsuit was filed against us and certain unnamed defendants in [removed: State Court] [added: state court] in California.
On May 26, 2010, the Company and plaintiffs engaged in a voluntary mediation.
Although we continue to deny plaintiffs’ allegations, in the interest of putting the Salon Manager claims behind us, we agreed in principle to settle all claims of the putative Salon Manager class.
The settlement, which is not an admission of liability, received Court approval on December 17, 2010 and payments were disbursed to individual class members in February 2011.
Counsel for the plaintiffs has agreed to dismiss without prejudice the claims of the General Managers.
The settlement amount is not material.
In May 2010, a putative employment class action lawsuit was filed against us and certain unnamed defendants in state court in California.
The plaintiff and members of the proposed class are alleged to be (or have been) non-exempt hourly employees.
The suit alleges that Ulta violated various provisions of the California labor laws and failed to provide plaintiff and members of the proposed class with full meal periods, paid rest breaks, certain wages, overtime compensation and premium pay.
The suit seeks to recover damages and penalties as a result of these alleged practices.
On June 21, 2010, we filed our answer to the lawsuit.
On January 12, 2011, the Company and plaintiffs engaged in a voluntary mediation.
Although we continue to deny plaintiffs’ allegations, in the interest of putting certain of the claims behind us, we agreed in principle to settle all claims of the putative class consisting of non-exempt hourly hair designers in the salon department within the California retail stores.
The settlement, which is not an admission of liability, is subject to final documentation and Court approval.
Counsel for the plaintiffs has agreed to dismiss without prejudice the claims of all other putative class members.
The proposed settlement amount is not material.
_Securities litigation —_ In December 2007 and January 2008, three putative securities class action lawsuits were filed against us and certain of our current and then-current executive officers in the United States District Court for the Northern District of Illinois.
Each suit alleged that the prospectus and registration statement filed pursuant to our initial public offering contained materially false and misleading statements and failed to disclose material facts.
Each suit claimed violations of Sections 11, 12(a)(2) and/or 15 of the Securities Act of 1933, and the two later filed suits added claims under Sections 10(b) and 20(a) of the Securities Exchange Act of 1934, as well as the associated Rule 10b-5.
In February 2008, two of the plaintiffs filed competing motions to consolidate the actions and appoint lead plaintiffs and lead plaintiffs’ counsel.
On March 18, 2008, after one of the plaintiffs withdrew his motion, the suits were consolidated and plaintiffs in the Mirsky v.
ULTA action were appointed lead plaintiffs.
Lead plaintiffs filed their amended complaint on May 19, 2008.
The amended complaint alleged no new violations of the securities laws not asserted in the prior complaints.
It added no new defendants and dropped one of the then-current officers as a defendant.
On July 21, 2008, defendants filed a motion to dismiss the amended complaint.
On September 24, 2008, lead plaintiffs filed their opposition to the motion to dismiss, and on October 24, 2008, defendants filed their reply memorandum in support of their motion to dismiss.
On March 19, 2009, defendants’ motion to dismiss was denied.
On May 29, 2009, we and our primary insurance carrier engaged in a mediation with counsel representing the putative class.
Although we continue to deny plaintiffs’ allegations, in the interest of putting this matter behind us, we and our insurer reached a settlement with plaintiffs.
On August 7, 2009, the Court entered an order preliminarily approving the settlement, approving the form and manner of notice to putative class members, and setting a final hearing to determine whether to approve the settlement.
On November 16, 2009, the Court held a final hearing and, no class members having objected to the settlement or having requested exclusion from the settlement class, the Court entered a final order dismissing all three consolidated cases with prejudice.
The time for appeal expired on December 16, 2009 without any appeal or other challenge to the judgment being made.
All amounts paid under the settlement have been paid out of proceeds of our directors and officers liability insurance coverage.
Although we believe that we have meritorious defenses to the claims made in the putative class action and intend to contest the lawsuit vigorously, an adverse resolution could have a material adverse effect on our financial position and results of operations in the period in which the lawsuit is resolved.
We are not presently able to reasonably estimate potential losses, if any, related to the lawsuit.
Cover and table of contents
18 rewritten, 34 added, 17 removed, 50 unchanged
| | | For the fiscal year ended January [removed: 30, 2010] [added: 29, 2011] |
Indicate by check mark if disclosure of delinquent filers pursuant to Item 405 of Regulation S-K (§ [removed: 229.405)] [added: 229.405 of this chapter)] is not contained herein, and will not be contained, to the best of registrant’s knowledge, in definitive proxy or information statements incorporated by reference in Part III of this Form 10-K or any amendment to this Form 10-K. o
| Large accelerated filer [removed: o] [added: þ] | Accelerated filer [removed: þ] [added: o] | [removed: Non-accelerated] [added: Non- accelerated] filer o | Smaller reporting company o |
The aggregate market value of the voting stock held by non-affiliates of the registrant, based upon the closing sale price of the common stock on [removed: August 1, 2009,] [added: July 31, 2010,] as reported on the NASDAQ Global Select Market, was approximately [removed: $308.8 million.][added: $1,120,326,000.]
Shares of the registrant’s common stock held by each executive officer and director and by each entity or person that, to the registrant’s knowledge, owned 5% or more of the registrant’s outstanding common stock as of [removed: August 1, 2009] [added: July 31, 2010] have been excluded in that such persons may be deemed to be affiliates of the registrant.
The number of shares of the registrant’s common stock, par value $0.01 per share, outstanding as of March [removed: 25, 2010] [added: 24, 2011] was [removed: 58,293,399] [added: 60,654,795] shares.
[removed: | PART] [added: Part] I [removed: | | | | | | | | |]
[removed: Item 1A.][added: | | [Item 1A.](#C63694103) | | | Risk Factors | | | 14 | |]
[added: | | [Item 1B.](#C63694104) | | |] Unresolved Staff Comments [removed: 25][added: | | | 25 | |]
[added: | | [Item 3.](#C63694106) | | |] Legal Proceedings [removed: 27][added: | | | 27 | |]
| [removed: Part II] [added: [PART I](#C63694101)] | | | | | | | | |
[added: | | [Item 5.](#C63694109) | | |] Market for Registrant’s Common Equity, Related Stockholder Matters and Issuer Purchases of Equity Securities [removed: 29][added: | | | 28 | |]
[added: | | [Item 6.](#C63694110) | | |] Selected Financial Data [removed: 31][added: | | | 31 | |]
[added: | | [Item 7.](#C63694111) | | |] Management’s Discussion and Analysis of Financial Condition and Results of Operations [removed: 32][added: | | | 32 | |]
[added: | | [Item 7A.](#C63694112) | | |] Quantitative and Qualitative Disclosures about Market Risk [removed: 43][added: | | | 42 | |]
[added: | | [Item 8.](#C63694113) | | |] Financial Statements and Supplementary Data [removed: 44][added: | | | 43 | |]
[added: | | [Item 9.](#C63694114) | | |] Changes in and Disagreements with Accountants on Accounting and Financial Disclosure [removed: 44][added: | | | 43 | |]
[added: | | [Item 9A.](#C63694115) | | |] Controls and Procedures [removed: 44][added: | | | 43 | |]
10-K 1 c63694e10vk.htm FORM 10-K
##### [Table of Contents](#C63694tocpage)
| | [Item 1.](#C63694102) | | | Business | | | 3 | |
| | [Item 2.](#C63694105) | | | Properties | | | 26 | |
| | [Item 4.](#C63694107) | | | \[Removed and Reserved\] | | | 27 | |
| [Part II](#C63694108) | | | | | | | | |
| | [Item 9B.](#C63694116) | | | Other Information | | | 43 | |
| | | | | | | | | |
| [Part III](#C63694117) | | | | | | | | |
| | [Item 10.](#C63694118) | | | Directors, Executive Officers and Corporate Governance | | | 44 | |
| | [Item 11.](#C63694119) | | | Executive Compensation | | | 44 | |
| | [Item 12.](#C63694120) | | | Security Ownership and Certain Beneficial Owners and Management and Related Stockholder Matters | | | 44 | |
| | [Item 13.](#C63694121) | | | Certain Relationships and Related Transactions, and Director Independence | | | 44 | |
| | [Item 14.](#C63694122) | | | Principal Accountant Fees and Services | | | 44 | |
| | | | | | | | | |
| [PART IV](#C63694123) | | | | | | | | |
| | [Item 15.](#C63694124) | | | Exhibits and Financial Statement Schedules | | | 45 | |
| [EX-10.5.D](https://www.sec.gov/Archives/edgar/data/1403568/000095012311030900/c63694exv10w5wd.htm) | | | | | | | | |
| [EX-10.6.C](https://www.sec.gov/Archives/edgar/data/1403568/000095012311030900/c63694exv10w6wc.htm) | | | | | | | | |
| [EX-23.1](https://www.sec.gov/Archives/edgar/data/1403568/000095012311030900/c63694exv23w1.htm) | | | | | | | | |
| [EX-31.1](https://www.sec.gov/Archives/edgar/data/1403568/000095012311030900/c63694exv31w1.htm) | | | | | | | | |
| [EX-31.2](https://www.sec.gov/Archives/edgar/data/1403568/000095012311030900/c63694exv31w2.htm) | | | | | | | | |
| [EX-32.1](https://www.sec.gov/Archives/edgar/data/1403568/000095012311030900/c63694exv32w1.htm) | | | | | | | | |
##### [Table of Contents](#C63694tocpage)
FORWARD LOOKING STATEMENTS
This Annual Report on Form 10-K contains forward-looking statements within the meaning of Section 21E of the Securities Exchange Act of 1934 and the safe harbor provisions of the Private Securities Litigation Reform Act of 1995, which reflect our current views with respect to, among other things, future events and financial performance.
You can identify these forward-looking statements by the use of forward-looking words such as “outlook,” “believes,” “expects,” “plans,” “estimates,” or other comparable words.
Any forward-looking statements contained in this Form 10-K are based upon our historical performance and on current plans, estimates and expectations.
The inclusion of this forward-looking information should not be regarded as a representation by us or any other person that the future plans, estimates or expectations contemplated by us will be achieved.
Such forward-looking statements are subject to various risks and uncertainties, which include, without limitation: the impact of weakness in the economy; changes in the overall level of consumer spending; changes in the wholesale cost of our products; the possibility that we may be unable to compete effectively in our highly competitive markets; the possibility that our continued opening of new stores could strain our resources and have a material adverse effect on our business and financial performance; the possibility that new store openings and existing locations may be impacted by developer or co-tenant issues; the possibility that the capacity of our distribution and order fulfillment infrastructure may not be adequate to support our recent growth and expected future growth plans; the possibility of material disruptions to our information systems; weather conditions that could negatively impact sales; and other risk factors detailed in our public filings with the Securities and Exchange Commission (the “SEC”), including risk factors contained in Item 1A, “Risk Factors” of this Annual Report on Form 10-K for the year ended January 29, 2011.
We assume no obligation to update any forward-looking statements as a result of new information, future events or developments.
References in the following discussion to “we”, “us”, “our”, “the Company”, “Ulta” and similar references mean Ulta Salon, Cosmetics & Fragrance, Inc. unless otherwise expressly stated or the context otherwise requires.
| | |
| --- | --- |
10-K 1 c57102e10vk.htm FORM 10-K
Item 1.
Business 3
Risk Factors 14
Item 1B.
Item 2.
Properties 26
Item 3.
Item 4.
\[Reserved\] 28
Item 5.
Item 6.
Item 7.
Item 7A.
Item 8.
Item 9.
Item 9A.
Item 1B. Unresolved Staff Comments
0 rewritten, 1 added, 0 removed, 3 unchanged
##### [Table of Contents](#C63694tocpage)
Item 2. Properties
23 rewritten, 5 added, 4 removed, 34 unchanged
As of January [removed: 30, 2010,] [added: 29, 2011,] we operated [removed: 346] [added: 389] retail stores in [removed: 38] [added: 40] states, as shown in the table below:
| Arkansas | | | [removed: 1] [added: 3] | |
| California | | | [removed: 30] [added: 33] | |
| Connecticut | | | [removed: 1] [added: 3] | |
| Florida | | | [removed: 24] [added: 29] | |
| Georgia | | | [removed: 16] [added: 18] | |
| Illinois | | | [removed: 32] [added: 34] | |
| Indiana | | | [removed: 6] [added: 8] | |
| Kentucky | | | [removed: 2] [added: 3] | |
| Louisiana | | | [removed: 2] [added: 3] | |
| Michigan | | | [removed: 9] [added: 11] | |
| Minnesota | | | [removed: 7] [added: 9] | |
| New Jersey | | | [removed: 11] [added: 12] | |
| New York | | | [removed: 13] [added: 12] | |
| Ohio | | | [removed: 7] [added: 11] | |
| Pennsylvania | | | [removed: 16] [added: 17] | |
| Tennessee | | | [removed: 3] [added: 5] | |
| Texas | | | [removed: 46] [added: 52] | |
| Virginia | | | [removed: 10] [added: 11] | |
| Washington | | | [removed: 5] [added: 6] | |
| Wisconsin | | | [removed: 3] [added: 4] | |
As of January [removed: 30, 2010,] [added: 29, 2011,] we operated two distribution facilitates located in Romeoville, Illinois and Phoenix, Arizona.
The lease for the Bolingbrook office expires on August 31, [removed: 2018 and the lease for the Romeoville office expires on April 30, 2015.][added: 2018.]
| Maine | | | 2 | |
| New Mexico | | | 1 | |
| Total | | | 389 | |
##### [Table of Contents](#C63694tocpage)
Our principal executive office is in Bolingbrook, Illinois.
| Total | | | 346 | |
We have corporate offices in two separate locations.
Our principal executive office is in Bolingbrook, Illinois and our secondary corporate office is in Romeoville, Illinois, on the site of the Romeoville warehouse.
We have secured additional office space in Bolingbrook, Illinois for corporate use to accommodate future human resource requirements over the next several years.
Item 4. [Removed and Reserved]
4 rewritten, 8 added, 9 removed, 18 unchanged
| [removed: Lyn P. Kirby] [added: Carl S. Rubin] | | | [removed: 56] [added: 51] | | | President, Chief Executive Officer and Director |
| Gregg R. Bodnar | | | [removed: 45] [added: 46] | | | Chief Financial Officer and Assistant Secretary |
| Robert S. Guttman | | | [removed: 57] [added: 58] | | | Senior Vice President, General Counsel & Secretary |
[removed: Kirby._ Ms. Kirby] [added: Rubin._ Mr. Rubin] has been our [removed: President,] Chief Executive Officer [added: since September 2010] and [added: President and] Director since [removed: December 1999.][added: May 2010.]
_Carl S.
Prior to joining Ulta, Mr. Rubin was President of the North American Retail
##### [Table of Contents](#C63694tocpage)
division of Office Depot Inc. from January 2006 to April 2010.
Mr. Rubin first joined Office Depot as Executive Vice President, Chief Marketing Officer and Chief Merchandising Officer in 2004.
From 1998 to 2004, Mr. Rubin served at Accenture, including three years as a partner, working with a range of retail clients across department store, specialty store and e-commerce venues.
Prior to 1998, Mr. Rubin held a number of senior merchandising and general management positions in the specialty retail and department store industry including Federated Department Stores.
Mr. Rubin was a member of the executive committee of the board of directors of the National Retail Federation from January 2007 through March 2010.
| Wayne D. L’Heureux | | | 51 | | | Senior Vice President — Human Resources |
_Lyn P.
Prior to joining Ulta, Ms. Kirby was President of Circle of Beauty, a subsidiary of Sears, from March 1998 to December 1999; Vice President and General Manager of new business for Gryphon Development, a subsidiary of Limited Brands, Inc. from 1995 to March 1998; and Vice President of Avon Products Inc. and general manager of the gift business, the in-house creative agency and color cosmetics prior to 1995.
_Wayne D.
L’Heureux._ Mr. L’Heureux has been our Senior Vice President — Human Resources since October 2004.
Prior to joining Ulta, Mr. L’Heureux was Vice President Field Human Resources of AutoNation from 2003 to 2004.
From 2000 to 2002, Mr. L’Heureux served as Vice President, Human Resources of Spherion Corporation.
From 1996 to 2000, Mr. L’Heureux served as Vice President Human Resources at Volvo Cars North America.
Prior to 1996 he served as Vice President Retail Human Resources with Office Depot and in various Human Resources positions in the PepsiCo organization and Contel Corporation.
Item 5. Market for Registrant’s Common Equity, Related Stockholder Matters and Issuer Purchases of Equity Securities
8 rewritten, 9 added, 6 removed, 41 unchanged
The following table sets forth the high and low sales prices for our common stock on the NASDAQ Global Select Market during fiscal years [removed: 2009] [added: 2010] and [removed: 2008:][added: 2009:]
| Fiscal Year [removed: 2008] [added: 2010] | | High | | | | Low | | |
The last reported sale price of our common stock on the NASDAQ Global Select Market on March [removed: 25, 2010] [added: 24, 2011] was [removed: $22.72] [added: $47.84] per share.
As of March [removed: 25, 2010,] [added: 24, 2011,] we had [removed: 181] [added: 141] holders of record of our common stock.
Any dividend we might declare in the future would be subject to the applicable provisions of our credit agreement, which currently [removed: restricts] [added: limits] our ability to pay cash dividends.
The following table provides information about Ulta common stock that may be issued under our equity compensation plans as of January [removed: 30, 2010.][added: 29, 2011.]
Set forth below is a graph comparing the cumulative total stockholder return on Ulta’s common stock with the NASDAQ Global Select Market Composite Index (NQGS) and the S&P Retail Index (RLX) for the period covering Ulta’s first trading day on October 25, 2007 through the end of Ulta’s fiscal year ended January [removed: 30, 2010.][added: 29, 2011.]
[removed: 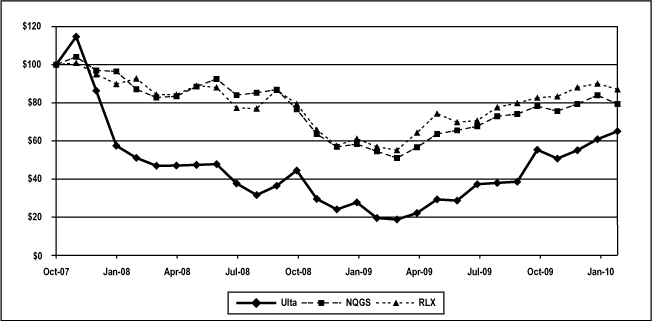][added: 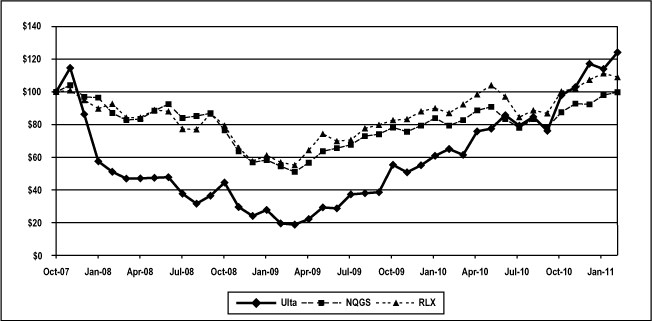]
| First quarter | | $ | 25.36 | | | $ | 17.29 | |
| Second quarter | | | 26.18 | | | | 21.24 | |
| Third quarter | | | 32.33 | | | | 22.18 | |
| Fourth quarter | | | 37.85 | | | | 30.41 | |
##### [Table of Contents](#C63694tocpage)
| Equity compensation plans approved by security holders | | | 5,035,871 | | | $ | 16.55 | | | | 712,730 | |
| Total | | | 5,035,871 | | | $ | 16.55 | | | | 712,730 | |
##### [Table of Contents](#C63694tocpage)
##### [Table of Contents](#C63694tocpage)
| First quarter | | $ | 15.92 | | | $ | 10.49 | |
| Second quarter | | | 14.99 | | | | 9.43 | |
| Third quarter | | | 14.70 | | | | 8.05 | |
| Fourth quarter | | | 10.30 | | | | 5.76 | |
| Equity compensation plans approved by security holders | | | 5,790,506 | | | $ | 11.18 | | | | 2,118,825 | |
| Total | | | 5,790,506 | | | $ | 11.18 | | | | 2,118,825 | |
Item 6. Selected Financial Data
35 rewritten, 5 added, 2 removed, 27 unchanged
| | | January [removed: 30,] [added: 29,] | | | | January [removed: 31,] [added: 30,] | | | | [removed: February 2,] [added: January 31,] | | | | February [removed: 3,] [added: 2,] | | | | [removed: January 28,] [added: February 3,] | | |
| | | [removed: 2010] [added: 2011] | | | | [removed: 2009] [added: 2010] | | | | [removed: 2008] [added: 2009] | | | | [removed: 2007] [added: 2008] | | | | [removed: 2006] [added: 2007] | | |
| [removed: Consolidated income] [added: Income] statement: | | | | | | | | | | | | | | | | | | | | |
| Net sales(2) | | $ | [removed: 1,222,771] [added: 1,454,838] | | | $ | [removed: 1,084,646] [added: 1,222,771] | | | $ | [removed: 912,141] [added: 1,084,646] | | | $ | [removed: 755,113] [added: 912,141] | | | $ | [removed: 579,075] [added: 755,113] | |
| Selling, general and administrative [removed: expenses] [added: expenses(3)] | | | [removed: 298,893] [added: 358,106] | | | | [removed: 267,322] [added: 302,413] | | | | [removed: 225,167] [added: 271,095] | | | | [removed: 188,000] [added: 225,167] | | | | [removed: 140,145] [added: 188,000] | |
| Pre-opening expenses | | | [removed: 6,003] [added: 7,095] | | | | [removed: 14,311] [added: 6,003] | | | | [removed: 11,758] [added: 14,311] | | | | [removed: 7,096] [added: 11,758] | | | | [removed: 4,712] [added: 7,096] | |
| Operating income | | | [removed: 68,153] [added: 118,884] | | | | [removed: 46,301] [added: 68,153] | | | | [removed: 46,721] [added: 46,301] | | | | [removed: 40,088] [added: 46,721] | | | | [removed: 29,424] [added: 40,088] | |
| Interest expense | | | [removed: 2,202] [added: 755] | | | | [removed: 3,943] [added: 2,202] | | | | [removed: 4,542] [added: 3,943] | | | | [removed: 3,314] [added: 4,542] | | | | [removed: 2,951] [added: 3,314] | |
| Income before income taxes | | | [removed: 65,951] [added: 118,129] | | | | [removed: 42,358] [added: 65,951] | | | | [removed: 42,179] [added: 42,358] | | | | [removed: 36,774] [added: 42,179] | | | | [removed: 26,473] [added: 36,774] | |
| Income tax expense | | | [removed: 26,595] [added: 47,099] | | | | [removed: 17,090] [added: 26,595] | | | | [removed: 16,844] [added: 17,090] | | | | [removed: 14,231] [added: 16,844] | | | | [removed: 10,504] [added: 14,231] | |
| Net income | | $ | [removed: 39,356] [added: 71,030] | | | $ | [removed: 25,268] [added: 39,356] | | | $ | [removed: 25,335] [added: 25,268] | | | $ | [removed: 22,543] [added: 25,335] | | | $ | [removed: 15,969] [added: 22,543] | |
| Basic | | $ | [removed: 0.68] [added: 1.20] | | | $ | [removed: 0.44] [added: 0.68] | | | $ | [removed: 0.69] [added: 0.44] | | | $ | [removed: 1.38] [added: 0.69] | | | $ | [removed: 0.74] [added: 1.38] | |
| Diluted | | $ | [removed: 0.66] [added: 1.16] | | | $ | [removed: 0.43] [added: 0.66] | | | $ | [removed: 0.48] [added: 0.43] | | | $ | [removed: 0.45] [added: 0.48] | | | $ | [removed: 0.33] [added: 0.45] | |
| Basic | | | [removed: 57,915] [added: 58,959] | | | | [removed: 57,425] [added: 57,915] | | | | [removed: 20,383] [added: 57,425] | | | | [removed: 5,771] [added: 20,383] | | | | [removed: 4,094] [added: 5,771] | |
| Diluted | | | [removed: 59,237] [added: 61,288] | | | | [removed: 58,967] [added: 59,237] | | | | [removed: 53,293] [added: 58,967] | | | | [removed: 49,921] [added: 53,293] | | | | [removed: 48,196] [added: 49,921] | |
| Comparable store sales [removed: increase(3)] [added: increase(4)] | | | [removed: 1.4] [added: 11.0] | % | | | [removed: 0.2] [added: 1.4] | % | | | [removed: 6.4] [added: 0.2] | % | | | [removed: 14.5] [added: 6.4] | % | | | [removed: 8.3] [added: 14.5] | % |
| Number of stores end of year | | | [removed: 346] [added: 389] | | | | [removed: 311] [added: 346] | | | | [removed: 249] [added: 311] | | | | [removed: 196] [added: 249] | | | | [removed: 167] [added: 196] | |
| Total square footage end of year | | | [removed: 3,613,840] [added: 4,094,808] | | | | [removed: 3,240,579] [added: 3,613,840] | | | | [removed: 2,589,244] [added: 3,240,579] | | | | [removed: 2,023,305] [added: 2,589,244] | | | | [removed: 1,726,563] [added: 2,023,305] | |
| Total square footage per [removed: store(4)] [added: store(5)] | | | [removed: 10,445] [added: 10,526] | | | | [removed: 10,420] [added: 10,445] | | | | [removed: 10,399] [added: 10,420] | | | | [removed: 10,323] [added: 10,399] | | | | [removed: 10,339] [added: 10,323] | |
| Average total square [removed: footage(5)] [added: footage(6)] | | | [removed: 3,459,628] [added: 3,811,597] | | | | [removed: 2,960,355] [added: 3,459,628] | | | | [removed: 2,283,935] [added: 2,960,355] | | | | [removed: 1,857,885] [added: 2,283,935] | | | | [removed: 1,582,935] [added: 1,857,885] | |
| Net sales per average total square [removed: foot(6)] [added: foot(7)] | | $ | [removed: 353] [added: 382] | | | $ | [removed: 366] [added: 353] | | | $ | [removed: 399] [added: 366] | | | $ | [removed: 398] [added: 399] | | | $ | [removed: 366] [added: 398] | |
| Capital expenditures | | | [removed: 68,105] [added: 97,115] | | | | [removed: 110,863] [added: 68,105] | | | | [removed: 101,866] [added: 110,863] | | | | [removed: 62,331] [added: 101,866] | | | | [removed: 41,607] [added: 62,331] | |
| Depreciation and amortization | | | [removed: 62,166] [added: 64,936] | | | | [removed: 51,445] [added: 62,166] | | | | [removed: 39,503] [added: 51,445] | | | | [removed: 29,736] [added: 39,503] | | | | [removed: 22,285] [added: 29,736] | |
| [removed: Consolidated balance] [added: Balance] sheet data: | | | | | | | | | | | | | | | | | | | | |
| Cash and cash equivalents | | $ | [removed: 4,017] [added: 111,185] | | | $ | [removed: 3,638] [added: 4,017] | | | $ | [removed: 3,789] [added: 3,638] | | | $ | [removed: 3,645] [added: 3,789] | | | $ | [removed: 2,839] [added: 3,645] | |
| Working capital | | | [removed: 136,417] [added: 241,032] | | | | [removed: 159,695] [added: 136,417] | | | | [removed: 117,039] [added: 159,695] | | | | [removed: 88,105] [added: 117,039] | | | | [removed: 76,473] [added: 88,105] | |
| Property and equipment, net | | | [removed: 290,861] [added: 326,099] | | | | [removed: 292,224] [added: 290,861] | | | | [removed: 236,389] [added: 292,224] | | | | [removed: 162,080] [added: 236,389] | | | | [removed: 133,003] [added: 162,080] | |
| Total assets | | | [removed: 553,635] [added: 730,488] | | | | [removed: 568,932] [added: 553,635] | | | | [removed: 469,413] [added: 568,932] | | | | [removed: 338,597] [added: 469,413] | | | | [removed: 282,615] [added: 338,597] | |
| Total [removed: debt(7)] [added: debt(8)] | | | — | | | | [removed: 106,047] [added: —] | | | | [removed: 74,770] [added: 106,047] | | | | [removed: 55,529] [added: 74,770] | | | | [removed: 50,173] [added: 55,529] | |
| Total stockholders’ equity | | | [removed: 292,608] [added: 402,533] | | | | [removed: 244,968] [added: 292,608] | | | | [removed: 211,503] [added: 244,968] | | | | [removed: 148,760] [added: 211,503] | | | | [removed: 123,015] [added: 148,760] | |
| [removed: (3)] [added: (4)] | | Comparable store sales increase reflects sales for stores beginning on the first day of the 14th month of operation. Remodeled stores are included in comparable store sales unless the store was closed for a portion of the current or comparable prior year. |
| [removed: (4)] [added: (5)] | | Total square footage per store is calculated by dividing total square footage at end of year by number of stores at end of year. |
| [removed: (5)] [added: (6)] | | Average total square footage represents a weighted average which reflects the effect of opening stores in different months throughout the year. |
| [removed: (6)] [added: (7)] | | Net sales per average total square foot was calculated by dividing net sales for the year by the average square footage for those stores open during each year. Fiscal 2006 net sales per average total square foot were adjusted to exclude the net sales effect of the 53rd week. |
| [removed: (7)] [added: (8)] | | Total debt includes approximately $4.8 million related to the Series III preferred stock, which is presented between the liabilities section and the equity section of our balance sheet for all years prior to February 2, 2008. |
| Cost of sales(3) | | | 970,753 | | | | 846,202 | | | | 752,939 | | | | 628,495 | | | | 519,929 | |
| Gross profit | | | 484,085 | | | | 376,569 | | | | 331,707 | | | | 283,646 | | | | 235,184 | |
##### [Table of Contents](#C63694tocpage)
| (3) | | The Company made reclassifications in the consolidated income statements for the fiscal years ended January 30, 2010 (fiscal 2009) and January 31, 2009 (fiscal 2008) to decrease cost of sales and increase selling, general and administrative expenses by $3,520 and $3,773, respectively, to conform to the fiscal 2010 presentation. Amounts were insignificant for fiscal 2007 and 2006. |
| | | |
| Cost of sales | | | 849,722 | | | | 756,712 | | | | 628,495 | | | | 519,929 | | | | 404,794 | |
| Gross profit | | | 373,049 | | | | 327,934 | | | | 283,646 | | | | 235,184 | | | | 174,281 | |
Item 9A. Controls and Procedures
5 rewritten, 0 added, 6 removed, 8 unchanged
Based on management’s evaluation as of January [removed: 30, 2010,] [added: 29, 2011,] our Chief Executive Officer and Chief Financial Officer have concluded that our disclosure controls and procedures (as defined in Rules 13a-15(e) and 15d-15(e) under the Securities Exchange Act of 1934) are effective to ensure that the information required to be disclosed by us in our reports that we file or submit under the Securities Exchange Act of 1934 is recorded, processed, summarized and reported within the time periods specified in the Securities and Exchange Commission’s rules and [removed: forms.][added: forms, and that such information is accumulated and communicated to our management, including the Chief Executive Officer and Chief Financial Officer, as appropriate, to allow timely decisions regarding required disclosure.]
Under the supervision and with the participation of our principal executive officer and our principal financial officer, management evaluated the effectiveness of our internal control over financial reporting as of January [removed: 30, 2010,] [added: 29, 2011,] based on the criteria established in “Internal Control — Integrated Framework” issued by the Committee of Sponsoring Organizations of the Treadway Commission (COSO).
Based on this evaluation, our principal executive officer and principal financial officer concluded that our internal controls over financial reporting were effective as of January [removed: 30, 2010.][added: 29, 2011.]
Ernst & Young LLP, the independent registered public accounting firm that audited our financial statements included in this Annual Report on Form 10-K, has audited the effectiveness of our internal control over financial reporting as of January [removed: 30, 2010] [added: 29, 2011] and has issued the attestation report included in Item 15 of this Annual Report on Form 10-K.
There were no changes to our internal controls over financial reporting during the three months ended January [removed: 30, 2010] [added: 29, 2011] that have materially affected, or are reasonably likely to materially affect, our internal controls over financial reporting.
| | |
| --- | --- |
Item 9B.
_Other Information_
None.
Part III
Item 9B. Other Information
1 rewritten, 2 added, 24 removed, 2 unchanged
[removed: |] Part III [removed: | | | | | | | | |]
None.
##### [Table of Contents](#C63694tocpage)
| | | | | | | | | |
Item 10.
Directors, Executive Officers and Corporate Governance 45
Item 11.
Executive Compensation 45
Item 12.
Security Ownership and Certain Beneficial Owners and Management and Related Stockholder Matters 45
Item 13.
Certain Relationships and Related Transactions, and Director Independence 45
Item 14.
Principal Accountant Fees and Services 45
| PART IV | | | | | | | | |
Item 15.
Exhibits and Financial Statement Schedules 46
| SIGNATURES | | | | | | | 72 | |
FORWARD LOOKING STATEMENTS
This Annual Report on Form 10-K contains forward-looking statements within the meaning of Section 21E of the Securities Exchange Act of 1934 and the safe harbor provisions of the Private Securities Litigation Reform Act of 1995, which reflect our current views with respect to, among other things, future events and financial performance.
You can identify these forward-looking statements by the use of forward-looking words such as “outlook,” “believes,” “expects,” “plans,” “estimates,” or other comparable words.
Any forward-looking statements contained in this Form 10-K are based upon our historical performance and on current plans, estimates and expectations.
The inclusion of this forward-looking information should not be regarded as a representation by us or any other person that the future plans, estimates or expectations contemplated by us will be achieved.
Such forward-looking statements are subject to various risks and uncertainties, which include, without limitation: the impact of weakness in the economy; changes in the overall level of consumer spending; changes in the wholesale cost of our products; the possibility that we may be unable to compete effectively in our highly competitive markets; the possibility that our continued opening of new stores could strain our resources and have a material adverse effect on our business and financial performance; the possibility that new store openings may be impacted by developer or co-tenant issues; the possibility that the capacity of our distribution and order fulfillment infrastructure may not be adequate to support our recent growth and expected future growth plans; the possibility of material disruptions to our information systems; weather conditions that could negatively impact sales; and other risk factors detailed in our public filings with the Securities and Exchange Commission (the “SEC”), including risk factors contained in Item 1A, “Risk Factors” of this Annual Report on Form 10-K for the year ended January 30, 2010.
We assume no obligation to update any forward-looking statements as a result of new information, future events or developments.
References in the following discussion to “we”, “us”, “our”, “the Company”, “Ulta” and similar references mean Ulta Salon, Cosmetics & Fragrance, Inc. unless otherwise expressly stated or the context otherwise requires.
Part I
Item 10. Directors, Executive Officers and Corporate Governance
1 rewritten, 0 added, 0 removed, 2 unchanged
The information required by this item with respect to our executive officers is set forth after Part I, Item 4 of this report under the caption “Executive Officers of the Registrant.” The additional information required by this item is incorporated by reference to our definitive proxy statement to be filed within 120 days after our fiscal year ended January [removed: 30, 2010] [added: 29, 2011] pursuant to Regulation 14A under the Exchange Act in connection with our [removed: 2010] [added: 2011] annual meeting of stockholders.
Item 11. Executive Compensation
1 rewritten, 0 added, 0 removed, 2 unchanged
The information required by this item is incorporated by reference to our definitive proxy statement to be filed within 120 days after our fiscal year ended January [removed: 30, 2010] [added: 29, 2011] pursuant to Regulation 14A under the Exchange Act in connection with our [removed: 2010] [added: 2011] annual meeting of stockholders.
Item 12. Security Ownership and Certain Beneficial Owners and Management and Related Stockholder Matters
1 rewritten, 0 added, 0 removed, 2 unchanged
The information required by this item is incorporated by reference to our definitive proxy statement to be filed within 120 days after our fiscal year ended January [removed: 30, 2010] [added: 29, 2011] pursuant to Regulation 14A under the Exchange Act in connection with our [removed: 2010] [added: 2011] annual meeting of stockholders.
Item 13. Certain Relationships and Related Transactions, and Director Independence
1 rewritten, 0 added, 0 removed, 2 unchanged
The information required by this item is incorporated by reference to our definitive proxy statement to be filed within 120 days after our fiscal year ended January [removed: 30, 2010] [added: 29, 2011] pursuant to Regulation 14A under the Exchange Act in connection with our [removed: 2010] [added: 2011] annual meeting of stockholders.
Item 14. Principal Accountant Fees and Services
1 rewritten, 1 added, 0 removed, 3 unchanged
The information required by this item is incorporated by reference to our definitive proxy statement to be filed within 120 days after our fiscal year ended January [removed: 30, 2010] [added: 29, 2011] pursuant to Regulation 14A under the Exchange Act in connection with our [removed: 2010] [added: 2011] annual meeting of stockholders.
##### [Table of Contents](#C63694tocpage)
Item 15. Exhibits and Financial Statement Schedules
250 rewritten, 160 added, 188 removed, 485 unchanged
| [removed: Report] [added: [Report] of Independent Registered Public Accounting [removed: Firm] [added: Firm](#C63694300)] | | | [removed: 47] [added: 46] | |
| [removed: Balance Sheets] [added: [Balance Sheets](#C63694301)] | | | [removed: 49] [added: 48] | |
| [removed: Statements] [added: [Statements] of [removed: Income] [added: Income](#C63694302)] | | | [removed: 50] [added: 49] | |
| [removed: Statements] [added: [Statements] of Cash [removed: Flows] [added: Flows](#C63694303)] | | | [removed: 51] [added: 50] | |
| [removed: Statements] [added: [Statements] of Stockholders’ [removed: Equity] [added: Equity](#C63694304)] | | | [removed: 52] [added: 51] | |
| [removed: Notes] [added: [Notes] to Financial [removed: Statements] [added: Statements](#C63694305)] | | | [removed: 55] [added: 52] | |
| [removed: Exhibits] [added: [Exhibits](#C63694306)] | | | [removed: 70] [added: 66] | |
We have audited the accompanying balance sheets of Ulta Salon, Cosmetics & Fragrance, Inc. (the Company) as of January [removed: 30, 2010] [added: 29, 2011] and January [removed: 31, 2009,] [added: 30, 2010,] and the related statements of income, cash flows, and stockholders’ equity for each of the three years in the period ended January [removed: 30, 2010.][added: 29, 2011.]
In our opinion, the financial statements referred to above present fairly, in all material respects, the financial position of Ulta Salon, Cosmetics & Fragrance, Inc. at January [removed: 30, 2010] [added: 29, 2011] and January [removed: 31, 2009,] [added: 30, 2010,] and the results of its operations and its cash flows for each of the three years in the period ended January [removed: 30, 2010,] [added: 29, 2011,] in conformity with U.S. generally accepted accounting principles.
We also have audited, in accordance with the standards of the Public Company Accounting Oversight Board (United States), Ulta Salon, Cosmetics & Fragrance, Inc.’s internal control over financial reporting as of January [removed: 30, 2010,] [added: 29, 2011,] based on criteria established in Internal Control — Integrated Framework issued by the Committee of Sponsoring Organizations of the Treadway Commission and our report dated March [removed: 31, 2010,] [added: 30, 2011,] expressed an unqualified opinion thereon.
We have audited Ulta Salon, Cosmetics & Fragrance, Inc.’s internal control over financial reporting as of January [removed: 30, 2010,] [added: 29, 2011,] based on criteria established in Internal Control — Integrated Framework issued by the Committee of Sponsoring Organizations of the Treadway Commission (the COSO criteria).
In our opinion, Ulta Salon, Cosmetics & Fragrance, Inc. maintained, in all material respects, effective internal control over financial reporting as of January [removed: 30, 2010,] [added: 29, 2011,] based on the COSO criteria.
We also have audited, in accordance with the standards of the Public Company Accounting Oversight Board (United States), the balance sheets of Ulta Salon, Cosmetics & Fragrance, Inc. as of January [removed: 30, 2010] [added: 29, 2011] and January [removed: 31, 2009,] [added: 30, 2010,] and the related statements of income, cash flows and stockholders’ equity for each of the three years in the period ended January [removed: 30, 2010] [added: 29, 2011] and our report dated March [removed: 31, 2010] [added: 30, 2011] expressed an unqualified opinion thereon.
| | | January [removed: 30,] [added: 29,] | | | | January [removed: 31,] [added: 30,] | | |
| | | 2010 | | | | [added: | | | | | | | | | | | |] 2009 | | | [added: | | | | | | | | | | | |]
| Cash and cash equivalents [added: at beginning of year] | | [removed: $] | 4,017 | | | [removed: $] | 3,638 | | [added: | | 3,789 | |]
| Receivables, net | | | [removed: 13,477] [added: 22,292] | | | | [removed: 18,268] [added: 13,477] | |
| Merchandise inventories, net | | | [removed: 206,948] [added: 218,516] | | | | [removed: 213,602] [added: 206,948] | |
| Prepaid expenses and other current assets | | | [removed: 30,272] [added: 32,790] | | | | [removed: 24,294] [added: 30,272] | |
| Prepaid income taxes | | | [removed: —] [added: 10,684] | | | | [removed: 8,628] [added: —] | |
| Deferred income taxes | | | [removed: 8,060] [added: 8,922] | | | | [removed: 8,278] [added: 8,060] | |
| Total current assets | | | [removed: 262,774] [added: 404,389] | | | | [removed: 276,708] [added: 262,774] | |
| Property and equipment, net | | | [removed: 290,861] [added: 326,099] | | | | [removed: 292,224] [added: 290,861] | |
| Total assets | | $ | [removed: 553,635] [added: 730,488] | | | $ | [removed: 568,932] [added: 553,635] | |
| Accounts payable | | [added: $] | [removed: 56,387] [added: 87,093] | | | [added: $] | [removed: 47,811] [added: 56,387] | |
| Accrued liabilities | | | [removed: 59,189] [added: 76,264] | | | | [removed: 51,202] [added: 59,189] | |
| Accrued income taxes | | | [removed: 10,781] [added: —] | | | | [removed: —] [added: 10,781] | |
| Total current liabilities | | | [removed: 126,357] [added: 163,357] | | | | [removed: 117,013] [added: 126,357] | |
| Deferred rent | | | [removed: 113,718] [added: 134,572] | | | | [removed: 101,288] [added: 113,718] | |
| Deferred income taxes | | | [removed: 20,952] [added: 30,026] | | | | [removed: 17,616] [added: 20,952] | |
| Total liabilities | | | [removed: 261,027] [added: 327,955] | | | | [removed: 323,964] [added: 261,027] | |
| Common stock, $.01 par value, 400,000 shares authorized; [removed: 58,674] [added: 60,707] and [removed: 58,245] [added: 58,674] shares issued; [removed: 58,169] [added: 60,202] and [removed: 57,740] [added: 58,169] shares outstanding; at January [removed: 30, 2010,] [added: 29, 2011,] and January [removed: 31, 2009,] [added: 30, 2010,] respectively | | | [removed: 586] [added: 606] | | | | [removed: 582] [added: 586] | |
| Additional paid-in capital | | | [removed: 300,701] [added: 339,576] | | | | [removed: 293,052] [added: 300,701] | |
| [removed: Accumulated deficit] [added: Retained earnings / (accumulated deficit)] | | | [removed: (4,500] [added: 66,530] | [removed: )] | | | [removed: (43,856] [added: (4,500] | ) |
| Total stockholders’ equity | | | [removed: 292,608] [added: 402,533] | | | | [removed: 244,968] [added: 292,608] | |
| Total liabilities and stockholders’ equity | | $ | [removed: 553,635] [added: 730,488] | | | $ | [removed: 568,932] [added: 553,635] | |
| | | January [removed: 30,] [added: 29,] | | | | January [removed: 31,] [added: 30,] | | | | [removed: February 2,] [added: January 31,] | | |
| | | 2010 | | [removed: | |] 2009 | | [removed: | |] 2008 | [removed: | |]
| Net sales | | $ | [removed: 1,222,771] [added: 1,454,838] | | | $ | [removed: 1,084,646] [added: 1,222,771] | | | $ | [removed: 912,141] [added: 1,084,646] | |
| Pre-opening expenses | | | [removed: 6,003] [added: 7,095] | | | | [removed: 14,311] [added: 6,003] | | | | [removed: 11,758] [added: 14,311] | |
##### [Table of Contents](#C63694tocpage)
March 30, 2011
##### [Table of Contents](#C63694tocpage)
March 30, 2011
##### [Table of Contents](#C63694tocpage)
| | | 2011 | | | | 2010 | | |
##### [Table of Contents](#C63694tocpage)
| Cost of sales | | | 970,753 | | | | 846,202 | | | | 752,939 | |
| Gross profit | | | 484,085 | | | | 376,569 | | | | 331,707 | |
| Selling, general and administrative expenses | | | 358,106 | | | | 302,413 | | | | 271,095 | |
##### [Table of Contents](#C63694tocpage)
##### [Table of Contents](#C63694tocpage)
| Balance — January 29, 2011 | | | 60,707 | | | $ | 606 | | | | (505 | ) | | $ | (4,179 | ) | | $ | 339,576 | | | $ | 66,530 | | | $ | — | | | $ | 402,533 | |
##### [Table of Contents](#C63694tocpage)
The Company has determined its operating segments on the same basis that it uses to internally evaluate performance.
The Company has combined its three operating segments: retail stores, salon services and e-commerce, into one reportable segment because they have a similar class of consumer, economic characteristics, nature of products and distribution methods.
_Reclassifications_
The Company made reclassifications in the statements of income for the fiscal years ended January 30, 2010 (fiscal 2009) and January 31, 2009 (fiscal 2008) to decrease cost of sales and increase selling, general and administrative expenses by $3,520 and $3,773, respectively, to conform to the fiscal 2010 presentation.
##### [Table of Contents](#C63694tocpage)
The Company had no outstanding debt as of January 29, 2011 and January 30, 2010.
The cost of
##### [Table of Contents](#C63694tocpage)
The Company provides refunds for product returns within 60 days from the original purchase date.
Salon service revenue amounted to $86,484, $76,627 and $75,035 for fiscal 2010, 2009 and 2008, respectively.
The Company’s gift card sales are deferred and recognized in net sales when the gift card is redeemed for product or services.
The Company’s gift cards do not expire and do not include service fees that decrease customer balances.
The Company has maintained Company-specific, historical data related to its large pool of similar gift card transactions sold and redeemed over a significant time frame.
During fiscal 2010, there was a change in facts and circumstances which resulted in the Company recognizing approximately $2.0 million of gift card breakage income which related primarily to gift cards sold in prior years.
The Company recognizes gift card breakage to the extent there is no requirement for remitting balances to governmental agencies under unclaimed property laws.
Gift card breakage is recognized over the same performance period, and in the same proportion, that the Company’s data has demonstrated that gift cards are redeemed.
Gift card breakage is recorded as a decrease in selling, general and administrative expense in the statements of income.
Deferred gift card revenue was $7,591 and $9,932 at January 29, 2011 and January 30, 2010, respectively, and is included in accrued liabilities — accrued customer liabilities (Note 5).
##### [Table of Contents](#C63694tocpage)
_Insurance expense_
The insurance programs are premium based and include retentions, deductibles and stop loss coverage.
Current stop loss coverage is $150 for employee health claims, $100 for general liability claims and $250 for workers compensation claims.
The
##### [Table of Contents](#C63694tocpage)
Company makes collateral and premium payments during the plan year and accrues expenses in the event additional premium is due from the Company based on actual claim results.
Insurance reserves and related expense activity for fiscal 2010 and 2009 are as follows:
March 31, 2010
Ulta Salon, Cosmetics & Fragrance, Inc.
(In thousands, except per share data)
| Current portion — notes payable | | $ | — | | | $ | 18,000 | |
| Notes payable — less current portion | | | — | | | | 88,047 | |
| Accumulated other comprehensive loss | | | — | | | | (631 | ) |
| | | | | | | | | | | | | |
| --- | --- | --- | --- | --- | --- | --- | --- | --- | --- | --- | --- | --- |
| Cost of sales | | | 849,722 | | | | 756,712 | | | | 628,495 | |
| Gross profit | | | 373,049 | | | | 327,934 | | | | 283,646 | |
| Selling, general and administrative expenses | | | 298,893 | | | | 267,322 | | | | 225,167 | |
| Less preferred stock dividends | | | — | | | | — | | | | 11,219 | |
(In thousands)
| Receipt of related party notes receivable | | | — | | | | — | | | | 4,467 | |
| Payment of accumulated dividends in arrears | | | — | | | | — | | | | (93,012 | ) |
| Redemption of Series III preferred stock | | | — | | | | — | | | | (4,792 | ) |
| Purchase of treasury stock | | | — | | | | — | | | | (1,950 | ) |
| | | | | | | | | | | | | | | | | | | | | | | | | | | | | | | | | | | | | | | | | | | | | | | | | | | | | | | | | |
| --- | --- | --- | --- | --- | --- | --- | --- | --- | --- | --- | --- | --- | --- | --- | --- | --- | --- | --- | --- | --- | --- | --- | --- | --- | --- | --- | --- | --- | --- | --- | --- | --- | --- | --- | --- | --- | --- | --- | --- | --- | --- | --- | --- | --- | --- | --- | --- | --- | --- | --- | --- | --- | --- | --- | --- | --- |
| | | Series I | | | | | | | | Series II | | | | | | | | Series IV | | | | | | | | Series V | | | | | | | | Series V-I | | | | | | | | | | | | | | | | | | | | | | |
| | | Convertible, Voting, | | | | | | | | Convertible, Voting, | | | | | | | | Convertible, Voting, | | | | | | | | Convertible, Voting, | | | | | | | | Convertible, Voting, | | | | | | | | Total | | | | | | | | Treasury - | | | | | | |
| | | Preferred Stock | | | | | | | | Preferred Stock | | | | | | | | Preferred Stock | | | | | | | | Preferred Stock | | | | | | | | Preferred Stock | | | | | | | | Preferred Stock | | | | | | | | Preferred Stock | | | | | | |
| Par Value | | $.01 | | | | | | | | $.01 | | | | | | | | $.01 | | | | | | | | $.01 | | | | | | | | $.01 | | | | | | | | | | | | | | | | | | | | | | |
| Authorized Shares | | 17,208 | | | | | | | | 7,634 | | | | | | | | 19,184 | | | | | | | | 22,500 | | | | | | | | 4,600 | | | | | | | | | | | | | | | | | | | | | | |
| | | Issued | | | | | | | | Issued | | | | | | | | Issued | | | | | | | | Issued | | | | | | | | Issued | | | | | | | | Issued | | | | | | | | Treasury | | | | | | |
| | | Shares | | | | Amount | | | | Shares | | | | Amount | | | | Shares | | | | Amount | | | | Shares | | | | Amount | | | | Shares | | | | Amount | | | | Shares | | | | Amount | | | | Shares | | | | Amount | | |
| Balance — February 3, 2007 | | | 16,915 | | | | 43,317 | | | | 7,634 | | | | 74,455 | | | | 19,184 | | | | 46,871 | | | | 21,448 | | | | 56,079 | | | | 920 | | | | 2,337 | | | | 66,101 | | | | 223,059 | | | | (38 | ) | | | (12 | ) |
| Purchase of treasury stock | | | — | | | | — | | | | — | | | | — | | | | — | | | | — | | | | — | | | | — | | | | — | | | | — | | | | — | | | | — | | | | (360 | ) | | | (1,803 | ) |
| Accretion of preferred dividends | | | — | | | | 3,107 | | | | — | | | | — | | | | — | | | | 3,590 | | | | — | | | | 4,341 | | | | — | | | | 181 | | | | — | | | | 11,219 | | | | — | | | | — | |
| Payment of accumulated preferred dividends in arrears | | | — | | | | (30,845 | ) | | | — | | | | — | | | | — | | | | (31,311 | ) | | | — | | | | (29,663 | ) | | | — | | | | (1,193 | ) | | | — | | | | (93,012 | ) | | | — | | | | — | |
| Conversion of preferred stock to common stock in conjunction with initial public offering | | | (16,915 | ) | | | (15,579 | ) | | | (7,634 | ) | | | (74,455 | ) | | | (19,184 | ) | | | (19,150 | ) | | | (21,448 | ) | | | (30,757 | ) | | | (920 | ) | | | (1,325 | ) | | | (66,101 | ) | | | (141,266 | ) | | | 398 | | | | 1,815 | |
| Balance — February 2, 2008 | | | — | | | $ | — | | | | — | | | $ | — | | | | — | | | $ | — | | | | — | | | $ | — | | | | — | | | $ | — | | | | — | | | $ | — | | | | — | | | $ | — | |
Statements of Stockholders’ Equity — (Continued)
| | | | | | | | | | | | | | | | | | | | | | | | | | | | | | | | | | | | | |
| --- | --- | --- | --- | --- | --- | --- | --- | --- | --- | --- | --- | --- | --- | --- | --- | --- | --- | --- | --- | --- | --- | --- | --- | --- | --- | --- | --- | --- | --- | --- | --- | --- | --- | --- | --- | --- |
| Balance — February 3, 2007 | | | 7,409 | | | $ | 117 | | | | (242 | ) | | $ | (2,217 | ) | | $ | 15,501 | | | $ | (4,467 | ) | | $ | (83,240 | ) | | $ | 19 | | | $ | 148,760 | |
| Purchase of treasury stock | | | — | | | | — | | | | (11 | ) | | | (147 | ) | | | — | | | | — | | | | — | | | | — | | | | (1,950 | ) |
| Accretion of preferred dividends | | | — | | | | — | | | | — | | | | — | | | | — | | | | — | | | | (11,219 | ) | | | — | | | | — | |
| Receipt of related party notes receivable | | | — | | | | — | | | | — | | | | — | | | | — | | | | 4,467 | | | | — | | | | — | | | | 4,467 | |
| Unrealized loss on interest rate swap hedge, net of $478 income tax | | | — | | | | — | | | | — | | | | — | | | | — | | | | — | | | | — | | | | (738 | ) | | | (738 | ) |
An excerpt. Shown here: 40 of 250 rewritten, 40 of 160 added and 40 of 188 removed. The counts are complete. For every sentence, read Item 15. Exhibits and Financial Statement Schedules in the FY2011 filing and the FY2010 filing.