 filings.tools
Ulta Beauty 10-K 2014-02-01
Filed 2014-04-02. 21 sections, 264K characters. Original on sec.gov · Markdown · JSON
Cover and table of contents
10-K 1 d661459d10k.htm 10-K
Table of Contents
UNITED STATES SECURITIES AND EXCHANGE COMMISSION
Washington, DC 20549
FORM 10-K
| þ | Annual Report Pursuant to Section 13 or 15(d) of the Securities Exchange Act of 1934 |
|---|
| For the fiscal year ended February 1, 2014 |
|---|
or
| ¨ | Transition Report Pursuant to Section 13 or 15(d) of the Securities Exchange Act of 1934 |
|---|
| For the transition period from to |
|---|
Commission File Number: 001-33764
ULTA SALON, COSMETICS & FRAGRANCE, INC.
(Exact name of Registrant as specified in its charter)
| Delaware (State or other jurisdiction of incorporation or organization) | 36-3685240 (I.R.S. Employer Identification No.) | |
| 1000 Remington Blvd., Suite 120 Bolingbrook, Illinois (Address of principal executive offices) | 60440 (Zip code) |
Registrant’s telephone number, including area code: (630) 410-4800
Securities registered pursuant to Section 12(b) of the Act:
| Title of each class | Name of each exchange on which registered | |
| Common stock, par value $0.01 per share | The NASDAQ Global Select Market |
Securities registered pursuant to Section 12(g) of the Act: None
Indicate by check mark if the registrant is a well-known seasoned issuer, as defined in Rule 405 of the Securities Act. þ Yes ¨ No
Indicate by check mark if the registrant is not required to file reports pursuant to Section 13 or Section 15(d) of the Act. ¨ Yes þ No
Indicate by check mark whether the registrant (1) has filed all reports required to be filed by Section 13 or 15(d) of the Securities Exchange Act of 1934 during the preceding 12 months (or for such shorter period that the registrant was required to file such reports), and (2) has been subject to such filing requirements for the past 90 days. þ Yes ¨ No
Indicate by check mark whether the registrant has submitted electronically and posted on its corporate Web site, if any, every Interactive Data File required to be submitted and posted pursuant to Rule 405 of Regulation S-T (§ 232.405 of this chapter) during the preceding 12 months (or for such shorter period that the registrant was required to submit and post such files). þ Yes ¨ No
Indicate by check mark if disclosure of delinquent filers pursuant to Item 405 of Regulation S-K (§229.405 of this chapter) is not contained herein, and will not be contained, to the best of registrant’s knowledge, in definitive proxy or information statements incorporated by reference in Part III of this Form 10-K or any amendment to this Form 10-K. ¨
Indicate by check mark whether the registrant is a large accelerated filer, an accelerated filer, a non-accelerated filer, or a smaller reporting company. See definitions of “large accelerated filer,” “accelerated filer” and “smaller reporting company” in Rule 12b-2 of the Exchange Act. (Check one):
| Large accelerated filer þ | Accelerated filer ¨ | Non-accelerated filer ¨ | Smaller reporting company ¨ | |||
| (Do not check if a smaller reporting company) |
Indicate by check mark whether the registrant is a shell company (as defined in Rule 12b-2 of the Act). ¨ Yes þ No
The aggregate market value of the voting stock held by non-affiliates of the registrant, based upon the closing sale price of the common stock on August 3, 2013, as reported on the NASDAQ Global Select Market, was approximately $4,815,407,000. Shares of the registrant’s common stock held by each executive officer and director and by each entity or person that, to the registrant’s knowledge, owned 5% or more of the registrant’s outstanding common stock as of August 3, 2013 have been excluded in that such persons may be deemed to be affiliates of the registrant. This determination of affiliate status is not necessarily a conclusive determination for other purposes.
The number of shares of the registrant’s common stock, par value $0.01 per share, outstanding as of March 27, 2014 was 64,295,291 shares.
DOCUMENTS INCORPORATED BY REFERENCE
Information required in response to Part III of Form 10-K (Items 10, 11, 12, 13 and 14) is hereby incorporated by reference to the registrant’s Proxy Statement for the Annual Meeting of Stockholders to be held during the current fiscal year. The Proxy Statement will be filed by the registrant with the SEC no later than 120 days after the close of the fiscal year covered by this Form 10-K.
Table of Contents
ULTA SALON, COSMETICS & FRAGRANCE, INC.
TABLE OF CONTENTS
Table of Contents
FORWARD LOOKING STATEMENTS
This Annual Report on Form 10-K contains forward-looking statements within the meaning of Section 21E of the Securities Exchange Act of 1934, as amended, and the safe harbor provisions of the Private Securities Litigation Reform Act of 1995, which reflect our current views with respect to, among other things, future events and financial performance. You can identify these forward-looking statements by the use of forward-looking words such as “outlook,” “believes,” “expects,” “plans,” “estimates,” or other comparable words. Any forward-looking statements contained in this Form 10-K are based upon our historical performance and on current plans, estimates and expectations. The inclusion of this forward-looking information should not be regarded as a representation by us or any other person that the future plans, estimates or expectations contemplated by us will be achieved. Such forward-looking statements are subject to various risks and uncertainties, which include, without limitation: the impact of weakness in the economy; changes in the overall level of consumer spending; changes in the wholesale cost of our products; the possibility that we may be unable to compete effectively in our highly competitive markets; the possibility that our continued opening of new stores could strain our resources and have a material adverse effect on our business and financial performance; the possibility that new store openings and existing locations may be impacted by developer or co-tenant issues; the possibility that the capacity of our distribution and order fulfillment infrastructure may not be adequate to support our recent growth and expected future growth plans; the possibility of material disruptions to our information systems; weather conditions that could negatively impact sales; our ability to attract and retain key executive personnel; our ability to successfully execute and implement our common stock repurchase program; our ability to sustain our growth plans and successfully develop and implement our long-range strategic and financial plan; and other risk factors detailed in our public filings with the Securities and Exchange Commission (the “SEC”), including risk factors contained in Item 1A, “Risk Factors” of this Annual Report on Form 10-K for the year ended February 1, 2014. We assume no obligation to update any forward-looking statements as a result of new information, future events or developments. References in the following discussion to “we”, “us”, “our”, “the Company”, “Ulta”, “Ulta Beauty” and similar references mean Ulta Salon, Cosmetics & Fragrance, Inc. and its consolidated subsidiary, Ulta Inc. unless otherwise expressly stated or the context otherwise requires.
Part I
Item 1. Business
| --- | --- |
Overview
Ulta Beauty (or Ulta, we, the Company) is the largest beauty retailer that provides one-stop shopping for prestige, mass and salon products and salon services in the United States. We focus on providing affordable indulgence to our customers by combining unmatched product breadth, value and convenience with the distinctive environment and experience of a specialty retailer. Key aspects of our business include:
One-Stop Shopping. Our customers can satisfy all of their beauty needs at Ulta. We offer a unique combination of more than 20,000 prestige and mass beauty products organized by category in a bright, open store environment. The beauty products are arranged in self-service displays and full-service boutiques in a way that encourages our customers to enjoy discovering new products and services. We believe we offer the widest selection of categories across prestige and mass cosmetics, fragrance, haircare, skincare, bath and body products and salon styling tools. We also offer a full-service salon and a wide range of salon haircare products in all of our stores.
Our Value Proposition. We believe our focus on delivering a compelling value proposition to our customers across all of our product categories drives customer loyalty. We offer frequent promotions and coupons, in store events, gift-with-purchase offers, a comprehensive customer loyalty program and targeted promotions through our Customer Relationship Management platform (CRM).
An Off-Mall Location. Our stores are predominantly located in convenient, high-traffic locations such as power centers. Our typical store is approximately 10,000 square feet, including approximately 950 square feet dedicated to our full-service salon. Our store design, fixtures and open layout provide the flexibility to respond to consumer trends and changes in our merchandising strategy.
Table of Contents
We were founded as a Delaware corporation in 1990 as a beauty retailer at a time when prestige, mass and salon products were sold through distinct channels — department stores for prestige products, drug stores and mass merchandisers for mass products and salons and authorized retail outlets for professional hair care products. We developed a unique specialty retail concept combining one-stop shopping, a compelling value proposition, convenient locations and a welcoming shopping environment.
The following description of our business should be read in conjunction with the information contained in our Management’s Discussion and Analysis of Financial Condition and Results of Operations included in Item 7 and the consolidated financial statements included in Item 8 of this Annual Report on Form 10-K.
Our competitive strengths
We believe the following competitive strengths differentiate us and are critical to our success:
D__ifferentiated merchandising strategy with broad appeal. We believe our broad selection of merchandise across categories, price points and brands offers a unique shopping experience for our customers. While the products we sell can be found in department stores, specialty stores, salons, drug stores and mass merchandisers, we offer all of these products in one retail format so that our customers can find everything they need in one shopping trip. We offer more than 500 brands, such as Bare Minerals and Urban Decay prestige cosmetics, Nyx and Maybelline mass cosmetics, Coty and Estée Lauder fragrances, Redken and Matrix haircare, as well as Dermalogica and Philosophy skincare and Clarisonic and Ultra Chi personal care appliances. We also offer private label Ulta products in key categories such as cosmetics, skincare and bath. Because we offer a broad array of products in prestige, mass and salon, we appeal to a wide range of customers including women of all ages, demographics, and lifestyles.
Our unique customer experience. We combine unmatched product breadth, value and convenience with the distinctive environment and experience of a specialty retailer. Our well-trained, non-commissioned beauty advisors provide unbiased and customized advice tailored to our customers’ needs. Our customer service strategy, convenient locations and attractive store design combine to create a unique shopping experience.
L__oyal and active customer base. Approximately thirteen million Ulta customers are members of our loyalty program. We use this valuable proprietary database to drive traffic, better understand our customers’ purchasing patterns and support new store site selection. We regularly employ a broad range of media, including digital, catalogs and newspaper inserts and targeted promotions driven by our CRM platform, to drive traffic to our stores and website.
Strong vendor relationships across product categories. We have strong, active relationships with over 300 vendors, including Bare Minerals, Coty, Estée Lauder, L’Oréal and Procter & Gamble. We believe the scope of these relationships, which span the three beauty categories of prestige, mass and salon and which have taken years to develop, creates a significant impediment for other retailers to replicate our model. We work closely with our vendors to market both new and existing brands in a collaborative manner.
Experienced management team. We have an experienced senior management team that brings a creative merchandising approach and a disciplined operating philosophy to our business. We continue to expand the depth of our management team at all levels and in all functional areas to support our growth.
Five point growth strategy
We intend to expand our presence as a leading retailer of beauty products and salon services by pursuing the following growth strategies:
Growing stores to approximately 1,200 locations. We believe that over the long-term, we have the potential to grow our store base to approximately 1,200 Ulta stores in the United States. Our internal real estate model takes into account a number of variables, including demographic and sociographic data as well as population density relative to maximum drive times, economic and competitive factors. We plan to continue opening stores both in markets in which we currently operate and new markets.
Table of Contents
We opened 127 new stores during fiscal 2013, representing a 22% increase in square footage growth and a 25% increase in the number of new stores opened compared to 102 new stores in fiscal 2012. We also remodeled 7 stores and relocated 4 stores in fiscal 2013. Our fiscal 2013 new store program was comprised of approximately 70% new stores opened in existing shopping centers and 30% in new shopping centers. In fiscal 2013 approximately one third of new stores were in new markets and two thirds were filling in existing markets.
| Fiscal Year | ||||||||||||||||||||
| 2009 | 2010 | 2011 | 2012 | 2013 | ||||||||||||||||
| Total stores beginning of period | 311 | 346 | 389 | 449 | 550 | |||||||||||||||
| Stores opened | 37 | 47 | 61 | 102 | 127 | |||||||||||||||
| Stores closed | (2 | ) | (4 | ) | (1 | ) | (1 | ) | (2 | ) | ||||||||||
| Total stores end of period | 346 | 389 | 449 | 550 | 675 | |||||||||||||||
| Stores remodeled | 6 | 13 | 17 | 21 | 7 | |||||||||||||||
| Total square footage | 3,613,840 | 4,094,808 | 4,747,148 | 5,847,393 | 7,158,286 | |||||||||||||||
| Average square footage per store | 10,445 | 10,526 | 10,573 | 10,632 | 10,605 |
Expanding our offering by adding new products, brands and services. Our strategy is to continue to expand our portfolio of products, brands and services both by capitalizing on the success of our existing vendor relationships and by identifying and developing new vendor relationships. Over the last several years we have added new products from existing vendors across product categories. We have also added a number of new brands in recent years, most notably in our prestige category which is currently the beauty industry’s highest growth category. Fiscal 2013 brand additions included IT Cosmetics, Lipstick Queen, Mally, Meaningful Beauty and Perricone. We continue to roll out Clinique and Lancôme boutiques, ending the year with 100 stores with Clinique boutiques and 105 stores with Lancôme boutiques. We also offer haircare services in our full service salons as well as skin and brow services in most of our stores. We plan to establish Ulta as a leading salon authority by providing high quality and consistent services from our licensed stylists and by expanding our portfolio of services.
Enhancing our successful loyalty program. We have approximately thirteen million active Ulta customers who are enrolled in our loyalty program. Loyalty member transactions represent approximately 80% of our annual total net sales, and the transaction data demonstrates that loyalty members shop with higher frequency and spend more per visit as compared to non-members. In early fiscal 2014, we converted all of our loyalty customers to ULTAmate Rewards, a points-based program. The customer data captured by our loyalty program, together with our CRM platform, also enables customer segmentation and one-on-one marketing communications tailored to our customers’ unique beauty needs. We believe our loyalty program combined with our growing CRM capabilities provide significant long-term opportunity for Ulta.
Broadening our marketing reach. We believe our marketing initiatives are a key component of our success, providing an effective means to introduce new products, brands and services to our existing and potential new customers. We have historically utilized primarily direct mail advertising, catalogs and newspaper inserts to communicate with our customers. We plan to continue to leverage our print marketing while expanding our reach into other marketing channels, including digital marketing, social media and e-mail marketing. In addition, we continue to enhance in-store marketing and special events to educate customers and drive traffic. We plan to continue to focus on our in-store marketing and in-store special events as an additional means of educating our customers and increasing the frequency of their visits to our stores. We believe Ulta has a significant opportunity to attract new customers to our stores and website and we expect to increase our marketing efforts to drive greater awareness of our brand.
Expanding our digital business. Our e-commerce platform serves two roles: to generate direct channel sales and profits and to communicate with our customers in an interactive, enjoyable way to reinforce the Ulta brand and drive traffic to our stores and website. We continue to aggressively develop and add new website features and functionality, marketing programs, product assortment, new brands and multi-channel integration points. We intend to establish ourselves as a leading online beauty resource by providing our customers with a rich online
Table of Contents
experience for information on key trends and products, editorial content, expanded assortments, best in class features and functionality and social media content. In 2013 we re-launched ulta.com with enhanced content and capabilities and believe we are well positioned to capitalize on the growth of e-commerce sales of beauty products. We believe our website and retail stores provide our customers with an integrated shopping experience and increased flexibility for their beauty buying needs.
Our market
We operate within the large and growing U.S. beauty products and salon services industry. This market represents approximately $113 billion in retail sales, according to Euromonitor International and IBIS World Inc. The approximately $65 billion beauty products industry includes color cosmetics, haircare, fragrance, bath and body, skincare, salon styling tools and other toiletries. Within this market, we compete across all major categories as well as a range of price points by offering prestige, mass and salon products. The approximately $48 billion salon services industry consists of hair, skin and nail services.
Competition
Our major competitors for prestige and mass products include traditional department stores such as Macy’s and Nordstrom, specialty stores such as Sephora and Bath & Body Works, drug stores such as CVS/pharmacy and Walgreens, mass merchandisers such as Target and Wal-Mart and the online businesses of the aforementioned retailers as well as pure play e-commerce business such as Amazon. Our competitive advantages are the quality and assortment of merchandise and services, our value proposition, the quality of our customers’ shopping experience and the convenience of our stores and website as one-stop destinations for beauty products.
The market for salon services and products is highly fragmented. Our competitors for salon services and products include Regis, Sally Beauty, JCPenney salons and independent salons.
Stores
Our stores are predominantly located in convenient, high-traffic locations such as power centers. Our typical store is approximately 10,000 square feet, including approximately 950 square feet dedicated to our full-service salon. We opened 127 (125 net of closings) stores in fiscal 2013 and the average investment required to open a new Ulta store is approximately $1.0 million, which includes capital investments, net of landlord contributions, pre-opening expenses, and initial inventory, net of payables. Our net investment required to open new stores and the net sales generated by new stores may vary depending on a number of factors, including geographic location. We expect the net investment to open a new store in 2014 to increase due to increases in material and labor costs resulting from a stronger commercial and residential building environment compared to the last several years. As of February 1, 2014, we operated 675 stores in 46 states.
Store remodel program
Our retail store concept, including physical layout, displays, lighting and quality of finishes, has evolved over time to match the rising expectations of our customers and to keep pace with our merchandising and operating strategies. We have a formal store remodel program in place to update our older stores to provide a consistent shopping experience across all of our locations. We remodeled 7 stores in fiscal 2013. Approximately 95% of our store base features our most current store design. The average investment to remodel a store in fiscal 2013 was approximately $1.2 million. Each remodel takes approximately three months to complete, during which time we generally keep the store open.
Salon
We operate full-service salons in all of our stores. Our current Ulta store format includes an open and modern salon area with approximately eight to ten stations. The entire salon area is approximately 950 square feet with a concierge desk, skin treatment room or dedicated skin treatment area, semi-private shampoo and hair color processing areas. Each salon is a full-service salon offering haircuts, hair coloring and permanent texture, with
Table of Contents
most salons also providing facials and waxing. We continue to expand our service offering, adding services, such as gel manicures, microdermabrasion and hair extensions, to select locations. We employ licensed professional stylists and estheticians who offer highly skilled services as well as an educational experience, including consultations, styling lessons, skincare regimens, and at-home care recommendations.
Ulta.com
Our e-commerce business represented approximately 4% of our total sales and grew 74% in fiscal 2013. Ulta.com supports the key elements of our brand proposition and provides access to more than 18,000 beauty products from hundreds of brands. With the new e-commerce platform launched in 2013, we expect Ulta.com to become an even greater element in our marketing programs and a more important resource for our customers to access product and store information, beauty trends and techniques and buy from a larger assortment of product offerings. We are confident our e-commerce business will continue to deliver rapid growth in in the future, but will likely begin to moderate off a larger base. During 2013 we expanded our e-commerce distribution capabilities by adding fulfillment to the Chambersburg, Pennsylvania distribution center.
Merchandising
Strategy
We focus on offering one of the most extensive product and brand selections in our industry, including a broad assortment of branded and private label beauty products in cosmetics, fragrance, haircare, skincare, bath and body products and salon styling tools. A typical Ulta store carries more than 20,000 prestige and mass beauty products. We present these products in an assisted self-service environment using centrally produced planograms (detailed schematics showing product placement in the store) and promotional merchandising planners. Our merchandising team continually monitors current fashion trends, historical sales trends and new product launches to keep Ulta’s product assortment fresh and relevant to our customers. We believe our broad selection of merchandise, from moderate-priced brands to higher-end prestige brands, offers a unique shopping experience for our customers. Many of the products we sell can also be found in department stores, specialty stores, salons, mass merchandisers and drug stores, but we offer all of these products so that our customers can find everything they need in one stop. We believe we offer a compelling value proposition to our customers across all of our product categories. We offer frequent promotions and coupons, in store events, gift-with-purchase offers, a comprehensive customer loyalty program and targeted promotions through our CRM platform.
We believe our private label products are a strategically important category for growth and profit contribution. Our objective is to provide quality, trend-right private label products to continue to strengthen our customers’ perception of Ulta as a contemporary beauty destination. Ulta manages the full development cycle of these products from concept through production in order to deliver differentiated packaging and formulas to build brand image. Current Ulta cosmetics and bath brands have a strong following and we may expand our private label products into additional categories. Ulta brand products represented approximately 5% of total company sales in fiscal 2013.
Category mix
We offer products in the following categories:
| Ÿ | Cosmetics, which includes products for the face, eyes, cheeks, lips and nails; |
|---|
| Ÿ | Haircare, which includes shampoos, conditioners, styling products, and hair accessories; |
|---|
| Ÿ | Salon styling tools, which includes hair dryers, curling irons and flat irons; |
|---|
| Ÿ | Skincare and bath and body, which includes products for the face, hands and body; |
|---|
| Ÿ | Fragrance; |
|---|
| Ÿ | Nail polish and nailcare products; |
|---|
| Ÿ | Men’s skincare, haircare and fragrance products; |
|---|
Table of Contents
| Ÿ | Private label, consisting of Ulta branded cosmetics, skincare, bath and body products and haircare; and |
|---|
| Ÿ | Other, including candles, home fragrance products and other health and beauty products. |
|---|
Organization
Our merchandising team consists of a Chief Merchandising Officer overseeing a team of category Vice Presidents and their team of buyers. Our merchandising team works with our centralized merchandise planning and forecasting group to ensure a consistent execution across our store base and e-commerce platform.
Our planogram department assists the merchants and replenishment team to keep new products flowing into stores on a timely basis. All major product categories undergo planogram revisions on a regular basis and adjustments are made to assortment mix and product placement based on current sales trends.
Our visual department works with our merchandising team on strategic placement of promotional merchandise, along with functional and educational signage and creative product presentation standards, in all of our stores. All stores receive a centrally produced promotional planner to ensure consistent implementation of our marketing programs.
Planning and allocation
We have developed a disciplined approach to buying and a dynamic inventory planning and allocation process to support our merchandising strategy. We centrally manage product replenishment to our stores through our merchandise planning group. This group serves as a strategic partner to, and provides financial oversight of, the merchandising team. The merchandising team creates a sales forecast by category for the year. Our merchandise planning group creates an open-to-buy plan, approved by senior executives, for each product category. The open-to-buy plan is updated weekly with point-of-sale (POS) data, receipts and inventory levels and is used throughout the year to balance buying opportunities and inventory return on investment. We believe this structure maximizes our buying opportunities while maintaining organizational and financial control. Regularly replenished products are presented consistently in all stores utilizing a merchandising planogram process. POS data is used to calculate sales forecasts and to determine replenishment levels. We determine promotional product replenishment levels using sales histories from similar or comparable events. To ensure our inventory remains productive, our planning and replenishment group, along with senior executives, monitor the levels of clearance and aged inventory in our stores on a weekly basis.
Vendor relationships
We have close relationships with our more than 300 vendors. Our top ten vendors represented approximately 51% of our total annual sales in fiscal 2013. These include vendors across all product categories, such as Bare Minerals, Coty, Estée Lauder, L’Oréal and Procter & Gamble, among others. We believe our vendors view us as a significant distribution channel for growth and brand enhancement.
Marketing and advertising
Marketing strategy
We employ a multi-faceted marketing strategy to increase brand awareness, drive traffic to our stores and website, acquire new customers, improve customer retention and increase frequency of shopping. We communicate with our customers and prospective customers through multiple vehicles. Our primary marketing expenditure is in direct mail catalogs and free-standing newspaper inserts which highlight the breadth of our selection of prestige, mass and salon beauty products, new products and services and special offers. We execute a comprehensive public relations strategy to enhance Ulta’s reputation as a beauty destination, increase brand awareness, support our charitable efforts on behalf of The Breast Cancer Research Foundation and drive awareness of new products, in-store events and new store openings.
Our loyalty program is an important tool to increase retention of existing customers and to enhance their loyalty to the Ulta brand. Approximately thirteen million active customers are enrolled in this loyalty program, generating approximately 80% of Ulta’s annual total net sales. In early fiscal 2014, we converted all of our
Table of Contents
loyalty customers to ULTAmate Rewards, a points-based program. ULTAmate Rewards enables customers to earn points based on their purchases. Points earned are valid for at least one year and may be redeemed on any product we sell. In late 2012 we implemented the new CRM solution to enable more sophisticated mining of the customer data in our loyalty member database as well as greater personalization of our marketing. Throughout 2013 we built upon our CRM capabilities to deliver targeted marketing campaigns to our loyalty program members.
A growing percentage of our marketing expense was directed at our digital marketing strategy as a highly effective channel to communicate with existing customers and reach customers who are not familiar with Ulta or who have not yet shopped with us. Our online marketing strategy includes search engine optimization, paid search, mobile advertising, affiliate relationships, such as online coupons sites, social media, display advertising, and other digital marketing channels. Ulta’s email marketing programs are effective in communicating with online and retail customers and driving sales.
Staffing and operations
Retail
Our current Ulta store format is staffed with a general manager, a salon manager, two associate managers, one part time manager, and approximately twenty full and part-time associates, including approximately six to eight prestige consultants and eight to ten licensed salon professionals. The management team in each store reports to the general manager. The general manager oversees all store activities including salon management, inventory management, merchandising, cash management, scheduling, hiring and guest services. Members of store management receive bonuses depending on their position and based upon various metrics. Each general manager reports to a district manager, who in turn reports to a Regional Vice President of Operations who in turn reports to the Senior Vice President of Operations who in turn reports to our Chief Executive Officer. Each store team receives additional support from time to time from recruiting specialists for the retail and salon operations, regionally based human resource managers, a field loss prevention team, salon technical trainers, management trainers and vendors.
Ulta stores are open seven days a week, eleven hours a day, Monday through Saturday, and seven hours on Sunday. Our stores have extended hours during the holiday season.
Salon
A typical salon is staffed with eight to ten licensed salon professionals, including a salon manager, six stylists, and one or two estheticians. Our most productive salons have a guest coordinator and an assistant manager. Our salon technical trainers and vendor education classes create a comprehensive educational program for approximately 5,000 Ulta salon professionals.
Training and development
Our success is dependent in part on our ability to attract, train, retain and motivate qualified associates at all levels of the organization. We have developed a corporate culture that enables individual store managers to make store-level operating decisions and consistently rewards their success. We are committed to continually developing our associates and providing career advancement opportunities. Our associates and management teams are essential to our store expansion strategy. We use a combination of existing managers, promoted associates and outside hires to support our new stores.
All of our associates participate in an interactive new-hire orientation through which each associate becomes acquainted with Ulta’s purpose and values. Training for new store managers, prestige consultants and sales associates familiarizes them with our beauty products, opening and closing routines, guest service expectations, our loss prevention policy and procedures, and our culture. We provide continuing education to salon professionals and retail associates throughout their careers at Ulta. Our learning management system allows us to provide ongoing training to all associates to continually enhance their product knowledge, technical skills and guest service expertise. In contrast to the sales teams at traditional department stores, our retail sales teams are
Table of Contents
not commissioned. Our prestige consultants are trained to work across all prestige lines and within our prestige boutiques, where customers can receive makeup demonstrations and skin analysis.
Distribution
We operate three distribution facilities. The first facility, located in Romeoville, Illinois, is approximately 317,000 square feet in size, including an overflow facility. The second distribution facility is in Phoenix, Arizona and is approximately 437,000 square feet in size. The third distribution center, located in Chambersburg, Pennsylvania, opened in April 2012. The Chambersburg warehouse contains approximately 373,000 square feet. We are embarking on a multi-year supply chain project beginning in 2014 which will include adding additional capacity, including a fourth distribution center expected to open in 2015, and system improvements to support expanded omni-channel capabilities.
Inventory is shipped from our suppliers to our distribution facilities. We carry more than 20,000 products and replenish our stores with such products primarily in eaches (i.e., less-than-case quantities), which allows us to ship less than an entire case when only one or two of a particular product is required. Our distribution facilities use warehouse management and warehouse control software systems to maintain and support product purchase decisions. Store replenishment order selection is performed using pick-to-light processing technologies. Product is delivered to stores using a broad network of contract and local pool (final mile) carriers. We fulfill e-commerce orders from our Romeoville, Illinois and Chambersburg, Pennsylvania distribution centers.
Information technology
We are committed to using technology to enhance our competitive position. We depend on a variety of information systems and technologies to maintain and improve our competitive position and to manage the operations of our growing store base. We rely on computer systems to provide information for all areas of our business, including supply chain, merchandising, POS, e-commerce, finance, accounting and human resources. Our core business systems consist mostly of purchased software programs that integrate with our internally developed software solutions. Our technology also includes a company-wide network that connects all corporate users, stores, and our distribution infrastructure and provides communications for credit card and daily polling of sales and merchandise movement at the store level. We intend to leverage our technology infrastructure and systems where appropriate to gain operational efficiencies through more effective use of our systems, people and processes. We update the technology supporting our stores, distribution infrastructure and corporate headquarters on a regular basis. We will continue to make investments in our information systems to facilitate our growth and enable us to enhance our competitive position.
Intellectual property
We have registered over 30 trademarks in the United States and other countries. The majority of our trademark registrations contain the ULTA mark, including Ulta Salon Cosmetics Fragrance (and design), Ulta.com, and Ulta Beauty and two related designs. We maintain our marks on a docket system to monitor filing deadlines for renewal and continued validity. All marks that are deemed material to our business have been applied for or registered in the United States and select foreign countries, including Canada.
We believe our trademarks, especially those related to the Ulta brand, have significant value and are important to building brand recognition.
Government regulation
We are affected by extensive U.S. laws, governmental regulations, administrative determinations, court decisions and similar constraints. Such laws, regulations and other constraints may exist at the federal, state or local levels in the United States. The cosmetic, dietary supplement, food and over-the-counter (OTC) drug products we sell in our stores, including our Ulta branded products, are subject to regulation by the Food and Drug Administration (FDA), the Federal Trade Commission (FTC) and State Attorneys General (AG) in the United States. Such regulations principally relate to the safety of ingredients, proper labeling, manufacturing, advertising, packaging and distribution of the products.
Table of Contents
Products classified as cosmetics (as defined in the Food, Drug and Cosmetic (FDC) Act) are not subject to pre-market approval by the FDA, but the products and the ingredients must generally be safe and must be properly manufactured and labeled. Certain products, such as sunscreens and acne treatments, are classified as OTC drugs, and certain ingestible products, such as vitamins and minerals, are classified as dietary supplements. Both OTC drugs and dietary supplements have specific ingredients, labeling and manufacturing requirements. The labeling of these products is subject to the requirements of the FDC Act and the Fair Packaging and Labeling Act. Further, claims we make in advertising, including claims about the safety or efficacy of products, pricing claims and environmental claims, are subject to regulation by the FTC and State AG’s who generally prohibit deceptive practices.
The government regulations that most impact our day-to-day operations are the labor and employment and taxation laws to which most retailers are typically subject. We are also subject to typical zoning and real estate land use restrictions and typical advertising and consumer protection laws (both federal and state). Our salon business is subject to state board regulations and state licensing requirements for our stylists and our salon procedures.
In our store leases, we require our landlords to obtain all necessary zoning approvals and permits for the site to be used as a retail site and we also ask them to obtain any zoning approvals and permits for our specific use (but at times the responsibility for obtaining zoning approvals and permits for our specific use falls to us). We require our landlords to deliver a certificate of occupancy for any work they perform on our buildings or the shopping centers in which our stores are located. We are responsible for delivering a certificate of occupancy for any remodeling or build-outs that we perform and are responsible for complying with all applicable laws in connection with such construction projects or build-outs.
Employees
As of February 1, 2014, we employed approximately 6,900 people on a full-time basis and approximately 12,700 on a part-time basis. We have no collective bargaining agreements. We have not experienced any work stoppages and believe we have good relationships with our employees.
Available Information
Our principal website address is www.ulta.com. We make available at this address under investor relations (at http://ir.ulta.com), free of charge, our proxy statement, annual report to shareholders, annual report on Form 10-K, quarterly reports on Form 10-Q, current reports on Form 8-K, and all amendments to those reports as soon as reasonably practicable after such material is electronically filed with or furnished to the SEC. Information available on our website is not incorporated by reference in and is not deemed a part of this Form 10-K. In addition, our filings with the SEC may be accessed through the SEC’s Electronic Data Gathering, Analysis and Retrieval (EDGAR) system at www.sec.gov. You may read and copy any filed document at the SEC’s public reference rooms in Washington, D.C. at 100 F Street, N.E., Washington, D.C. 20549. Please call the SEC at 1-800-SEC-0330 for further information about the public reference rooms. All statements made in any of our securities filings, including all forward-looking statements or information, are made as of the date of the document in which the statement is included, and we do not assume or undertake any obligation to update any of those statements or documents unless we are required to do so by law.
Table of Contents
Item 1A. Risk Factors
| --- | --- |
Investment in our common stock involves a high degree of risk and uncertainty. You should carefully consider the following risks and all of the other information contained in this Form 10-K before making an investment decision. If any of the following risks occur, our business, financial condition, results of operations or future growth could suffer. In these circumstances, the market price of our common stock could decline, and you may lose all or part of your investment.
The health of the economy in the channels we serve may affect consumer purchases of discretionary items such as beauty products and salon services, which could have a material adverse effect on our business, financial condition, profitability and cash flows. In addition, the recent global economic crisis and volatility in global economic conditions and the financial markets may adversely affect our business, financial condition, profitability, and cash flows.
Our results of operations may be materially affected by conditions in the global capital markets and the economy generally, both in the U.S. and internationally. Concerns over inflation, employment, tax laws, energy costs, healthcare costs, geopolitical issues, terrorism, the availability and cost of credit, the mortgage market, sovereign and private banking systems, sovereign deficits and increasing debt burdens and the real estate and other financial markets in the U.S. and Europe have contributed to increased volatility and diminished expectations for the U.S. and certain foreign economies. We appeal to a wide demographic consumer profile and offer an extensive selection of beauty products sold directly to retail consumers and premium salon services. Continued uncertainty in the economy could adversely impact consumer purchases of discretionary items across all of our product categories, including prestige beauty products and premium salon services. Factors that could affect consumers’ willingness to make such discretionary purchases include: general business conditions, levels of employment, interest rates, tax rates, the availability of consumer credit and consumer confidence in future economic conditions. In the event of a prolonged economic downturn or acute recession, consumer spending habits could be adversely affected and we could experience lower than expected net sales.
In addition, the recent global economic crisis and volatility and disruption to the capital and credit markets have had a significant, adverse impact on global economic conditions, resulting in recessionary pressures and declines in consumer confidence and economic growth. While these declines have moderated, the level of consumer spending is not where it was prior to the global recession, and economic conditions could lead to further declines in consumer spending in the future. Additionally, there can be no assurance that various governmental activities to stabilize the markets and stimulate the economy will restore consumer confidence or change spending habits. Reduced consumer spending could cause changes in customer order patterns and changes in the level of merchandise purchased by our customers, and may signify a reset of consumer spending habits, all of which may adversely affect our business, financial condition, profitability and cash flows.
Recent economic conditions have also resulted in a tightening of the credit markets, including lending by financial institutions, which is a source of capital for our borrowing and liquidity. This tightening of the credit markets has increased the cost of capital and reduced the availability of credit. Concern about the stability of the markets generally and the strength of counterparties specifically has led many lenders and institutional investors to reduce, and in some cases, cease to provide credit to businesses and consumers. These factors have led to a decrease in spending by businesses and consumers alike, and a corresponding decrease in global infrastructure spending. While global credit and financial markets appear to be recovering from extreme disruptions experienced over the past few years, uncertainty about continuing economic stability remains. It is difficult to predict how long the current economic and capital and credit market conditions will continue, the extent to which they will continue to recover, if at all, and which aspects of our products or business may be adversely affected. Current market and credit conditions could continue to make it more difficult for developers and landlords to obtain the necessary credit to build new retail centers. A significant decrease in new retail center development could limit our future growth opportunities as long as the aforementioned conditions exist.
Additionally, the general deterioration in economic conditions could adversely affect our commercial partners including our product vendors as well as the real estate developers and landlords who we rely on to construct and operate centers in which our stores are located. A bankruptcy or financial failure of a significant vendor or a
Table of Contents
number of significant real estate developers or shopping center landlords could have a material adverse effect on our business, financial condition, profitability, and cash flows.
We may be unable to compete effectively in our highly competitive markets.
The markets for beauty products and salon services are highly competitive with few barriers to entry even when economic conditions are favorable. We compete against a diverse group of retailers, both small and large, including regional and national department stores, specialty retailers, drug stores, mass merchandisers, high-end and discount salon chains, locally owned beauty retailers and salons, Internet businesses, catalog retailers and direct response television, including television home shopping retailers and infomercials. We believe the principal bases upon which we compete are the breadth of merchandise, our value proposition, the quality of our customers’ shopping experience and the convenience of our stores as one-stop destinations for beauty products and salon services. Many of our competitors are, and many of our potential competitors may be, larger and have greater financial, marketing and other resources and therefore may be able to adapt to changes in customer requirements more quickly, devote greater resources to the marketing and sale of their products, generate greater national brand recognition or adopt more aggressive pricing policies than we can. As a result, we may lose market share, which could have a material adverse effect on our business, financial condition, profitability and cash flows.
If we are unable to gauge beauty trends and react to changing consumer preferences in a timely manner, our sales will decrease.
We believe our success depends in substantial part on our ability to:
| Ÿ | recognize and define product and beauty trends; |
|---|
| Ÿ | anticipate, gauge and react to changing consumer demands in a timely manner; |
|---|
| Ÿ | translate market trends into appropriate, saleable product and service offerings in our stores and salons in advance of our competitors; |
|---|
| Ÿ | develop and maintain vendor relationships that provide us access to the newest merchandise on reasonable terms; and |
|---|
| Ÿ | distribute merchandise to our stores in an efficient and effective manner and maintain appropriate in-stock levels. |
|---|
If we are unable to anticipate and fulfill the merchandise needs of the regions in which we operate, our net sales may decrease and we may be forced to increase markdowns of slow-moving merchandise, either of which could have a material adverse effect on our business, financial condition, profitability and cash flows.
**_If we fail to retain our exi
Showing the first 8K of 62K characters. Open the full section
Item 1B. Unresolved Staff Comments
Item 2. Properties
| --- | --- |
All of our retail stores, corporate offices and distribution and warehouse facilities are leased or subleased. Our retail stores are predominantly located in convenient, high-traffic, locations such as power centers. Our typical store is approximately 10,000 square feet, including approximately 950 square feet dedicated to our full-service salon. Most of our retail store leases provide for a fixed minimum annual rent and generally have a 10-year initial term with options for two or three extension periods of five years each, exercisable at our option. As of February 1, 2014, we operated 675 retail stores in 46 states, as shown in the table below:
| State | Number of stores | |||
| Alabama | 11 | |||
| Arizona | 23 | |||
| Arkansas | 5 | |||
| California | 73 | |||
| Colorado | 13 | |||
| Connecticut | 7 | |||
| Delaware | 1 | |||
| Florida | 45 | |||
| Georgia | 24 | |||
| Idaho | 4 | |||
| Illinois | 44 | |||
| Indiana | 13 | |||
| Iowa | 6 | |||
| Kansas | 4 | |||
| Kentucky | 8 | |||
| Louisiana | 11 | |||
| Maine | 3 | |||
| Maryland | 12 | |||
| Massachusetts | 8 | |||
| Michigan | 34 | |||
| Minnesota | 11 | |||
| Mississippi | 5 | |||
| Missouri | 15 | |||
| Montana | 4 | |||
| Nebraska | 3 | |||
| Nevada | 7 | |||
| New Hampshire | 4 | |||
| New Jersey | 16 | |||
| New Mexico | 2 | |||
| New York | 22 | |||
| North Carolina | 21 | |||
| North Dakota | 1 | |||
| Ohio | 26 | |||
| Oklahoma | 8 | |||
| Oregon | 8 | |||
| Pennsylvania | 23 | |||
| Rhode Island | 2 | |||
| South Carolina | 12 | |||
| South Dakota | 2 | |||
| Tennessee | 10 | |||
| Texas | 72 | |||
| Utah | 7 | |||
| Virginia | 19 | |||
| Washington | 13 | |||
| West Virginia | 2 | |||
| Wisconsin | 11 | |||
| Total | 675 |
Table of Contents
As of February 1, 2014, we operated three distribution facilitates located in Romeoville, Illinois, Phoenix, Arizona and Chambersburg, Pennsylvania. The Romeoville warehouse contains approximately 317,000 square feet, including an overflow facility. The lease for the Romeoville warehouse expires on April 30, 2017. The Phoenix warehouse contains approximately 437,000 square feet. The lease for the Phoenix warehouse expires on March 31, 2019 and has three renewal options with terms of five years each. The Chambersburg warehouse contains approximately 373,000 square feet. The lease for the Chambersburg warehouse expires on March 31, 2027 and has three renewal options with terms of five years each.
We are embarking on a multi-year supply chain project beginning in 2014 which will include adding additional capacity, including a fourth distribution center expected to open in 2015, and system improvements to support expanded omni-channel capabilities.
Our principal executive office is in Bolingbrook, Illinois. The lease for the Bolingbrook office expires on August 31, 2018. In 2013 the Company expanded its office space with an additional 42,000 square feet located at its current headquarters. This additional office space has a lease that will expire September 30, 2016 with an option to extend to August 31, 2018.
Item 3. Legal Proceedings.
| --- | --- |
General litigation — On March 2, 2012, a putative employment class action lawsuit was filed against us and certain unnamed defendants in state court in Los Angeles County, California. On April 12, 2012, the Company removed the case to the United States District Court for the Central District of California. On August 8, 2013, the plaintiff asked the court to certify the proposed class and the Company opposed the plaintiff’s request and is waiting for the court to issue a decision. The plaintiff and members of the proposed class are alleged to be (or to have been) non-exempt hourly employees. The suit alleges that Ulta violated various provisions of the California labor laws and failed to provide plaintiff and members of the proposed class with full meal periods, paid rest breaks, certain wages, overtime compensation and premium pay. The suit seeks to recover damages and penalties as a result of these alleged practices. The Company denies plaintiff’s allegations and is vigorously defending the matter.
We are also involved in various legal proceedings that are incidental to the conduct of our business. In the opinion of management, the amount of any liability with respect to these proceedings, either individually or in the aggregate, will not be material.
Item 4. Mine Safety Disclosures
| --- | --- |
None.
EXECUTIVE OFFICERS OF THE REGISTRANT
The names of our executive officers, their ages and their positions are shown below. On June 24, 2013 we announced the resignation of Dennis K. Eck as Interim Chief Executive Officer of Ulta and the appointment of Mary N. Dillon as our Chief Executive Officer and member of the Board of Directors. Mr. Eck remained a member of the Company’s Board of Directors.
| Name | Age | Position | ||
| Mary N. Dillon | 52 | Chief Executive Officer and member of the Board of Directors | ||
| Scott M. Settersten | 53 | Chief Financial Officer and Assistant Secretary | ||
| Jeffrey J. Childs | 56 | Chief Human Resources Officer | ||
| Robert S. Guttman | 61 | Senior Vice President, General Counsel & Secretary | ||
| David Kimbell | 47 | Chief Marketing Officer | ||
| Jeffrey T. Severts | 43 | Senior Vice President, Marketing | ||
| Janet Taake | 56 | Chief Merchandising Officer |
Table of Contents
There is no family relationship between any of the Directors or executive officers and any other Director or executive officer of Ulta.
Mary N. Dillon. Ms. Dillon was named Chief Executive Officer effective July 2013. Prior to joining Ulta Beauty, she was President and Chief Executive Officer and a Director of U.S. Cellular since June 2010. From 2005 to 2010, Ms. Dillon served as Global Chief Marketing Officer and Executive Vice President for McDonald’s Corporation. Prior to joining McDonald’s Corporation, she held various positions at PepsiCo, including President of the Quaker Foods division. Ms. Dillon served as a member of the Board of Directors for Target Corporation from 2007 to 2013.
Scott M. Settersten. Mr. Settersten was named Chief Financial Officer and Assistant Secretary in March 2013 after having previously served as Acting Chief Financial Officer and Assistant Secretary since October 18, 2012. Prior to this role, Mr. Settersten served as Vice President of Accounting since 2010 and was responsible for accounting, tax, external reporting and investor relations. He joined Ulta Beauty in January 2005 as a Director of Financial Reporting. Prior to joining Ulta Beauty, Mr. Settersten spent 15 years with Pricewaterhouse Coopers LLP as a certified public accountant serving in various senior manager roles in the assurance and risk management practices.
Jeffrey J. Childs. Mr. Childs was named Chief Human Resource Officer in October 2013. Prior to joining Ulta Beauty, he was Executive Vice President and Chief Human Resource Officer at U.S. Cellular after joining as Senior Vice President of Human Resources in 2004. From 2001 to 2004, he was President and Owner of Childs Consulting Services. Previously, he served from 1979 to 2001 in a variety of human resources, marketing, sales, and operations roles at AT&T, including Vice President, Human Resources and Corporate Services.
Robert S. Guttman. Mr. Guttman has been our Senior Vice President, General Counsel & Secretary since August 2007. Prior to joining Ulta, Mr. Guttman was Vice President, General Counsel and Secretary of The Reynolds and Reynolds Company from August 2005 to October 2006. From 2000 to 2005, Mr. Guttman served as Senior Vice President, General Counsel and Secretary of CCC Information Services, Inc. Prior to that time, Mr. Guttman was an Associate General Counsel with Sears, Roebuck and Co., having served in various positions as a lawyer with Sears from 1986 to 2000.
David Kimbell. Mr. Kimbell was named Chief Marketing Officer in February 2014. Prior to joining Ulta Beauty, he was Chief Marketing Officer and Executive Vice President at U.S. Cellular since February 2011. From 2008 to 2011, Mr. Kimbell served as Chief Marketing Officer and Senior Vice President of Seventh Generation, a producer of environmentally friendly household and baby care products. Prior to that from 2001 to 2008, Mr. Kimbell held various positions at PepsiCo, Quaker Food Division, including Vice President of Marketing. Mr. Kimbell held a number of marketing roles for several brands at The Procter and Gamble Company from 1995 to 2001.
Jeffrey T. Severts. Mr. Severts has served as Senior Vice President, Marketing since November 2012. Prior to joining Ulta Beauty, he was the Chief Marketing & Services Officer for Best Buy Europe since June 2010. Prior to his role with Best Buy Europe, he held numerous other senior marketing and management roles with Best Buy USA since 2001. Before that time, Mr. Severts served as Vice President of Marketing and Management for Techies.Com, Inc. from 1999 to 2001. Mr. Severts held a number of marketing roles for several brands at General Mills, Inc. from 1992 to 1999.
Janet Taake. Ms. Taake was named Chief Merchandising Officer in January 2014, after serving as Senior Vice President – Merchandising since December 2008. Prior to joining Ulta Beauty, Ms. Taake was Senior Vice President and Chief Merchandising Officer for Babies R Us from 2006 to 2008. From 2004 to 2006, Ms. Taake served as Vice President and General Merchandise Manager – Home Fashions for Sears Corporation. From 1998 to 2006, she served in various senior merchandise management roles with Mervyn’s (Target Corporation). Prior to 1998, Ms. Taake served in senior merchandise management and buyer roles with various national and regional retailers.
Table of Contents
Part II
Item 5. Market for Registrant’s Common Equity, Related Stockholder Matters and Issuer Purchases of Equity Securities
| --- | --- |
Market Information
Our common stock has traded on the NASDAQ Global Select Market under the symbol “Ulta” since October 25, 2007. Our initial public offering was priced at $18.00 per share. The following table sets forth the high and low sales prices for our common stock on the NASDAQ Global Select Market during fiscal years 2013 and 2012:
| Fiscal Year 2013 | High | Low | ||||||
| First quarter | $ | 99.66 | $ | 73.96 | ||||
| Second quarter | 103.47 | 84.13 | ||||||
| Third quarter | 128.85 | 97.24 | ||||||
| Fourth quarter | 131.50 | 80.93 |
| Fiscal Year 2012 | High | Low | ||||||
| First quarter | $ | 95.56 | $ | 76.15 | ||||
| Second quarter | 97.70 | 83.78 | ||||||
| Third quarter | 101.54 | 83.74 | ||||||
| Fourth quarter | 101.99 | 86.93 |
Holders of the Registrant’s Common Stock
The last reported sale price of our common stock on the NASDAQ Global Select Market on March 27, 2014 was $98.75 per share. As of March 27, 2014, we had 56 holders of record of our common stock. Because many shares of common stock are held by brokers and other institutions on behalf of stockholders, we are unable to estimate the total number of stockholders represented by these record holders.
Dividends
On March 8, 2012, we announced that our Board of Directors had declared a $1.00 per share special cash dividend to shareholders of record as of the close of business on March 20, 2012. The special cash dividend, totaling $62.5 million, was paid on May 15, 2012.
Our Board of Directors may determine future dividends after giving consideration to our levels of profit and cash flow, capital requirements, current and future liquidity, restrictions as part of our credit facility as well as financial and other conditions existing at the time.
Purchases of Equity Securities by the Issuer and Affiliated Purchasers
On March 18, 2013, we announced the approval of a stock repurchase program pursuant to which the Company is authorized to repurchase up to $150 million of the Company’s common stock in the open market, in privately negotiated transactions, or otherwise, at prices that the Company deems appropriate and subject to market conditions, applicable law and other factors deemed relevant in the Company’s sole discretion. The stock repurchase program does not have an expiration date and may be suspended or discontinued at any time. No repurchases of our common stock were completed during the fourth quarter of 2013. As of February 1, 2014, $112.7 million remained available under the $150 million program.
Recent Sales of Unregistered Securities
None.
Table of Contents
Securities Authorized for Issuance Under Equity Compensation Plans
The following table provides information about Ulta common stock that may be issued under our equity compensation plans as of February 1, 2014.
| Plan category | Number of securities to be issued upon exercise of outstanding options, warrants and rights | Weighted-average exercise price of outstanding options, warrants and rights | Number of securities remaining available for future issuance under equity compensation plans | |||||||||
| Equity compensation plans approved by security holders | 1,089,705 | $ | 56.94 | 4,691,043 | ||||||||
| Equity compensation plans not approved by security holders | — | — | — | |||||||||
| Total | 1,089,705 | $ | 56.94 | 4,691,043 | ||||||||
Table of Contents
Stock Performance Graph
The following performance graph and related information shall not be deemed “soliciting material” or to be “filed” with the SEC, nor shall such information be incorporated by reference into any future filing under the Securities Act of 1933 or Securities Exchange Act of 1934, each as amended, except to the extent that we specifically incorporate it by reference into such filing.
Set forth below is a graph comparing the cumulative total stockholder return on Ulta’s common stock with the NASDAQ Global Select Market Composite Index (NQGS) and the S&P Retail Index (RLX) for the period covering January 30, 2009 through the end of Ulta’s fiscal year ended February 1, 2014. The graph assumes an investment of $100 made at the closing of trading on January 30, 2009, in (i) Ulta’s common stock, (ii) the stocks comprising the NQGS and (iii) stocks comprising the RLX. All values assume reinvestment of the full amount of all dividends, if any, into additional shares of the same class of equity securities at the frequency with which dividends are paid on such securities during the applicable time period.
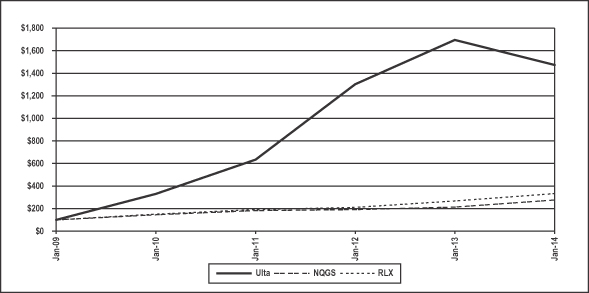
Table of Contents
Item 6. Selected Financial Data
The following table presents our selected consolidated financial data. The table should be read in conjunction with Item 7, “Management’s Discussion and Analysis of Financial Condition and Results of Operations,” and Item 8, “Financial Statements and Supplementary Data,” of this Annual Report on Form 10-K.
| Fiscal year ended(1) | ||||||||||||||||||||
| February 1, 2014 | February 2, 2013 | January 28, 2012 | January 29, 2011 | January 30, 2010 | ||||||||||||||||
| (In thousands, except per share and per square foot data) | ||||||||||||||||||||
| Income statement: | ||||||||||||||||||||
| Net sales(2) | $ | 2,670,573 | $ | 2,220,256 | $ | 1,776,151 | $ | 1,454,838 | $ | 1,222,771 | ||||||||||
| Cost of sales | 1,729,325 | 1,436,582 | 1,159,311 | 970,753 | 846,202 | |||||||||||||||
| Gross profit | 941,248 | 783,674 | 616,840 | 484,085 | 376,569 | |||||||||||||||
| Selling, general and administrative expenses | 596,390 | 488,880 | 410,658 | 358,106 | 302,413 | |||||||||||||||
| Pre-opening expenses | 17,270 | 14,816 | 9,987 | 7,095 | 6,003 | |||||||||||||||
| Operating income | 327,588 | 279,978 | 196,195 | 118,884 | 68,153 | |||||||||||||||
| Interest (income) expense | (118 | ) | 185 | 587 | 755 | 2,202 | ||||||||||||||
| Income before income taxes | 327,706 | 279,793 | 195,608 | 118,129 | 65,951 | |||||||||||||||
| Income tax expense | 124,857 | 107,244 | 75,344 | 47,099 | 26,595 | |||||||||||||||
| Net income | $ | 202,849 | $ | 172,549 | $ | 120,264 | $ | 71,030 | $ | 39,356 | ||||||||||
| Net income per common share: | ||||||||||||||||||||
| Basic | $ | 3.17 | $ | 2.73 | $ | 1.96 | $ | 1.20 | $ | 0.68 | ||||||||||
| Diluted | $ | 3.15 | $ | 2.68 | $ | 1.90 | $ | 1.16 | $ | 0.66 | ||||||||||
| Weighted average common shares outstanding: | ||||||||||||||||||||
| Basic | 63,992 | 63,250 | 61,259 | 58,959 | 57,915 | |||||||||||||||
| Diluted | 64,461 | 64,396 | 63,334 | 61,288 | 59,237 | |||||||||||||||
| Dividends declared per common share | $ | — | $ | 1.00 | $ | — | $ | — | $ | — | ||||||||||
| Other operating data: | ||||||||||||||||||||
| Comparable store sales increase:(3) | ||||||||||||||||||||
| Retail and salon comparable store sales | 6.1 | % | 8.8 | % | 10.9 | % | 11.0 | % | 1.4 | % | ||||||||||
| E-commerce comparable store sales | 76.6 | % | 30.7 | % | 37.8 | % | 76.8 | % | 45.4 | % | ||||||||||
| Total comparable store sales increase | 7.9 | % | 9.3 | % | 11.5 | % | 11.9 | % | 1.9 | % | ||||||||||
| Number of stores end of year | 675 | 550 | 449 | 389 | 346 | |||||||||||||||
| Total square footage end of year | 7,158,286 | 5,847,393 | 4,747,148 | 4,094,808 | 3,613,840 | |||||||||||||||
| Total square footage per store(4) | 10,605 | 10,632 | 10,573 | 10,526 | 10,445 | |||||||||||||||
| Average total square footage(5) | 6,555,960 | 5,315,653 | 4,413,236 | 3,811,597 | 3,459,628 | |||||||||||||||
| Net sales per average total square foot(6) | $ | 407 | $ | 418 | $ | 402 | $ | 382 | $ | 353 | ||||||||||
| Capital expenditures | 226,024 | 188,578 | 128,636 | 97,115 | 68,105 | |||||||||||||||
| Depreciation and amortization | 106,283 | 88,233 | 75,931 | 64,936 | 62,166 | |||||||||||||||
| Balance sheet data: | ||||||||||||||||||||
| Cash and cash equivalents | $ | 419,476 | $ | 320,475 | $ | 253,738 | $ | 111,185 | $ | 4,017 | ||||||||||
| Working capital | 735,886 | 568,257 | 415,377 | 241,032 | 136,417 | |||||||||||||||
| Property and equipment, net | 595,736 | 483,059 | 376,985 | 326,099 | 290,861 | |||||||||||||||
| Total assets | 1,602,727 | 1,275,249 | 957,217 | 730,488 | 553,635 | |||||||||||||||
| Total stockholders’ equity | 1,003,094 | 786,942 | 584,704 | 402,533 | 292,608 |
Table of Contents
| (1) | Our fiscal year-end is the Saturday closest to January 31 based on a 52/53-week year. Each fiscal year consists of four 13-week quarters, with an extra week added onto the fourth quarter every five or six years. |
|---|
| (2) | Fiscal 2012 was a 53-week operating year. The sales for the 53rd week of fiscal 2012 were approximately $55 million. |
|---|
| (3) | Comparable store sales increase reflects sales for stores beginning on the first day of the 14th month of operation. Remodeled stores are included in comparable store sales unless the store was closed for a portion of the current or comparable prior year. |
|---|
| (4) | Total square footage per store is calculated by dividing total square footage at end of year by number of stores at end of year. |
|---|
| (5) | Average total square footage represents a weighted average which reflects the effect of opening stores in different months throughout the year. |
|---|
| (6) | Net sales per average total square foot was calculated by dividing net sales for the year by the average square footage for those stores open during each year. The sales for the 53rd week of fiscal 2012 were approximately $55 million. |
|---|
Item 7. Management’s Discussion and Analysis of Financial Condition and Results of Operations
The following discussion and analysis of our financial condition and results of operations should be read in conjunction with our financial statements and related notes included elsewhere in this Annual Report on Form 10-K. This discussion contains forward-looking statements within the meaning of Section 21E of the Securities Exchange Act of 1934, as amended, and the safe harbor provisions of the Private Securities Litigation Reform Act of 1995, which reflect our current views with respect to, among other things, future events and financial performance. You can identify these forward-looking statements by the use of forward-looking words such as “outlook,” “believes,” “expects,” “plans,” “estimates,” or other comparable words. Any forward-looking statements contained in this Form 10-K are based upon our historical performance and on current plans, estimates and expectations. The inclusion of this forward-looking information should not be regarded as a representation by us or any other person that the future plans, estimates or expectations contemplated by us will be achieved. Such forward-looking statements are subject to various risks and uncertainties, which include, without limitation: the impact of weakness in the economy; changes in the overall level of consumer spending; changes in the wholesale cost of our products; the possibility that we may be unable to compete effectively in our highly competitive markets; the possibility that our continued opening of new stores could strain our resources and have a material adverse effect on our business and financial performance; the possibility that new store openings and existing locations may be impacted by developer or co-tenant issues; the possibility that the capacity of our distribution and order fulfillment infrastructure may not be adequate to support our recent growth and expected future growth plans; the possibility of material disruptions to our information systems; weather conditions that could negatively impact sales; our ability to attract and retain key executive personnel; our ability to successfully execute and implement our common stock repurchase program; our ability to sustain our growth plans and successfully develop and implement our long-range strategic and financial plan; and other risk factors detailed in our public filings with the Securities and Exchange Commission (the “SEC”), including risk factors contained in Item 1A, “Risk Factors” of this Annual Report on Form 10-K for the year ended February 1, 2014. We assume no obligation to update any forward-looking statements as a result of new information, future events or developments. References in the following discussion to “we”, “us”, “our”, “the Company”, “Ulta” and similar references mean Ulta Salon, Cosmetics & Fragrance, Inc. and its consolidated subsidiary, Ulta Inc. unless otherwise expressly stated or the context otherwise requires.
Overview
We were founded in 1990 as a beauty retailer at a time when prestige, mass and salon products were sold through distinct channels – department stores for prestige products, drug stores and mass merchandisers for mass products, and salons and authorized retail outlets for professional hair care products. We developed a unique specialty retail concept by combining one-stop shopping, a compelling value proposition, convenient locations
Table of Contents
and a welcoming shopping environment. We believe our strategy provides us with the competitive advantages that have contributed to our strong financial performance.
We are currently the largest beauty retailer that provides one-stop shopping for prestige, mass and salon products and salon services in the United States. We focus on providing affordable indulgence to our customers by combining unmatched product breadth, value and convenience with the distinctive environment and experience of a specialty retailer. Key aspects of our business include our ability to offer our customers a broad selection of more than 20,000 beauty products across the categories of cosmetics, fragrance, haircare, skincare, bath and body products and salon styling tools, as well as salon haircare products. We focus on delivering a compelling value proposition to our customers across all of our product categories. Our stores are predominantly located in convenient, high-traffic locations such as power centers.
The continued growth of our business and any future increases in net sales, net income and cash flows is dependent on our ability to execute our five point growth strategy, including growing stores to approximately 1,200 locations, expanding our offering by adding new products, brands and services, enhancing our loyalty program, broadening our marketing reach and expanding our digital business. We believe that the expanding U.S. beauty products and salon services industry, the shift in distribution of prestige beauty products from department stores to specialty retail stores, coupled with Ulta’s competitive strengths, positions us to capture additional market share in the industry through successful execution of our growth strategy.
Comparable store sales is a key metric that is monitored closely within the retail industry. Our comparable store sales have fluctuated in the past and we expect them to continue to fluctuate in the future. A variety of factors affect our comparable store sales, including general U.S. economic conditions, changes in merchandise strategy or mix, and timing and effectiveness of our marketing activities, among others.
Over the long-term, our growth strategy is to increase total net sales through increases in our comparable store sales and by opening new stores. Operating profit is expected to increase as a result of our ability to expand merchandise margin and leverage our fixed store costs with comparable store sales increases and operating efficiencies offset by incremental investments in people, systems and supply chain required to support a 1,200 store chain with a successful e-commerce business and competitive omni-channel capabilities. We are currently evaluating our long range strategic and financial plan and expect to share our long-term growth plan and financial targets in the fall of 2014.
Global economic conditions
Economic conditions in the U.S. continue to be uneven. Fiscal stress in Europe and economic uncertainty in the U.S. related to deficit issues, potential tax increases and federal spending cuts have resulted in significant fluctuations in the financial markets. While the U.S. credit markets have stabilized and credit availability has improved compared to the recent recessionary period, economic growth is expected to continue to be weak. Consumer spending habits are affected by levels of unemployment, unsettled financial markets, weakness in housing and real estate, higher interest rates, fuel and energy costs, and consumer perception of economic conditions, among others. Sudden negative changes in one or more of the factors that affect consumer spending could adversely affect consumer spending levels which could lead to reduced consumer demand for our merchandise and adversely affect our sales levels and financial performance.
Basis of presentation
We have determined the operating segments on the same basis that we use to internally evaluate performance. We have combined our three operating segments: retail stores, salon services and e-commerce, into one reportable segment because they have a similar class of consumer, economic characteristics, nature of products and distribution methods.
Net sales include store and e-commerce merchandise sales as well as salon service revenue. We recognize merchandise revenue at the point of sale in our retail stores and e-commerce sales are recorded based on delivery of merchandise to the customer. Merchandise sales are recorded net of estimated returns. Salon service revenue is recognized at the time the service is provided. Gift card sales revenue is deferred until the customer redeems the gift card. Company coupons and other incentives are recorded as a reduction of net sales.
Table of Contents
Comparable store sales reflect sales for stores beginning on the first day of the 14th month of operation. Therefore, a store is included in our comparable store base on the first day of the period after one year of operations plus the initial one month grand opening period. Non-comparable store sales include sales from new stores that have not yet completed their 13th month of operation and stores that were closed for part or all of the period in either year as a result of remodel activity. Remodeled stores are included in comparable store sales unless the store was closed for a portion of the current or prior period. Beginning with the first quarter of 2013, comparable store sales include the Company’s e-commerce business. There may be variations in the way in which some of our competitors and other retailers calculate comparable or same store sales.
Measuring comparable store sales allows us to evaluate the performance of our store base as well as several other aspects of our overall strategy. Several factors could positively or negatively impact our comparable store sales results:
| Ÿ | the general national, regional and local economic conditions and corresponding impact on customer spending levels; |
|---|
| Ÿ | the introduction of new products or brands; |
|---|
| Ÿ | the location of new stores in existing store markets; |
|---|
| Ÿ | competition; |
|---|
| Ÿ | our ability to respond on a timely basis to changes in consumer preferences; |
|---|
| Ÿ | the effectiveness of our various marketing activities; and |
|---|
| Ÿ | the number of new stores opened and the impact on the average age of all of our comparable stores. |
|---|
Cost of sales includes:
| Ÿ | the cost of merchandise sold, including substantially all vendor allowances, which are treated as a reduction of merchandise costs; |
|---|
| Ÿ | warehousing and distribution costs including labor and related benefits, freight, rent, depreciation and amortization, real estate taxes, utilities, and insurance; |
|---|
| Ÿ | store occupancy costs including rent, depreciation and amortization, real estate taxes, utilities, repairs and maintenance, insurance, licenses, and cleaning expenses; |
|---|
| Ÿ | salon payroll and benefits; |
|---|
| Ÿ | customer loyalty program expense; and |
|---|
| Ÿ | shrink and inventory valuation reserves. |
|---|
Our cost of sales may be negatively impacted as we open an increasing number of stores. Changes in our merchandise mix may also have an impact on cost of sales. This presentation of items included in cost of sales may not be comparable to the way in which our competitors or other retailers compute their cost of sales.
Selling, general and administrative expenses include:
| Ÿ | payroll, bonus and benefit costs for retail and corporate employees; |
|---|
| Ÿ | advertising and marketing costs; |
|---|
| Ÿ | occupancy costs related to our corporate office facilities; |
|---|
| Ÿ | stock-based compensation expense; |
|---|
| Ÿ | depreciation and amortization for all assets except those related to our retail and warehouse operations, which is included in cost of sales; and |
|---|
| Ÿ | legal, finance, information systems and other corporate overhead costs. |
|---|
Table of Contents
This presentation of items in selling, general and administrative expenses may not be comparable to the way in which our competitors or other retailers compute their selling, general and administrative expenses.
Pre-opening expense includes non-capital expenditures during the period prior to store opening for new, remodeled and relocated stores including rent during the construction period for new and relocated stores, store set-up labor, management and employee training, and grand opening advertising.
Interest expense includes interest costs and unused facility fees associated with our credit facility, which is structured as an asset based lending instrument. Our credit facility interest is based on a variable interest rate structure which can result in increased cost in periods of rising interest rates.
Income tax expense reflects the federal statutory tax rate and the weighted average state statutory tax rate for the states in which we operate stores.
Results of operations
Our fiscal years are the 52 or 53 week periods ending on the Saturday closest to January 31. The Company’s fiscal years ended February 1, 2014, February 2, 2013 and January 28, 2012 were 52, 53 and 52 week years, respectively, and are hereafter referred to as fiscal 2013, fiscal 2012 and fiscal 2011.
As of February 1, 2014, we operated 675 stores across 46 states. The following tables present the components of our consolidated results of operations for the periods indicated:
| Fiscal year ended | ||||||||||||
| (Dollars in thousands) | February 1, 2014 | February 2, 2013 | January 28, 2012 | |||||||||
| Net sales | $ | 2,670,573 | $ | 2,220,256 | $ | 1,776,151 | ||||||
| Cost of sales | 1,729,325 | 1,436,582 | 1,159,311 | |||||||||
| Gross profit | 941,248 | 783,674 | 616,840 | |||||||||
| Selling, general and administrative expenses | 596,390 | 488,880 | 410,658 | |||||||||
| Pre-opening expenses | 17,270 | 14,816 | 9,987 | |||||||||
| Operating income | 327,588 | 279,978 | 196,195 | |||||||||
| Interest (income) expense | (118 | ) | 185 | 587 | ||||||||
| Income before income taxes | 327,706 | 279,793 | 195,608 | |||||||||
| Income tax expense | 124,857 | 107,244 | 75,344 | |||||||||
| Net income | $ | 202,849 | $ | 172,549 | $ | 120,264 | ||||||
| Other operating data: | ||||||||||||
| Number of stores end of period | 675 | 550 | 449 | |||||||||
| Comparable store sales increase | ||||||||||||
| Retail and salon comparable store sales | 6.1 | % | 8.8 | % | 10.9 | % | ||||||
| E-commerce comparable store sales | 76.6 | % | 30.7 | % | 37.8 | % | ||||||
| Total comparable store sales increase | 7.9 | % | 9.3 | % | 11.5 | % |
Table of Contents
| Fiscal year ended | ||||||||||||
| (Percentage of net sales) | February 1, 2014 | February 2, 2013 | January 28, 2012 | |||||||||
| Net sales | 100.0 | % | 100.0 | % | 100.0 | % | ||||||
| Cost of sales | 64.8 | % | 64.7 | % | 65.3 | % | ||||||
| Gross profit | 35.2 | % | 35.3 | % | 34.7 | % | ||||||
| Selling, general and administrative expenses | 22.3 | % | 22.0 | % | 23.1 | % | ||||||
| Pre-opening expenses | 0.6 | % | 0.7 | % | 0.6 | % | ||||||
| Operating income | 12.3 | % | 12.6 | % | 11.0 | % | ||||||
| Interest (income) expense | 0.0 | % | 0.0 | % | 0.0 | % | ||||||
| Income before income taxes | 12.3 | % | 12.6 | % | 11.0 | % | ||||||
| Income tax expense | 4.7 | % | 4.8 | % | 4.2 | % | ||||||
| Net income | 7.6 | % | 7.8 | % | 6.8 | % | ||||||
Fiscal year 2013 versus fiscal year 2012
Net sales
Net sales increased $450.3 million, or 20.3%, to $2,670.6 million in fiscal 2013 compared to $2,220.3 million in fiscal 2012. Salon service sales increased $24.4 million, or 20.1% to $145.8 million compared to $121.4 million in fiscal 2012. E-commerce sales increased $40.7 million, or 73.9%, to $95.8 million compared to $55.1 million in fiscal 2012. The net sales increases are due to the opening of 125 net new stores in 2013 and a 7.9% increase in comparable store sales. Non-comparable stores, which include stores opened in fiscal 2013 as well as stores opened in fiscal 2012 which have not yet turned comparable, contributed $283.0 million of the net sales increase while comparable stores contributed $167.3 million of the total net sales increase. The sales for the 53rd week of fiscal 2012 were approximately $55 million.
The 7.9% comparable store sales increase consisted of a 6.1% increase at the Company’s retail and salon stores and a 76.6% increase in the Company’s e-commerce business. The inclusion of the e-commerce business resulted in an increase of approximately 180 basis points to the Company’s consolidated same store sales calculation for fiscal 2013 compared to 50 basis points for fiscal 2012. The total comparable store sales increase included a 6.9% increase in average ticket and a 1.0% increase in traffic. We attribute the increase in comparable store sales to our successful marketing and merchandising strategies.
Gross profit
Gross profit increased $157.5 million, or 20.1%, to $941.2 million in fiscal 2013, compared to $783.7 million, in fiscal 2012. Gross profit as a percentage of net sales decreased 10 basis points to 35.2% in fiscal 2013 compared to 35.3% in fiscal 2012. The decrease in gross profit margin in fiscal 2013 was primarily driven by:
| Ÿ | 40 basis points deleverage in merchandise margins due mainly to changes in marketing and merchandising strategies; offset by |
|---|
| Ÿ | 20 basis point leverage in supply chain due to operating efficiencies; and |
|---|
| Ÿ | 10 basis points of leverage in fixed store costs attributed to the impact of higher sales levels in fiscal 2013. |
|---|
Selling, general and administrative expenses
Selling, general and administrative (SG&A) expenses increased $107.5 million, or 22.0%, to $596.4 million in fiscal 2013 compared to $488.9 million in fiscal 2012. As a percentage of net sales, SG&A expenses increased 30 basis points to 22.3% in fiscal 2013 compared to 22.0% in fiscal 2012. The 30 basis point deleverage in SG&A expense was primarily driven by the planned investments in supply chain, e-commerce and store labor to support rapid growth.
Table of Contents
Pre-opening expenses
Pre-opening expenses increased $2.5 million, or 16.6%, to $17.3 million in fiscal 2013 compared to $14.8 million in fiscal 2012. During fiscal 2013, we opened 127 new stores, remodeled 7 stores and relocated 4 stores. During fiscal 2012, we opened 102 new stores and remodeled 21 stores and relocated 3 stores.
Interest income and expense
Interest income was $0.1 million in fiscal 2013 and interest expense was $0.2 million in fiscal 2012. Interest income results from highly liquid investments with maturities of three months or less from the date of purchase. Interest expense represents various fees related to the credit facility. We did not utilize our credit facility during fiscal 2013 or 2012.
Income tax expense
Income tax expense of $124.9 million in fiscal 2013 represents an effective tax rate of 38.1%, compared to fiscal 2012 tax expense of $107.2 million and an effective tax rate of 38.3%. The lower tax rate in fiscal 2013 is primarily due to a decrease in state taxes compared to fiscal 2012.
Net income
Net income increased $30.3 million, or 17.6%, to $202.8 million in fiscal 2013 compared to $172.5 million in fiscal 2012. The increase in net income was primarily due to an increase in gross profit of $157.5 million, which was offset by a $107.5 million increase in SG&A expenses and a $17.7 million increase in income tax expense.
Fiscal year 2012 versus fiscal year 2011
Net sales
Net sales increased $444.1 million, or 25.0%, to $2,220.3 million in fiscal 2012 compared to $1,776.2 million in fiscal 2011. Salon service sales increased $22.9 million, or 23.2% to $121.4 million compared to $98.5 million in fiscal 2011. The sales increases are due to the opening of 101 net new stores in 2012 and a 8.8% increase in comparable store sales which was primarily due to a 6.5% increase in store traffic. Non-comparable stores, which include stores opened in fiscal 2012 as well as stores opened in fiscal 2011 which have not yet turned comparable, contributed $291.0 million of the net sales increase while comparable stores contributed $153.1 million of the total net sales increase. We attribute the increase in comparable store sales to our successful marketing and merchandise strategies. The sales for the 53rd week of fiscal 2012 were approximately $55 million.
Gross profit
Gross profit increased $166.9 million, or 27.0%, to $783.7 million in fiscal 2012, compared to $616.8 million, in fiscal 2011. Gross profit as a percentage of net sales increased 60 basis points to 35.3% in fiscal 2012 compared to 34.7% in fiscal 2011. The increase in gross profit margin in fiscal 2012 was primarily driven by:
| Ÿ | 50 basis points of leverage in fixed store costs attributed to the impact of higher sales levels in fiscal 2012; and |
|---|
| Ÿ | 30 basis points improvement in merchandise margins driven by our marketing and merchandising strategies. |
|---|
Selling, general and administrative expenses
Selling, general and administrative (SG&A) expenses increased $78.2 million, or 19.0%, to $488.9 million in fiscal 2012 compared to $410.7 million in fiscal 2011. As a percentage of net sales, SG&A expenses decreased 110 basis points to 22.0% in fiscal 2012 compared to 23.1% in fiscal 2011. The leverage in SG&A expense was primarily driven by:
| Ÿ | 70 basis points in corporate overhead leverage attributed to higher sales volume; and |
|---|
Table of Contents
| Ÿ | 40 basis points improvement in variable store and marketing expense leverage attributed to cost efficiencies and higher sales volume. |
|---|
Pre-opening expenses
Pre-opening expenses increased $4.8 million, or 48.4%, to $14.8 million in fiscal 2012 compared to $10.0 million in fiscal 2011. During fiscal 2012, we opened 102 new stores, remodeled 21 stores and relocated 3 stores. During fiscal 2011, we opened 61 new stores and remodeled 17 stores and relocated 2 stores.
Interest expense
Interest expense was $0.2 million in fiscal 2012 and $0.6 million in fiscal 2011. Interest expense for both periods represents various fees related to the credit facility. We did not utilize our credit facility during fiscal 2012 or 2011.
Income tax expense
Income tax expense of $107.2 million in fiscal 2012 represents an effective tax rate of 38.3%, compared to fiscal 2011 tax expense of $75.3 million and an effective tax rate of 38.5%. The lower tax rate in fiscal 2012 is primarily due to a decrease in state taxes and less non-deductible executive compensation compared to fiscal 2011.
Net income
Net income increased $52.2 million, or 43.5%, to $172.5 million in fiscal 2012 compared to $120.3 million in fiscal 2011. The increase in net income was primarily due to an increase in gross profit of $166.9 million, which was offset by a $78.2 million increase in SG&A expenses and a $31.9 million increase in income tax expense.
Liquidity and capital resources
Our primary cash needs are for capital expenditures for new, relocated and remodeled stores, increased merchandise inventories related to store expansion, supply chain improvements and for continued improvement in our information technology systems.
Our primary sources of liquidity are cash on hand and cash flows from operations, including changes in working capital, and borrowings under our credit facility. The most significant component of our working capital is merchandise inventories reduced by related accounts payable and accrued expenses. Our working capital position benefits from the fact that we generally collect cash from sales to customers the same day, or within several days of the related sale, while we typically have up to 30 days to pay our vendors.
Our working capital needs are greatest from August through November each year as a result of our inventory build-up during this period for the approaching holiday season. This is also the time of year when we are at maximum investment levels in our new store class and may not have collected all of the landlord allowances due to us as part of our lease agreements. Based on past performance and current expectations, we believe that cash on hand, cash generated from operations and borrowings under the credit facility will satisfy the Company’s working capital needs, capital expenditure needs, commitments, and other liquidity requirements through at least the next 12 months.
The following table presents a summary of our cash flows for fiscal years 2013, 2012 and 2011:
| Fiscal year ended | ||||||||||||
| (In thousands) | February 1, 2014 | February 2, 2013 | January 28, 2012 | |||||||||
| Net cash provided by operating activities | $ | 327,725 | $ | 239,001 | $ | 220,887 | ||||||
| Net cash used in investing activities | (226,024 | ) | (188,578 | ) | (128,636 | ) | ||||||
| Net cash (used in) provided by financing activities | (2,700 | ) | 16,314 | 50,302 | ||||||||
| Net increase in cash and cash equivalents | $ | 99,001 | $ | 66,737 | $ | 142,553 | ||||||
Table of Contents
Operating activities
Operating activities consist of net income adjusted for certain non-cash items, including depreciation and amortization, non-cash stock-based compensation, realized gains or losses on disposal of property and equipment, and the effect of working capital changes.
Merchandise inventories were $457.9 million at February 1, 2014, compared to $361.1 million at February 2, 2013, representing an increase of $96.8 million or 26.8%. Average inventory per store increased 3.3% compared to prior year. The increase in inventory is primarily due to the following:
| Ÿ | approximately $82 million due to the addition of 125 net new stores opened since February 2, 2013; |
|---|
| Ÿ | approximately $10 million related to new brand additions and existing brand extensions primarily in the prestige color and skin category; and |
|---|
| Ÿ | approximately $5 million related to the addition of in-store prestige boutiques. |
|---|
We had a current tax liability of $15.3 million at the end of fiscal 2013 compared to $10.1 million at the end of fiscal 2012. The increase in taxes payable is primarily due to an increase in taxable income.
Deferred rent liabilities were $261.6 million at February 1, 2014, an increase of $53.6 million compared to the prior year end. Deferred rent includes deferred construction allowances, future rental increases and rent holidays which are all recognized on a straight-line basis over their respective lease term. The increase is primarily due to the addition of 125 net new stores opened since February 2, 2013.
The $18.7 million cash flow benefit from income taxes is attributed to Federal income tax deductions due to accelerated depreciation on fixed assets and tax deductible stock option exercises.
Investing activities
We have historically used cash primarily for new and remodeled stores as well as investments in information technology systems. Investment activities for capital expenditures were $226.0 million in fiscal 2013, compared to $188.6 million and $128.6 million in fiscal 2012 and 2011, respectively. Capital expenditures increased in fiscal 2013 compared to fiscal 2012 due to the increase in our 2013 new store program. During fiscal 2013 we opened 127 new stores, remodeled 7 stores and relocated 4 stores, compared to 102 new stores, 21 remodels and 3 relocations during fiscal 2012 and 61 new stores, 17 remodels and 2 relocations during fiscal 2011. During fiscal 2013, the average investment required to open a new Ulta store was approximately $1.0 million, which includes capital investment net of landlord contributions, pre-opening expenses and initial inventory net of payables. The average investment required to remodel an Ulta store was approximately $1.2 million.
Capital expenditures for fiscal 2013, 2012 and 2011 and planned fiscal 2014 by major category are as follows:
| 2014 | Fiscal | Fiscal | Fiscal | |||||||||||||
| (in millions) | Budget | 2013 | 2012 | 2011 | ||||||||||||
| New, Remodeled, Relocated Stores | $ | 117 | $ | 140 | $ | 124 | $ | 76 | ||||||||
| Merchandising | 28 | 18 | 19 | 12 | ||||||||||||
| Information Systems | 50 | 41 | 30 | 24 | ||||||||||||
| Supply Chain | 45 | 10 | 5 | 9 | ||||||||||||
| Store Maintenance & Other | 25 | 17 | 11 | 8 | ||||||||||||
| $ | 265 | $ | 226 | $ | 189 | $ | 129 | |||||||||
Our future investments will depend primarily on the number of new, relocated and remodeled stores, supply chain investments and information technology systems that we undertake and the timing of these expenditures. Based on past performance and current expectations, we expect to self-fund future capital expenditures. We expect to spend approximately $265 million for capital expenditures in fiscal 2014. We expect to spend less on new, remodeled and relocated stores with our plan to open approximately 100 new stores and remodel approximately 12 stores in fiscal 2014 compared to 127 new stores and 17 remodels in fiscal 2013. This decrease
Table of Contents
will be offset by expected increases in supply chain expenditures. We are embarking on a multi-year supply chain project beginning in 2014 which will include adding additional capacity, including a fourth distribution center expected to open in 2015, and system improvements to support expanded omni-channel capabilities.
Financing activities
Financing activities in fiscal 2013, 2012 and 2011 consist principally of capital stock transactions and the related income tax effects, a dividend payment and our stock repurchase program. Purchase of treasury shares in fiscal 2013, 2012 and 2011 represents the fair value of common shares repurchased from plan participants in connection with shares withheld to satisfy minimum statutory tax obligations upon the vesting of restricted stock.
We had no borrowings outstanding under our credit facility at the end of fiscal 2013, 2012 and 2011. The zero outstanding borrowings position is due to a combination of factors including strong sales growth, overall performance of management initiatives including expense control as well as inventory and other working capital reductions. We may require borrowings under the facility from time to time in future periods to support our new store program and seasonal inventory needs.
Dividend
On March 8, 2012, we announced that our Board of Directors had declared a $1.00 per share special cash dividend to shareholders of record as of the close of business on March 20, 2012. The special cash dividend totaling $62.5 million was paid on May 15, 2012.
Our Board of Directors may determine future dividends after giving consideration to our levels of profit and cash flow, capital requirements, current and future liquidity, restrictions included as part of our credit facility as well as financial and other conditions existing at the time.
Stock Repurchase Plan
On March 18, 2013, we announced that our Board of Directors had authorized a stock repurchase program pursuant to which the Company may repurchase up to $150 million of the Company’s common stock. The repurchases may be made from time to time in the open market, in privately negotiated transactions, or otherwise, at prices that the Company deems appropriate and subject to market conditions, applicable law and other factors deemed relevant in the Company’s sole discretion. The stock repurchase program does not have an expiration date and may be suspended or discontinued at any time. During fiscal 2013, we purchased 500,500 shares of common stock for $37.3 million at an average price of $74.58.
Credit facility
On October 19, 2011, we entered into an Amended and Restated Loan and Security Agreement (the Loan Agreement) with Wells Fargo Bank, National Association, as Administrative Agent, Collateral Agent and a Lender thereunder, Wells Fargo Capital Finance LLC as a Lender, J.P. Morgan Securities LLC as a Lender, JP Morgan Chase Bank, N.A. as a Lender and PNC Bank, National Association, as a Lender. The Loan Agreement amended and restated the Loan and Security Agreement, dated as of August 31, 2010, by and among the lenders. The Loan Agreement extends the maturity of the Company’s credit facility to October 2016, provides maximum revolving loans equal to the lesser of $200,000 or a percentage of eligible owned inventory, contains a $10,000 subfacility for letters of credit and allows the Company to increase the revolving facility by an additional $50,000, subject to consent by each lender and other conditions. The Loan Agreement contains a requirement to maintain a minimum amount of excess borrowing availability at all times.
On September 5, 2012, we entered into Amendment No. 1 to the Amended and Restated Loan and Security Agreement (the Amendment) with the lender group. The Amendment updated certain administrative terms and conditions and provides us greater flexibility to take certain corporate actions. There were no changes to the revolving loan amounts available, interest rates, covenants or maturity date under terms of the Loan Agreement.
On December 6, 2013, we entered into Amendment No. 2 to the Amended and restated Loan and Security Agreement (the Loan Amendment) with the lender group. The Loan Amendment extends the maturity of the facility to December 2018. Substantially all of the Company’s assets are pledged as collateral for outstanding
Table of Contents
borrowings under the facility. Outstanding borrowings will bear interest at the prime rate or Libor plus 1.50% and the unused line fee is 0.20%.
As of February 1, 2014 and February 2, 2013, we had no borrowings outstanding under its credit facility and the Company was in compliance with all terms and covenants of the agreement.
Seasonality
Our business is subject to seasonal fluctuation. Significant portions of our net sales and profits are realized during the fourth quarter of the fiscal year due to the holiday selling season. To a lesser extent, our business is also affected by Mothers’ Day as well as the “Back to School” season and Valentine’s Day. Any decrease in sales during these higher sales volume periods could have an adverse effect on our business, financial condition, or operating results for the entire fiscal year. Our quarterly results of operations have varied in the past and are likely to do so again in the future. As such, we believe that period-to-period comparisons of our results of operations should not be relied upon as an indication of our future performance.
Impact of inflation and changing prices
Although we do not believe that inflation has had a material impact on our financial position or results of operations to date, a high rate of inflation in the future may have an adverse effect on our ability to maintain current levels of gross margin and selling, general and administrative expenses as a percentage of net sales if the selling prices of our products do not increase with these increased costs. In addition, inflation could materially increase the interest rates on our debt.
Off-balance sheet arrangements
Our off-balance sheet arrangements consist of operating lease obligations. We do not have any non-cancelable purchase commitments as of February 1, 2014.
Contractual obligations
We lease retail stores, warehouses, corporate offices and certain equipment under operating leases with various expiration dates through fiscal 2027. Our store leases generally have initial lease terms of 10 years and include renewal options under substantially the same terms and conditions as the original leases. In addition to future minimum lease payments, most of our lease agreements include escalating rent provisions which we recognize straight-line over the term of the lease, including any lease renewal periods deemed to be probable. For certain locations, we receive cash tenant allowances and we report these amounts as deferred rent, which is amortized on a straight-line basis as a reduction of rent expense over the term of the lease, including any lease renewal periods deemed to be probable. While a number of our store leases include contingent rentals, contingent rent amounts are insignificant.
The following table summarizes our contractual arrangements and the timing and effect that such commitments are expected to have on our liquidity and cash flows in future periods. The table below excludes variable expenses related to contingent rent, common area maintenance, insurance and real estate taxes. The table below includes obligations for executed agreements for which we do not yet have the right to control the use of the property as of February 1, 2014:
| (In thousands) | Total | Less Than 1 Year | 1 to 3 Years | 3 to 5 Years | After 5 Years | |||||||||||||||
| Operating lease obligations(1) | $ | 1,407,664 | $ | 184,771 | $ | 370,162 | $ | 320,278 | $ | 532,453 |
| (1) | Variable operating lease obligations related to common area maintenance, insurance and real estate taxes are not included in the table above. Total expenses related to common area maintenance, insurance and real estate taxes for fiscal 2013 were $36.5 million. |
|---|
Table of Contents
Critical accounting policies and estimates
Management’s discussion and analysis of financial condition and results of operations is based upon our financial statements, which have been prepared in accordance with U.S. generally accepted accounting principles (GAAP). The preparation of these financial statements required the use of estimates and judgments that affect the reported amounts of our assets, liabilities, revenues and expenses. Management bases estimates on historical experience and other assumptions it believes to be reasonable under the circumstances and evaluates these estimates on an on-going basis. Actual results may differ from these estimates. A discussion of our more significant estimates follows. Management has discussed the development, selection, and disclosure of these estimates and assumptions with the Audit Committee of the Board of Directors.
Inventory valuation
Merchandise inventories are carried at the lower of average cost or market value. Cost is determined using the weighted-average cost method and includes costs incurred to purchase and distribute goods as well as related vendor allowances including co-op advertising, markdowns, and volume discounts. We record valuation adjustments to our inventories if the cost of a specific product on hand exceeds the amount we expect to realize from the ultimate sale or disposal of the inventory. These estimates are based on management’s judgment regarding future demand, age of inventory, and analysis of historical experience. If actual demand or market conditions are different than those projected by management, future merchandise margin rates may be unfavorably or favorably affected by adjustments to these estimates.
Inventories are adjusted for the results of periodic physical inventory counts at each of our locations. We record a shrink reserve representing management’s estimate of inventory losses by location that have occurred since the date of the last physical count. This estimate is based on management’s analysis of historical results and operating trends. Adjustments to earnings resulting from revisions to management’s estimates of the lower of cost or market and shrink reserves have been insignificant during fiscal 2013, 2012 and 2011.
Vendor allowances
We deem a cash consideration received from a supplier to be a reduction of the cost of products sold unless it is in exchange for an asset or service or a reimbursement of a specific, incremental, identifiable cost incurred by the Company in selling the vendor’s products. The majority of cash consideration received by the Company is considered to be a reduction of the cost of the related products and is reflected in cost of sales in our consolidated statements of income as the related products are sold. Any portion of such cash consideration received that is attributable to inventory on hand is reflected as a reduction of inventory. We consider the facts and circumstances of the various contractual agreements with vendors in order to determine the appropriate classification of amounts received in the consolidated statements of income. We record cash consideration expected to be received from vendors in net receivables at the amount we expect to collect.
Impairment of long-lived tangible assets
We review long-lived tangible assets whenever events or circumstances indicate these assets might not be recoverable based on undiscounted future cash flows. Assets are reviewed at the store level, which is the lowest level for which cash flows can be identified. Significant estimates are used in determining future operating results of each store over its remaining lease term. If such assets are considered to be impaired, the impairment to be recognized is measured by the amount by which the carrying amount of the assets exceeds the fair value of the assets. We have not recorded an impairment charge in any of the periods presented in the accompanying consolidated financial statements.
Share-based compensation
We account for share-based compensation in accordance with the Accounting Standards CodificationTM (ASC) rules for stock compensation. Share-based compensation cost is measured at the grant date, based on the fair value of the award, and is recognized on a straight-line method over the requisite service period for awards expected to vest.
Table of Contents
We estimate the grant date fair value of stock options using a Black-Scholes valuation model. During fiscal 2013 we made changes to update the valuation assumptions to Company specific information. These changes had no material impact on the calculation. For fiscal 2013 the expected volatility was based on the historical volatility of the ULTA Common Shares. The risk free interest rate was based on the United States Treasury yield curve in effect on the date of grant for the respective expected life of the option. The expected life represents the time the options granted are expected to be outstanding. For fiscal 2013, the expected life of options granted was derived from historical data on Ulta stock option exercises. Prior to 2013, we had limited historical data related to exercise behavior since our initial public offering on October 30, 2007. As a result, we elected to use the shortcut approach to determine the expected life in accordance with the SEC Staff Accounting Bulletin on share-based payments and the expected volatility was based on the historical volatility of a peer group of publicly-traded companies. Beginning in fiscal 2013, we introduced a forfeiture rate. Forfeitures of options are estimated at the grant date based on historical rates of the Company’s stock option activity and reduce the compensation expense recognized.
See notes to consolidated financial statements, “Summary of significant accounting policies — Share-based compensation,” for disclosure related to the Company’s stock compensation expense and related valuation model assumptions. See Note 9 to our consolidated financial statements, “Share-based awards,” for disclosure related to our stock compensation expense and related valuation model assumptions.
Item 7A. Quantitative and Qualitative Disclosures about Market Risk
Market risk represents the risk of loss that may impact our financial position due to adverse changes in financial market prices and rates. Our market risk exposure is primarily the result of fluctuations in interest rates. We do not hold or issue financial instruments for trading purposes.
Interest rate sensitivity
We are exposed to interest rate risks primarily through borrowing under our credit facility. Interest on our borrowings is based upon variable rates. We did not utilize the credit facility during fiscal 2013, 2012 or 2011.
Item 8. Consolidated Financial Statements and Supplementary Data
See the index included under Item 15, “Exhibits and Financial Statement Schedules”.
Item 9. Changes in and Disagreements with Accountants on Accounting and Financial Disclosure
None.
Item 9A. Controls and Procedures
Evaluation of Disclosure Controls and Procedures over Financial Reporting
We have established disclosure controls and procedures to ensure that material information relating to the Company is made known to the officers who certify our financial reports and to the members of our senior management and Board of Directors.
Based on management’s evaluation as of February 1, 2014, our Chief Executive Officer and Chief Financial Officer have concluded that our disclosure controls and procedures (as defined in Rules 13a-15(e) and 15d-15(e) under the Securities Exchange Act of 1934) are effective to ensure that the information required to be disclosed by us in our reports that we file or submit under the Securities Exchange Act of 1934 is recorded, processed, summarized and reported within the time periods specified in the Securities and Exchange Commission’s rules and forms, and that such information is accumulated and communicated to our management, including the Chief Executive Officer and Chief Financial Officer, as appropriate, to allow timely decisions regarding required disclosure.
Table of Contents
Management’s Annual Report on Internal Control over Financial Reporting
Our management is responsible for establishing and maintaining adequate internal control over financial reporting for the Company. Internal control over financial reporting is a process designed by, or under the supervision of the principal executive officer and principal financial officer and effected by the Board of Directors, management and other personnel, to provide reasonable assurance regarding the reliability of our financial reporting and the preparation of financial statements for external purposes in accordance with accounting principles generally accepted in the United States of America.
Under the supervision and with the participation of our principal executive officer and our principal financial officer, management evaluated the effectiveness of our internal control over financial reporting as of February 1, 2014, based on the criteria established in “Internal Control – Integrated Framework” (1992 Framework) issued by the Committee of Sponsoring Organizations of the Treadway Commission (COSO). Based on this evaluation, our principal executive officer and principal financial officer concluded that our internal controls over financial reporting were effective as of February 1, 2014. Ernst & Young LLP, the independent registered public accounting firm that audited our financial statements included in this Annual Report on Form 10-K, has audited the effectiveness of our internal control over financial reporting as of February 1, 2014 and has issued the attestation report included in Item 15 of this Annual Report on Form 10-K.
Changes in Internal Control over Financial Reporting
There were no changes to our internal controls over financial reporting during the three months ended February 1, 2014 that have materially affected, or are reasonably likely to materially affect, our internal controls over financial reporting.
Item 9B. Other Information
None.
Part III
Item 10. Directors, Executive Officers and Corporate Governance
| --- | --- |
The information required by this item with respect to our executive officers is set forth after Part I, Item 4 of this report under the caption “Executive Officers of the Registrant.” The additional information required by this item is incorporated by reference to our definitive proxy statement to be filed within 120 days after our fiscal year ended February 1, 2014 pursuant to Regulation 14A under the Exchange Act in connection with our 2014 annual meeting of stockholders.
Item 11. Executive Compensation
| --- | --- |
The information required by this item is incorporated by reference to our definitive proxy statement to be filed within 120 days after our fiscal year ended February 1, 2014 pursuant to Regulation 14A under the Exchange Act in connection with our 2014 annual meeting of stockholders.
Item 12. Security Ownership and Certain Beneficial Owners and Management and Related Stockholder Matters
| --- | --- |
The information required by this item is incorporated by reference to our definitive proxy statement to be filed within 120 days after our fiscal year ended February 1, 2014 pursuant to Regulation 14A under the Exchange Act in connection with our 2014 annual meeting of stockholders.
Item 13. Certain Relationships and Related Transactions, and Director Independence
| --- | --- |
The information required by this item is incorporated by reference to our definitive proxy statement to be filed within 120 days after our fiscal year ended February 1, 2014 pursuant to Regulation 14A under the Exchange Act in connection with our 2014 annual meeting of stockholders.
Table of Contents
Item 14. Principal Accountant Fees and Services
| --- | --- |
The information required by this item is incorporated by reference to our definitive proxy statement to be filed within 120 days after our fiscal year ended February 1, 2014 pursuant to Regulation 14A under the Exchange Act in connection with our 2014 annual meeting of stockholders.
Table of Contents
Part IV
Item 15. Exhibits and Financial Statement Schedules
| --- | --- |
| (a) | The following documents are filed as a part of this Form 10-K: |
|---|
The schedules required by Form 10-K have been omitted because they were inapplicable, included in the notes to the consolidated financial statements, or otherwise not required under the instructions contained in Regulation S-X.
Table of Contents
Report of Independent Registered Public Accounting Firm
The Board of Directors and Stockholders
Ulta Salon, Cosmetics & Fragrance, Inc.
We have audited the accompanying consolidated balance sheets of Ulta Salon, Cosmetics & Fragrance, Inc. (the Company) as of February 1, 2014 and February 2, 2013, and the related consolidated statements of income, cash flows, and stockholders’ equity for each of the three years in the period ended February 1, 2014. These financial statements are the responsibility of the Company’s management. Our responsibility is to express an opinion on these financial statements based on our audits.
We conducted our audits in accordance with the standards of the Public Company Accounting Oversight Board (United States). Those standards require that we plan and perform the audit to obtain reasonable assurance about whether the financial statements are free of material misstatement. An audit includes examining, on a test basis, evidence supporting the amounts and disclosures in the financial statements. An audit also includes assessing the accounting principles used and significant estimates made by management, as well as evaluating the overall financial statement presentation. We believe that our audits provide a reasonable basis for our opinion.
In our opinion, the financial statements referred to above present fairly, in all material respects, the consolidated financial position of Ulta Salon, Cosmetics & Fragrance, Inc. at February 1, 2014 and February 2, 2013, and the consolidated results of its operations and its cash flows for each of the three years in the period ended February 1, 2014, in conformity with U.S. generally accepted accounting principles.
We also have audited, in accordance with the standards of the Public Company Accounting Oversight Board (United States), Ulta Salon, Cosmetics & Fragrance, Inc.’s internal control over financial reporting as of February 1, 2014, based on criteria established in Internal Control — Integrated Framework issued by the Committee of Sponsoring Organizations of the Treadway Commission (1992 Framework) and our report dated April 2, 2014, expressed an unqualified opinion thereon.
/s/ Ernst & Young LLP
Chicago, Illinois
April 2, 2014
Table of Contents
Report of Independent Registered Public Accounting Firm
The Board of Directors and Stockholders
Ulta Salon, Cosmetics & Fragrance, Inc.
We have audited Ulta Salon, Cosmetics & Fragrance, Inc.’s internal control over financial reporting as of February 1, 2014, based on criteria established in Internal Control — Integrated Framework (1992 Framework) issued by the Committee of Sponsoring Organizations of the Treadway Commission (the COSO criteria). Ulta Salon, Cosmetics & Fragrance, Inc.’s management is responsible for maintaining effective internal control over financial reporting, and for its assessment of the effectiveness of internal control over financial reporting included in the accompanying Management’s Annual Report on Internal Control over Financial Reporting. Our responsibility is to express an opinion on the company’s internal control over financial reporting based on our audit.
We conducted our audit in accordance with the standards of the Public Company Accounting Oversight Board (United States). Those standards require that we plan and perform the audit to obtain reasonable assurance about whether effective internal control over financial reporting was maintained in all material respects. Our audit included obtaining an understanding of internal control over financial reporting, assessing the risk that a material weakness exists, testing and evaluating the design and operating effectiveness of internal control based on the assessed risk, and performing such other procedures as we considered necessary in the circumstances. We believe that our audit provides a reasonable basis for our opinion.
A company’s internal control over financial reporting is a process designed to provide reasonable assurance regarding the reliability of financial reporting and the preparation of financial statements for external purposes in accordance with generally accepted accounting principles. A company’s internal control over financial reporting includes those policies and procedures that (1) pertain to the maintenance of records that, in reasonable detail, accurately and fairly reflect the transactions and dispositions of the assets of the company; (2) provide reasonable assurance that transactions are recorded as necessary to permit preparation of financial statements in accordance with generally accepted accounting principles, and that receipts and expenditures of the company are being made only in accordance with authorizations of management and directors of the company; and (3) provide reasonable assurance regarding prevention or timely detection of unauthorized acquisition, use, or disposition of the company’s assets that could have a material effect on the financial statements.
Because of its inherent limitations, internal control over financial reporting may not prevent or detect misstatements. Also, projections of any evaluation of effectiveness to future periods are subject to the risk that controls may become inadequate because of changes in conditions, or that the degree of compliance with the policies or procedures may deteriorate.
In our opinion, Ulta Salon, Cosmetics & Fragrance, Inc. maintained, in all material respects, effective internal control over financial reporting as of February 1, 2014, based on the COSO criteria.
We also have audited, in accordance with the standards of the Public Company Accounting Oversight Board (United States), the consolidated balance sheets of Ulta Salon, Cosmetics & Fragrance, Inc. as of February 1, 2014 and February 2, 2013, and the related consolidated statements of income, cash flows and stockholders’ equity for each of the three years in the period ended February 1, 2014 and our report dated April 2, 2014 expressed an unqualified opinion thereon.
/s/ Ernst & Young LLP
Chicago, Illinois
April 2, 2014
Table of Contents
Ulta Salon, Cosmetics & Fragrance, Inc.
Consolidated Balance Sheets
| February 1, | February 2, | |||||||
| (In thousands, except per share data) | 2014 | 2013 | ||||||
| Assets | ||||||||
| Current assets: | ||||||||
| Cash and cash equivalents | $ | 419,476 | $ | 320,475 | ||||
| Receivables, net | 47,049 | 41,515 | ||||||
| Merchandise inventories, net | 457,933 | 361,125 | ||||||
| Prepaid expenses and other current assets | 55,993 | 50,452 | ||||||
| Deferred income taxes | 22,246 | 15,757 | ||||||
| Total current assets | 1,002,697 | 789,324 | ||||||
| Property and equipment, net | 595,736 | 483,059 | ||||||
| Deferred compensation plan assets | 4,294 |
Showing the first 8K of 82K characters. Open the full section