 filings.tools
Union Pacific 2022 10-K Annual Report
UNP · CIK 100885 · Form 10-K · Fiscal year ended December 31, 2022 · Filed February 10, 2023
23 sections, 334K characters. Original on sec.gov · Markdown · JSON
Risk FactorsBusinessMD&AFinancial StatementsWhat changed vs 2021
Cover and table of contents
UNITED STATES
SECURITIES AND EXCHANGE COMMISSION
WASHINGTON, D.C. 20549
FORM 10-K
(Mark One)
☒ ANNUAL REPORT PURSUANT TO SECTION 13 OR 15(d) OF THE SECURITIES EXCHANGE ACT OF 1934
For the fiscal year ended December 31, 2022
OR
☐ TRANSITION REPORT PURSUANT TO SECTION 13 OR 15(d) OF THE SECURITIES EXCHANGE ACT OF 1934
For the transition period from __________ to ____________
Commission File Number 1-6075
UNION PACIFIC CORPORATION
(Exact name of registrant as specified in its charter)
| Utah | 13-2626465 | |
|---|---|---|
| (State or other jurisdiction of incorporation or organization) | (I.R.S. Employer Identification No.) |
| 1400 Douglas Street, Omaha, Nebraska | 68179 |
|---|---|
| (Address of principal executive offices) | (Zip Code) |
Registrant’s telephone number, including area code: (402) 544-5000
Securities registered pursuant to Section 12(b) of the Act:
| Title of each Class | Trading Symbol | Name of each exchange on which registered |
|---|---|---|
| Common Stock (Par Value $2.50 per share) | UNP | New York Stock Exchange |
| Indicate by check mark if the registrant is a well-known seasoned issuer, as defined in Rule 405 of the Securities Act. |
|---|
☑Yes ☐ No
| Indicate by check mark if the registrant is not required to file reports pursuant to Section 13 or Section 15(d) of the Act. |
|---|
☐Yes ☑ No
| Indicate by check mark whether the registrant (1) has filed all reports required to be filed by Section 13 or 15(d) of the Securities Exchange Act of 1934 during the preceding 12 months (or for such shorter period that the registrant was required to file such reports), and (2) has been subject to such filing requirements for the past 90 days. |
|---|
☑Yes ☐ No
| Indicate by check mark whether the registrant has submitted electronically every Interactive Data File required to be submitted pursuant to Rule 405 of Regulation S-T (§232.405 of this chapter) during the preceding 12 months (or for such shorter period that the registrant was required to submit such files). |
|---|
☑Yes ☐ No
| Indicate by check mark whether the registrant is a large accelerated filer, an accelerated filer, a non-accelerated filer, a smaller reporting company, or an emerging growth company. See the definitions of “large accelerated filer,” “accelerated filer,” “smaller reporting company,” and “emerging growth company” in Rule 12b-2 of the Exchange Act. | |||||||
|---|---|---|---|---|---|---|---|
| Large Accelerated Filer | ☑ | Accelerated Filer | ☐ | Non-Accelerated Filer | ☐ | ||
| Smaller Reporting Company | ☐ | Emerging Growth Company | ☐ |
| If an emerging growth company, indicate by check mark if the registrant has elected not to use the extended transition period for complying with any new or revised financial accounting standards provided pursuant to Section 13(a) of the Exchange Act. |
|---|
☐
| Indicate by check mark whether the registrant has filed a report on and attestation to its management’s assessment of the effectiveness of its internal control over financial reporting under Section 404(b) of the Sarbanes-Oxley Act (15 U.S.C. 7262(b)) by the registered public accounting firm that prepared or issued its audit report. |
|---|
☑
| If securities are registered pursuant to Section 12(b) of the Act, indicate by check mark whether the financial statements of the registrant included in the filing reflect the correction of an error to previously issued financial statements. |
|---|
☐
| Indicate by check mark whether any of those error corrections are restatements that required a recovery analysis of incentive-based compensation received by any of the registrant’s executive officers during the relevant recovery period pursuant to §240.10D-1(b). |
|---|
☐
| Indicate by check mark whether the registrant is a shell company (as defined in Rule 12b-2 of the Act). |
|---|
☐Yes ☑ No
| As of June 30, 2022, the aggregate market value of the registrant’s Common Stock held by non-affiliates (using the New York Stock Exchange closing price) was $131.5 billion. |
|---|
The number of shares outstanding of the registrant’s Common Stock as of February 3, 2023, was 611,872,981.
Documents Incorporated by Reference – Portions of the registrant’s definitive Proxy Statement for the Annual Meeting of Shareholders to be held on May 18, 2023, are incorporated by reference into Part III of this report. The registrant’s Proxy Statement will be filed with the Securities and Exchange Commission (SEC) within 120 days after the end of the fiscal year that this report relates pursuant to Regulation 14A.
TABLE OF CONTENTS
Fellow Shareholders:
| 2022 was a foundational year for Union Pacific, building and executing on our long-term growth strategy. From numerous customer wins, to preparing for and onboarding a large intermodal customer, to strategic investments in our intermodal network and transload business, we took action to create long-term value. Those successes, however, were met with some significant short-term barriers – continued global supply chain disruptions, an elevated inflationary environment, record fuel prices, challenging labor markets, and an extended labor negotiation. All of those factors had a real impact on our ability to deliver a consistent and reliable service product to our customers in 2022. They also contributed to uneven financial results for the year. In 2022, we reported record earnings per share of $11.21, a 13% increase versus 2021. Total volumes increased 2% versus 2021, driven by strength in industrial and bulk markets offsetting continued supply chain challenges in our premium markets. Our operating ratio was a 60.1%, a 290-basis point deterioration versus 2021 driven by inflation, operational inefficiency, and higher fuel prices. For the full year, our average fuel price per gallon increased 64%. Also notable, was a $92 million one-time charge recorded in the third quarter for new labor agreements. | 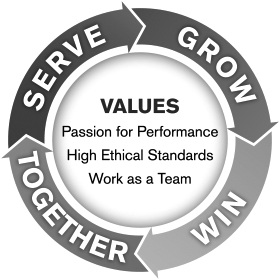 |
|---|
Success at Union Pacific begins with safety. In 2022, we made progress on our personal injury safety metrics, improving 18% to a five-year low and lead the industry in employee safety. We will build upon this improvement by enhancing training programs and solidifying our safety culture through ownership and personal accountability on the path to achieving our goal of world-class safety performance. We need to expand our progress from personal injuries to derailments, where we have opportunity for improvement. The ultimate goal remains returning each employee home safely at the end of the day.
In 2021, we rolled out a strategic plan we call, “Serve, Grow, Win – Together.” And over the past two years, we have been executing on that long-term strategy. While our 2022 progress was mixed, we advanced our position towards long-term sustainable growth through targeted capital investments, emissions reduction programs, and by leveraging technology to improve our customer's experience.
Everything we do starts with Serve and delivering customer-centered operational excellence. In 2022, our service product did not meet expectations. Constrained crew bases in critical locations, elevated freight car inventory levels, and continued supply chain disruptions all played a role and impacted our ability to support customers and their needs. In 2022, freight car velocity deteriorated 6% versus 2021, lowering trip plan compliance for intermodal 6 points and manifest/automotive 4 points. Similarly, our efficiency measures were impacted as locomotive productivity declined 6% and workforce productivity and train length were flat. To address constrained crew bases, we hired and trained over 1,300 new transportation employees in 2022 and have almost 600 more in the training pipeline as we enter 2023. We also amplified our customer communications to provide clear expectations and leveraged continuous improvement efforts to address discrete service issues.
A key long-term initiative for Union Pacific is to reduce our carbon footprint for the benefit of all stakeholders. For the fourth consecutive year, we achieved a best-ever fuel consumption rate, improving 1% versus 2021. In addition, we increased our biodiesel blend to over 4.5%, on track toward our 2030 target of 20%. These efforts helped our customers eliminate over 23 million metric tons of greenhouse gas emissions by choosing Union Pacific versus truck.
We continue to make significant investments in our infrastructure to support our service product. In 2022, our capital program of approximately $3.4 billion included completing 24 siding projects, finishing the Twin Cities, MN, intermodal terminal, further expanding the West Colton, CA, intermodal terminal, modernizing over 130 locomotives, and hardening our infrastructure.
These investments support the next tenet of our strategy – Grow. We have the best rail franchise in North America. Our growth is powered by providing products and services that meet our customers’ needs. This includes providing new services for our customers and expanding our reach through new transload facilities and intermodal terminals, which our team translated into new business wins in 2022. And those business development wins will provide a tailwind in 2023 as we navigate an uncertain economy.
Growth is also dependent on a customer experience that constantly improves and evolves. Technology plays a key role. We’re integrating deeper in our customers’ systems and supply chains by being the industry leader in providing application programming interfaces (API), with over 70 services available being called on over 600,000 times a day.
Successful execution of our plans to “Serve” and “Grow” leads to Win. For our shareholders, winning means generating strong cash returns. In 2022, we paid dividends of $3.2 billion, which included a 10% dividend increase in the second quarter. In addition, we repurchased 27 million Union Pacific shares, decreasing our full-year average share count 5%. Combining dividends and share repurchases, Union Pacific returned $9.4 billion to our shareholders in 2022.
“Winning” extends to all UP’s stakeholders, and the value we create for each of them, which is the final piece of our strategy – Together. We continue to evolve our comprehensive approach to Environmental, Social, and Governance issues as laid out in “Building a Sustainable Future 2030”. Ultimately, we demonstrate our commitment to this through actions. In 2022, we announced our plans to purchase battery electric locomotives for use in yard operations, executed a three-year deal to modernize 600 additional locomotives starting in 2023, issued $600 million in green bonds, and became the first U.S. railroad to formally support the Task Force on Climate-related Financial Disclosures (TCFD). Late in the year we were added to the Dow Jones Sustainability Index and included in the JUST Capital 100. Our momentum on sustainability is real and demonstrates our position as the rail leader in the space.
The entire Union Pacific team recognizes that we fell short of expectations in 2022. But, thanks to the hard work of our exceptional workforce, we are entering 2023 positioned for success. While the year ahead has some real challenges – an uncertain economy, higher cost structure, and stakeholder trust to rebuild – the Union Pacific team is again ready to rise to the occasion. Our fundamentals for long-term success have not changed. Powered by our best-in-industry employees and franchise, a strategy built for profitable growth, and a more efficient and reliable service product, Union Pacific is poised to do great things in 2023. We can’t wait to prove it to you.
Chairman, President, and Chief Executive Officer
DIRECTORS AND SENIOR MANAGEMENT
| BOARD OF DIRECTORS | ||||
| William J. DeLaney Former Chief Executive Officer – Sysco Corporation Board Committees: Audit; Compensation and Benefits (Chair) David B. Dillon Former Chairman and CEO – The Kroger Company Board Committees: Audit (Chair); Compensation and Benefits Sheri H. Edison Former Executive Vice President and General Counsel – Amcor plc Board Committees: Compensation and Benefits; Corporate Governance, Nominating, and Sustainability | Teresa M. Finley Former Chief Marketing and Business Services Officer – United Parcel Service, Inc. Board Committees: Compensation and Benefits; Finance Lance M. Fritz Chairman, President, and Chief Executive Officer – Union Pacific Corporation and Union Pacific Railroad Company Deborah C. Hopkins Former Chief Executive Officer – Citi Ventures and Former Chief Innovation Officer – Citi Board Committees: Audit; Finance (Chair) Jane H. Lute Strategic Advisor – SICPA, North America Board Committees: Audit; Corporate Governance, Nominating, and Sustainability | Michael R. McCarthy Chairman – McCarthy Group, LLC; Co-Chairman – Bridges Trust Company Lead Independent Director Board Committees: Corporate Governance, Nominating, and Sustainability (Chair); Finance Jose H. Villarreal Retired Advisor – Akin, Gump, Strauss, Hauer, & Feld, LLP Board Committees: Compensation and Benefits; Corporate Governance, Nominating, and Sustainability Christopher J. Williams Chairman – Siebert Williams Shank & Co. Board Committees: Audit; Finance |
SENIOR MANAGEMENT*
| Lance M. Fritz Chairman, President, and Chief Executive Officer Prentiss W. Bolin, Jr. Vice President – External Relations Bryan L. Clark Vice President – Tax Eric J. Gehringer Executive Vice President – Operations Jennifer L. Hamann Executive Vice President and Chief Financial Officer | Rahul Jalali Senior Vice President – Information Technologies and Chief Information Officer Michael V. Miller Vice President and Treasurer Scott D. Moore Senior Vice President – Corporate Relations and Chief Administrative Officer Clark J. Ponthier Senior Vice President – Supply Chain and Continuous Improvement | Craig V. Richardson Executive Vice President, Chief Legal Officer, and Corporate Secretary Kenny G. Rocker Executive Vice President – Marketing and Sales Todd M. Rynaski Senior Vice President and Chief Accounting, Risk, and Compliance Officer Elizabeth F. Whited Executive Vice President – Sustainability and Strategy |
| *Senior management are elected officers of both Union Pacific Corporation and Union Pacific Railroad Company, except Messrs. Gehringer, Ponthier, and Rocker are elected officers for Union Pacific Railroad Company. |
|---|
Item 1. Business
GENERAL
Union Pacific Railroad Company is the principal operating company of Union Pacific Corporation. One of America's most recognized companies, Union Pacific Railroad Company connects 23 states in the western two-thirds of the country by rail, providing a critical link in the global supply chain. The Railroad’s diversified business mix includes Bulk, Industrial, and Premium. Union Pacific serves many of the fastest-growing U.S. population centers, operates from all major West Coast and Gulf Coast ports to Eastern gateways, connects with Canada's rail systems, and is the only railroad serving all six major Mexico gateways. Union Pacific provides value to its roughly 10,000 customers by delivering products in a safe, reliable, fuel-efficient, and environmentally responsible manner.
Union Pacific Corporation was incorporated in Utah in 1969 and maintains its principal executive offices at 1400 Douglas Street, Omaha, NE 68179. The telephone number at that address is (402) 544-5000. The common stock of Union Pacific Corporation is listed on the New York Stock Exchange (NYSE) under the symbol “UNP”.
For purposes of this report, unless the context otherwise requires, all references herein to "Union Pacific", “UPC”, “Corporation”, “Company”, “we”, “us”, and “our” shall mean Union Pacific Corporation and its subsidiaries, including Union Pacific Railroad Company, which we separately refer to as “UPRR” or the “Railroad”.
STRATEGY
The Company’s growth strategy focuses on growing customer value through innovative supply chain solutions and aspiring to Serve, Grow, Win – Together.
Serve: Driving operational excellence to create a safer, more reliable, and efficient service product. Precision scheduled railroading (PSR) is the foundation for delivering customer-centered operational excellence by:
| 1. | Shifting the focus of operations from moving trains to moving cars. |
|---|---|
| 2. | Minimizing car dwell, car classification events, and locomotive power requirements. |
| 3. | Utilizing general-purpose trains by blending existing train service. |
| 4. | Balancing train movements to improve the utilization of resources. |
We aim to move cars faster and reduce the number of times each car is touched, resulting in terminal consolidation opportunities, improved asset utilization, and fewer car classifications, which in turn leads to products getting to the market quicker and more reliably. The result is a better customer experience, which enables us to grow our market share.
Grow: By harnessing the potential of the best rail franchise in the industry, we expect to generate growth in three ways – increasing profitable carloads that fit our network and transportation plan, providing more products and services to create value for our customers, and increasing the geographic reach of our franchise through innovative supply chain solutions.
Win: Driving strong financial performance resulting in significant shareholder returns. Execution of our plans to both serve and grow, leads to higher revenues with improved margins and greater cash generation, creating long term enterprise value.
Together: Engaging our four stakeholder groups – Communities, Customers, Employees, and Shareholders. Our comprehensive approach to Environmental, Social, and Governance issues, “Building a Sustainable Future 2030,” is designed to address the evolving interests of our stakeholders and is built on five areas of concentration – Building Responsible Foundations, Investing in our Workforce, Driving Sustainable Solutions, Championing Environmental Stewardship, and Strengthening our Communities.
We believe that operational excellence and an engaged workforce with deep market knowledge and strong customer relationships supports best-in-class safety, a customer experience that drives growth, and shareholder returns.
As we work to transform our railroad into the safest, most reliable, and most efficient in North America, our values continue guiding us. Our passion for performance will help us win; our high ethical standards will lead us to win in a way that supports all of our stakeholders; and our teamwork will make sure we win together.
OPERATIONS
The Railroad, along with its subsidiaries and rail affiliates, is our one reportable operating segment. Although we provide revenues by commodity group, we analyze the net financial results of the Railroad as one segment due to the integrated nature of our rail network. Additional information regarding our business and operations, including revenues, financial information and data, and other information regarding environmental matters, is presented in Risk Factors, Item 1A; Legal Proceedings, Item 3; Management’s Discussion and Analysis of Financial Condition and Results of Operations, Item 7; and the Financial Statements and Supplementary Data, Item 8 (which include information regarding revenues, statements of income, and total assets).
| Operations – UPRR is a Class I railroad operating in the U.S. We have 32,534 route miles, connecting Pacific Coast and Gulf Coast ports with the Midwest and Eastern U.S. gateways and providing several corridors to key Mexican gateways. We serve the western two-thirds of the country and maintain coordinated schedules with other rail carriers to move freight to and from the Atlantic Coast, the Pacific Coast, the Southeast, the Southwest, Canada, and Mexico. Export and import traffic moves through Gulf Coast, Pacific Coast, and East Coast ports and across the Mexican and Canadian borders. In 2022, we generated freight revenues totaling $23.2 billion from the following three commodity groups: | 2022 Freight Revenues |
|---|---|
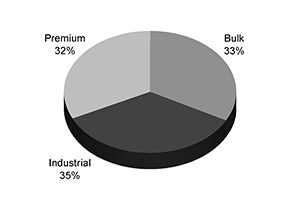 |
Bulk – The Company's Bulk shipments consist of grain and grain products, fertilizer, food and refrigerated, and coal and renewables. In 2022, this group generated 33% of our freight revenues. We access most major grain markets, connecting the Midwest and Western U.S. producing areas to export terminals in the Pacific Northwest and Gulf Coast ports as well as Mexico. We also serve significant domestic markets, including grain processors, animal feeders, and ethanol producers in the Midwest and West. Fertilizer movements originate in the Gulf Coast region, Midwest, Western U.S., and Canada (through interline access) for delivery to major agricultural users in those areas as well as abroad. The Railroad’s network supports the transportation of coal shipments to independent and regulated power companies and industrial facilities throughout the U.S. Through interchange gateways and ports, UPRR’s reach extends to Eastern U.S. utilities as well as to Mexico and other international destinations. Coal traffic originating in the Powder River Basin (PRB) area of Wyoming is the largest portion of the Railroad’s coal business. Renewable shipments for customers committed to sustainability consist primarily of biomass exports and wind turbine components.
Industrial – Our extensive network facilitates the movement of numerous commodities between thousands of origin and destination points throughout North America. The Industrial group consists of several categories, including construction, industrial chemicals, plastics, forest products, specialized products (primarily waste, salt, and roofing), metals and ores, petroleum, liquid petroleum gases (LPG), soda ash, and sand. Transportation of these products accounted for 35% of our freight revenues in 2022. Commercial, residential, and governmental infrastructure investments drive shipments of steel, aggregates, cement, and wood products. Industrial and light manufacturing plants receive steel, nonferrous materials, minerals, and other raw materials.
The industrial chemicals market consists of a vast number of chemical compounds that support the manufacturing of more complex chemicals. Plastics shipments support automotive, housing, and the durable and disposable consumer goods markets. Forest product shipments include lumber and paper commodities. Lumber shipments originate primarily in the Pacific Northwest or Western Canada and move throughout the U.S. for use in new home construction and repairs and remodeling. Paper shipments primarily support packaging needs. Oil and gas drilling generates demand for raw steel, finished pipe, stone, and drilling fluid commodities. The Company’s petroleum and LPG shipments are primarily impacted by refinery utilization rates, regional crude pricing differentials, pipeline capacity, and the use of asphalt for road programs. Soda ash originates in southwestern Wyoming and California, destined for chemical and glass producing markets in North America and abroad.
Premium – In 2022, Premium shipments generated 32% of Union Pacific’s total freight revenues. Premium includes finished automobiles, automotive parts, and merchandise in intermodal containers, both domestic and international. International business consists of import and export traffic moving in 20 or 40-foot shipping containers, that mainly pass through West Coast ports, destined for one of the Company's many inland intermodal terminals. Domestic business includes container and trailer traffic picked up and delivered within North America for intermodal marketing companies (primarily shipper agents and logistics companies) as well as truckload carriers.
We are the largest automotive carrier west of the Mississippi River and operate or access 39 vehicle distribution centers. The Railroad’s extensive franchise accesses six vehicle assembly plants and connects to West Coast ports, all six major Mexico gateways, and the Port of Houston to accommodate both import and export shipments. In addition to transporting finished vehicles, the Company provides expedited handling of automotive parts in both boxcars and intermodal containers destined for Mexico, the U.S., and Canada.
Seasonality – Some of the commodities we carry have peak shipping seasons, reflecting either or both the nature of the commodity (such as certain agricultural and food products that have specific growing and harvesting seasons) and the demand cycle for the commodity (such as intermodal traffic that generally peaks during the third quarter to meet back-to-school and holiday-related demand for consumer goods during the fourth quarter). The peak shipping seasons for these commodities can vary considerably each year depending upon various factors, including the strength of domestic and international economies and currencies; consumer demand; the strength of harvests, which can be adversely affected by severe weather; market prices for agricultural products; and supply chain disruptions.
Proud & Engaged Workforce – Our employees are central to our Serve, Grow, Win – Together strategy, and Investing in our Workforce is one of the five areas of concentration in our "Building a Sustainable Future 2030" strategy.
Our People: Our award-winning, multigenerational workforce includes talented people from all walks of life, in many stages of life. Made up of management and craft professionals, we are focused on attracting, retaining, and developing talent across our entire system.
As of December 31, 2022, the Company employed 33,179 employees. Our workforce includes five generations from Traditionalists (born before 1946) to Generation Z (born after 1998). The average age is 46.5 with average tenure of 15.8 years.
Union Pacific works with 13 major rail unions, representing approximately 83% of our workforce. Most craft professionals and more than 45 railroads participate in negotiations on a national multi-employer basis. The National Carriers Conference Committee of the National Railway Labor Conference, consisting of the top labor officers in most Class I railroads, is the bargaining committee for the industry. Railroads are governed by the Railway Labor Act (RLA), a federal statute enacted in 1926 to bring the railroads and unions to agreement without disruptions to rail transportation. The RLA includes numerous safeguards to help overcome bargaining stalemates.
The recent round of labor negotiations related to years 2020-2024 concluded in December 2022. See Management’s Discussion and Analysis of Financial Condition and Results of Operations – Other Matters – Labor Agreements, Item 7, of this report for information about the conclusion of the 2020-2024 negotiations. The next round of negotiations begins on January 1, 2025, related to years 2025-2029.
Our Culture: We incorporate our commitment to safety, high ethical standards, passion for performance, and teamwork into our day-to-day operations as we service our customers.
Safety is central to everything we do at Union Pacific. Together, we are committed to cultivating a safety-focused culture, so our employees return home safely every day. To achieve this, our employees identify risks, initiate action to mitigate those risks, and have the courage to care to keep each other safe.
Our success is measured by our personal injury rate (the number of reportable injuries for every 200,000 employee-hours worked), and our derailment incident rate (the number of reportable derailment incidents per million train miles). Reportable personal injuries are defined as on duty incidents or occupational illnesses that result in employees losing time away from work, modifying or restricting their normal duties, or receiving any medical treatment above and beyond first aid. Reportable derailment incidents are defined as any occurrence where a wheel of a locomotive or rail car falls off the track that causes damage to track, equipment, or structures above the Federal Railroad Administration (FRA) reporting threshold, regardless of ownership ($11,300 for 2022 and $11,500 for 2023). The personal injuries and derailment incidents that meet reportable criteria are reported to the FRA.
Our 2022 personal injury rate of 0.80 improved 18% while our derailment incident rate of 2.88 increased 8% versus 2021. (See further discussion in Management’s Discussion and Analysis of Financial Condition and Results of Operations, Item 7, of this report.)
Diversity, Equity, and Inclusion: Union Pacific’s commitment to diversity and inclusion is based on our desire to create an environment where people can be their best, personally and professionally. From an employee’s perspective, a diverse culture increases engagement, improves morale, and supports safety. From a business perspective, diversity improves the Company’s decision-making, problem-solving, and strategic thinking, which translates into a competitive advantage with bottom-line results.
Union Pacific’s commitment, today and for the future, is to further improve and strengthen performance through an inclusive workforce that reflects the diverse markets and communities we serve, where everyone is treated fairly, and differences are valued. To that end, Union Pacific established a goal to reach 40% people of color and double our female representation to 11% in our workforce by 2030. As of December 31, 2022, workforce representation of people of color and females was approximately 32.8% and 5.5%, respectively.
The Employee Journey: From recruitment to retirement and milestones in between, we are relentlessly focused on supporting and engaging employees throughout their Union Pacific journey. We view it as imperative to invest in our employees with meaningful benefit offerings, developmental experiences, and career opportunities.
The process begins with recruitment, where we strive to attract the most talented and diverse employees to join our team. Then, we focus on training and development, which includes programs designed to recognize potential and to help our employees grow into new roles so that we can retain our workforce over time.
Providing competitive compensation and meaningful benefits is key to attracting and retaining talented employees. Union Pacific is committed to continuously reviewing its compensation programs and comprehensive benefits programs to promote programs that are fair and competitive. Both are key to enhancing the value of working for Union Pacific and demonstrating the Company’s commitment to the health and wealth of employees during their career. Benefits vary based on the applicable collective bargaining agreement or an employee’s management status. The final stage of the employee journey is a fulfilling retirement, which is enabled during their UP career through our compensation and benefit programs, particularly contributions to 401(k) plans and the employee stock purchase plan (ESPP).
Our Board of Directors evaluates our non-union compensation plans and reviews recommendations from the Compensation and Benefits Committee, while collective bargaining agreements govern compensation for our union employees. The median annual compensation for all employees employed as of December 31, 2022, was $86,778 (excluding the CEO).
Talent is critical – our ability to recruit and retain employees is directly tied to our railroad’s fluidity. Without team members to dispatch or operate trains, our network struggles to provide customers efficient, reliable service.
We accelerated recruitment efforts in 2022, requiring us to evolve our hiring practices and incorporate innovative strategies. From virtual career fairs to pre-recorded video interviews, we implemented robust recruiting tools to meet candidates where they are and provide an efficient, user-friendly experience through every phase of the recruitment process.
We've also been aggressive in how we compete to attract talent in the marketplace. In particularly hard-to-fill jobs and locations, we offered hiring incentives. These incentives are a mix of travel allowances and relocation bonuses, as well as local hiring bonuses to attract applicants already residing in the communities we serve.
We continue driving inclusivity into our hiring process. We’re removing bias by using software tools to confirm gender-neutral language in job postings, as well as providing video demonstrations and visual cues during physical abilities tests. Pre-recorded video interviews allow applicants to participate at a time that works best for their schedule, accommodating those who may have nontraditional schedules.
And finally, tapping into those who know us best – employee referrals played an important part in building our team. The “Great People Know Great People” employee referral program offers an incentive for each referral hired. In 2022, we hired more than 1,250 referred employees.
Further discussion can be found in our “We Are One” report available on our website.
Railroad Security – Our security efforts consist of a wide variety of measures, including employee training, engagement with our customers, training of emergency responders, and partnerships with numerous federal, state, and local government agencies. While federal law requires us to protect the confidentiality of our security plans designed to safeguard against terrorism and other security incidents, the following provides a general overview of our security initiatives.
UPRR Security Measures – We maintain a comprehensive security plan designed to both deter and respond to any potential or actual threats as they arise. The plan includes four levels of alert status, each with its own set of countermeasures. We employ our own police force, consisting of commissioned and highly-trained officers. The police are certified state law enforcement officers with investigative and arrest powers. The Union Pacific Police Department has achieved accreditation under the Commission on Accreditation for Law Enforcement Agencies, Inc. (CALEA) for complying with the highest law enforcement standards. Our employees undergo recurrent security and preparedness training as well as federally mandated hazardous materials and security training. We regularly review the sufficiency of our employee training programs. We maintain the capability to move critical operations to back-up facilities in different locations.
We operate an emergency response management center 24 hours a day. The center receives reports of emergencies, dangerous or potentially dangerous conditions, and other safety and security issues from our employees, the public, law enforcement, and other government officials. In cooperation with government officials, we monitor both threats and public events, and, as necessary, we may alter rail traffic flow at times of concern to minimize risk to communities and our operations. We comply with the hazardous materials routing rules and other requirements imposed by federal law. We design our operating plan to expedite the movement of hazardous material shipments to minimize the time rail cars remain idle at yards and terminals located in or near major population centers. Additionally, in compliance with Transportation Security Administration (TSA) regulations, we deployed information systems and instructed employees in tracking and documenting the handoff of Rail Security Sensitive Materials with customers and interchange partners.
We established a number of our own innovative safety and security-oriented initiatives ranging from various investments in technology to The Officer on Train program, which provides local law enforcement officers with the opportunity to ride with train crews to enhance their understanding of railroad operations and risks. Our staff of information security professionals continually assess cybersecurity risks and implement mitigation programs that evolve with the changing technology threat environment. To date, we have not experienced any material disruption of our operations due to a cyber threat or attack directed at us.
Cooperation with Federal, State, and Local Government Agencies – We work closely on physical and cybersecurity initiatives with government agencies, including the U.S. Department of Transportation (DOT); the Department of Homeland Security (DHS), along with its Cybersecurity & Infrastructure Security Agency (CISA) and TSA; as well as local police departments, fire departments, and other first responders. In connection with new guidance from the TSA, effective January 1, 2022, we were required to report cyber incidents to CISA. Additionally, during 2022, as required by the TSA guidance, we performed a cyber vulnerability self-assessment, submitted the results to the TSA, assembled and adopted a cyber incident response plan, and appointed cybersecurity coordinators. During 2023, we are required to comply with the second directive from the TSA, effective October 18, 2022. By February 21, 2023, we are required to develop and implement a cybersecurity implementation plan. Afterwards we need to establish a cybersecurity assessment plan that describes how the Company will proactively and regularly assess the effectiveness of cybersecurity measures as well as identify and resolve device, network, and system vulnerabilities. In conjunction with the Association of American Railroads (AAR), we sponsor Ask Rail, a mobile application that provides first responders with secure links to electronic information, including commodity and emergency response information required by emergency personnel to respond to accidents and other situations. We also participate in the National Joint Terrorism Task Force, a multi-agency effort established by the U.S. Department of Justice and the Federal Bureau of Investigation to combat and prevent terrorism.
We work with the Coast Guard, U.S. Customs and Border Protection (CBP), and the Military Transport Management Command, which monitor shipments entering the UPRR rail network at U.S. border crossings and ports. We were the first railroad in the U.S. to be named a partner in CBP’s Customs-Trade Partnership Against Terrorism, a partnership designed to develop, enhance, and maintain effective security processes throughout the global supply chain.
Cooperation with Customers and Trade Associations – Through TransCAER (Transportation Community Awareness and Emergency Response), we work with the AAR, the American Chemistry Council, the American Petroleum Institute, and other chemical trade groups to provide communities with preparedness tools, including the training of emergency responders. In cooperation with the FRA and other interested groups, we are also working to develop additional improvements to tank car design that will further limit the risk of releases of hazardous materials.
Sustainable Future – Union Pacific believes it is important that we act as environmental stewards, reducing emissions and supporting the transition to a more sustainable future. While we work to further reduce our environmental footprint, it is important to note that railroads already are one of the most fuel-efficient means of transportation. According to the AAR, moving freight by rail instead of truck reduces greenhouse gas (GHG) emissions by up to 75%. Building on rail’s relative emissions benefits over other modes of transportation, we are taking additional actions to reduce our emissions. These actions are described in our Climate Action Plan on our website.
Competition – see “We Face Competition from Other Railroads and Other Transportation Providers” in the Risk Factors in Item 1A of this report.
Key Suppliers – see “We Are Dependent on Certain Key Suppliers of Locomotives and Rail” in the Risk Factors in Item 1A of this report.
Available Information – Our Internet website is www.up.com. We make available free of charge on our website (under the “Investors” caption link) our Annual Reports on Form 10-K; our Quarterly Reports on Form 10-Q; our current reports on Form 8-K; our proxy statements; Forms 3, 4, and 5, filed on behalf of our directors and certain executive officers; and amendments to such reports filed or furnished pursuant to the Securities Exchange Act of 1934, as amended (the Exchange Act). We provide these reports and statements as soon as reasonably practicable after such material is electronically filed with, or furnished to, the SEC. We also make available on our website previously filed SEC reports and exhibits via a link to EDGAR on the SEC’s Internet site at www.sec.gov. Additionally, our corporate governance materials, including By-Laws, Board Committee charters, governance guidelines and policies, and codes of conduct and ethics for directors, officers, and employees are available on our website. From time to time, the corporate governance materials on our website may be updated as necessary to comply with rules issued by the SEC and the NYSE or as desirable to promote the effective and efficient governance of our Company. Any security holder wishing to receive, without charge, a copy of any of our SEC filings or corporate governance materials should send a written request to: Secretary, Union Pacific Corporation, 1400 Douglas Street, Omaha, NE 68179.
References to our website address, the "We Are One" report, and the Climate Action Plan, in this report, including references in Management’s Discussion and Analysis of Financial Condition and Results of Operations, Item 7, are provided as a convenience and do not constitute, and should not be deemed, an incorporation by reference of the information contained on, or available through, the website. Therefore, such information should not be considered part of this report.
GOVERNMENTAL AND ENVIRONMENTAL REGULATION
Governmental Regulation – Our operations are subject to a variety of federal, state, and local regulations, generally applicable to all businesses. (See also the discussion of certain regulatory proceedings in Legal Proceedings, Item 3.)
The operations of the Railroad are subject to the regulations of the FRA and other federal and state agencies as well as the regulatory jurisdiction of the Surface Transportation Board (STB). The STB has jurisdiction over rates charged on certain regulated rail traffic; common carrier service of regulated traffic; freight car compensation; transfer, extension, or abandonment of rail lines; and acquisition of control of rail common carriers. The STB continues its efforts to explore expanding rail regulation and is reviewing proposed rulemaking in various areas, including reciprocal switching and commodity exemptions, and has finalized rules creating new procedures for smaller rate complaints that are being reviewed in appellate courts. The STB also continues to explore changes to the methodology for determining railroad revenue adequacy and the possible uses of revenue adequacy in regulating railroad rates. The STB posts quarterly reports on rate reasonableness cases, maintains a database on service complaints, and has the authority to initiate investigations, among other things.
DOT, the Occupational Safety and Health Administration, the Pipeline and Hazardous Materials Safety Administration, and DHS, along with other federal agencies, have jurisdiction over certain aspects of safety, movement of hazardous materials and hazardous waste, emissions requirements, and equipment standards. Additionally, various state and local agencies have jurisdiction over disposal of hazardous waste and seek to regulate movement of hazardous materials in ways not preempted by federal law.
Environmental Regulation – We are subject to extensive federal and state environmental statutes and regulations pertaining to public health and the environment. The statutes and regulations are administered and monitored by the Environmental Protection Agency (EPA) and by various state environmental agencies. The primary laws affecting our operations are the Resource Conservation and Recovery Act, regulating the management and disposal of solid and hazardous wastes; the Comprehensive Environmental Response, Compensation, and Liability Act, regulating the cleanup of contaminated properties; the Clean Air Act, regulating air emissions; and the Clean Water Act, regulating wastewater discharges.
Information concerning environmental claims and contingencies and estimated remediation costs is set forth in Management’s Discussion and Analysis of Financial Condition and Results of Operations – Critical Accounting Estimates – Environmental, Item 7, and Note 17 to the Financial Statements and Supplementary Data, Item 8.
Item 1A. Risk Factors
The following discussion addresses significant factors, events, and uncertainties that make an investment in our securities risky and provides important information for the understanding of our “forward-looking statements,” which are discussed immediately preceding Item 7A of this Form 10-K and elsewhere. The risk factors set forth in this Item 1A should be read in conjunction with the rest of the information included in this report, including Management’s Discussion and Analysis of Financial Condition and Results of Operations, Item 7, and Financial Statements and Supplementary Data, Item 8.
We urge you to consider carefully the factors described below and the risks that they present for our operations as well as the risks addressed in other reports and materials that we file with the SEC and the other information included or incorporated by reference in this Form 10-K. When the factors, events, and contingencies described below or elsewhere in this Form 10-K materialize, our business, reputation, financial condition, results of operations, cash flows, or prospects can be materially adversely affected. In such case, the trading price of our common stock could decline and you could lose part or all of your investment. Additional risks and uncertainties not currently known to us or that we currently deem immaterial may also materially adversely affect our business, reputation, financial condition, results of operations, cash flows, and prospects.
Strategic and Operational Risks
We Must Manage Fluctuating Demand for Our Services and Network Capacity – Significant reductions in demand for rail services with respect to one or more commodities or changes in consumer preferences that affect the businesses of our customers can lead to increased costs associated with resizing our operations, including higher unit operating costs and costs for the storage of locomotives, rail cars, and other equipment; workforce adjustments; and other related activities, which could have a material adverse effect on our results of operations, financial condition, and liquidity. If there is significant demand for our services that exceeds the designed capacity of our network or shifts in traffic flow that are contrary to the designed capacity of our network, we may experience network difficulties, including congestion and reduced velocity, that could compromise the level of service we provide to our customers. This level of demand may also compound the impact of weather and weather-related events on our operations and velocity. Although we continue to work to improve our transportation plan, add capacity, improve operations at our yards and other facilities, and improve our ability to address surges in demand for any reason with adequate resources, we cannot be sure that these measures will fully or adequately address any service shortcomings resulting from demand exceeding our planned capacity. We may experience other operational or service difficulties related to network capacity, dramatic and unplanned fluctuations in our customers’ demand for rail service with respect to one or more commodities or operating regions, or other events that could negatively impact our operational efficiency, which could all have a material adverse effect on our results of operations, financial condition, and liquidity.
We Transport Hazardous Materials – We transport certain hazardous materials and other materials, including crude oil, ethanol, and toxic inhalation hazard (TIH) materials, such as chlorine, that pose certain risks in the event of a release or combustion. Additionally, U.S. laws impose common carrier obligations on railroads that require us to transport certain hazardous materials regardless of risk or potential exposure to loss. A rail accident or other incident or accident on our network, at our facilities, or at the facilities of our customers involving the release or combustion of hazardous materials could involve significant costs and claims for personal injury, property damage, and environmental penalties and remediation in excess of our insurance coverage for these risks, which could have a material adverse effect on our results of operations, financial condition, and liquidity.
We Rely on Technology and Technology Improvements in Our Business Operations – We rely on information technology in all aspects of our business, including technology systems operated by us or under control of third-parties. If we do not have sufficient capital or do not deploy sufficient capital in a timely manner to acquire, develop, or implement new technology or maintain or upgrade current systems, such as Positive Train Control (PTC) or the latest version of our transportation control systems, we may suffer a rail service outage or competitive disadvantage within the rail industry and with companies providing other modes of transportation service, which could have a material adverse effect on our results of operations, financial condition, and liquidity.
We Are Subject to Cybersecurity Risks – We rely on information technology in all aspects of our business, including technology systems operated by us (whether created by us or purchased), under control of third-parties, and open-source software. Although we devote significant resources to protect our technology systems and proprietary data, we have experienced and will likely continue to experience varying degrees of cyber incidents in the normal course of business. There can be no assurance that the systems we have designed to identify, prevent, or limit the effects of cyber incidents or attacks will be sufficient to prevent or detect such incidents or attacks, or to avoid a material adverse impact on our systems after such incidents or attacks do occur. Furthermore, due to the rising numbers and increasing sophistication of cyber-attacks, an increasingly complex information technology supply chain, and the nature of zero-day exploits, we may be unable to anticipate or implement adequate preventative measures to prevent a security breach, including by ransomware, human error, or other cyber-attack methods, from materially disrupting our systems or the systems of third-parties upon which we rely. A successful cyber-attack that results in significant service interruption; safety failure; other operational difficulties; unauthorized access to (or the loss of access to) competitively sensitive, confidential, or other critical data or systems; loss of customers; financial losses; regulatory fines; and misuse or corruption of critical data and proprietary information, could have a material adverse impact on our results of operations, financial condition, and liquidity. We may experience security breaches that could remain undetected for an extended period and, therefore, have a greater impact on the services we offer. Additionally, we may be exposed to increased cybersecurity risk because we are a component of the critical U.S. infrastructure.
Severe Weather Could Result in Significant Business Interruptions and Expenditures – As a railroad with a vast network, we are exposed to severe weather conditions and other natural phenomena, including earthquakes, hurricanes, fires, floods, mudslides or landslides, extreme temperatures, avalanches, and significant precipitation, and climate change may cause or contribute to the severity or frequency of such weather conditions. Line outages and other interruptions caused by these conditions can adversely affect our entire rail network, potentially negatively affecting revenues, costs, and liabilities, despite efforts we undertake to plan for these events. Our revenues can also be adversely affected by severe weather that causes damage and disruptions to our customers. These impacts caused by severe weather could have a material adverse effect on our results of operations, financial condition, and liquidity.
A Significant Portion of Our Revenues Involves Transportation of Commodities to and from International Markets – Although revenues from our operations are attributable to transportation services provided in the U.S., a significant portion of our revenues involves the transportation of commodities to and from international markets, including Mexico, Canada, and Southeast Asia, by various carriers and, at times, various modes of transportation. Significant and sustained interruptions of trade with Mexico, Canada, or countries in Southeast Asia, including China, could adversely affect customers and other entities that, directly or indirectly, purchase or rely on rail transportation services in the U.S. as part of their operations, and any such interruptions could have a material adverse effect on our results of operations, financial condition, and liquidity. Any one or more of the following could cause a significant and sustained interruption of trade with Mexico, Canada, or countries in Southeast Asia: (a) a deterioration of security for international trade and businesses; (b) the adverse impact of new laws, rules, and regulations or the interpretation of laws, rules, and regulations by government entities, courts, or regulatory bodies, including the United States-Mexico-Canada Agreement (USMCA) and a “Phase One” trade agreement with China; (c) actions of taxing authorities that affect our customers doing business in foreign countries; (d) any significant adverse economic developments, such as extended periods of high inflation, material disruptions in the banking sector or in the capital markets of these foreign countries, and significant changes in the valuation of the currencies of these foreign countries that could materially affect the cost or value of imports or exports; (e) shifts in patterns of international trade that adversely affect import and export markets; (f) a material reduction in foreign direct investment in these countries; and (g) public health crises, including the outbreak of pandemic or contagious disease, such as the coronavirus and its variant strains (COVID).
We Are Dependent on Certain Key Suppliers of Locomotives and Rail – Due to the capital-intensive nature and sophistication of locomotive equipment, parts, and maintenance, potential new suppliers face high barriers to entry. Therefore, if one of the domestic suppliers of locomotives discontinues manufacturing locomotives, supplying parts, or providing maintenance for any reason, including bankruptcy or insolvency or the inability to manufacture locomotives that meet efficiency or regulatory emissions standards, we could experience significant cost increases and reduced availability of the locomotives that are necessary for our operations. Additionally, we utilize a limited number of steel producers that meet our specifications. Rail is critical to our operations for rail replacement programs, maintenance, and for adding additional network capacity, new rail and storage yards, and expansions of existing facilities. This industry similarly has high barriers to entry, and if one of these suppliers discontinues operations for any reason, including bankruptcy or insolvency, we could experience both significant cost increases for rail purchases and difficulty obtaining sufficient rail for maintenance and other projects. Changes to trade agreements or policies that result in increased tariffs on goods imported into the United States could also result in significant cost increases for rail purchases and difficulty obtaining sufficient rail.
Workforce Risks
Strikes or Work Stoppages Could Adversely Affect Our Operations – The U.S. Class I railroads are party to collective bargaining agreements with various labor unions. The majority of our employees belong to labor unions and are subject to these agreements. Disputes over the terms of these agreements or our potential inability to negotiate acceptable contracts with these unions can lead to, among other things, strikes, work stoppages, slowdowns, or lockouts, which could cause a significant disruption of our operations and have a material adverse effect on our results of operations, financial condition, and liquidity. Additionally, future national labor agreements, or renegotiation of labor agreements or provisions of labor agreements, could compromise our service reliability or significantly increase our costs for health care, wages, and other benefits, which could have a material adverse impact on our results of operations, financial condition, and liquidity. Labor disputes, work stoppages, slowdowns, or lockouts at loading/unloading facilities, ports, or other transport access points could compromise our service reliability and have a material adverse impact on our results of operations, financial condition, and liquidity. Labor disputes, work stoppages, slowdowns, or lockouts by employees of our customers or our suppliers could compromise our service reliability and have a material adverse impact on our results of operations, financial condition, and liquidity.
The Availability of Qualified Personnel Could Adversely Affect Our Operations – Changes in demographics, training requirements, and pandemic illnesses or restrictions could negatively affect the availability of qualified personnel for us, our customers, and throughout the supply chain. Our ability to quickly react to other factors that affect our ability to attract and retain employees may be restricted due to limited flexibility to make unilateral changes to collective bargaining agreements, which cover the majority of our workforce. Unpredictable increases in demand for rail services and a lack of network fluidity may exacerbate our risks, which could have a negative impact on our operational efficiency and otherwise have a material adverse effect on our results of operations, financial condition, and liquidity.
Legal and Regulatory Risks
We Are Subject to Significant Governmental Regulation – We are subject to governmental regulation by a significant number of federal, state, and local authorities covering a variety of health, safety, labor, environmental, economic (as discussed below), tax, and other matters. Many laws and regulations require us to obtain and maintain various licenses, permits, and other authorizations, and we cannot guarantee that we will continue to be able to do so. Our failure to comply with applicable laws and regulations could have a material adverse effect on us. Governments or regulators may change the legislative or regulatory frameworks that we operate in without providing us any recourse to address any adverse effects on our business, including, without limitation, regulatory determinations or rules regarding dispute resolution, increasing the amount of our traffic subject to common carrier regulation, business relationships with other railroads, use of embargoes, calculation of our cost of capital or other inputs relevant to computing our revenue adequacy, the prices we charge, changes in tax rates, enactment of new tax laws, and revision in tax regulations. Significant legislative activity in Congress or regulatory activity by the STB could expand regulation of railroad operations and pricing for rail services, which could reduce capital spending on our rail network, facilities, and equipment, and have a material adverse effect on our results of operations, financial condition, and liquidity.
We May Be Subject to Various Claims and Lawsuits That Could Result in Significant Expenditures – As a railroad with operations in densely populated urban areas and a vast rail network, we are exposed to the potential for various claims and litigation related to labor and employment, personal injury, property damage, environmental liability, and other matters. Any material changes to litigation trends or a catastrophic rail accident or series of accidents involving any or all of property damage, personal injury, and environmental liability that exceed our insurance coverage for such risks could have a material adverse effect on our results of operations, financial condition, and liquidity.
We Are Subject to Significant Environmental Laws and Regulations – Due to the nature of the railroad business, our operations are subject to extensive federal, state, and local environmental laws and regulations concerning, among other things, emissions to the air; discharges to waters; handling, storage, transportation, and disposal of waste and other materials; and hazardous material or petroleum releases. We generate and transport hazardous and non-hazardous waste in our operations. Environmental liability can extend to previously owned or operated properties, leased properties, properties owned by third-parties, as well as properties we currently own. Environmental liabilities have arisen and may also arise from claims asserted by adjacent landowners or other third-parties in toxic tort litigation. We have been and may be subject to allegations or findings that we have violated, or are strictly liable under, these laws or regulations. We currently have certain obligations at existing sites for investigation, remediation, and monitoring, and we likely will have obligations at other sites in the future. We maintain adequate reserves for liabilities for these obligations, but fluctuations of potential costs affect our estimates based on our experience and, as necessary, the advice and assistance of our consultants. However, actual costs may vary from our estimates due to any or all of several factors, including changes to environmental laws or interpretations of such laws, technological changes affecting investigations and remediation, the participation and financial viability of other parties responsible for any such liability, and the corrective action or change to corrective actions required to remediate any existing or future sites. We could incur significant costs as a result of any of the foregoing, and we may be required to incur significant expenses to investigate and remediate known, unknown, or future environmental contamination, which could have a material adverse effect on our results of operations, financial condition, and liquidity.
Macroeconomic and Industry Risks
We Face Competition from Other Railroads and Other Transportation Providers – We face competition from other railroads, motor carriers, ships, barges, and pipelines. Our main railroad competitor is Burlington Northern Santa Fe LLC. Its primary subsidiary, BNSF Railway Company (BNSF), operates parallel routes in many of our main traffic corridors. In addition, we operate in corridors served by other railroads and motor carriers. Motor carrier competition exists in all three of our commodity groups. Because of the proximity of our routes to major inland and Gulf Coast waterways, barges can be particularly competitive, especially for grain and bulk commodities in certain areas where we operate. In addition to price competition, we face competition with respect to transit times, quality, and reliability of service from motor carriers and other railroads. Motor carriers in particular can have an advantage over railroads with respect to transit times and timeliness of service. However, railroads are much more fuel-efficient than trucks, which reduces the impact of transporting goods on the environment and public infrastructure, and we have been making efforts to convert truck traffic to rail. Additionally, we must build or acquire and maintain our rail system, while trucks, barges, and maritime operators are able to use public rights-of-way maintained by public entities. Any of the following could also affect the competitiveness of our transportation services for some or all of our commodities, which could have a material adverse effect on our results of operations, financial condition, and liquidity: (a) improvements or expenditures materially increasing the quality or reducing the costs of these alternative modes of transportation, such as autonomous or more fuel efficient trucks, (b) legislation that eliminates or significantly increases the size or weight limitations applied to motor carriers, or (c) legislation or regulatory changes that impose operating restrictions on railroads or that adversely affect the profitability of some or all railroad traffic. Many movements face product or geographic competition where our customers can use different products (e.g., natural gas instead of coal, sorghum instead of corn) or commodities from different locations (e.g., grain from states or countries that we do not serve, crude oil from different regions). Sourcing different commodities or different locations allows shippers to substitute different carriers and such competition may reduce our volume or constrain prices. Additionally, any future consolidation of the rail industry could materially affect our competitive environment.
We May Be Affected by Climate Change and Market or Regulatory Responses to Climate Change – Climate change, including the impact of global warming and transition risks involving policy, legal risks, and market risks, could have a material adverse effect on our results of operations, financial condition, and liquidity over both a long-term and near-term basis. Restrictions, caps, taxes, or other controls on emissions of GHGs, including diesel exhaust, could significantly increase our operating costs. Restrictions on emissions could also affect our customers that (a) use commodities that we carry to produce energy, (b) use significant amounts of energy in producing or delivering the commodities we carry, or (c) manufacture or produce goods that consume significant amounts of energy or burn fossil fuels, including chemical producers, farmers and food producers, and automakers and other manufacturers. Significant cost increases, government regulation, or changes of consumer preferences for goods or services relating to alternative sources of energy, emissions reductions, and GHG emissions could materially affect the markets for the commodities we carry and demand for our services, which in turn could have a material adverse effect on our results of operations, financial condition, and liquidity. Government incentives encouraging the use of alternative sources of energy also could affect certain of our customers and the markets for certain of the commodities we carry in an unpredictable manner that could alter our traffic patterns, including, for example, increasing royalties charged to producers of PRB coal by the U.S. Department of Interior and the impacts of ethanol incentives on farming and ethanol producers. We could face increased costs related to defending and resolving legal claims and other litigation related to climate change and the alleged impact of our operations on climate change. Violent weather caused by climate change, including hurricanes, fires, floods, extreme temperatures, avalanches, and significant precipitation could cause line outages and other interruptions to our infrastructure. Any of these factors, individually or in operation with one or more of the other factors, or other unpredictable impacts of climate change could reduce the amount of traffic we handle and have a material adverse effect on our results of operations, financial condition, and liquidity. While we work to implement our Climate Action Plan, our efforts to achieve emission reduction targets could significantly increase our operational costs and capital expenditures.
Our Business, Financial Condition, and Results of Operations have been Adversely Affected, and in the Future, Could be Materially Adversely Affected by Pandemics or Other Public Health Crises – Pandemics, epidemics, and other outbreaks of disease can have significant and widespread impacts. As we saw during the peaks of the COVID pandemic, outbreaks of disease can cause a global slowdown of economic activity (including the decrease in demand for a broad variety of goods), disruptions in global supply chains, and significant volatility and disruption of financial markets, resulting further in adverse effects on workforces, customers, and regional and local economies. The impact of pandemics or public health crises on our results of operations and financial condition may depend on numerous evolving factors, including, but not limited to: governmental, business, and individuals’ actions that have been and continue to be taken in response to a global pandemic or other public health crises (including restrictions on travel and transport, workforce pressures, social distancing, and shelter-in-place orders); the effect of a pandemic or other public health crises on economic activity and actions taken in response; the effect on our customers and their demand for our services; the effect of a pandemic or other public health crises on the credit-worthiness of our customers; national or global supply chain challenges or disruption; facility closures; commodity cost volatility; general macroeconomic uncertainty in key global markets and financial market volatility; global economic conditions and levels of economic growth; and the pace of recovery as the pandemic subsides as well as response to a potential reoccurrence. Further, a pandemic or other public health crises, and the volatile regional and global economic conditions stemming from such an event, could also precipitate and aggravate the other risk factors that we identify, which could materially adversely affect our business, financial condition, results of operations (including revenues and profitability), and/or stock price. Additionally, a pandemic or other public health crises also may affect our operating and financial results in a manner that is not presently known to us or that we currently do not consider to present significant risks to our operations.
Financial Risks
We Are Affected By Fluctuating Fuel Prices – Fuel costs constitute a significant portion of our transportation expenses. Diesel fuel prices can be subject to dramatic fluctuations, and significant price increases could have a material adverse effect on our operating results. Although we currently are able to recover a significant amount of our fuel expenses from our customers through revenues from fuel surcharges, we cannot be certain that we will always be able to mitigate rising or elevated fuel costs through our fuel surcharges. Additionally, future market conditions or legislative or regulatory activities could adversely affect our ability to apply fuel surcharges or adequately recover increased fuel costs through fuel surcharges. As fuel prices fluctuate, our fuel surcharge programs trail such fluctuations in fuel price by approximately two months, and may be a significant source of quarter-over-quarter and year-over-year volatility, particularly in periods of rapidly changing prices. International, political, and economic factors, events and conditions, including the start of the Russian-Ukraine conflict in late February 2022, affect the volatility of fuel prices and supplies. Weather can also affect fuel supplies and limit domestic refining capacity. A severe shortage of, or disruption to, domestic fuel supplies could have a material adverse effect on our results of operations, financial condition, and liquidity. Alternatively, lower fuel prices could have a positive impact on the economy by increasing consumer discretionary spending that potentially could increase demand for various consumer products we transport. However, lower fuel prices could have a negative impact on other commodities we transport, such as coal and domestic drilling-related shipments, which could have a material adverse effect on our results of operations, financial condition, and liquidity.
We Rely on Capital Markets – Due to the significant capital expenditures required to operate and maintain a safe and efficient railroad, we rely on the capital markets to provide some of our capital requirements. We utilize long-term debt instruments, bank financing, and commercial paper, and we pledge certain amount of our receivables as collateral for credit. Significant instability or disruptions of the capital markets, including, among other things, current rising interest rates in the credit markets, or deterioration of our financial condition due to internal or external factors could restrict or prohibit our access to, and significantly increase the cost of, commercial paper and other financing sources, including bank credit facilities and the issuance of long-term debt, including corporate bonds. A significant deterioration of our financial condition could result in a reduction of our credit rating to below investment grade, which could restrict us from utilizing our current receivables securitization facility (Receivables Facility). This may also limit our access to external sources of capital and significantly increase the costs of short and long-term debt financing.
General Risk Factors
We Are Affected by General Economic Conditions – Prolonged, severe adverse domestic and global macroeconomic conditions or disruptions of financial and credit markets, including, for example, the recessionary fears and high inflation we are seeing in the current economic environment, may affect the producers and consumers of the commodities we carry and may have a material adverse effect on our access to liquidity, results of operations, and financial condition.
We May Be Affected by Acts of Terrorism, War, or Risk of War – Our rail lines, facilities, and equipment, including rail cars carrying hazardous materials, could be direct targets or indirect casualties of terrorist attacks. Terrorist attacks, or other similar events, any government response thereto, and war or risk of war may adversely affect our results of operations, financial condition, and liquidity. In addition, insurance premiums for some or all of our current coverages could increase dramatically, or certain coverages may not be available to us in the future.
Item 1B. Unresolved Staff Comments
None.
Item 2. Properties
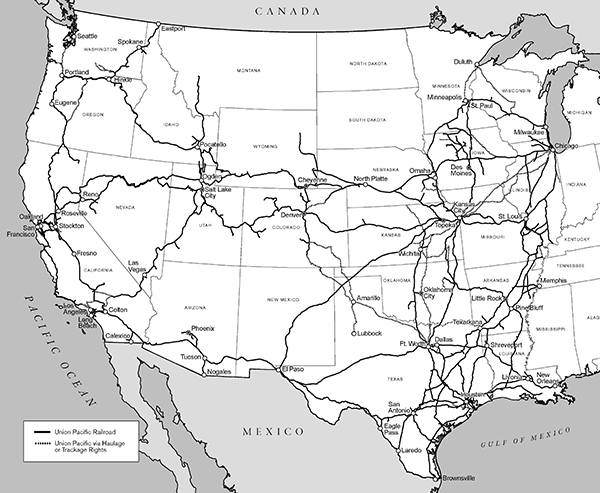
We employ a variety of assets in the management and operation of our rail business. Our rail network covers 23 states in the western two-thirds of the U.S.
TRACK
Our rail network includes 32,534 route miles. We own 26,121 miles and operate on the remainder pursuant to trackage rights or leases. The following table describes track miles:
| As of December 31, | 2022 | 2021 | ||||||
|---|---|---|---|---|---|---|---|---|
| Route | 32,534 | 32,452 | ||||||
| Other main line | 7,113 | 7,093 | ||||||
| Passing lines and turnouts | 3,454 | 3,412 | ||||||
| Switching and classification yard lines | 8,853 | 8,887 | ||||||
| Total miles | 51,954 | 51,844 |
HEADQUARTERS BUILDING
We own our headquarters building in Omaha, Nebraska. The facility has 1.2 million square feet of space that can accommodate approximately 4,000 employees.
HARRIMAN DISPATCHING CENTER
The Harriman Dispatching Center (HDC), located in Omaha, Nebraska, is our primary dispatching facility. It is linked to regional dispatching and locomotive management facilities at various locations along our network. HDC employees coordinate moves of locomotives and trains, manage traffic and train crews on our network, and coordinate interchanges with other railroads. Generally, around 500 employees work on-site in the facility. In the event of a disruption of operations at HDC due to a cyber-attack, flooding or severe weather, pandemic outbreak, or other event, we maintain the capability to conduct critical operations at back-up facilities in different locations.
RAIL FACILITIES
In addition to our track structure, we operate numerous facilities, including terminals for intermodal and other freight; rail yards for building trains (classification yards), switching, storage-in-transit (the temporary storage of customer goods in rail cars prior to shipment), and other activities; offices to administer and manage our operations; dispatching centers to direct traffic on our rail network; crew on duty locations for train crews along our network; and shops and other facilities for fueling, maintenance, and repair of locomotives and repair and maintenance of rail cars and other equipment. The following table includes the major yards and terminals on our system:
| Major Classification Yards | Major Intermodal Terminals |
|---|---|
| North Platte, Nebraska | Joliet (Global 4), Illinois |
| Englewood (Houston), Texas | Global II (Chicago), Illinois |
| North Little Rock, Arkansas | East Los Angeles, California |
| Livonia, Louisiana | Mesquite, Texas |
| West Colton, California | Lathrop, California |
| Fort Worth, Texas | LATC (Los Angeles), California |
| Houston, Texas | ICTF (Los Angeles), California |
| Roseville, California | Marion, Arkansas |
RAIL EQUIPMENT
Our equipment includes owned and leased locomotives and rail cars; heavy maintenance equipment and machinery; other equipment and tools in our shops, offices, and facilities; and vehicles for maintenance, transportation of crews, and other activities. As of December 31, 2022, we owned or leased the following units of equipment:
| Average | ||||||||||||||||
|---|---|---|---|---|---|---|---|---|---|---|---|---|---|---|---|---|
| Locomotives | Owned | Leased | Total | Age (yrs.) | ||||||||||||
| Multiple purpose | 6,083 | 1,038 | 7,121 | 23.4 | ||||||||||||
| Switching | 149 | - | 149 | 42.7 | ||||||||||||
| Other | 15 | 53 | 68 | 42.5 | ||||||||||||
| Total locomotives | 6,247 | 1,091 | 7,338 | N/A |
| Average | ||||||||||||||||
|---|---|---|---|---|---|---|---|---|---|---|---|---|---|---|---|---|
| Freight cars | Owned | Leased | Total | Age (yrs.) | ||||||||||||
| Covered hoppers | 13,360 | 9,714 | 23,074 | 22.1 | ||||||||||||
| Open hoppers | 4,926 | 779 | 5,705 | 35.8 | ||||||||||||
| Gondolas | 6,188 | 4,060 | 10,248 | 24.2 | ||||||||||||
| Boxcars | 2,598 | 6,877 | 9,475 | 38.2 | ||||||||||||
| Refrigerated cars | 2,496 | 1,371 | 3,867 | 22.4 | ||||||||||||
| Flat cars | 2,248 | 1,450 | 3,698 | 32.4 | ||||||||||||
| Other | - | 312 | 312 | 31.4 | ||||||||||||
| Total freight cars | 31,816 | 24,563 | 56,379 | N/A |
| Average | ||||||||||||||||
|---|---|---|---|---|---|---|---|---|---|---|---|---|---|---|---|---|
| Highway revenue equipment | Owned | Leased | Total | Age (yrs.) | ||||||||||||
| Containers | 48,180 | 1,356 | 49,536 | 11.4 | ||||||||||||
| Chassis | 29,703 | 19,616 | 49,319 | 12.0 | ||||||||||||
| Total highway revenue equipment | 77,883 | 20,972 | 98,855 | N/A |
We continuously assess our need for equipment to run an efficient and reliable network. Many factors cause us to adjust the size of our active fleets, including changes in carload volume, weather events, seasonality, customer preferences, and operational efficiency initiatives. As some of these factors are difficult to assess or can change rapidly, we maintain a surge fleet to remain agile. Without the surge fleet, our ability to react quickly is hindered as equipment suppliers are limited and lead times to acquire equipment are long and may be in excess of a year. We believe our locomotive and freight car fleets are appropriately sized to meet our current and future business requirements. These fleets serve as the most reliable and efficient equipment to facilitate growth without additional acquisitions. Locomotive and freight car in service utilization percentages for the year ended December 31, 2022, were 70% and 78%, respectively.
CAPITAL EXPENDITURES
Our rail network requires significant annual capital investments for replacement, improvement, and expansion. These investments enhance safety, support the transportation needs of our customers, improve our operational efficiency, and support emission reduction initiatives outlined in our Climate Action Plan. Additionally, we add new equipment to our fleet to replace older equipment and to support growth and customer demand.
2022 Capital Program – During 2022, our capital program totaled approximately $3.4 billion. (See the cash capital investments table in Management’s Discussion and Analysis of Financial Condition and Results of Operations – Liquidity and Capital Resources, Item 7, of this report.)
2023 Capital Plan – In 2023, we expect our capital plan to be approximately $3.6 billion, up 6% from 2022. (See further discussion of our 2023 capital plan in Management’s Discussion and Analysis of Financial Condition and Results of Operations – Liquidity and Capital Resources, Item 7, of this report.)
OTHER
Equipment Encumbrances – Equipment with a carrying value of approximately $903 million and $1.2 billion at December 31, 2022 and 2021, respectively, served as collateral for finance leases and other types of equipment obligations in accordance with the secured financing arrangements utilized to acquire or refinance such railroad equipment.
Environmental Matters – Certain of our properties are subject to federal, state, and local laws and regulations governing the protection of the environment. (See discussion within this report of environmental issues in Business – Governmental and Environmental Regulation, Item 1; Management’s Discussion and Analysis of Financial Condition and Results of Operations – Critical Accounting Estimates – Environmental, Item 7; and Note 17 to the Financial Statements and Supplementary Data, Item 8.)
Item 3. Legal Proceedings
From time to time, we are involved in legal proceedings, claims, and litigation that occur in connection with our business. We routinely assess our liabilities and contingencies in connection with these matters based upon the latest available information and, when necessary, we seek input from our third-party advisors when making these assessments. Consistent with SEC rules and requirements, we describe below material pending legal proceedings (other than ordinary routine litigation incidental to our business), material proceedings known to be contemplated by governmental authorities, other proceedings arising under federal, state, or local environmental laws and regulations (including governmental proceedings involving potential fines, penalties, or other monetary sanctions in excess of $1,000,000), and such other pending matters that we may determine to be appropriate.
ENVIRONMENTAL MATTERS
We receive notices from the EPA and state environmental agencies alleging that we are or may be liable under federal or state environmental laws for remediation costs at various sites throughout the U.S., including sites on the Superfund National Priorities List or state superfund lists. We cannot predict the ultimate impact of these proceedings and suits because of the number of potentially responsible parties involved, the degree of contamination by various wastes, the scarcity and quality of volumetric data related to many of the sites, and the speculative nature of remediation costs.
Information concerning environmental claims and contingencies and estimated remediation costs is set forth in this report in Management’s Discussion and Analysis of Financial Condition and Results of Operations – Critical Accounting Estimates – Environmental, Item 7, and Note 17 to the Financial Statements and Supplementary Data, Item 8.
OTHER MATTERS
Antitrust Litigation – As we reported in our Quarterly Report on Form 10-Q for the quarter ended June 30, 2007, 20 rail shippers (many of whom were represented by the same law firms) filed virtually identical antitrust lawsuits in various federal district courts against us and four other Class I railroads in the U.S. Currently, UPRR and three other Class I railroads are the named defendants in the lawsuits. The original plaintiff filed the first of these claims in the U.S. District Court in New Jersey on May 14, 2007. These suits alleged that the named railroads engaged in price-fixing by establishing common fuel surcharges for certain rail traffic.
On August 16, 2019, the U.S. Court of Appeals for the District of Columbia Circuit (D.C. Circuit) affirmed the decision of U.S. District Court for the District of Columbia (U.S. District Court) denying class certification (the Certification Denial). Only five plaintiffs remain in this multidistrict litigation (MDL) originally filed in 2007, which remains pending. They are proceeding on a consolidated basis in the U.S. District Court before the Honorable Paul L. Friedman (MDL I). Since the Certification Denial, approximately 111 lawsuits have been filed in federal court based on claims identical to those alleged in the class certification case. The Judicial Panel on Multidistrict Litigation consolidated these suits for pretrial proceedings in the U.S. District Court before the Honorable Beryl A. Howell (MDL II).
On February 19, 2021, the court denied our motion to exclude plaintiffs' alleged evidence of conspiracy under a federal statute designed to incent and protect railroad communications made to further interline service (i.e., where two railroads are in the route). On May 17, 2022, the DC Circuit reversed the trial court and largely adopted the railroads’ interpretation of the statute, although no individual evidentiary rulings were made.
We also filed a motion for summary judgment on May 14, 2021, in the MDL I proceedings, and the briefing was completed in September 2021. A hearing has not been scheduled on the motion.
As we reported in our Current Report on Form 8-K, filed on June 10, 2011, the Railroad received a complaint filed in the U.S. District Court for the District of Columbia on June 7, 2011, by Oxbow Carbon & Minerals LLC and related entities (Oxbow). Just as it did in the MDL proceedings, Union Pacific filed a motion for summary judgment on May 14, 2021, and no hearing has been scheduled.
We continue to deny the allegations that our fuel surcharge programs violate the antitrust laws or any other laws. We believe that these lawsuits are without merit, and we will vigorously defend our actions. Therefore, we currently believe that these matters will not have a material adverse effect on any of our results of operations, financial condition, and liquidity.
Item 4. Mine Safety Disclosures
Not applicable.
Information About Our Executive Officers and Principal Executive Officers of Our Subsidiaries
The Board of Directors typically elects and designates our executive officers on an annual basis at the board meeting held in conjunction with the Annual Meeting of Shareholders, and they hold office until their successors are elected. Executive officers also may be elected and designated throughout the year, as the Board of Directors considers appropriate. There are no family relationships among the officers, nor is there any arrangement or understanding between any officer and any other person pursuant to officer selection. The following table sets forth certain information current as of February 10, 2023, relating to the executive officers.
| Business | |||
|---|---|---|---|
| Experience During | |||
| Name | Position | Age | Past Five Years |
| Lance M. Fritz | Chairman, President, and Chief Executive Officer of UPC and the Railroad | 60 | Current Position |
| Jennifer L. Hamann | Executive Vice President and Chief Financial Officer of UPC and the Railroad | 55 | [1] |
| Craig V. Richardson | Executive Vice President, Chief Legal Officer, and Corporate Secretary of UPC and the Railroad | 61 | [2] |
| Kenny G. Rocker | Executive Vice President – Marketing and Sales of the Railroad | 51 | [3] |
| Todd M. Rynaski | Senior Vice President and Chief Accounting, Risk, and Compliance Officer of UPC and the Railroad | 52 | [4] |
| Eric J. Gehringer | Executive Vice President – Operations of the Railroad | 43 | [5] |
| Elizabeth F. Whited | Executive Vice President – Sustainability and Strategy of UPC and the Railroad | 57 | [6] |
| [1] | Ms. Hamann was elected Executive Vice President and Chief Financial Officer of UPC and the Railroad effective January 1, 2020. She previously served as Senior Vice President – Finance (April 2019 – December 2019) and Vice President – Planning & Analysis (October 2017 – March 2019)__. |
|---|---|
| [2] | Mr. Richardson was elected Executive Vice President, Chief Legal Officer, and Corporate Secretary of UPC and the Railroad effective December 8, 2020. He most recently served as Vice President – Commercial and Regulatory Law since 2015. |
| [3] | Mr. Rocker was elected Executive Vice President – Marketing and Sales of the Railroad effective August 15, 2018. Mr. Rocker previously served at the Railroad as Vice President – Marketing and Sales – Industrial team (October 2016 – August 2018). |
| [4] | Mr. Rynaski was elected Senior Vice President and Chief Accounting, Risk, and Compliance Officer of UPC and the Railroad effective July 1, 2022. Mr. Rynaski previously served as Vice President and Controller (September 2015 – June 2022). |
| [5] | Mr. Gehringer was elected Executive Vice President – Operations of the Railroad effective January 1, 2021. Mr. Gehringer previously served as Senior Vice President – Transportation (July 2020 – December 2020), Vice President – Mechanical and Engineering (January 2020 – July 2020), Vice President – Engineering (March 2018 – January 2020), and Assistant Vice President – Engineering (September 2016 – March 2018)__. |
| [6] | Ms. Whited was elected Executive Vice President – Sustainability and Strategy of UPC and the Railroad effective February 3, 2022. She previously served as Executive Vice President and Chief Human Resources Officer (August 2018 – February 2022) and Executive Vice President and Chief Marketing Officer (December 2016 – August 2018)__. |
Item 5. Market for the Registrant’s Common Equity, Related Stockholder Matters, and Issuer Purchases of Equity Securities
Our common stock is traded on the NYSE under the symbol “UNP”.
At February 3, 2023, there were 611,872,981 shares of common stock outstanding and 28,959 common shareholders of record. On that date, the closing price of the common stock on the NYSE was $210.29. We paid dividends to our common shareholders during each of the past 123 years.
Comparison Over One- and Three-Year Periods – The following table presents the cumulative total shareholder returns, assuming reinvestment of dividends, over one- and three-year periods for the Corporation (UNP), a peer group index (comprised of CSX Corporation and Norfolk Southern Corporation), the Dow Jones Transportation Index (DJ Trans), and the Standard & Poor’s 500 Stock Index (S&P 500).
| Period | UNP | Peer Group | DJ Trans | S&P 500 | ||||||||||||
|---|---|---|---|---|---|---|---|---|---|---|---|---|---|---|---|---|
| 1 Year (2022) | (15.9 | )% | (16.1 | )% | (17.6 | )% | (18.1 | )% | ||||||||
| 3 Year (2020 - 2022) | 22.0 | 33.6 | 27.9 | 24.7 |
Five-Year Performance Comparison – The following graph provides an indicator of cumulative total shareholder returns for the Corporation as compared to the peer group index (described above), the DJ Trans, and the S&P 500. The graph assumes that $100 was invested in the common stock of Union Pacific Corporation and each index on December 31, 2017, and that all dividends were reinvested. The information below is historical in nature and is not necessarily indicative of future performance.
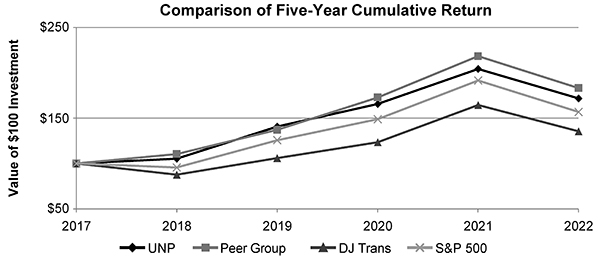
Purchases of Equity Securities – During 2022, we repurchased 27,374,826 shares of our common stock at an average price of $231.51. The following table presents common stock repurchases during each month for the fourth quarter of 2022:
| Period | Total Number of Shares Purchased [a] | Average Price Paid Per Share | Total Number of Shares Purchased as Part of a Publicly Announced Plan or Program | Maximum Number of Shares Remaining Under the Plan or Program [b] | ||||||||||||
|---|---|---|---|---|---|---|---|---|---|---|---|---|---|---|---|---|
| Oct. 1 through Oct. 31 | 1,985,868 | $ | 196.40 | 1,985,704 | 85,423,274 | |||||||||||
| Nov. 1 through Nov. 30 | 1,235,296 | 206.48 | 1,234,889 | 84,188,385 | ||||||||||||
| Dec. 1 through Dec. 31 | 281,092 | 213.45 | 281,074 | 83,907,311 | ||||||||||||
| Total | 3,502,256 | $ | 201.32 | 3,501,667 | N/A |
| [a] | Total number of shares purchased during the quarter includes approximately 589 shares delivered or attested to UPC by employees to pay stock option exercise prices, satisfy excess tax withholding obligations for stock option exercises or vesting of retention units, and pay withholding obligations for vesting of retention shares. |
|---|---|
| [b] | Effective April 1, 2022, our Board of Directors authorized the repurchase of up to 100 million shares of our common stock by March 31, 2025, replacing our previous repurchase program. These repurchases may be made on the open market or through other transactions. Our management has sole discretion with respect to determining the timing and amount of these transactions. |
Item 6. [Reserved]
Item 7. Management’s Discussion and Analysis of Financial Condition and Results of Operations
The following discussion should be read in conjunction with the Consolidated Financial Statements and applicable notes to the Financial Statements and Supplementary Data, Item 8, and other information in this report, including Risk Factors set forth in Item 1A and Critical Accounting Estimates and Cautionary Information at the end of this Item 7. The following section generally discusses 2022 and 2021 items and year-to-year comparisons between 2022 and 2021. Discussions of 2020 items and year-to-year comparisons between 2021 and 2020 that are not included in this Form 10-K can be found in “Management’s Discussion and Analysis of Financial Condition and Results of Operations” in Part II, Item 7, of the Company’s Annual Report on Form 10-K for the fiscal year ended December 31, 2021.
The Railroad, along with its subsidiaries and rail affiliates, is our one reportable business segment. Although revenues are analyzed by commodity, we analyze the net financial results of the Railroad as one segment due to the integrated nature of the rail network.
EXECUTIVE SUMMARY
2022 Results
| ● | Safety – Union Pacific is dedicated to maintaining a safe and healthy workplace. Throughout 2022, we continued to use our Total Safety Culture, Courage to Care, COMMIT (Coaching, Observing, Mentoring, and Motivating with Integrity and Trust), and Peer to Peer programs throughout our operations to enhance employee safety and engagement. In addition, based on the evaluation of a third-party expert on the effectiveness of these programs completed in 2021, we are implementing engagement improvements to enhance our safety culture. These initiatives include defining and setting standards for employee interactions, corrective actions and follow up, and root cause analysis. As a result of these efforts, our reportable personal injury incidents rate per 200,000 employee-hours of 0.80 decreased 18% from 2021. We also continued to adapt to the evolving environment due to COVID and other illnesses. Safety procedures and policies are refined based on Centers for Disease Control and Prevention (CDC) guidelines. |
|---|
| We continued to refine our proprietary software to evaluate train and route characteristics to enable proactive intervention by our Operating Practices Command Center to prevent derailments. In addition, we increased the replacement of freight car wheels and took steps to address human factor yard derailments related to switch alignment. Despite these efforts, our reportable derailment incident rate per million train miles increased 8% year-over-year. |
|---|
| ● | Network Operations – Throughout 2022, our network was congested in several key corridors, which hindered our ability to handle all of the demand in several markets. To address this congestion, we aggressively hired and graduated 1,302 new train, engine, and yard employees; temporarily relocated train, engine, and yard employees to areas with the greatest need; added locomotives to the fleet in select locations; and reduced freight car inventory, relative to carloads, from our network. Due to this congestion, our operating metrics deteriorated year-over-year. Freight car velocity decreased due to increased terminal dwell and higher operating car inventory levels, which drove lower train speeds. Additional details on these metrics are discussed in Other Operating/Performance and Financial Statistics of this Item 7. |
|---|
| ● | Freight Revenues – Freight revenues increased 14% year-over-year to $23.2 billion driven by higher fuel surcharge revenues, core pricing gains, and a 2% increase in volume. Volume increases were driven by strong production and inventory replenishment in the automotive industry, increased demand for coal due to higher natural gas prices, and continued strength in the industrial markets driven by rock, sand, and plastics. These gains were partially offset by declines in international intermodal, parcel, grain, and petroleum products. |
|---|
| ● | Financial Results – Higher fuel prices, operational challenges, inflation, increased volume-related costs, and a one-time charge for the labor agreements reached with our labor unions (See Labor Agreements in Other Matters in this Item 7 of Part II), drove a 20% increase in operating expenses. Partially offsetting these increases were lower weather-related expenses in 2022 compared to 2021, when we incurred additional costs associated with Winter Storm Uri and wildfires in California. Increased revenues, due to higher fuel surcharge revenues, improved pricing, additional volume, and intermodal accessorial charges, more than offset the increased expenses producing operating income of $9.9 billion, a 6% increase over 2021. Our operating ratio was 60.1%, deteriorating 2.9 points from 2021. Net income of $7.0 billion translated into earnings of $11.21 per diluted share, up 13% from 2021. |
|---|
| ● | Fuel Prices – The onset of the Russia-Ukraine conflict in late February 2022 drove crude oil prices above $100 a barrel, where it remained elevated until mid-2022, driving an increase in our average fuel price. While our average fuel price declined 8% in the fourth quarter from the second quarter high of $4.03, our average price in the fourth quarter was 46% higher than the fourth quarter of 2021. Our average price of diesel fuel for the full year of 2022 was $3.65 per gallon, an increase of 64% from 2021. The higher price resulted in increased operating expenses of $1.3 billion (excluding any impact from year-over-year volume increases). Gross ton-miles increased 3%, which also drove higher fuel expense. Partially offsetting these increases was a 1% improvement in our fuel consumption rate to a new full year record low. |
|---|
| ● | Liquidity – We are continually evaluating our financial condition and liquidity. On December 31, 2022, we had $973 million of cash and cash equivalents. Despite the challenging year, we generated $9.4 billion of cash provided by operating activities, yielding free cash flow of $2.7 billion after reductions of $3.5 billion for cash used in investing activities and $3.2 billion in dividends. We repurchased $6.3 billion of our shares. We have been, and we expect to continue to be, in compliance with our debt covenants. We have $2.0 billion of credit available under our revolving credit facility and up to $700 million undrawn on our Receivables Facility. As of December 31, 2022, none of the revolving credit facility was drawn. Additional details are discussed in Liquidity and Capital Resources of this Item 7. |
|---|
Free cash flow is defined as cash provided by operating activities less cash used in investing activities and dividends paid. Free cash flow is not considered a financial measure under GAAP by SEC Regulation G and Item 10 of SEC Regulation S-K and may not be defined and calculated by other companies in the same manner. We believe free cash flow is important to management and investors in evaluating our financial performance and measures our ability to generate cash without additional external financing. Free cash flow should be considered in addition to, rather than as a substitute for, cash provided by operating activities. The following table reconciles cash provided by operating activities (GAAP measure) to free cash flow (non-GAAP measure):
| Millions | 2022 | 2021 | 2020 | |||||||||
|---|---|---|---|---|---|---|---|---|---|---|---|---|
| Cash provided by operating activities | $ | 9,362 | $ | 9,032 | $ | 8,540 | ||||||
| Cash used in investing activities | (3,471 | ) | (2,709 | ) | (2,676 | ) | ||||||
| Dividends paid | (3,159 | ) | (2,800 | ) | (2,626 | ) | ||||||
| Free cash flow | $ | 2,732 | $ | 3,523 | $ | 3,238 |
2023 Outlook
| ● | Safety – Operating a safe
Showing the first 8K of 74K characters. Open the full section
Item 7A. Quantitative and Qualitative Disclosures about Market Risk
Information concerning market risk sensitive instruments is set forth under Management’s Discussion and Analysis of Financial Condition and Results of Operations – Other Matters, Item 7.
Item 8. Financial Statements and Supplementary Data
REPORT OF INDEPENDENT REGISTERED PUBLIC ACCOUNTING FIRM
To the Shareholders and the Board of Directors of Union Pacific Corporation
Opinion on the Financial Statements
We have audited the accompanying consolidated statements of financial position of Union Pacific Corporation and Subsidiary Companies (the "Corporation") as of December 31, 2022 and 2021, the related consolidated statements of income, comprehensive income, changes in common shareholders’ equity, and cash flows for each of the three years in the period ended December 31, 2022, and the related notes (collectively referred to as the "financial statements"). In our opinion, the financial statements present fairly, in all material respects, the financial position of the Corporation as of December 31, 2022 and 2021, and the results of its operations and its cash flows for each of the three years in the period ended December 31, 2022, in conformity with accounting principles generally accepted in the United States of America.
We have also audited, in accordance with the standards of the Public Company Accounting Oversight Board (United States) (PCAOB), the Corporation's internal control over financial reporting as of December 31, 2022, based on criteria established in Internal Control — Integrated Framework (2013) issued by the Committee of Sponsoring Organizations of the Treadway Commission and our report dated February 10, 2023, expressed an unqualified opinion on the Corporation's internal control over financial reporting.
Basis for Opinion
These financial statements are the responsibility of the Corporation's management. Our responsibility is to express an opinion on the Corporation's financial statements based on our audits. We are a public accounting firm registered with the PCAOB and are required to be independent with respect to the Corporation in accordance with the U.S. federal securities laws and the applicable rules and regulations of the Securities and Exchange Commission and the PCAOB.
We conducted our audits in accordance with the standards of the PCAOB. Those standards require that we plan and perform the audit to obtain reasonable assurance about whether the financial statements are free of material misstatement, whether due to error or fraud. Our audits included performing procedures to assess the risks of material misstatement of the financial statements, whether due to error or fraud, and performing procedures that respond to those risks. Such procedures included examining, on a test basis, evidence regarding the amounts and disclosures in the financial statements. Our audits also included evaluating the accounting principles used and significant estimates made by management, as well as evaluating the overall presentation of the financial statements. We believe that our audits provide a reasonable basis for our opinion.
Critical Audit Matter
The critical audit matter communicated below is a matter arising from the current-period audit of the financial statements that was communicated or required to be communicated to the audit committee and that (1) relates to accounts or disclosures that are material to the financial statements and (2) involved our especially challenging, subjective, or complex judgments. The communication of critical audit matters does not alter in any way our opinion on the financial statements, taken as a whole, and we are not, by communicating the critical audit matter below, providing a separate opinion on the critical audit matter or on the accounts or disclosures to which it relates.
Capitalization of Properties — Refer to Notes 2 and 11 to the financial statements
Critical Audit Matter Description
The Corporation’s operations are highly capital intensive and their large network of assets turns over on a continuous basis. Each year, the Corporation develops a capital program for both the replacement of assets and for the acquisition or construction of new assets. In determining whether costs should be capitalized, the Corporation exercises significant judgment in determining whether expenditures meet the applicable minimum units of property criteria and extend the useful life, improve the safety of operations, or improve the operating efficiency of existing assets. The Corporation capitalizes all costs of capital projects necessary to make assets ready for their intended use and because a portion of the Corporation’s assets are self-constructed, management also exercises significant judgment in determining the amount of material, labor, work equipment, and indirect costs that qualify for capitalization. Properties, net were $56,038 million as of December 31, 2022 and, during 2022, the Corporation’s capital investments were $3.6 billion.
We identified the capitalization of property as a critical audit matter because of the significant judgment exercised by management in determining whether costs meet the criteria for capitalization. This, in turn, required a high degree of auditor judgment when performing audit procedures to evaluate whether the criteria to capitalize costs were met and to evaluate sufficiency of audit evidence to support management’s conclusions.
How the Critical Audit Matter Was Addressed in the Audit
Our procedures related to capitalization of property included the following, among others:
| ● | We tested the effectiveness of controls over the Corporation’s determination of whether costs related to the Corporation’s capital investments should be capitalized or expensed. |
|---|
| ● | We evaluated the Corporation’s capitalization policy in accordance with accounting principles generally accepted in the United States of America. |
|---|
| ● | For a selection of capital projects, we performed the following: |
|---|
| o | Obtained the Corporation’s evaluation of each project and determined whether the amount of costs to be capitalized met the criteria for capitalization as outlined within the Corporation’s policy by unit of property. |
|---|
| o | Obtained supporting documentation that the project met the applicable minimum units of property criteria and was approved, and evaluated whether the project extended the useful life of an existing asset, improved the safety of operations, or improved the operating efficiency of existing assets. |
|---|
| ● | For a selection of capitalized costs during the year, we performed the following: |
|---|
| o | Evaluated whether the individual cost selected met the criteria for capitalization. |
|---|
| o | Evaluated whether the selection was accurately recorded at the appropriate amount based on the evidence obtained. |
|---|
/s/ Deloitte & Touche LLP
Omaha, Nebraska
February 10, 2023
We have served as the Corporation's auditor since 1967.
**[]
Showing the first 8K of 129K characters. Open the full section
Item 9. Changes in and Disagreements with Accountants on Accounting and Financial Disclosure
None.
Item 9A. Controls and Procedures
As of the end of the period covered by this report, the Corporation carried out an evaluation, under the supervision and with the participation of the Corporation’s management, including the Corporation’s Chief Executive Officer (CEO) and Executive Vice President and Chief Financial Officer (CFO), of the effectiveness of the design and operation of the Corporation’s disclosure controls and procedures pursuant to Exchange Act Rules 13a-15 and 15d-15. In designing and evaluating the disclosure controls and procedures, management recognized that any controls and procedures, no matter how well designed and operated, can provide only reasonable assurance of achieving the desired control objectives. Based upon that evaluation, the CEO and the CFO concluded that, as of the end of the period covered by this report, the Corporation’s disclosure controls and procedures were effective to provide reasonable assurance that information required to be disclosed in our Exchange Act reports is recorded, processed, summarized, and reported within the time periods specified by the SEC, and that such information is accumulated and communicated to management, including the CEO and CFO, as appropriate, to allow timely decisions regarding required disclosure.
Additionally, the CEO and CFO determined that there were no changes to the Corporation’s internal control over financial reporting (as defined in Exchange Act Rules 13a-15(f) and 15d-15(f)) during the last fiscal quarter that materially affected, or are reasonably likely to materially affect, the Corporation’s internal control over financial reporting.
MANAGEMENT’S ANNUAL REPORT ON INTERNAL CONTROL OVER FINANCIAL REPORTING
The management of Union Pacific Corporation and Subsidiary Companies (the Corporation) is responsible for establishing and maintaining adequate internal control over financial reporting (as defined in Exchange Act Rules 13a-15(f) and 15d-15(f)). The Corporation’s internal control system was designed to provide reasonable assurance to the Corporation’s management and Board of Directors regarding the preparation and fair presentation of published financial statements.
All internal control systems, no matter how well designed, have inherent limitations. Therefore, even those systems determined to be effective can provide only reasonable assurance with respect to financial statement preparation and presentation.
The Corporation’s management assessed the effectiveness of the Corporation’s internal control over financial reporting as of December 31, 2022. In making this assessment, it used the criteria set forth by the Committee of Sponsoring Organizations of the Treadway Commission (COSO) in Internal Control – Integrated Framework (2013). Based on our assessment, management believes that, as of December 31, 2022, the Corporation’s internal control over financial reporting is effective based on those criteria.
The Corporation’s independent registered public accounting firm has issued an attestation report on the effectiveness of the Corporation’s internal control over financial reporting. This report appears on the next page.
February 9, 2023
REPORT OF INDEPENDENT REGISTERED PUBLIC ACCOUNTING FIRM
To the Shareholders and Board of Directors of Union Pacific Corporation
Opinion on Internal Control over Financial Reporting
We have audited the internal control over financial reporting of Union Pacific Corporation and Subsidiary Companies (the “Corporation”) as of December 31, 2022, based on criteria established in Internal Control — Integrated Framework (2013) issued by the Committee of Sponsoring Organizations of the Treadway Commission (COSO). In our opinion, the Corporation maintained, in all material respects, effective internal control over financial reporting as of December 31, 2022, based on criteria established in Internal Control — Integrated Framework (2013) issued by COSO.
We have also audited, in accordance with the standards of the Public Company Accounting Oversight Board (United States) (PCAOB), the consolidated financial statements as of and for the year ended December 31, 2022, of the Corporation and our report dated February 10, 2023, expressed an unqualified opinion on those financial statements.
Basis for Opinion
The Corporation’s management is responsible for maintaining effective internal control over financial reporting and for its assessment of the effectiveness of internal control over financial reporting, included in the accompanying Management’s Annual Report on Internal Control over Financial Reporting. Our responsibility is to express an opinion on the Corporation’s internal control over financial reporting based on our audit. We are a public accounting firm registered with the PCAOB and are required to be independent with respect to the Corporation in accordance with the U.S. federal securities laws and the applicable rules and regulations of the Securities and Exchange Commission and the PCAOB.
We conducted our audit in accordance with the standards of the PCAOB. Those standards require that we plan and perform the audit to obtain reasonable assurance about whether effective internal control over financial reporting was maintained in all material respects. Our audit included obtaining an understanding of internal control over financial reporting, assessing the risk that a material weakness exists, testing and evaluating the design and operating effectiveness of internal control based on the assessed risk, and performing such other procedures as we considered necessary in the circumstances. We believe that our audit provides a reasonable basis for our opinion.
Definition and Limitations of Internal Control over Financial Reporting
A company’s internal control over financial reporting is a process designed to provide reasonable assurance regarding the reliability of financial reporting and the preparation of financial statements for external purposes in accordance with generally accepted accounting principles. A company’s internal control over financial reporting includes those policies and procedures that (1) pertain to the maintenance of records that, in reasonable detail, accurately and fairly reflect the transactions and dispositions of the assets of the company; (2) provide reasonable assurance that transactions are recorded as necessary to permit preparation of financial statements in accordance with generally accepted accounting principles, and that receipts and expenditures of the company are being made only in accordance with authorizations of management and directors of the company; and (3) provide reasonable assurance regarding prevention or timely detection of unauthorized acquisition, use, or disposition of the company’s assets that could have a material effect on the financial statements.
Because of its inherent limitations, internal control over financial reporting may not prevent or detect misstatements. Also, projections of any evaluation of effectiveness to future periods are subject to the risk that controls may become inadequate because of changes in conditions, or that the degree of compliance with the policies or procedures may deteriorate.
/s/ Deloitte & Touche LLP
Omaha, Nebraska
February 10, 2023
Item 9B. Other Information
None.
Item 9C. Disclosure Regarding Foreign Jurisdictions that Prevent Inspections
Item 10. Directors, Executive Officers, and Corporate Governance
| (a) | Directors of Registrant. |
|---|
Information as to the names, ages, positions, and offices with UPC, terms of office, periods of service, business experience during the past five years, and certain other directorships held by each director or person nominated to become a director of UPC is set forth in the Election of Directors segment of the Proxy Statement and is incorporated herein by reference.
Information concerning our Audit Committee and the independence of its members, along with information about the audit committee financial expert(s) serving on the Audit Committee, is set forth in the Audit Committee segment of the Proxy Statement and is incorporated herein by reference.
| (b) | Executive Officers of Registrant. |
|---|
Information concerning the executive officers of UPC and its subsidiaries is presented in Part I of this report under Information About Our Executive Officers and Principal Executive Officers of Our Subsidiaries.
| (c) | Delinquent Section 16(a) Reports. |
|---|
Information concerning compliance with Section 16(a) of the Securities Exchange Act of 1934 is set forth in the Section 16(a) Beneficial Ownership Reporting Compliance segment of the Proxy Statement and is incorporated herein by reference.
| (d) | Code of Ethics for Chief Executive Officer and Senior Financial Officers of Registrant. |
|---|
The Board of Directors of UPC has adopted the UPC Code of Ethics for the Chief Executive Officer and Senior Financial Officers (the Code). A copy of the Code may be found on the Internet at our website www.up.com/investor/governance. We intend to disclose any amendments to the Code or any waiver from a provision of the Code on our website.
Item 11. Executive Compensation
Information concerning compensation received by our directors and our named executive officers is presented in the Compensation Discussion and Analysis, Summary Compensation Table, Grants of Plan-Based Awards in Fiscal Year 2022, Outstanding Equity Awards at 2022 Fiscal Year-End, Option Exercises and Stock Vested in Fiscal Year 2022, Pension Benefits at 2022 Fiscal Year-End, Nonqualified Deferred Compensation at 2022 Fiscal Year-End, Potential Payments Upon Termination or Change in Control and Director Compensation in Fiscal Year 2022 segments of the Proxy Statement and is incorporated herein by reference. Additional information regarding compensation of directors, including Board committee members, is set forth in the By-Laws of UPC and the Stock Unit Grant and Deferred Compensation Plan for the Board of Directors, both of which are included as exhibits to this report. Information regarding the Compensation and Benefits Committee is set forth in the Compensation Committee Interlocks and Insider Participation and Compensation Committee Report segments of the Proxy Statement and is incorporated herein by reference.
Item 12. Security Ownership of Certain Beneficial Owners and Management and Related Stockholder Matters
Information as to the number of shares of our equity securities beneficially owned by each of our directors and nominees for director, our named executive officers, our directors and executive officers as a group, and certain beneficial owners is set forth in the Security Ownership of Certain Beneficial Owners and Management segment of the Proxy Statement and is incorporated herein by reference.
The following table summarizes the equity compensation plans under which UPC common stock may be issued as of December 31, 2022:
| (a) | (b) | (c) | |||||||||||||
|---|---|---|---|---|---|---|---|---|---|---|---|---|---|---|---|
| Plan Category | Number of securities to be issued upon exercise of outstanding options, warrants and rights | Weighted-average exercise price of outstanding options, warrants and rights | Number of securities remaining available for future issuance under equity compensation plans (excluding securities reflected in column (a)) | ||||||||||||
| Equity compensation plans approved by security holders | 2,337,851 | [1] | $ | 169.63 | [2] | 33,185,971 | [2] | ||||||||
| Total | 2,337,851 | $ | 169.63 | 33,185,971 |
| [1] | Includes 364,038 retention units that do not have an exercise price. Does not include 1,022,053 retention shares that have been issued and are outstanding. |
|---|---|
| [2] | Does not include the retention units or retention shares described above in footnote 1. |
| [3] | Includes 9,635,719 shares available for issuance under the 2021 Employee Stock Purchase Plan, 22,176,052 shares available for issuance under the 2021 Stock Incentive Plan and 1,374,200 shares available for issuance under the 2000 Directors Plan. |
Item 13. Certain Relationships and Related Transactions, and Director Independence
Information on related transactions is set forth in the Certain Relationships and Related Transactions and Compensation Committee Interlocks and Insider Participation segments of the Proxy Statement and is incorporated herein by reference. We do not have any relationship with any outside third-party that would enable such a party to negotiate terms of a material transaction that may not be available to, or available from, other parties on an arm’s-length basis.
Information regarding the independence of our directors is set forth in the Director Independence segment of the Proxy Statement and is incorporated herein by reference.
Item 14. Principal Accountant Fees and Services
Information concerning the fees billed by our independent registered public accounting firm and the nature of services comprising the fees for each of the two most recent fiscal years in each of the following categories: (a) audit fees, (b) audit-related fees, (c) tax fees, and (d) all other fees, is set forth in the Independent Registered Public Accounting Firm’s Fees and Services segment of the Proxy Statement and is incorporated herein by reference.
Information concerning our Audit Committee’s policies and procedures pertaining to pre-approval of audit and non-audit services rendered by our independent registered public accounting firm is set forth in the Audit Committee segment of the Proxy Statement and is incorporated herein by reference.
Item 15. Exhibit and Financial Statement Schedules
| (a) | Financial Statements, Financial Statement Schedules, and Exhibits: |
|---|
(1) Financial Statements
The financial statements filed as part of this filing are listed on the index to the Financial Statements and Supplementary Data, Item 8, on page 41.
(2) Financial Statement Schedules
Schedules have been omitted because they are not applicable or not required or the information required to be set forth therein is included in the Financial Statements and Supplementary Data, Item 8, or notes thereto.
(3) Exhibits
Exhibits are listed in the exhibit index beginning on page 77. The exhibits include management contracts, compensatory plans and arrangements required to be filed as exhibits to the Form 10-K by Item 601 (10) (iii) of Regulation S-K.
UNION PACIFIC CORPORATION
Exhibit Index
| 4(j) | Form of 5.150% Note due 2063 is incorporated herein by reference to Exhibit 4.3 to the Corporation’s Current Report on Form 8-K dated September 9, 2022. |
|---|
Item 16. Form 10-K Summary
None.
Pursuant to the requirements of Section 13 or 15(d) of the Securities Exchange Act of 1934, the registrant has duly caused this report to be signed on its behalf by the undersigned, thereunto duly authorized, on this 10th day of February, 2023.
| UNION PACIFIC CORPORATION | ||
| By | /s/ Lance M. Fritz | |
| Lance M. Fritz, | ||
| Chairman, President, and | ||
| Chief Executive Officer | ||
| Union Pacific Corporation |
Pursuant to the requirements of the Securities Exchange Act of 1934, this report has been signed below, on this 10th day of February, 2023, by the following persons on behalf of the registrant and in the capacities indicated.
| PRINCIPAL EXECUTIVE OFFICER | ||||
|---|---|---|---|---|
| AND DIRECTOR: | ||||
| By | /s/ Lance M. Fritz | |||
| Lance M. Fritz, | ||||
| Chairman, President, and | ||||
| Chief Executive Officer | ||||
| Union Pacific Corporation |
| PRINCIPAL FINANCIAL OFFICER: | ||||
| By | /s/ Jennifer L. Hamann | |||
| Jennifer L. Hamann | ||||
| Executive Vice President and | ||||
| Chief Financial Officer |
| PRINCIPAL ACCOUNTING OFFICER: | ||||
|---|---|---|---|---|
| By | /s/ Todd M. Rynaski | |||
| Todd M. Rynaski, | ||||
| Senior Vice President and | ||||
| Chief Accounting, Risk, and | ||||
| Compliance Officer |
DIRECTORS:
| William J. DeLaney* | Jane H. Lute* |
|---|---|
| David B. Dillon* | Michael R. McCarthy* |
| Sheri H. Edison* | Jose H. Villarreal* |
| Teresa M. Finley | Christopher J. Williams* |
| Deborah C. Hopkins* |
| * By | /s/ Craig V. Richardson | |
|---|---|---|
| Craig V. Richardson, Attorney-in-fact |