 filings.tools
Union Pacific (UNP) 10-K risk factor changes: FY2023 vs FY2022
The 2023-12-31 10-K against the 2022-12-31 one, compared heading by heading and sentence by sentence.
Item 1A16 rewritten2 added0 removed98 unchanged
All filing items826 rewritten273 added305 removed1,148 unchanged
Summary
counted, not written
- Item 1A headings could not be compared: only 0 carried over between the two years, which usually means one filing was read wrongly, so none is reported as new or removed.
- Sentence by sentence, 273 added, 305 removed, 826 rewritten and 1,148 unchanged across 20 items that differ.
- New this year: Item 1C. Cybersecurity.
Sentences by item
24 items, with every count and a link to each item that changed
Underlined words on a shaded ground are new in FY2023; struck-through words were in FY2022. Sentences that are wholly new or wholly gone are labelled rather than marked.
Item 1A. Risk Factors
16 rewritten, 2 added, 0 removed, 98 unchanged
Read the full itemFY2023 item · filed February 9, 2024FY2022 item · filed February 10, 2023
This level of demand [removed: may] also [added: may] compound the impact of weather and weather-related events on our operations and velocity.
Although we continue to work to improve our transportation plan, add capacity, improve operations at our yards and other facilities, and improve our ability to address surges in demand for any reason [removed: with adequate resources,] [added: by carrying a resource buffer,] we cannot be sure that these measures will fully or adequately address any service shortcomings resulting from demand exceeding our planned capacity.
There can be no assurance that the systems we have designed to identify, prevent, or limit the effects of cyber incidents [removed: or attacks] will be sufficient to prevent or detect such [removed: incidents or attacks,] [added: incidents,] or to avoid a material adverse impact on our systems after such incidents [removed: or attacks] do occur.
Furthermore, due to the rising numbers and increasing sophistication of cyber-attacks, an increasingly complex information technology supply chain, and the nature of zero-day exploits, we may be unable to anticipate or implement adequate [removed: preventative] measures to prevent a security breach, including by [removed: ransomware,] [added: ransomware or as a result of] human [removed: error,] [added: error] or other cyber-attack methods, from materially [removed: disrupting] [added: affecting] our systems or the systems of third-parties upon which we rely.
A [removed: successful cyber-attack] [added: cyber incident] that results in significant service interruption; safety failure; other operational difficulties; unauthorized access to (or the loss of access to) competitively sensitive, confidential, or other critical data or systems; loss of customers; financial losses; regulatory fines; [removed: and] [added: reputational harm; or] misuse or corruption of critical data and proprietary information, could have a material adverse impact on our results of operations, financial condition, and liquidity.
We may experience security breaches that could remain undetected for an extended period and, therefore, have a greater impact on [removed: the services we offer.][added: us.]
Line outages and other interruptions caused by these conditions [added: has in the past and] can [added: in the future] adversely affect [added: parts or all of] our entire rail network, potentially negatively affecting revenues, costs, and liabilities, despite efforts we undertake to plan for these events.
Significant and sustained interruptions of trade with Mexico, Canada, or countries in Southeast Asia, including China, could adversely affect customers and other entities that, directly or indirectly, purchase or rely on rail transportation services in the U.S. as part of their operations, and any such [removed: interruptions] [added: interruptions, including international armed conflicts such as the Russia-Ukraine and Israel-Hamas wars,] could have a material adverse effect on our results of operations, financial condition, and liquidity.
Any one or more of the following could cause a significant and sustained interruption of trade with Mexico, Canada, or countries in Southeast Asia: (a) a deterioration of security for international trade and businesses; (b) the adverse impact of new laws, rules, and regulations or the interpretation of laws, rules, and regulations by government entities, courts, or regulatory bodies, including the United States-Mexico-Canada Agreement (USMCA) [removed: and a “Phase One”] [added: or other international] trade [removed: agreement with China;] [added: agreements;] (c) actions of taxing authorities that affect our customers doing business in foreign countries; (d) any significant adverse economic developments, such as extended periods of high inflation, material disruptions in the banking sector or in the capital markets of these foreign countries, and significant changes in the valuation of the currencies of these foreign countries that could materially affect the cost or value of imports or exports; (e) shifts in patterns of international trade that adversely affect import and export markets; (f) a material reduction in foreign direct investment in these countries; and (g) public health crises, including the outbreak of pandemic or contagious disease, such as the coronavirus and its variant strains (COVID).
We could face increased costs related to defending and resolving legal claims and other litigation [added: or complying with laws or regulations] related to climate change and the alleged impact of our operations on climate change.
Violent weather caused by climate change, including hurricanes, fires, floods, extreme temperatures, avalanches, and significant precipitation [added: has in the past and] could [added: in the future] cause line outages and other interruptions to our infrastructure.
[removed: While we work to implement our Climate Action Plan, our] [added: Our] efforts to achieve emission reduction targets could significantly increase our operational costs and capital expenditures.
As fuel prices fluctuate, our fuel surcharge programs trail such fluctuations in fuel [removed: price] [added: prices] by approximately two months, and may be a significant source of quarter-over-quarter and year-over-year volatility, particularly in periods of rapidly changing prices.
International, political, and economic factors, events and conditions, including [removed: the start of] [added: international armed conflicts such as] the [removed: Russian-Ukraine conflict in late February 2022,] [added: Russia-Ukraine and Israel-Hamas wars,] affect the volatility of fuel prices and supplies.
Significant instability or disruptions of the capital markets, including, among other things, [removed: current rising] [added: elevated] interest rates in the credit [removed: markets,] [added: markets and/or changes in interest rates,] or deterioration of our financial condition due to internal or external factors could restrict or prohibit our access to, and significantly increase the cost of, commercial paper and other financing sources, including bank credit facilities and the issuance of long-term debt, including corporate bonds.
_We Are Affected by General Economic Conditions_ – Prolonged, severe adverse domestic and global macroeconomic conditions or disruptions of financial and credit markets, including, for example, the recessionary [removed: fears] [added: fears, inflationary pressures,] and [removed: high inflation] [added: elevated interest rates] we are seeing in the current economic environment, may affect the producers and consumers of the commodities we carry and may have a material adverse effect on our access to liquidity, results of operations, and financial condition.
In addition, some of these matters could impact the cost of obtaining, or availability in general, of insurance coverage meant to cover these types of risks.
In addition, stakeholder expectations regarding some of these matters may be evolving and there may be differing views among stakeholders, which could harm our reputation or increase our costs.
Item 7. Management’s Discussion and Analysis of Financial Condition and Results of Operations
213 rewritten, 55 added, 68 removed, 158 unchanged
Read the full itemFY2023 item · filed February 9, 2024FY2022 item · filed February 10, 2023
The following section generally discusses [removed: 2022] [added: 2023] and [removed: 2021] [added: 2022] items and year-to-year comparisons between [removed: 2022] [added: 2023] and [removed: 2021.][added: 2022.]
Discussions of [removed: 2020] [added: 2021] items and year-to-year comparisons between [removed: 2021] [added: 2022] and [removed: 2020] [added: 2021] that are not included in this Form 10-K can be found in “Management’s Discussion and Analysis of Financial Condition and Results of Operations” in Part II, Item 7, of the Company’s Annual Report on Form 10-K for the fiscal year ended December 31, [removed: 2021.][added: 2022.]
The Railroad, along with its subsidiaries and rail affiliates, is our one reportable [removed: business] [added: operating] segment.
Although [added: we provide and analyze] revenues [removed: are analyzed] by [removed: commodity,] [added: commodity group,] we [removed: analyze] [added: treat] the [removed: net] financial results of the Railroad as one segment due to the integrated nature of [removed: the] [added: our] rail network.
| _Millions_ | | [removed: _2022_] [added: _2023_] | | | | [removed: _2021_] [added: _2022_] | | | | [removed: _2020_] [added: _2021_] | | |
| Cash provided by operating activities | | $ | [removed: 9,362] [added: 8,379] | | | $ | [removed: 9,032] [added: 9,362] | | | $ | [removed: 8,540] [added: 9,032] | |
| Cash used in investing activities | | | [removed: (3,471] [added: (3,667] | ) | | | [removed: (2,709] [added: (3,471] | ) | | | [removed: (2,676] [added: (2,709] | ) |
| Dividends paid | | | [removed: (3,159] [added: (3,173] | ) | | | [removed: (2,800] [added: (3,159] | ) | | | [removed: (2,626] [added: (2,800] | ) |
| Free cash flow | | $ | [removed: 2,732] [added: 1,539] | | | $ | [removed: 3,523] [added: 2,732] | | | $ | [removed: 3,238] [added: 3,523] | |
| ● | Safety – [removed: Operating a safe railroad benefits all] [added: Our goal is to be an industry leader in safety. We plan to improve the safety culture through] our [removed: constituents: employees, customers, shareholders,] [added: Courage to Care program. Courage to Care is reflected in actions such as giving] and [added: receiving feedback on unsafe behavior, finding and eliminating risk, and improving] the [removed: communities we serve.] [added: safety of the work environment, so that everyone returns home safely. An enhanced safety management program focused on the critical rules that most impact safety will be rolled out to all employees in 2024. In addition, train, engine, and yard employees will be expected to attend a full day safety training class to reinforce these critical rules.] We will continue using a comprehensive safety management [removed: system] approach utilizing technology, hazard identification and risk assessments, employee engagement, training, quality control, and targeted capital investments. [removed: We will continually evaluate and adjust deployment of Total Safety Culture, Courage to Care, COMMIT, and Peer to Peer resources throughout our operations, which allows us to identify and implement best practices for employee and operational safety.] In addition, our Operating Practices Command Center will [removed: continue the implementation of] [added: help position us to implement] predictive technology to reduce variability by seeking to identify causes of mainline service interruptions and develop [removed: solutions,] [added: solutions] in addition to assisting employees with understanding best practices for handling trains. We [removed: will continue our efforts] [added: plan] to utilize data to identify and mitigate exposure to risk, detect rail defects, improve or close crossings, and educate the public and law enforcement agencies about crossing safety through a combination of our own programs (including risk assessment strategies), industry programs, and local community activities across the network. [removed: We also are dedicated to maintaining] [added: Operating] a [removed: healthy workplace and continue monitoring the COVID case levels, modifying] [added: safe railroad benefits all] our [removed: policies as needed to protect employees] [added: stakeholders: employees, customers, shareholders,] and [removed: minimize] the [removed: risk of workplace transmission.] [added: communities we serve, while protecting the environment for future generations.] |
| ● | [removed: Market Conditions] [added: Business Volumes] – [added: Macroeconomic uncertainties remain in 2024 that could have a material impact on our 2024 financial and operating results.] Current forecasts for [added: 2024] industrial production [removed: indicate negative growth in] [added: are flat versus] 2023. [removed: The macroeconomic uncertainty, high inflationary environment, and disruptions in supply chains will continue to impact our shipments.] In addition, other factors, such as changes in domestic and foreign monetary policy (including rising interest rates), may affect economic activity and demand for rail transportation; natural gas prices, weather conditions, and demand for other energy sources may impact the coal market; crude oil prices and spreads may drive demand for petroleum products and drilling materials; available truck capacity could impact our intermodal business; and international trade agreements could promote or hinder trade. [added: Lower coal demand and some lost international intermodal business are expected to negatively impact volume. Fuel prices may continue to fluctuate in the current economic environment. As prices fluctuate, there will be a timing impact on earnings, as our fuel surcharge programs trail increases or decreases in fuel prices by approximately two months. Regardless of external factors, we will focus on operating a safe railroad and delivering the service we sold to our customers as well as effective asset utilization, cost control, and seeking new business opportunities.] |
[removed: | ● | Capital Plan –] In [removed: 2023, we expect our capital plan to be approximately $3.6 billion, up 6% from 2022 as we make investments to support our growth strategy. We will continue to harden our infrastructure, replace older assets, and improve the safety and resilience of the network. In] addition, the plan includes investments in growth-related projects to drive more carloads to the network, certain ramps to efficiently handle volumes from new and existing intermodal customers, [removed: continuous] [added: continued] modernization of our locomotive fleet, and projects intended to improve operational efficiency. [removed: The capital plan may be revised if business conditions warrant or if new laws or regulations affect our ability to generate sufficient returns on these investments. (See further discussion in this Item 7 under Liquidity and Capital Resources – Capital Plan.) |]
| _Millions_ | | [removed: _2022_] [added: _2023_] | | | | [removed: _2021_] [added: _2022_] | | | | [removed: _2020_] [added: _2021_] | | | | [removed: _2022] [added: _2023] v [removed: 2021_] [added: 2022_] | | | | [removed: _2021] [added: _2022] v [removed: 2020_] [added: 2021_] | | |
| Freight revenues | | $ | [removed: 23,159] [added: 22,571] | | | $ | [removed: 20,244] [added: 23,159] | | | $ | [removed: 18,251] [added: 20,244] | | | | [removed: 14] [added: (3] | [removed: %] [added: )%] | | | [removed: 11] [added: 14] | % |
| Other subsidiary revenues | | | [removed: 884] [added: 872] | | | | [removed: 741] [added: 884] | | | | [removed: 743] [added: 741] | | | | [removed: 19] [added: (1] | [added: )] | | | [removed: \-] [added: 19] | |
| Accessorial revenues | | | [removed: 779] [added: 584] | | | | [removed: 752] [added: 779] | | | | [removed: 473] [added: 752] | | | | [removed: 4] [added: (25] | [added: )] | | | [removed: 59] [added: 4] | |
| Other | | | [removed: 53] [added: 92] | | | | [removed: 67] [added: 53] | | | | [removed: 66] [added: 67] | | | | [removed: (21] [added: 74] | [removed: )] | | | [removed: 2] [added: (21] | [added: )] |
| Total | | $ | [removed: 24,875] [added: 24,119] | | | $ | [removed: 21,804] [added: 24,875] | | | $ | [removed: 19,533] [added: 21,804] | | | | [removed: 14] [added: (3] | [removed: %] [added: )%] | | | [removed: 12] [added: 14] | % |
Our fuel surcharge programs generated freight revenues of [removed: $3.7] [added: $3.0] billion and [removed: $1.7] [added: $3.7] billion in [removed: 2022] [added: 2023] and [removed: 2021,] [added: 2022,] respectively.
In [removed: 2022,] [added: 2023,] other subsidiary revenues [removed: increased] [added: decreased] compared to [removed: 2021] [added: 2022] primarily driven by [removed: higher fuel surcharge and an increase in automotive parts shipments due to market] [added: weaker] demand [removed: and contract wins] [added: for intermodal shipments] at our Loup subsidiary.
Other revenues [removed: decreased] [added: increased] year-over-year.
| _Millions_ | | [removed: _2022_] [added: _2023_] | | | | [removed: _2021_] [added: _2022_] | | | | [removed: _2020_] [added: _2021_] | | | | [removed: _2022] [added: _2023] v [removed: 2021_] [added: 2022_] | | | | [removed: _2021] [added: _2022] v [removed: 2020_] [added: 2021_] | | |
| Grain & grain products | | $ | [removed: 3,598] [added: 3,644] | | | $ | [removed: 3,181] [added: 3,598] | | | $ | [removed: 2,829] [added: 3,181] | | | | [removed: 13] [added: 1] | % | | | [removed: 12] [added: 13] | % |
| Fertilizer | | | [removed: 712] [added: 757] | | | | [removed: 697] [added: 712] | | | | [removed: 660] [added: 697] | | | | [removed: 2] [added: 6] | | | | [removed: 6] [added: 2] | |
| Food & refrigerated | | | [removed: 1,093] [added: 1,041] | | | | [removed: 998] [added: 1,093] | | | | [removed: 937] [added: 998] | | | | [removed: 10] [added: (5] | [added: )] | | | [removed: 7] [added: 10] | |
| Coal & renewables | | | [removed: 2,134] [added: 1,916] | | | | [removed: 1,780] [added: 2,134] | | | | [removed: 1,534] [added: 1,780] | | | | [removed: 20] [added: (10] | [added: )] | | | [removed: 16] [added: 20] | |
| Bulk | | | [removed: 7,537] [added: 7,358] | | | | [removed: 6,656] [added: 7,537] | | | | [removed: 5,960] [added: 6,656] | | | | [removed: 13] [added: (2] | [added: )] | | | [removed: 12] [added: 13] | |
| Industrial chemicals & plastics | | | [removed: 2,158] [added: 2,176] | | | | [removed: 1,943] [added: 2,158] | | | | [removed: 1,845] [added: 1,943] | | | | [removed: 11] [added: 1] | | | | [removed: 5] [added: 11] | |
| Metals & minerals | | | [removed: 2,196] [added: 2,194] | | | | [removed: 1,811] [added: 2,196] | | | | [removed: 1,580] [added: 1,811] | | | | [removed: 21] [added: \-] | | | | [removed: 15] [added: 21] | |
| Forest products | | | [removed: 1,465] [added: 1,347] | | | | [removed: 1,357] [added: 1,465] | | | | [removed: 1,160] [added: 1,357] | | | | [removed: 8] [added: (8] | [added: )] | | | [removed: 17] [added: 8] | |
| Energy & specialized markets | | | [removed: 2,386] [added: 2,521] | | | | [removed: 2,212] [added: 2,386] | | | | [removed: 2,037] [added: 2,212] | | | | [removed: 8] [added: 6] | | | | [removed: 9] [added: 8] | |
| Industrial | | | [removed: 8,205] [added: 8,238] | | | | [removed: 7,323] [added: 8,205] | | | | [removed: 6,622] [added: 7,323] | | | | [removed: 12] [added: \-] | | | | [removed: 11] [added: 12] | |
| Automotive | | | [removed: 2,257] [added: 2,421] | | | | [removed: 1,761] [added: 2,257] | | | | [removed: 1,680] [added: 1,761] | | | | [removed: 28] [added: 7] | | | | [removed: 5] [added: 28] | |
| Intermodal | | | [removed: 5,160] [added: 4,554] | | | | [removed: 4,504] [added: 5,160] | | | | [removed: 3,989] [added: 4,504] | | | | [removed: 15] [added: (12] | [added: )] | | | [removed: 13] [added: 15] | |
| Premium | | | [removed: 7,417] [added: 6,975] | | | | [removed: 6,265] [added: 7,417] | | | | [removed: 5,669] [added: 6,265] | | | | [removed: 18] [added: (6] | [added: )] | | | [removed: 11] [added: 18] | |
| Total | | $ | [removed: 23,159] [added: 22,571] | | | $ | [removed: 20,244] [added: 23,159] | | | $ | [removed: 18,251] [added: 20,244] | | | | [removed: 14] [added: (3] | [removed: %] [added: )%] | | | [removed: 11] [added: 14] | % |
| _Thousands_ | | [removed: _2022_] [added: _2023_] | | | | [removed: _2021_] [added: _2022_] | | | | [removed: _2020_] [added: _2021_] | | | | [removed: _2022] [added: _2023] v [removed: 2021_] [added: 2022_] | | | | [removed: _2021] [added: _2022] v [removed: 2020_] [added: 2021_] | | |
| Grain & grain products | | | 798 | | | | [removed: 805] [added: 798] | | | | [removed: 745] [added: 805] | | | | [removed: (1] [added: \-] | [removed: )%] [added: %] | | | [removed: 8] [added: (1] | [removed: %] [added: )%] |
| Fertilizer | | | [removed: 190] [added: 191] | | | | [removed: 201] [added: 190] | | | | [removed: 193] [added: 201] | | | | [removed: (5] [added: 1] | [removed: )] | | | [removed: 4] [added: (5] | [added: )] |
| Food & refrigerated | | | [removed: 187] [added: 175] | | | | [removed: 189] [added: 187] | | | | [removed: 185] [added: 189] | | | | [removed: (1] [added: (6] | ) | | | [removed: 2] [added: (1] | [added: )] |
2023 Results
| ● | Safety – We initiated changes to our safety program that focused on training, culture, and refreshing how teams communicate and look out for each other. An analysis of historical injury data identified a large portion of our reportable injuries involve a failure to comply with a small number of critical operating rules. These critical rules are the foundation of our new program that is being implemented. While our reportable personal injury incidents rate per 200,000 employee-hours deteriorated 4% from 2022, we improved in the latter part of the year. We continued to refine our proprietary software called Precision Train Builder to evaluate train and route characteristics to enable proactive intervention by our Operating Practices Command Center to prevent derailments. In addition, the software allows the team to simulate in-train forces to avoid train handling that would generate forces greater than tolerance limits. These efforts helped to drive our reportable derailment incident rate per million train miles down 6% year-over-year. Further supporting our efforts, in March, the AAR announced a set of key safety actions. These include the installation of additional hot wheel bearing wayside detectors and enhanced standards for how we proactively use and share critical data. In addition, the industry is expanding efforts in first responder training and deploying technology to provide real-time railcar condition monitoring. |
| ● | Service – Car trip plan compliance for both intermodal and manifest/automotive products improved compared to 2022. Throughout the year we improved network fluidity as reflected in faster freight car velocity and lower terminal dwell. We graduated over 1,900 train, engine, and yard employees to backfill attrition, cover absences resulting from recently negotiated sick leave benefits, and added employees in areas of critical need to address operational challenges and support our service product. |
| ● | Operational Excellence – The year began with weather disruptions across the network that impacted our operations. We deployed additional locomotives and aggressively hired train, engine, and yard employees to alleviate these operational challenges. Despite the challenges, we continued to focus on using our resources effectively and productively, which resulted in sequential improvement in many of our operating metrics. |
| ● | Financial Results – Soft consumer markets, inflationary pressures, new labor agreements, fluctuating fuel prices, operational issues, and first quarter weather disruptions negatively impacted our financial results. Operating income of $9.1 billion declined 8% from 2022, and operating ratio was 62.3%, deteriorating 2.2 points from 2022. Net income of $6.4 billion translated into earnings of $10.45 per diluted share, down 7% from 2022. Despite the challenging year, we generated $8.4 billion of cash provided by operating activities, yielded free cash flow of $1.5 billion after reductions of $3.7 billion for cash used in investing activities and $3.2 billion in dividends. Both cash provided by operating activities and free cash flow were lowered by $454 million of payments related to the 2022 one-time charge for agreements reached with our labor unions and the ratification charge for a crew staffing agreement reached in the second quarter of 2023. |
2024 Outlook
| ● | Service – We are committed to delivering the service we sold to our customers. As we meet with customers to agree on their specific needs and outcomes, we will measure ourselves against the best service we provided them over the past three years and use that as a guide for meeting their expectations. We will engage with customers to understand how we win together. |
| ● | Operational Excellence – To provide our customers with the service we sold, we must run a fluid network. Network fluidity enables us to effectively utilize all our resources and provides the capacity to respond in an ever-changing environment. We will continue to transform our railroad to further improve our service product, improve resource utilization, and lower our overall cost structure. |
Freight revenues decreased 3% year-over-year to $22.6 billion driven by lower fuel surcharge revenues, negative mix of traffic (decreased lumber shipments and increased short haul rock shipments), and a 1% decrease in volume, partially offset by core pricing gains.
Volume decreases were primarily driven by weaker demand for intermodal and coal shipments.
These declines were partially offset by a domestic intermodal contract win, increased production and inventory replenishment in the automotive industry, growth in petroleum and LPG shipments, and strength in rock shipments.
Fuel surcharge revenues in 2023 decreased $0.7 billion due to a 15% decrease in fuel prices and lower volume, partially offset by the impact of fluctuating fuel prices (it can generally take up to two months for changing fuel prices to affect fuel surcharge recoveries).
Accessorial revenues decreased in 2023 compared to 2022 driven by decreased intermodal accessorial and container revenues due to lower volume and improvements in the global supply chain as reflected in better equipment cycle times.
| _Premium_ – Premium includes shipments of finished automobiles, automotive parts, and merchandise in intermodal containers, both domestic and international. Freight revenues from premium shipments decreased driven by lower fuel surcharges and volume declines, partially offset by core pricing gains. Intermodal shipments declined 3% compared to 2022 as high inventories and inflationary pressures impacted consumer demand, partially offset by a domestic contract win. Despite the negative effects of the United Auto Workers strike, automotive shipments increased 5% compared to 2022 driven by increased production as dealers replenished inventories. | 2023 Premium Carloads 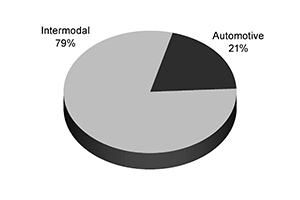 |
Revenues from Mexico shipments were $2.8 billion in 2023, up 2% compared to 2022, driven by a 4% volume increase, partially offset by a 2% decrease in average revenue per car due to lower fuel surcharge revenues.
The closure of the Eagle Pass and El Paso border crossings in the fourth quarter had a slightly negative impact on the overall results.
| Operating expenses increased $79 million, or 1%, in 2023 compared to 2022 driven by inflation; operational challenges in the first half of the year, including additional costs related to weather; increased workforce levels, including the impact of increased sick leave benefits provided to our craft professionals; higher casualty costs; and the ratification charge for a crew staffing agreement reached in the second quarter of 2023, partially offset by lower fuel prices, a one-time charge in 2022 for agreements reached with our labor unions, and volume related costs. | | 2023 Operating Expenses |
In 2023, expenses increased 4% compared to 2022.
The employee level increase of 3% includes a 4% increase in train, engine, and yard employees to backfill attrition, cover absences resulting from recent negotiated sick leave benefits, and add employees in areas of critical need to address operational challenges and support our service product.
The wage growth, costs for training, and the ratification charge for a crew staffing agreement reached in the second quarter of 2023, partially offset by the 2022 one-time charge for agreements reached with our labor unions, lower incentive compensation, and lower volume drove the increase in compensation and benefits for 2023 compared to 2022.
Equipment and other rents expense increased 5% compared to 2022 due to lower equity income and inflation, partially offset by greater network fluidity and lower volume.
_Other Income, net_ – Other income increased in 2023 compared to 2022 driven by a one-time $107 million real estate transaction, partially offset by lower gains from real estate sales.
See Note 6 to the Financial Statements and Supplementary Data, Item 8, for additional detail.
The effective interest rate was 4.0% in both periods.
_Income Tax Expense_ – Income tax expense decreased in 2023 compared to 2022 due to lower pre-tax income and deferred tax expense reductions.
In 2023, the states of Nebraska, Iowa, Kansas, and Arkansas enacted legislation to reduce their corporate income tax rates for future years resulting in a $114 million reduction of our deferred tax expense.
Freight car velocity, average train speed, and average terminal dwell improved compared to 2022 as last year we experienced congestion across our system.
These metrics were negatively impacted by operational challenges caused by weather in the first quarter of 2023 and train crew shortages in some locations in the first half of the year, but as network fluidity improved throughout 2023, freight car velocity increased sequentially.
Locomotive productivity improved 3% in 2023 compared to 2022 driven by improved network fluidity in the second half of 2023.
As a result of the improved fluidity, we stored locomotives in the second half of the year, reducing our active fleet size 11% since the end of the second quarter of 2023.
These improvements more than offset increased average active fleet size in the first half of 2023 as resources were deployed to alleviate operational challenges and weather disruptions.
Our train length increased slightly compared to 2022 as initiative to drive train length improvements in the second half of the year more than offset the declines in intermodal shipments, which generally move on longer trains.
The 3% increase in employee levels was driven by an increase in craft professionals as we aggressively hired train, engine, and yard employees to backfill attrition, cover absences resulting from recently negotiated sick leave benefits, and add employees in areas of critical need to address operational challenges and support our service product.
Debt / Net Income
| Debt / net income | | | 5.1 | | | | 4.8 | | | | 4.6 | |
| _Millions, Except Ratios_ | _2023_ | | | _2022_ | | | | _2021_ | | | | |
| Debt | | $ | 32,579 | | | $ | 33,326 | | | $ | 29,729 | |
The most comparable GAAP measure is debt to net income ratio.
Pension and OPEB were funded at December 31, 2023, 2022, and 2021.
| Debt \[a\] | | $ | 60,516 | | | $ | 2,610 | | | $ | 2,591 | | | $ | 2,617 | | | $ | 2,348 | | | | 2,294 | | | $ | 48,056 | |
2022 Results
| ● | Safety – Union Pacific is dedicated to maintaining a safe and healthy workplace. Throughout 2022, we continued to use our Total Safety Culture, Courage to Care, COMMIT (Coaching, Observing, Mentoring, and Motivating with Integrity and Trust), and Peer to Peer programs throughout our operations to enhance employee safety and engagement. In addition, based on the evaluation of a third-party expert on the effectiveness of these programs completed in 2021, we are implementing engagement improvements to enhance our safety culture. These initiatives include defining and setting standards for employee interactions, corrective actions and follow up, and root cause analysis. As a result of these efforts, our reportable personal injury incidents rate per 200,000 employee-hours of 0.80 decreased 18% from 2021. We also continued to adapt to the evolving environment due to COVID and other illnesses. Safety procedures and policies are refined based on Centers for Disease Control and Prevention (CDC) guidelines. |
| | We continued to refine our proprietary software to evaluate train and route characteristics to enable proactive intervention by our Operating Practices Command Center to prevent derailments. In addition, we increased the replacement of freight car wheels and took steps to address human factor yard derailments related to switch alignment. Despite these efforts, our reportable derailment incident rate per million train miles increased 8% year-over-year. |
| ● | Network Operations – Throughout 2022, our network was congested in several key corridors, which hindered our ability to handle all of the demand in several markets. To address this congestion, we aggressively hired and graduated 1,302 new train, engine, and yard employees; temporarily relocated train, engine, and yard employees to areas with the greatest need; added locomotives to the fleet in select locations; and reduced freight car inventory, relative to carloads, from our network. Due to this congestion, our operating metrics deteriorated year-over-year. Freight car velocity decreased due to increased terminal dwell and higher operating car inventory levels, which drove lower train speeds. Additional details on these metrics are discussed in Other Operating/Performance and Financial Statistics of this Item 7. |
| ● | Freight Revenues – Freight revenues increased 14% year-over-year to $23.2 billion driven by higher fuel surcharge revenues, core pricing gains, and a 2% increase in volume. Volume increases were driven by strong production and inventory replenishment in the automotive industry, increased demand for coal due to higher natural gas prices, and continued strength in the industrial markets driven by rock, sand, and plastics. These gains were partially offset by declines in international intermodal, parcel, grain, and petroleum products. |
| ● | Financial Results – Higher fuel prices, operational challenges, inflation, increased volume-related costs, and a one-time charge for the labor agreements reached with our labor unions (See Labor Agreements in Other Matters in this Item 7 of Part II), drove a 20% increase in operating expenses. Partially offsetting these increases were lower weather-related expenses in 2022 compared to 2021, when we incurred additional costs associated with Winter Storm Uri and wildfires in California. Increased revenues, due to higher fuel surcharge revenues, improved pricing, additional volume, and intermodal accessorial charges, more than offset the increased expenses producing operating income of $9.9 billion, a 6% increase over 2021. Our operating ratio was 60.1%, deteriorating 2.9 points from 2021. Net income of $7.0 billion translated into earnings of $11.21 per diluted share, up 13% from 2021. |
| ● | Fuel Prices – The onset of the Russia-Ukraine conflict in late February 2022 drove crude oil prices above $100 a barrel, where it remained elevated until mid-2022, driving an increase in our average fuel price. While our average fuel price declined 8% in the fourth quarter from the second quarter high of $4.03, our average price in the fourth quarter was 46% higher than the fourth quarter of 2021. Our average price of diesel fuel for the full year of 2022 was $3.65 per gallon, an increase of 64% from 2021. The higher price resulted in increased operating expenses of $1.3 billion (excluding any impact from year-over-year volume increases). Gross ton-miles increased 3%, which also drove higher fuel expense. Partially offsetting these increases was a 1% improvement in our fuel consumption rate to a new full year record low. |
| ● | Liquidity – We are continually evaluating our financial condition and liquidity. On December 31, 2022, we had $973 million of cash and cash equivalents. Despite the challenging year, we generated $9.4 billion of cash provided by operating activities, yielding free cash flow of $2.7 billion after reductions of $3.5 billion for cash used in investing activities and $3.2 billion in dividends. We repurchased $6.3 billion of our shares. We have been, and we expect to continue to be, in compliance with our debt covenants. We have $2.0 billion of credit available under our revolving credit facility and up to $700 million undrawn on our Receivables Facility. As of December 31, 2022, none of the revolving credit facility was drawn. Additional details are discussed in Liquidity and Capital Resources of this Item 7. |
2023 Outlook
| ● | Network Operations – In 2023, we strive to increase reliability of our service product, reduce variability in network operations, and improve resource availability, including actively hiring additional train, engine, and yard employees. Further train length initiatives allow us to efficiently add incremental volume growth to our existing train network. We will continue to make capital investments targeted to improve operational performance, handle more volume, and increase efficiency, requiring fewer locomotives, freight cars, and other critical resources. |
| ● | Financial Expectations – We expect volume to outpace industrial production growth in 2023 due to our business development efforts bringing new customers to our railroad. In the current environment, we expect continued operating ratio improvement driven by pricing in excess of inflation, improving our service product, and better leveraging our resources. We expect to generate strong cash flow from operating activities allowing us to continue our industry leading dividend payout ratio and commit excess cash to our share repurchase programs. Macroeconomic uncertainties remain in 2023 that could have a material impact on our 2023 financial and operating results. Regardless of external factors, we will focus on providing our customers consistent and reliable service; efficiently managing operations; seeking new business opportunities; and protecting our employees, customers, and communities. |
| ● | Fuel Prices – Projections for crude oil and natural gas continue to fluctuate in the current economic environment. We could again see volatile fuel prices during 2023, as they are sensitive to global and U.S. domestic demand, refining capacity, geopolitical events, weather conditions, and other factors. As prices fluctuate, there will be a timing impact on earnings, as our fuel surcharge programs trail increases or decreases in fuel price by approximately two months. Significant changes in fuel prices could have an impact on consumer discretionary spending, impacting demand for various consumer products we transport. Alternatively, those changes could have an inverse impact on commodities such as coal, petroleum products, and domestic drilling-related shipments. Increased diesel fuel prices also impact our competitive position versus trucks. As prices rise, the demand for more fuel-efficient rail transportation also rises, but at a slower rate. |
Freight revenues increased 14% year-over-year to $23.2 billion driven by higher fuel surcharge revenues, core pricing gains, and a 2% increase in volume.
Volume increases were driven by strong production and inventory replenishment in the automotive industry, increased demand for coal due to higher natural gas prices, and continued strength in the industrial markets driven by rock, sand, and plastics.
These gains were partially offset by declines in international intermodal, parcel, grain, and petroleum products.
Fuel surcharge revenues in 2022 increased $2.0 billion because of a 64% increase in fuel price and a 2% increase in carloadings.
Accessorial revenues increased in 2022 compared to 2021 driven by increased intermodal accessorial charges tied to global supply chain disruptions.
| _Premium_ – Premium includes shipments of finished automobiles, automotive parts, and merchandise in intermodal containers, both domestic and international. Freight revenues from premium shipments increased driven by higher fuel surcharges, core pricing gains, and positive mix of traffic, partially offset by a slight decline in volume. Automotive shipments increased 11% compared to 2021 driven by an increase in finished vehicle shipments and automotive parts as the automotive industry continued to recover from the shortage of semiconductors and the 2021 weather disruptions in the first quarter. Premium volume was flat compared to 2021 as the increased automotive shipments, domestic intermodal contract wins, and market strength due to tight truck capacity earlier in the year were more than offset by ongoing international supply chain disruptions and the soft market demand in the fourth quarter for domestic and parcel shipments. | 2022 Premium Carloads  |
Revenues from Mexico business were $2.7 billion in 2022, up 14% compared to 2021, driven by higher fuel surcharge revenues, core pricing gains, and positive mix of traffic, partially offset by a 1% decline in volume.
| Operating expenses increased $2.5 billion, or 20%, in 2022 compared to 2021 driven by higher fuel prices, operational inefficiencies, inflation, increased volume-related costs, and a one-time charge for the labor agreements reached with our labor unions (See Labor Agreements in Other Matters in this Item 7 of Part II). Partially offsetting these increases were lower weather-related expenses in 2022 compared to 2021, which included costs associated with Winter Storm Uri and wildfires in California. | 2022 Operating Expenses |
In 2022, expenses increased 12% compared to 2021, due to wage inflation, increased employee levels to address congestion across the system and increased carload volumes, and a one-time charge for the labor agreements reached with our labor unions (See Labor Agreements in Other Matters in this Item 7 of Part II).
The year-over-year comparison was positively impacted by the 2021 weather-related expenses.
Gross ton-miles increased 3% driving higher fuel expense.
Partially offsetting this increase was a 1% improvement to a record low fuel consumption rate in 2022, computed as gallons of fuel consumed divided by gross ton-miles.
The year-over-year comparison was positively impacted by the 2021 weather-related expenses.
Equipment and other rents expense increased 5% compared to 2021 due to higher volume and network congestion.
Higher equity income partially offset some of these increases.
_Other Income, net_ – Other income increased in 2022 compared to 2021 driven by higher real estate income and net periodic pension benefits, partially offset by a $36 million gain from the sale of an investment in a technology company in 2021 and higher environmental remediation expense at non-operating sites.
Real estate sales in 2021 included a $50 million gain from a sale to the Colorado Department of Transportation.
2021 income tax expense included reductions of $32 million in deferred tax expense from Nebraska, Oklahoma, Idaho, Louisiana, and Arkansas reducing their corporate income tax rates.
Freight car velocity, average train speed, and average terminal dwell deteriorated compared to 2021 as excess operating car inventory levels and hiring challenges decreased network fluidity.
Locomotive productivity decreased 6% in 2022 compared to 2021 driven by an increase in our average active fleet size as resources were deployed to alleviate network congestion and handle increased volume compared to 2021.
Our train length remained relatively flat compared to 2021 due to lower international intermodal shipments and efforts to recover the network offsetting productivity initiatives.
The 3% increase in employee levels was driven by an increase in train, engine, and yard employees to address volume increases and operational inefficiencies due to crew shortages.
| Unfunded pension and OPEB, net of tax cost of $0, $0, and $195 \[a\] | | | \- | | | | \- | | | | 637 | |
| _\[a\]_ | _Prior periods were recast to conform to the current year presentation, which removes the impact of pension and OPEB (other postretirement benefits) when the net amount represents a funded amount._ |
We increased the dividend once during 2022 paying out $3.2 billion and repurchased shares totaling $6.3 billion, including the completion of our $2.2 billion accelerated share repurchase programs entered into on February 17, 2022.
At December 31, 2022, we had $100 million of the Receivables Facility drawn, $200 million of commercial paper, and a $100 million term loan outstanding.
| Debt \[a\] | | $ | 61,664 | | | $ | 2,837 | | | $ | 2,562 | | | $ | 2,642 | | | $ | 2,081 | | | | 2,323 | | | $ | 49,219 | |
| Purchase obligations \[b\] | | | 3,241 | | | | 920 | | | | 818 | | | | 822 | | | | 275 | | | | 180 | | | | 226 | |
An excerpt. Shown here: 40 of 213 rewritten, 40 of 55 added and 40 of 68 removed. The counts are complete. For every sentence, read Item 7. Management’s Discussion and Analysis of Financial Condition and Results of Operations in the FY2023 filing and the FY2022 filing.
Item 7A. Quantitative and Qualitative Disclosures about Market Risk
1 rewritten, 0 added, 0 removed, 1 unchanged
Read the full itemFY2023 item · filed February 9, 2024FY2022 item · filed February 10, 2023
Information concerning market risk sensitive instruments is set forth under Management’s Discussion and Analysis of Financial Condition and Results of Operations [removed: –] [added: -] Other Matters, Item 7.
Item 1. Business
35 rewritten, 19 added, 38 removed, 107 unchanged
Read the full itemFY2023 item · filed February 9, 2024FY2022 item · filed February 10, 2023
[removed: Win: Driving] [added: The result will be] strong financial performance [removed: resulting in] [added: driving] significant shareholder returns.
Execution of our [removed: plans] [added: strategy] to [added: be the industry leader in] both [removed: serve] [added: safety] and [removed: grow,] [added: service] leads to [removed: higher revenues] [added: revenue growth] with improved margins and greater cash generation, creating long term enterprise value.
Our passion for performance will help us win; our high ethical standards [removed: will lead us to] [added: ensure we] win in a way that supports all of our stakeholders; and our teamwork [removed: will make sure] [added: ensures] we win together.
Although we provide [added: and analyze] revenues by commodity group, we [removed: analyze] [added: treat] the [removed: net] financial results of the Railroad as one segment due to the integrated nature of our rail network.
Additional information regarding our business and operations, including revenues, financial information and data, and other information regarding environmental matters, is presented in Risk Factors, Item 1A; Legal Proceedings, Item 3; Management’s Discussion and Analysis of Financial Condition and Results of Operations, Item 7; and the Financial Statements and Supplementary Data, Item [removed: 8 (which include information regarding revenues, statements of income, and total assets).][added: 8.]
| Operations – UPRR is a Class I railroad operating in the U.S. We have [removed: 32,534] [added: 32,693] route miles, connecting Pacific Coast and Gulf Coast ports with the Midwest and Eastern U.S. gateways and providing several corridors to key Mexican [added: and Canadian] gateways. We serve the western two-thirds of the country and maintain coordinated schedules with other rail carriers to move freight to and from the Atlantic Coast, the Pacific Coast, the Southeast, the Southwest, Canada, and Mexico. Export and import traffic moves through Gulf Coast, Pacific Coast, and East Coast ports and across the Mexican and Canadian borders. In [removed: 2022,] [added: 2023,] we generated freight revenues totaling [removed: $23.2] [added: $22.6] billion from the following three commodity groups: | [removed: 2022] [added: 2023] Freight Revenues |
| [removed: 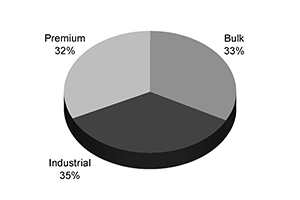] [added: 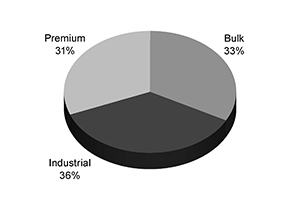] | |
In [removed: 2022,] [added: 2023,] this group generated 33% of our freight revenues.
We also serve significant domestic markets, including grain processors, animal feeders, [added: ethanol,] and [removed: ethanol] [added: renewable biofuel] producers in the Midwest and West.
Transportation of these products accounted for [removed: 35%] [added: 36%] of our freight revenues in [removed: 2022.][added: 2023.]
_Premium_ – In [removed: 2022,] [added: 2023,] Premium shipments generated [removed: 32%] [added: 31%] of Union Pacific’s total freight revenues.
As of December 31, [removed: 2022,] [added: 2023,] the Company employed [removed: 33,179] [added: 32,973] employees.
The average age is [removed: 46.5] [added: 46.6] with average tenure of [removed: 15.8] [added: 15.9] years.
Union Pacific works with 13 major rail unions, representing approximately [removed: 83%] [added: 85%] of our workforce.
Our Culture: We incorporate our commitment to safety, [added: diversity and inclusion,] high ethical standards, passion for performance, and teamwork into our day-to-day operations as we [removed: service] [added: serve] our customers.
Our success is measured by our personal injury rate (the number of reportable injuries for every 200,000 employee-hours [removed: worked),] [added: worked)] and our derailment incident rate (the number of reportable derailment incidents per million train miles).
Reportable derailment incidents are defined as any occurrence where a wheel of a locomotive or rail car falls off the track [removed: that] [added: and] causes damage to track, equipment, or structures above the Federal Railroad Administration (FRA) reporting threshold, regardless of ownership [removed: ($11,300] [added: ($11,500] for [removed: 2022] [added: 2023] and [removed: $11,500] [added: $12,000] for [removed: 2023).][added: 2024) per million train miles.]
[removed: The personal] [added: Personal] injuries and derailment incidents that meet reportable criteria are reported to the FRA.
Our [removed: 2022] [added: 2023] personal injury rate of [removed: 0.80 improved 18%] [added: 1.17 deteriorated 4%,] while our derailment incident rate of [removed: 2.88 increased 8%] [added: 2.72 improved 6%] versus [removed: 2021.][added: 2022.]
Union Pacific’s commitment, today and for the future, is to further improve and strengthen performance through an inclusive workforce that reflects the diverse markets and communities we serve, where everyone is treated fairly, [removed: and] differences are [removed: valued.][added: valued, and talent is recognized and rewarded.]
To that end, Union Pacific [removed: established a goal] [added: intends] to [added: maintain its standards of hiring and promoting based on merit, while aspiring to] reach 40% people of color and double our female representation to 11% in our workforce by 2030.
As of December 31, [removed: 2022,] [added: 2023,] workforce representation of people of color and females was approximately [removed: 32.8%] [added: 33.8%] and 5.5%, respectively.
Then, we focus on training and development, which includes [added: courses and] programs designed to [removed: recognize potential and to] help our employees grow into new roles [added: and/or learn a new skill in their current role] so that we can retain our workforce over time.
The median annual compensation for all employees employed as of December 31, [removed: 2022,] [added: 2023,] was [removed: $86,778] [added: $108,244] (excluding the CEO).
Talent is critical [removed: –] [added: -] our ability to recruit and retain employees is directly tied to our railroad’s fluidity.
Without team members to [removed: dispatch or] [added: dispatch,] operate trains, [added: and maintain] our [added: infrastructure, our] network struggles to provide customers efficient, reliable service.
To date, we have not experienced any material disruption of our operations due to a cyber threat or [removed: attack] [added: incident] directed at us.
_Cooperation with Federal, State, and Local Government Agencies_ – We work closely on physical and cybersecurity initiatives with government agencies, including the U.S. Department of Transportation (DOT); the [added: Federal Bureau of Investigation (FBI); the] Department of Homeland Security (DHS), along with its Cybersecurity [removed: &] [added: and] Infrastructure Security Agency (CISA) and [added: the] TSA; as well as local police departments, fire departments, and other first responders.
[removed: In connection with new] [added: Based on] guidance from the TSA, [removed: effective] [added: starting from] January 1, 2022, we were [removed: required] [added: obligated] to report cyber incidents to CISA.
Sustainable Future – Union Pacific believes it is important that we act as environmental stewards, reducing [added: greenhouse gas (GHG)] emissions and supporting the transition to a more sustainable future.
According to the AAR, moving freight by rail instead of truck reduces [removed: greenhouse gas (GHG)] [added: GHG] emissions by up to 75%.
References to our website address, [removed: the "We Are One" report, and the Climate Action Plan,] in this report, including references in Management’s Discussion and Analysis of Financial Condition and Results of Operations, Item 7, are provided as a convenience and do not constitute, and should not be deemed, an incorporation by reference of the information contained on, or available through, the website.
The STB also continues to explore changes to the methodology for determining railroad revenue [removed: adequacy and] [added: adequacy,] the possible uses of revenue adequacy in regulating railroad [removed: rates.][added: rates, and ways to regulate service, including by use of emergency service orders.]
The statutes and regulations are administered and monitored by the Environmental Protection Agency (EPA) and by various state environmental [removed: agencies.][added: agencies, such as the California Air Resources Board (CARB) and the Texas Commission on Environmental Quality (TCEQ), among others.]
Information concerning environmental claims and contingencies and estimated remediation costs is set forth in Management’s Discussion and Analysis of Financial Condition and Results of Operations [removed: –] [added: -] Critical Accounting Estimates [removed: –] [added: -] Environmental, Item 7, and Note 17 to the Financial Statements and Supplementary Data, Item 8.
Safety, Service, and Operational Excellence supports the Company's long term initiative to Grow its freight volumes (Safety + Service & Operational Excellence = Growth).
Together as a team, the Company will focus on achieving the best safety record in the industry, being known for superior service, grounded in operational excellence which, in turn, drives growth.
Safety is paramount and, as our first area of focus, sets the foundation for achieving the Company's objectives.
The mindset and culture are built around a personal commitment by all employees to prioritize safety so everyone goes home safely.
Service is all about delivering what we sold our customers.
We work with our customers to understand the service they need to win in their markets and then drive how we win together.
We commit to these service levels and do it with excellence.
Operational Excellence is about operating efficiently and productively.
We will drive value with our available resources, but also maintain a buffer so our service is resilient, managing the inevitable ups and downs that come with weather, fluctuating volumes, and securing growth.
As we work to transform our railroad, our core values continue to guide us.
Proud & Engaged Workforce – Our employees are central to our Safety + Service & Operational Excellence = Growth strategy, and investing in our workforce is key to our success.
We believe that a diverse and supportive culture increases employee engagement, improves morale, and allows qualified employees to succeed and contribute to Union Pacific's success.
All of this supports our safety strategy and improves the quality of decision-making, problem-solving, and strategic thinking.
We are focused on effectively managing workforce levels to the demands of the business and improving quality of life for our employees.
Therefore, we continue to hire to backfill attrition and handle growth as needed.
Additionally, we appointed cybersecurity coordinators, conducted a self-assessment of our cyber vulnerabilities, and put in place a plan to respond to cyber incidents.
We are currently awaiting approval of our security plan before progressing with the establishment of a cybersecurity assessment plan, which will describe how the Company proactively and regularly evaluates the effectiveness of our cybersecurity measures as well as identify and address any weaknesses in our devices, networks, and systems.
Freight rail leads other forms of surface transportation when it comes to minimizing GHG emissions, and we expect rail will continue to play a critical role in mitigating and abating the impacts of climate change.
Therefore, converting freight transportation from truck to rail typically results in an immediate reduction in our customers' scope 3 GHG emissions.
The Company’s growth strategy focuses on growing customer value through innovative supply chain solutions and aspiring to Serve, Grow, Win – Together.
Serve: Driving operational excellence to create a safer, more reliable, and efficient service product.
Precision scheduled railroading (PSR) is the foundation for delivering customer-centered operational excellence by:
| 1. | Shifting the focus of operations from moving trains to moving cars. |
| 2. | Minimizing car dwell, car classification events, and locomotive power requirements. |
| 3. | Utilizing general-purpose trains by blending existing train service. |
| 4. | Balancing train movements to improve the utilization of resources. |
We aim to move cars faster and reduce the number of times each car is touched, resulting in terminal consolidation opportunities, improved asset utilization, and fewer car classifications, which in turn leads to products getting to the market quicker and more reliably.
The result is a better customer experience, which enables us to grow our market share.
Grow: By harnessing the potential of the best rail franchise in the industry, we expect to generate growth in three ways – increasing profitable carloads that fit our network and transportation plan, providing more products and services to create value for our customers, and increasing the geographic reach of our franchise through innovative supply chain solutions.
Together: Engaging our four stakeholder groups – Communities, Customers, Employees, and Shareholders.
Our comprehensive approach to Environmental, Social, and Governance issues, “Building a Sustainable Future 2030,” is designed to address the evolving interests of our stakeholders and is built on five areas of concentration – Building Responsible Foundations, Investing in our Workforce, Driving Sustainable Solutions, Championing Environmental Stewardship, and Strengthening our Communities.
We believe that operational excellence and an engaged workforce with deep market knowledge and strong customer relationships supports best-in-class safety, a customer experience that drives growth, and shareholder returns.
As we work to transform our railroad into the safest, most reliable, and most efficient in North America, our values continue guiding us.
Proud & Engaged Workforce – Our employees are central to our Serve, Grow, Win – Together strategy, and Investing in our Workforce is one of the five areas of concentration in our "Building a Sustainable Future 2030" strategy.
Most craft professionals and more than 45 railroads participate in negotiations on a national multi-employer basis.
The recent round of labor negotiations related to years 2020-2024 concluded in December 2022.
See Management’s Discussion and Analysis of Financial Condition and Results of Operations – Other Matters – Labor Agreements, Item 7, of this report for information about the conclusion of the 2020-2024 negotiations.
From an employee’s perspective, a diverse culture increases engagement, improves morale, and supports safety.
From a business perspective, diversity improves the Company’s decision-making, problem-solving, and strategic thinking, which translates into a competitive advantage with bottom-line results.
We accelerated recruitment efforts in 2022, requiring us to evolve our hiring practices and incorporate innovative strategies.
From virtual career fairs to pre-recorded video interviews, we implemented robust recruiting tools to meet candidates where they are and provide an efficient, user-friendly experience through every phase of the recruitment process.
We've also been aggressive in how we compete to attract talent in the marketplace.
In particularly hard-to-fill jobs and locations, we offered hiring incentives.
These incentives are a mix of travel allowances and relocation bonuses, as well as local hiring bonuses to attract applicants already residing in the communities we serve.
We continue driving inclusivity into our hiring process.
We’re removing bias by using software tools to confirm gender-neutral language in job postings, as well as providing video demonstrations and visual cues during physical abilities tests.
Pre-recorded video interviews allow applicants to participate at a time that works best for their schedule, accommodating those who may have nontraditional schedules.
And finally, tapping into those who know us best – employee referrals played an important part in building our team.
The “Great People Know Great People” employee referral program offers an incentive for each referral hired.
In 2022, we hired more than 1,250 referred employees.
Further discussion can be found in our “We Are One” report available on our website.
Additionally, during 2022, as required by the TSA guidance, we performed a cyber vulnerability self-assessment, submitted the results to the TSA, assembled and adopted a cyber incident response plan, and appointed cybersecurity coordinators.
During 2023, we are required to comply with the second directive from the TSA, effective October 18, 2022.
By February 21, 2023, we are required to develop and implement a cybersecurity implementation plan.
Afterwards we need to establish a cybersecurity assessment plan that describes how the Company will proactively and regularly assess the effectiveness of cybersecurity measures as well as identify and resolve device, network, and system vulnerabilities.
Building on rail’s relative emissions benefits over other modes of transportation, we are taking additional actions to reduce our emissions.
These actions are described in our Climate Action Plan on our website.
Item 3. Legal Proceedings
2 rewritten, 1 added, 5 removed, 20 unchanged
Read the full itemFY2023 item · filed February 9, 2024FY2022 item · filed February 10, 2023
Information concerning environmental claims and contingencies and estimated remediation costs is set forth in this report in Management’s Discussion and Analysis of Financial Condition and Results of Operations [removed: –] [added: -] Critical Accounting Estimates [removed: –] [added: -] Environmental, Item 7, and Note 17 to the Financial Statements and Supplementary Data, Item 8.
Since the Certification Denial, approximately [removed: 111] [added: 106] lawsuits [removed: have been filed] [added: are pending] in federal court based on claims identical to those alleged in the class certification case.
In 2019, Oxbow dismissed certain claims and the claims that remain are the same as the Plaintiffs’ claims in MDL I.
On February 19, 2021, the court denied our motion to exclude plaintiffs' alleged evidence of conspiracy under a federal statute designed to incent and protect railroad communications made to further interline service (i.e., where two railroads are in the route).
On May 17, 2022, the DC Circuit reversed the trial court and largely adopted the railroads’ interpretation of the statute, although no individual evidentiary rulings were made.
We also filed a motion for summary judgment on May 14, 2021, in the MDL I proceedings, and the briefing was completed in September 2021.
A hearing has not been scheduled on the motion.
Just as it did in the MDL proceedings, Union Pacific filed a motion for summary judgment on May 14, 2021, and no hearing has been scheduled.
Cover and table of contents
37 rewritten, 25 added, 47 removed, 53 unchanged
Read the full itemFY2023 item · filed February 9, 2024FY2022 item · filed February 10, 2023
For the fiscal year ended December 31, [removed: 2022][added: 2023]
| 1400 Douglas Street, Omaha, Nebraska | 68179 | [added: |]
| (Address of principal executive offices) | (Zip Code) | [added: |]
| As of June 30, [removed: 2022,] [added: 2023,] the aggregate market value of the registrant’s Common Stock held by non-affiliates (using the New York Stock Exchange closing price) was [removed: $131.5] [added: $123.0] billion. |
The number of shares outstanding of the registrant’s Common Stock as of February [removed: 3, 2023,] [added: 2, 2024,] was [removed: 611,872,981.][added: 609,777,914.]
Documents Incorporated by Reference – Portions of the registrant’s definitive Proxy Statement for the Annual Meeting of Shareholders to be held on May [removed: 18, 2023,] [added: 9, 2024,] are incorporated by reference into Part III of this report.
| | [removed: [Chairman’s] [added: [CEO’s] Letter](#chairman_letter) | [3](#chairman_letter) |
| | [Directors and Senior Management](#sr_mgmt) | [removed: [5](#sr_mgmt)] [added: [4](#sr_mgmt)] |
| Item 1. | [Business](#i1) | [removed: [6](#i1)] [added: [5](#i1)] |
| Item 1A. | [Risk Factors](#i1A) | [removed: [12](#i1A)] [added: [10](#i1A)] |
| Item 1B. | [Unresolved Staff Comments](#i1B) | [removed: [18](#i1B)] [added: [16](#i1B)] |
| Item 3. | [Legal Proceedings](#i3) | [removed: [21](#i3)] [added: [20](#i3)] |
| Item 4. | [Mine Safety Disclosures](#i4) | [removed: [22](#i4)] [added: [21](#i4)] |
| | [Cautionary Information](#cautionary_info) | [removed: [40](#cautionary_info)] [added: [38](#cautionary_info)] |
| Item 7A. | [Quantitative and Qualitative Disclosures About Market Risk](#i7A) | [removed: [40](#i7A)] [added: [39](#i7A)] |
| Item 8. | [Financial Statements and Supplementary Data](#i8) | [removed: [41](#i8)] [added: [40](#i8)] |
| | [Report of Independent Registered Public Accounting Firm](#ind_report) | [removed: [42](#ind_report)] [added: [41](#ind_report)] |
| Item 9. | [Changes in and Disagreements with Accountants on Accounting and Financial Disclosure](#i9) | [removed: [73](#i9)] [added: [72](#i9)] |
| Item 9A. | [Controls and Procedures](#i9A) | [removed: [73](#i9A)] [added: [72](#i9A)] |
| | [Management’s Annual Report on Internal Control Over Financial Reporting](#mgmt_report) | [removed: [73](#mgmt_report)] [added: [72](#mgmt_report)] |
| | [Report of Independent Registered Public Accounting Firm](#ind_report_9A) | [removed: [74](#ind_report_9A)] [added: [73](#ind_report_9A)] |
| Item 9B. | [Other Information](#i9B) | [removed: [75](#i9B)] [added: [74](#i9B)] |
| Item 9C. | [Disclosure Regarding Foreign Jurisdictions that Prevent Inspections](#i9c) | [removed: [75](#i9c)] [added: [74](#i9c)] |
| Item 10. | [Directors, Executive Officers, and Corporate Governance](#i10) | [removed: [75](#i10)] [added: [74](#i10)] |
| Item 11. | [Executive Compensation](#i11) | [removed: [75](#i11)] [added: [74](#i11)] |
| Item 13. | [Certain Relationships and Related Transactions, and Director Independence](#i13) | [removed: [76](#i13)] [added: [75](#i13)] |
| Item 14. | [Principal Accountant Fees and Services](#i14) | [removed: [76](#i14)] [added: [75](#i14)] |
| Item 15. | [Exhibit and Financial Statement Schedules](#i15) | [removed: [76](#i15)] [added: [75](#i15)] |
| Item 16. | [Form 10-K Summary](#i16) | [removed: [80](#i16)] [added: [79](#i16)] |
| | [Signatures](#sigs) | [removed: [81](#sigs)] [added: [80](#sigs)] |
| | Certifications | [removed: 82] [added: 81] |
[](# "chairman_letter")February [removed: 10, 2023][added: 9, 2024]
[removed: ][added: ]
[removed: Chairman, President, and] Chief Executive Officer
| William J. DeLaney Former Chief Executive Officer [removed: –] [added: -] Sysco Corporation _Board Committees: [removed: Audit;] Compensation and Benefits [removed: (Chair)_] [added: (Chair); Safety and Service Quality_] David B. Dillon Former Chairman and CEO [removed: –] [added: -] The Kroger Company _Board Committees: Audit (Chair); [removed: Compensation] [added: Corporate Governance, Nominating,] and [removed: Benefits_] [added: Sustainability_] Sheri H. Edison Former Executive Vice President and General Counsel [removed: –] [added: -] Amcor plc _Board Committees: Compensation and Benefits; Corporate Governance, Nominating, and [removed: Sustainability_ | |] [added: Sustainability (Chair)_] Teresa M. Finley Former Chief Marketing and Business Services Officer [removed: –] [added: -] United Parcel Service, Inc. _Board Committees: [removed: Compensation and Benefits;] [added: Audit;] Finance_ [removed: Lance M. Fritz Chairman, President, and Chief Executive Officer – Union Pacific Corporation and Union Pacific Railroad Company] [added: | |] Deborah C. Hopkins Former Chief Executive Officer [removed: –] [added: -] Citi Ventures and Former Chief Innovation Officer [removed: –] [added: -] Citi _Board Committees: [removed: Audit;] [added: Compensation and Benefits;] Finance (Chair)_ Jane H. Lute Strategic Advisor [removed: –] [added: -] SICPA, North America _Board Committees: Audit; [removed: Corporate Governance, Nominating,] [added: Safety] and [removed: Sustainability_ | |] [added: Service Quality (Chair)_] Michael R. McCarthy Chairman [removed: –] [added: - Union Pacific Corporation and Union Pacific Railroad Company; Chairman -] McCarthy Group, LLC; [added: and] Co-Chairman [removed: –] [added: -] Bridges Trust Company [removed: _Lead Independent Director_] _Board Committees: Corporate Governance, Nominating, and [removed: Sustainability (Chair);] [added: Sustainability;] Finance_ [removed: Jose H. Villarreal Retired Advisor – Akin, Gump, Strauss, Hauer, & Feld, LLP] [added: Doyle R. Simons Former President and CEO - Weyerhaeuser Company] _Board Committees: Compensation and Benefits; [removed: Corporate Governance, Nominating,] [added: Safety] and [removed: Sustainability_] [added: Service Quality_ | | John K. Tien, Jr. Former Deputy Secretary - U.S. Department of Homeland Security _Board Committees: Pending Assignment_ V. James Vena Chief Executive Officer - Union Pacific Corporation and Union Pacific Railroad Company John P. Wiehoff Former Chairman, President, and CEO - C.H. Robinson Worldwide, Inc. _Board Committees: Audit; Safety and Service Quality_] Christopher J. Williams Chairman [removed: –] [added: -] Siebert Williams Shank & Co. _Board Committees: Audit; Finance_ |
[added: |] SENIOR [removed: MANAGEMENT*][added: MANAGEMENT | | | | |]
| [removed: Lance M. Fritz Chairman, President, and] [added: V. James Vena] Chief Executive Officer Prentiss W. Bolin, Jr. Vice President [removed: –] [added: -] External Relations Bryan L. Clark Vice President [removed: –] [added: -] Tax Eric J. [removed: Gehringer] [added: Gehringer*] Executive Vice President [removed: –] [added: -] Operations [added: Rebecca B. Gregory* Vice President and Chief of Staff | |] Jennifer L. Hamann Executive Vice President and Chief Financial Officer [removed: | |] Rahul Jalali [removed: Senior] [added: Executive] Vice President [removed: – Information Technologies] and Chief Information Officer Michael V. Miller Vice President and Treasurer [removed: Scott D. Moore Senior Vice President – Corporate Relations and Chief Administrative Officer Clark J. Ponthier Senior Vice President – Supply Chain and Continuous Improvement | |] Craig V. Richardson Executive Vice President, Chief Legal Officer, and Corporate Secretary [added: | |] Kenny G. [removed: Rocker] [added: Rocker*] Executive Vice President [removed: –] [added: -] Marketing and Sales Todd M. Rynaski Senior Vice President and Chief Accounting, Risk, and Compliance Officer Elizabeth F. Whited [removed: Executive Vice] President [removed: – Sustainability and Strategy] |
| Item 1C. | [Cybersecurity](#Cybersecurity) | [16](#Cybersecurity) |
As Union Pacific shareholders, we own a piece of history.
Over the course of 161 years, our Company is built to handle inevitable changes and challenges of business cycles while seeking ways to innovate and grow.
2023 was no different.
This year, I assumed the role of Chief Executive Officer, and Lance Fritz retired after a distinguished career.
At that time, we also split the roles of Chairman and CEO and Mike McCarthy, was named Chairman of the Board of Directors.
The transition was seamless, a credit to the Board, Lance, and the management team.
Since becoming CEO, I have focused the team on a multi-year strategy of “Safety + Service & Operational Excellence = Growth.” Safety must always be our first area of focus, returning everyone home safely each day.
Service is all about delivering what we sold our customers, committing to what we can do and doing it with excellence.
Operational Excellence is about operating efficiently and productively while maintaining a buffer to handle ups and downs of railroading.
In the second half of 2023, we achieved great momentum as the team united to deliver a shared strategy.
Our fourth quarter operating metrics were the best of the year.
We exited the year with a stronger service product and fluid network.
Our Fourth Quarter financial results also demonstrated momentum as we achieved sequential quarterly margin improvement.
For 2023, we reported earnings per diluted share of $10.45, a 7% decrease versus 2022, reflecting 1% lower volumes and an operating ratio increase of 220 basis points.
To support our service product and growth, we invested $3.7 billion back into our network.
Soft consumer markets, continued inflationary pressures, and new labor agreements all impacted financial results.
As we turn the page to 2024, we are looking at the opportunities ahead.
The entire Union Pacific team is focused on being the industry’s best in safety, service, and operational excellence.
That strategy leads to long-term growth and provides you with industry-leading returns on your investment.
It’s how we win.
We understand that we hold the keys to an iconic company that helped Build America.
We are propelled by that history and recognize we have an important responsibility to deliver for our stakeholders.
We are grateful for this opportunity and thank you for your ownership of Union Pacific
| *For Union Pacific Railroad Company only. | | | | |
| 2022 was a foundational year for Union Pacific, building and executing on our long-term growth strategy. From numerous customer wins, to preparing for and onboarding a large intermodal customer, to strategic investments in our intermodal network and transload business, we took action to create long-term value. Those successes, however, were met with some significant short-term barriers – continued global supply chain disruptions, an elevated inflationary environment, record fuel prices, challenging labor markets, and an extended labor negotiation. All of those factors had a real impact on our ability to deliver a consistent and reliable service product to our customers in 2022. They also contributed to uneven financial results for the year. In 2022, we reported record earnings per share of $11.21, a 13% increase versus 2021. Total volumes increased 2% versus 2021, driven by strength in industrial and bulk markets offsetting continued supply chain challenges in our premium markets. Our operating ratio was a 60.1%, a 290-basis point deterioration versus 2021 driven by inflation, operational inefficiency, and higher fuel prices. For the full year, our average fuel price per gallon increased 64%. Also notable, was a $92 million one-time charge recorded in the third quarter for new labor agreements. | 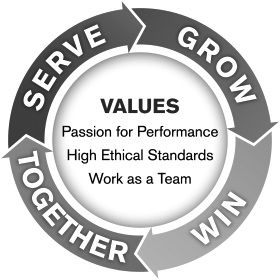 |
Success at Union Pacific begins with safety.
In 2022, we made progress on our personal injury safety metrics, improving 18% to a five-year low and lead the industry in employee safety.
We will build upon this improvement by enhancing training programs and solidifying our safety culture through ownership and personal accountability on the path to achieving our goal of world-class safety performance.
We need to expand our progress from personal injuries to derailments, where we have opportunity for improvement.
The ultimate goal remains returning each employee home safely at the end of the day.
In 2021, we rolled out a strategic plan we call, “Serve, Grow, Win – Together.” And over the past two years, we have been executing on that long-term strategy.
While our 2022 progress was mixed, we advanced our position towards long-term sustainable growth through targeted capital investments, emissions reduction programs, and by leveraging technology to improve our customer's experience.
Everything we do starts with Serve and delivering customer-centered operational excellence.
In 2022, our service product did not meet expectations.
Constrained crew bases in critical locations, elevated freight car inventory levels, and continued supply chain disruptions all played a role and impacted our ability to support customers and their needs.
In 2022, freight car velocity deteriorated 6% versus 2021, lowering trip plan compliance for intermodal 6 points and manifest/automotive 4 points.
Similarly, our efficiency measures were impacted as locomotive productivity declined 6% and workforce productivity and train length were flat.
To address constrained crew bases, we hired and trained over 1,300 new transportation employees in 2022 and have almost 600 more in the training pipeline as we enter 2023.
We also amplified our customer communications to provide clear expectations and leveraged continuous improvement efforts to address discrete service issues.
A key long-term initiative for Union Pacific is to reduce our carbon footprint for the benefit of all stakeholders.
For the fourth consecutive year, we achieved a best-ever fuel consumption rate, improving 1% versus 2021.
In addition, we increased our biodiesel blend to over 4.5%, on track toward our 2030 target of 20%.
These efforts helped our customers eliminate over 23 million metric tons of greenhouse gas emissions by choosing Union Pacific versus truck.
We continue to make significant investments in our infrastructure to support our service product.
In 2022, our capital program of approximately $3.4 billion included completing 24 siding projects, finishing the Twin Cities, MN, intermodal terminal, further expanding the West Colton, CA, intermodal terminal, modernizing over 130 locomotives, and hardening our infrastructure.
These investments support the next tenet of our strategy – Grow.
We have the best rail franchise in North America.
Our growth is powered by providing products and services that meet our customers’ needs.
This includes providing new services for our customers and expanding our reach through new transload facilities and intermodal terminals, which our team translated into new business wins in 2022.
And those business development wins will provide a tailwind in 2023 as we navigate an uncertain economy.
Growth is also dependent on a customer experience that constantly improves and evolves.
Technology plays a key role.
We’re integrating deeper in our customers’ systems and supply chains by being the industry leader in providing application programming interfaces (API), with over 70 services available being called on over 600,000 times a day.
Successful execution of our plans to “Serve” and “Grow” leads to Win.
For our shareholders, winning means generating strong cash returns.
In 2022, we paid dividends of $3.2 billion, which included a 10% dividend increase in the second quarter.
In addition, we repurchased 27 million Union Pacific shares, decreasing our full-year average share count 5%.
Combining dividends and share repurchases, Union Pacific returned $9.4 billion to our shareholders in 2022.
“Winning” extends to all UP’s stakeholders, and the value we create for each of them, which is the final piece of our strategy – Together.
We continue to evolve our comprehensive approach to Environmental, Social, and Governance issues as laid out in “Building a Sustainable Future 2030”.
Ultimately, we demonstrate our commitment to this through actions.
In 2022, we announced our plans to purchase battery electric locomotives for use in yard operations, executed a three-year deal to modernize 600 additional locomotives starting in 2023, issued $600 million in green bonds, and became the first U.S. railroad to formally support the Task Force on Climate-related Financial Disclosures (TCFD).
Late in the year we were added to the Dow Jones Sustainability Index and included in the JUST Capital 100.
Our momentum on sustainability is real and demonstrates our position as the rail leader in the space.
An excerpt. Shown here: all 37 rewritten, all 25 added and 40 of 47 removed. The counts are complete. For every sentence, read Cover and table of contents in the FY2023 filing and the FY2022 filing.
Item 1C. Cybersecurity
0 rewritten, 46 added, 0 removed, 0 unchanged
New section this year
Read the full itemFY2023 item · filed February 9, 2024
Risk Management and Strategy
The Company is subject to cybersecurity threats that could have a material adverse impact on our results of operations, financial condition, and liquidity.
See also our discussion in the Risk Factors in Item _1A_ of this report.
As a component of our Company-wide enterprise risk management framework, we implemented a cybersecurity program whose objective is to assess, identify, and manage risks from cybersecurity threats that _may_ result in adverse effects on the confidentiality, integrity, and availability of the electronic information systems that we own.
We regularly perform internal security assessments, engage _third_\-party consultants to conduct external security assessments, and participate in, conduct, and/or administer exercises, drills, and recovery tests as part of this program.
We also maintain training programs and policies and procedures designed to safeguard employee handling and use of data, internet usage, controlled access measures, and physical protections.
We consult with industry groups, monitor threat intelligence reports, and communicate with various government agencies in an effort to stay up-to-date on changes in the cybersecurity threat landscape.
This program, in addition to addressing our own information systems, is also designed to oversee, identify, and reduce the potential impact of a security incident at a _third_\-party service provider or that otherwise impacts _third_\-party technology and systems we use.
Internal Cybersecurity Team
The Company’s internal information security organization (Internal Cybersecurity Team), led by our Executive Vice President and Chief Information Officer (CIO) as well as the Assistant Vice President and Chief Information Security Officer (CISO), is responsible for coordinating all aspects of the Company’s electronic information security systems, including prevention, detection, mitigation, and remediation of cybersecurity incidents, as well as implementing, monitoring, and maintaining our enterprise-wide security strategy, standards, architecture, policies, and processes.
Our CIO reports directly to our Chief Executive Officer, our CISO reports to our CIO, and reporting to our CISO are our Deputy Chief Information Security Officer (Deputy CISO) and other experienced information security personnel responsible for various parts of our business.
In addition to our internal cybersecurity capabilities, we also periodically engage assessors, consultants, auditors, and other _third_ parties to assist with assessing, identifying, and managing cybersecurity risks.
When the Company learns of a cybersecurity incident at a _third_\-party service provider, the Company’s respective department contacts maintain communication with the _third_\-party service provider and communicate any cybersecurity incidents to the CISO.
Security Policy and Requirements
As part of the Company’s Crisis Management Plan, the Company's cybersecurity Incident Response Plan (the IRP) provides a framework for responding to cybersecurity incidents.
The IRP sets out a coordinated approach to discovering, investigating, containing, tracking, mitigating, and remediating cybersecurity incidents, including a framework for elevating and reporting findings and keeping senior management and other key stakeholders informed and involved, based on assessments regarding the scope or significance of incidents.
The IRP applies to the Company’s extended computing environment, including electronic information resources that are owned or used by the Company and are routinely relied on to support our operations.
The Internal Cybersecurity Team has robust processes and redundancies in place designed with the objective of deterring, detecting, mitigating, and responding to potential cybersecurity threats, which includes a vulnerability assessment, prioritization, and remediation program.
The Internal Cybersecurity Team also performs regular system penetration testing to validate our security controls and assess our infrastructure and applications.
All management employees take mandatory periodic security awareness training on the Company’s data security policies and procedures, which is supplemented by Company-wide testing initiatives, including periodic phishing tests.
Additionally, in _2023,_ our Board of Directors and certain management employees participated in a tabletop exercise to simulate a response to a cybersecurity incident, and our Internal Cybersecurity Team incorporated the findings from this exercise into our processes.
_16_
Our information security program is designed to align our defenses and resources to identify, assess, and address more likely and more damaging cyber events, to provide support for our organizational mission and operational objectives, and to position us to deter, detect, mitigate, and respond to a wide variety of potential attacks in a timely fashion.
Our information security program employs quantitative and qualitative approaches to evaluate the effectiveness of controls and assess the resiliency of critical computing resources.
This data is combined with knowledge of common attack techniques to assess the likelihood of components being compromised and assess potential financial implications under different scenarios.
The results are used to help identify potentially material risks and provide insights which are taken into account when prioritizing our security initiatives.
Material Cybersecurity Risks, Threats, and Incidents
Due to the evolving nature of cybersecurity threats, it has and will continue to be difficult to prevent, detect, mitigate, and remediate cybersecurity incidents.
While we are _not_ aware of having experienced any material effects or reasonably likely material effects on our Company, its business strategy, results of operations, or financial condition resulting from cybersecurity threats or incidents to date, as a critical infrastructure provider, we _may_ be a target of well-funded and sophisticated adverse actors.
There can be _no_ guarantee that we will _not_ be the subject of future risks or incidents that have such an effect, or that we are _not_ currently the subject of an undetected risk or incident that _may_ have such an effect.
We also rely on information technology and _third_\-party vendors to support our operations, including our secure processing of personal, confidential, sensitive, proprietary, and other types of information.
Despite ongoing efforts to continue improvement of our and our vendors’ ability to protect against cyber incidents, we _may_ _not_ be able to protect all of the information systems we use.
Incidents _may_ lead to reputational harm, revenue and client loss, legal actions, or statutory penalties, among other consequences.
For a more detailed discussion of these risks, see our discussion in the Risk Factors in Item _1A_ of this report.
Governance
The Board of Directors has delegated primary oversight of the Company’s cybersecurity risk to the Audit Committee, which receives updates on cybersecurity risks and incidents at each regularly scheduled Audit Committee meeting from the CIO, CISO, and other members of management, as needed.
When making decisions regarding director appointments and committee assignments, the Board of Directors takes into consideration the cybersecurity experience of directors and director candidates and strives to maintain cybersecurity expertise on the Board of Directors and Audit Committee.
We have protocols by which certain cybersecurity incidents are reported to the Audit Committee and Board of Directors.
At the management level, our CIO, CISO, and Deputy CISO, each of whom has extensive cybersecurity knowledge and skills gained from over 27 years, 28 years, and 19 years of relevant work experience, respectively, head the Internal Cybersecurity Team that is responsible for implementing and maintaining cybersecurity and data protection practices across our business, with our CIO reporting directly to our Chief Executive Officer.
In _2023,_ our CIO was appointed to serve as a member of the U.S. Cybersecurity Advisory Committee (CSAC) of the Cybersecurity and Infrastructure Security Agency (CISA), which provides recommendations to CISA on a range of cybersecurity issues, including corporate cyber responsibility, technology product safety, and efforts to raise the baseline of cybersecurity practices for a variety of entities to enhance the United States’ cyber defense.
An excerpt. Shown here: all 0 rewritten, 40 of 46 added and all 0 removed. The counts are complete. For every sentence, read Item 1C. Cybersecurity in the FY2023 filing.
Item 2. Properties
20 rewritten, 19 added, 19 removed, 38 unchanged
Read the full itemFY2023 item · filed February 9, 2024FY2022 item · filed February 10, 2023
[removed: 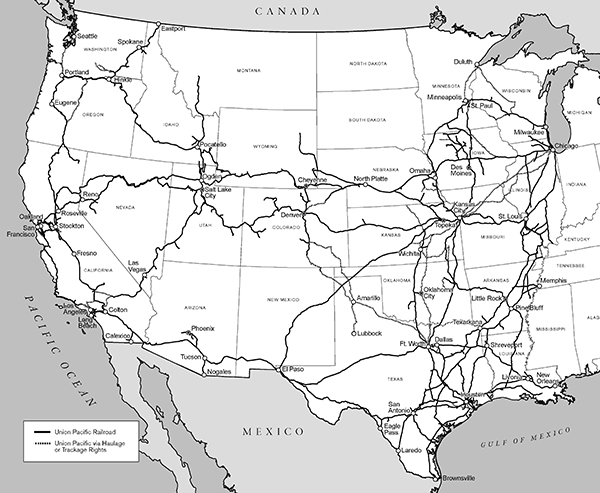][added: 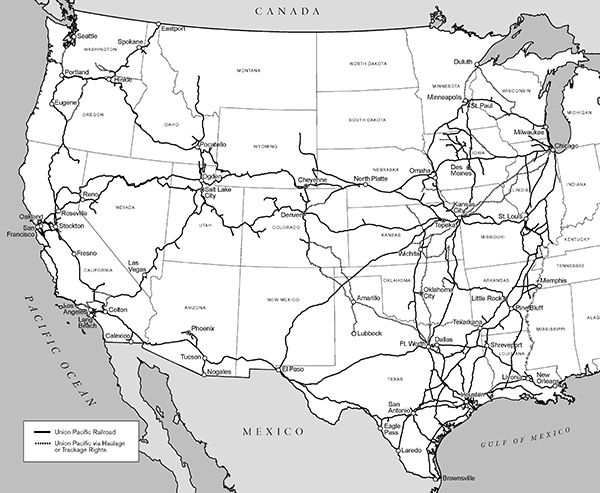]
Our rail network includes [removed: 32,534] [added: 32,693] route miles.
We own [removed: 26,121] [added: 26,110] miles and operate on the remainder pursuant to trackage rights or leases.
| _As of December 31,_ | | | [removed: _2022_] [added: _2023_] | | | | [removed: _2021_] [added: _2022_] | |
| Route | | | [removed: 32,534] [added: 32,693] | | | | [removed: 32,452] [added: 32,534] | |
| Other main line | | | [removed: 7,113] [added: 7,117] | | | | [removed: 7,093] [added: 7,113] | |
| Passing lines and turnouts | | | [removed: 3,454] [added: 3,466] | | | | [removed: 3,412] [added: 3,454] | |
| Switching and classification yard lines | | | [removed: 8,853] [added: 8,852] | | | | [removed: 8,887] [added: 8,853] | |
| Total miles | | | [removed: 51,954] [added: 52,128] | | | | [removed: 51,844] [added: 51,954] | |
| [removed: West Colton,] [added: Roseville,] California | Lathrop, California |
As of December 31, [removed: 2022,] [added: 2023,] we owned or leased the following units of equipment:
| Total highway revenue equipment | | | [removed: 77,883] [added: 78,074] | | | | [removed: 20,972] [added: 18,250] | | | | [removed: 98,855] [added: 96,324] | | | | N/A | |
As some of these factors are difficult to assess or can change rapidly, we maintain a [removed: surge fleet] [added: buffer] to remain agile.
Locomotive and freight car in service utilization percentages for the year ended December 31, [removed: 2022,] [added: 2023,] were [removed: 70%] [added: 69%] and [removed: 78%,] [added: 74%,] respectively.
These investments enhance safety, support the transportation needs of our customers, improve our operational efficiency, and support emission reduction [removed: initiatives outlined in our Climate Action Plan.][added: initiatives.]
[removed: 2022] [added: 2023] Capital Program – During [removed: 2022,] [added: 2023,] our capital program totaled approximately [removed: $3.4] [added: $3.7] billion.
(See the cash capital investments table in Management’s Discussion and Analysis of Financial Condition and Results of Operations [removed: –] [added: -] Liquidity and Capital Resources, Item 7, of this report.)
[removed: 2023] [added: 2024] Capital Plan – In [removed: 2023,] [added: 2024,] we expect our capital plan to be approximately [removed: $3.6] [added: $3.4] billion, [removed: up 6%] [added: down 8%] from [removed: 2022.][added: 2023.]
(See further discussion of our [removed: 2023] [added: 2024] capital plan in Management’s Discussion and Analysis of Financial Condition and Results of Operations [removed: –] [added: -] Liquidity and Capital Resources, Item 7, of this report.)
(See discussion within this report of environmental issues in Business [removed: –] [added: -] Governmental and Environmental Regulation, Item 1; Management’s Discussion and Analysis of Financial Condition and Results of Operations [removed: –] [added: -] Critical Accounting Estimates [removed: –] [added: -] Environmental, Item 7; and Note 17 to the Financial Statements and Supplementary Data, Item 8.)
| Livonia, Louisiana | ICTF (Long Beach), California |
| Fort Worth, Texas | Mesquite, Texas |
| Houston, Texas | City of Industry, California |
| West Colton, California | Salt Lake City, Utah |
| Multiple purpose | | | 5,971 | | | | 1,037 | | | | 7,008 | | | | 24.3 | |
| Switching | | | 132 | | | | \- | | | | 132 | | | | 43.5 | |
| Other | | | 14 | | | | \- | | | | 14 | | | | 51.2 | |
| Total locomotives | | | 6,117 | | | | 1,037 | | | | 7,154 | | | | N/A | |
| Covered hoppers | | | 13,761 | | | | 9,474 | | | | 23,235 | | | | 21.3 | |
| Open hoppers | | | 4,846 | | | | 775 | | | | 5,621 | | | | 36.4 | |
| Gondolas | | | 6,396 | | | | 4,492 | | | | 10,888 | | | | 23.1 | |
| Boxcars | | | 3,389 | | | | 7,572 | | | | 10,961 | | | | 32.7 | |
| Refrigerated cars | | | 2,444 | | | | 1,199 | | | | 3,643 | | | | 21.8 | |
| Flat cars | | | 2,216 | | | | 2,254 | | | | 4,470 | | | | 32.6 | |
| Other | | | \- | | | | 371 | | | | 371 | | | | 35.2 | |
| Total freight cars | | | 33,052 | | | | 26,137 | | | | 59,189 | | | | N/A | |
| Containers | | | 47,439 | | | | 545 | | | | 47,984 | | | | 12.2 | |
| Chassis | | | 30,635 | | | | 17,705 | | | | 48,340 | | | | 13.2 | |
Equipment Encumbrances – See Note 14 and 16 to the Financial Statements and Supplementary Data, Item 8.
| Livonia, Louisiana | Mesquite, Texas |
| Fort Worth, Texas | LATC (Los Angeles), California |
| Houston, Texas | ICTF (Los Angeles), California |
| Roseville, California | Marion, Arkansas |
| Multiple purpose | | | 6,083 | | | | 1,038 | | | | 7,121 | | | | 23.4 | |
| Switching | | | 149 | | | | \- | | | | 149 | | | | 42.7 | |
| Other | | | 15 | | | | 53 | | | | 68 | | | | 42.5 | |
| Total locomotives | | | 6,247 | | | | 1,091 | | | | 7,338 | | | | N/A | |
| Covered hoppers | | | 13,360 | | | | 9,714 | | | | 23,074 | | | | 22.1 | |
| Open hoppers | | | 4,926 | | | | 779 | | | | 5,705 | | | | 35.8 | |
| Gondolas | | | 6,188 | | | | 4,060 | | | | 10,248 | | | | 24.2 | |
| Boxcars | | | 2,598 | | | | 6,877 | | | | 9,475 | | | | 38.2 | |
| Refrigerated cars | | | 2,496 | | | | 1,371 | | | | 3,867 | | | | 22.4 | |
| Flat cars | | | 2,248 | | | | 1,450 | | | | 3,698 | | | | 32.4 | |
| Other | | | \- | | | | 312 | | | | 312 | | | | 31.4 | |
| Total freight cars | | | 31,816 | | | | 24,563 | | | | 56,379 | | | | N/A | |
| Containers | | | 48,180 | | | | 1,356 | | | | 49,536 | | | | 11.4 | |
| Chassis | | | 29,703 | | | | 19,616 | | | | 49,319 | | | | 12.0 | |
Equipment Encumbrances – Equipment with a carrying value of approximately $903 million and $1.2 billion at December 31, 2022 and 2021, respectively, served as collateral for finance leases and other types of equipment obligations in accordance with the secured financing arrangements utilized to acquire or refinance such railroad equipment.
Item 4. Mine Safety Disclosures
13 rewritten, 3 added, 1 removed, 9 unchanged
Read the full itemFY2023 item · filed February 9, 2024FY2022 item · filed February 10, 2023
The following table sets forth certain information current as of February [removed: 10, 2023,] [added: 9, 2024,] relating to the executive officers.
| [removed: Lance M. Fritz] [added: Jennifer L. Hamann] | [removed: Chairman, President,] [added: Executive Vice President] and Chief [removed: Executive] [added: Financial] Officer of UPC and the Railroad | [removed: 60] [added: 56] | [removed: Current Position] [added: \[3\]] |
| [removed: Jennifer L. Hamann] [added: Rahul Jalali] | Executive Vice President and Chief [removed: Financial] [added: Information] Officer of UPC and the Railroad | [removed: 55] [added: 50] | [removed: \[1\]] [added: \[5\]] |
| Craig V. Richardson | Executive Vice President, Chief Legal Officer, and Corporate Secretary of UPC and the Railroad | [removed: 61] [added: 62] | [removed: \[2\]] [added: \[6\]] |
| Kenny G. Rocker | Executive Vice President [removed: –] [added: -] Marketing and Sales of the Railroad | [removed: 51] [added: 52] | [removed: \[3\]] [added: Current Position] |
| Todd M. Rynaski | Senior Vice President and Chief Accounting, Risk, and Compliance Officer of UPC and the Railroad | [removed: 52] [added: 53] | [removed: \[4\]] [added: \[7\]] |
| Eric J. Gehringer | Executive Vice President [removed: –] [added: -] Operations of the Railroad | [removed: 43] [added: 44] | [removed: \[5\]] [added: \[4\]] |
| Elizabeth F. Whited | [removed: Executive Vice] President [removed: – Sustainability and Strategy] of UPC and the Railroad | [removed: 57] [added: 58] | [removed: \[6\]] [added: \[2\]] |
| [removed: _\[1\]_] [added: _\[3\]_] | _Ms. Hamann was elected Executive Vice President and Chief Financial Officer of UPC and the Railroad effective January 1, 2020. She previously served as Senior Vice [removed: President_ – _Finance] [added: President - Finance] (April [removed: 2019_ – _December] [added: 2019 - December] 2019) and Vice [removed: President_ – _Planning] [added: President - Planning] & Analysis (October [removed: 2017_ – _March 2019)__._] [added: 2017 - March 2019)._] |
| [removed: _\[2\]_] [added: _\[6\]_] | _Mr. Richardson was elected Executive Vice President, Chief Legal Officer, and Corporate Secretary of UPC and the Railroad effective December 8, 2020. He most recently served as [added: Interim Executive] Vice [removed: President_ – _Commercial] [added: President, Chief Legal Officer,] and [added: Corporate Secretary of UPC and the Railroad (September 2020 - November 2020) and Vice President - Commercial and] Regulatory Law [removed: since 2015._] [added: (July 2018 - August 2020)._] |
| [removed: _\[4\]_] [added: _\[7\]_] | _Mr. Rynaski was elected Senior Vice President and Chief Accounting, Risk, and Compliance Officer of UPC and the Railroad effective July 1, 2022. Mr. Rynaski previously served as Vice President and Controller (September [removed: 2015_ – _June] [added: 2015 - June] 2022)._ |
| [removed: _\[5\]_] [added: _\[4\]_] | _Mr. Gehringer was elected Executive Vice [removed: President_ – _Operations] [added: President - Operations] of the Railroad effective January 1, 2021. Mr. Gehringer previously served as Senior Vice [removed: President_ – _Transportation] [added: President - Transportation] (July [removed: 2020_ – _December] [added: 2020 - December] 2020), Vice [removed: President_ – _Mechanical] [added: President - Mechanical] and Engineering (January [removed: 2020_ – _July 2020), Vice President_ – _Engineering (March 2018_ – _January] [added: 2020 - July] 2020), and [removed: Assistant] Vice [removed: President_ – _Engineering (September 2016_ – _March 2018)__._] [added: President - Engineering (March 2018 - January 2020)._] |
| [removed: _\[6\]_] [added: _\[2\]_] | _Ms. Whited was elected [added: President of UPC and the Railroad effective August 14, 2023. Ms. Whited most recently served as] Executive Vice [removed: President_ – _Sustainability] [added: President - Sustainability] and Strategy of UPC and the Railroad [removed: effective February 3, 2022.] [added: (February 2022 - August 2023).] She previously served as Executive Vice President and Chief Human Resources Officer (August [removed: 2018_ – _February 2022) and Executive Vice President and Chief Marketing Officer (December 2016_ – _August 2018)__._] [added: 2018 - February 2022)._] |
| V. James Vena | Chief Executive Officer of UPC and the Railroad | 65 | \[1\] |
| _\[1\]_ | _Mr. Vena was elected Chief Executive Officer of UPC and the Railroad effective August 14, 2023. He previously served as a Senior Advisor to the Chairman of UPC (January 2021 - June 2021) and Chief Operating Officer (January 2019 - December 2020)._ |
| _\[5\]_ | _Mr. Jalali was elected Executive Vice President and Chief Information Officer of UPC and the Railroad effective June 1, 2023. Mr. Jalali most recently served as Senior Vice President and Chief Information Officer (November 2020 - May 2023)._ |
| _\[3\]_ | _Mr. Rocker was elected Executive Vice President_ – _Marketing and Sales of the Railroad effective August 15, 2018. Mr. Rocker previously served at the Railroad as Vice President_ – _Marketing and Sales_ – _Industrial team (October 2016_ – _August 2018)._ |
Item 5. Market for the Registrant’s Common Equity, Related Stockholder Matters, and Issuer Purchases of Equity Securities
8 rewritten, 6 added, 6 removed, 7 unchanged
Read the full itemFY2023 item · filed February 9, 2024FY2022 item · filed February 10, 2023
At February [removed: 3, 2023,] [added: 2, 2024,] there were [removed: 611,872,981] [added: 609,777,914] shares of common stock outstanding and [removed: 28,959] [added: 27,949] common shareholders of record.
On that date, the closing price of the common stock on the NYSE was [removed: $210.29.][added: $248.33.]
We paid dividends to our common shareholders during each of the past [removed: 123] [added: 124] years.
The graph assumes that $100 was invested in the common stock of Union Pacific Corporation and each index on December 31, [removed: 2017,] [added: 2018,] and that all dividends were reinvested.
[removed: 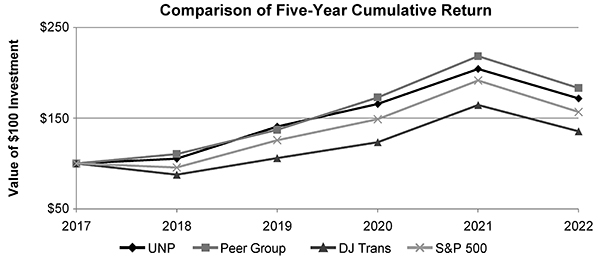][added: ]
Purchases of Equity Securities – During [removed: 2022,] [added: 2023,] we repurchased [removed: 27,374,826] [added: 3,657,484] shares of our common stock at an average price of [removed: $231.51.][added: $202.67.]
The following table presents common stock repurchases during each month for the fourth quarter of [removed: 2022:][added: 2023:]
| _\[a\]_ | _Total number of shares purchased during the quarter includes approximately [removed: 589] [added: 6,808] shares delivered or attested to UPC by employees to pay stock option exercise prices, satisfy excess tax withholding obligations for stock option exercises or vesting of retention units, and pay withholding obligations for vesting of retention shares._ |
| 1 Year (2023) | | | 21.5 | % | | | 6.9 | % | | | 20.4 | % | | | 26.3 | % |
| 3 Year (2021 - 2023) | | | 26.0 | % | | | 12.9 | % | | | 32.1 | % | | | 33.0 | % |
| Oct. 1 through Oct. 31 | | | 166 | | | $ | 222.76 | | | | \- | | | | 80,392,027 | |
| Nov. 1 through Nov. 30 | | | 3,069 | | | | 219.57 | | | | \- | | | | 80,392,027 | |
| Dec. 1 through Dec. 31 | | | 3,573 | | | | 235.05 | | | | \- | | | | 80,392,027 | |
| Total | | | 6,808 | | | $ | 227.77 | | | | \- | | | | N/A | |
| 1 Year (2022) | | | (15.9 | )% | | | (16.1 | )% | | | (17.6 | )% | | | (18.1 | )% |
| 3 Year (2020 - 2022) | | | 22.0 | | | | 33.6 | | | | 27.9 | | | | 24.7 | |
| Oct. 1 through Oct. 31 | | | 1,985,868 | | | $ | 196.40 | | | | 1,985,704 | | | | 85,423,274 | |
| Nov. 1 through Nov. 30 | | | 1,235,296 | | | | 206.48 | | | | 1,234,889 | | | | 84,188,385 | |
| Dec. 1 through Dec. 31 | | | 281,092 | | | | 213.45 | | | | 281,074 | | | | 83,907,311 | |
| Total | | | 3,502,256 | | | $ | 201.32 | | | | 3,501,667 | | | | N/A | |
Item 8. Financial Statements and Supplementary Data
427 rewritten, 76 added, 98 removed, 567 unchanged
Read the full itemFY2023 item · filed February 9, 2024FY2022 item · filed February 10, 2023
| [Report of Independent Registered Public Accounting Firm (PCAOB ID No. 34)](#ind_report) | [removed: [42](#ind_report)] [added: [41](#ind_report)] |
| [For the Years Ended December 31, [added: 2023,] 2022, [removed: 2021,] and [removed: 2020](#income)] [added: 2021](#income)] | [removed: [44](#income)] [added: [43](#income)] |
| [For the Years Ended December 31, [added: 2023,] 2022, [removed: 2021,] and [removed: 2020](#comp_income)] [added: 2021](#comp_income)] | [removed: [44](#comp_income)] [added: [43](#comp_income)] |
| [At December 31, [removed: 2022] [added: 2023] and [removed: 2021](#bal_sheets)] [added: 2022](#bal_sheets)] | [removed: [45](#bal_sheets)] [added: [44](#bal_sheets)] |
| [For the Years Ended December 31, [added: 2023,] 2022, [removed: 2021,] and [removed: 2020](#cf)] [added: 2021](#cf)] | [removed: [46](#cf)] [added: [45](#cf)] |
| [For the Years Ended December 31, [added: 2023,] 2022, [removed: 2021,] and [removed: 2020](#equity)] [added: 2021](#equity)] | [removed: [47](#equity)] [added: [46](#equity)] |
| [Notes to the Consolidated Financial Statements](#notes) | [removed: [48](#notes)] [added: [47](#notes)] |
We have audited the accompanying consolidated statements of financial position of Union Pacific Corporation and Subsidiary Companies (the "Corporation") as of December 31, [removed: 2022] [added: 2023] and [removed: 2021,] [added: 2022,] the related consolidated statements of income, comprehensive income, changes in common shareholders’ equity, and cash flows for each of the three years in the period ended December 31, [removed: 2022,] [added: 2023,] and the related notes (collectively referred to as the "financial statements").
In our opinion, the financial statements present fairly, in all material respects, the financial position of the Corporation as of December 31, [removed: 2022] [added: 2023] and [removed: 2021,] [added: 2022,] and the results of its operations and its cash flows for each of the three years in the period ended December 31, [removed: 2022,] [added: 2023,] in conformity with accounting principles generally accepted in the United States of America.
We have also audited, in accordance with the standards of the Public Company Accounting Oversight Board (United States) (PCAOB), the Corporation's internal control over financial reporting as of December 31, [removed: 2022,] [added: 2023,] based on criteria established in _Internal Control_ — _Integrated Framework (2013)_ issued by the Committee of Sponsoring Organizations of the Treadway Commission and our report dated February [removed: 10, 2023,] [added: 9, 2024,] expressed an unqualified opinion on the Corporation's internal control over financial reporting.
We identified the capitalization of property [added: during 2023] as a critical audit matter because of the significant judgment exercised by management in determining whether costs meet the criteria for capitalization.
| _Millions, Except Per Share Amounts, for the Years Ended December 31,_ | | [removed: __2022__] [added: __2023__] | | | | [removed: __2021__] [added: __2022__] | | | | [removed: __2020__] [added: __2021__] | | |
| Freight revenues | | $ | [removed: 23,159] [added: 22,571] | | | $ | [removed: 20,244] [added: 23,159] | | | $ | [removed: 18,251] [added: 20,244] | |
| Other revenues | | | [removed: 1,716] [added: 1,548] | | | | [removed: 1,560] [added: 1,716] | | | | [removed: 1,282] [added: 1,560] | |
| Total operating revenues | | | [removed: 24,875] [added: 24,119] | | | | [removed: 21,804] [added: 24,875] | | | | [removed: 19,533] [added: 21,804] | |
| Compensation and benefits | | | [removed: 4,645] [added: 4,818] | | | | [removed: 4,158] [added: 4,645] | | | | [removed: 3,993] [added: 4,158] | |
| Fuel | | | [removed: 3,439] [added: 2,891] | | | | [removed: 2,049] [added: 3,439] | | | | [removed: 1,314] [added: 2,049] | |
| Purchased services and materials | | | [removed: 2,442] [added: 2,616] | | | | [removed: 2,016] [added: 2,442] | | | | [removed: 1,962] [added: 2,016] | |
| Depreciation | | | [removed: 2,246] [added: 2,318] | | | | [removed: 2,208] [added: 2,246] | | | | [removed: 2,210] [added: 2,208] | |
| Equipment and other rents | | | [removed: 898] [added: 947] | | | | [removed: 859] [added: 898] | | | | [removed: 875] [added: 859] | |
| Other | | | [removed: 1,288] [added: 1,447] | | | | [removed: 1,176] [added: 1,288] | | | | [removed: 1,345] [added: 1,176] | |
| Total operating expenses | | | [removed: 14,958] [added: 15,037] | | | | [removed: 12,466] [added: 14,958] | | | | [removed: 11,699] [added: 12,466] | |
| Operating income | | | [removed: 9,917] [added: 9,082] | | | | [removed: 9,338] [added: 9,917] | | | | [removed: 7,834] [added: 9,338] | |
| Other income, net (Note 6) | | | [removed: 426] [added: 491] | | | | [removed: 297] [added: 426] | | | | [removed: 287] [added: 297] | |
| Interest expense | | | [removed: (1,271] [added: (1,340] | ) | | | [removed: (1,157] [added: (1,271] | ) | | | [removed: (1,141] [added: (1,157] | ) |
| Income before income taxes | | | [removed: 9,072] [added: 8,233] | | | | [removed: 8,478] [added: 9,072] | | | | [removed: 6,980] [added: 8,478] | |
| Income tax expense (Note 7) | | | [removed: (2,074] [added: (1,854] | ) | | | [removed: (1,955] [added: (2,074] | ) | | | [removed: (1,631] [added: (1,955] | ) |
| Net income | | $ | [removed: 6,998] [added: 6,379] | | | $ | [removed: 6,523] [added: 6,998] | | | $ | [removed: 5,349] [added: 6,523] | |
| Earnings per share - basic | | $ | [removed: 11.24] [added: 10.47] | | | $ | [removed: 9.98] [added: 11.24] | | | $ | [removed: 7.90] [added: 9.98] | |
| Earnings per share - diluted | | $ | [removed: 11.21] [added: 10.45] | | | $ | [removed: 9.95] [added: 11.21] | | | $ | [removed: 7.88] [added: 9.95] | |
| Weighted average number of shares - basic | | | [removed: 622.7] [added: 609.2] | | | | [removed: 653.8] [added: 622.7] | | | | [removed: 677.3] [added: 653.8] | |
| Weighted average number of shares - diluted | | | [removed: 624.0] [added: 610.2] | | | | [removed: 655.4] [added: 624.0] | | | | [removed: 679.1] [added: 655.4] | |
| _Millions, for the Years Ended December 31,_ | | [removed: __2022__] [added: __2023__] | | | | [removed: __2021__] [added: __2022__] | | | | [removed: __2020__] [added: __2021__] | | |
| Net income | | $ | [removed: 6,998] [added: 6,379] | | | $ | [removed: 6,523] [added: 6,998] | | | $ | [removed: 5,349] [added: 6,523] | |
| Defined benefit plans | | | [removed: 280] [added: (106] | [added: )] | | | [removed: 723] [added: 280] | | | | [removed: (231] [added: 723] | [removed: )] |
| Foreign currency translation | | | [removed: 52] [added: 58] | | | | [removed: (44] [added: 52] | [removed: )] | | | [removed: (6] [added: (44] | ) |
| Total other comprehensive income/(loss) \[a\] | | | [removed: 332] [added: (32] | [added: )] | | | [removed: 679] [added: 332] | | | | [removed: (237] [added: 679] | [removed: )] |
| Comprehensive income | | $ | [removed: 7,330] [added: 6,347] | | | $ | [removed: 7,202] [added: 7,330] | | | $ | [removed: 5,112] [added: 7,202] | |
| _\[a\]_ | _Net of deferred taxes of [removed: ($92)] [added: $31] million, [removed: ($237)] [added: ($92)] million, and [removed: $75] [added: ($237)] million during [added: 2023,] 2022, [removed: 2021,] and [removed: 2020,] [added: 2021,] respectively._ |
| _Millions, Except Share and Per Share Amounts as of December 31,_ | | [removed: __2022__] [added: __2023__] | | | | [removed: __2021__] [added: __2022__] | | |
Capitalized costs to Properties, net during 2023 were $3.8 billion.
February 9, 2024
| Unrealized gain on derivative instruments | | | 16 | | | | \- | | | | \- | |
| Common shares repurchased but not yet paid | | | 5 | | | | \- | | | | \- | |
| Net income | | | | | | | | | | | \- | | | | \- | | | | 6,379 | | | | \- | | | | \- | | | | 6,379 | |
| Balance at December 31, 2023 | | | 1,112.9 | | | | (503.2 | ) | | $ | 2,782 | | | $ | 5,193 | | | $ | 62,093 | | | $ | (54,666 | ) | | $ | (614 | ) | | $ | 14,788 | |
_47_
In _December 2023,_ the FASB issued Accounting Standards Update _No._ (ASU) _2023_\-_09,_ _Income Taxes (Topic _740_): Improvements to Income Tax Disclosures_, which requires business entities to expand their annual disclosures of the effective rate reconciliation and income taxes paid.
The ASU is effective for fiscal years beginning after _December 15, 2024,_ _may_ be adopted on a prospective or retrospective basis, and early adoption is permitted.
The Company is currently evaluating the effect that the new guidance will have on our related disclosures.
In _November 2023,_ the FASB issued ASU _2023_\-_07,_ _Segment Reporting (Topic _280_): Improvements to Reportable Segment Disclosures_, which requires business entities to enhance disclosures about significant segment expenses.
The ASU is effective for fiscal years beginning after _December 15, 2023,_ on a retrospective basis, and early adoption is permitted.
The Company is currently evaluating the effect that the new guidance will have on our related disclosures.
| Granted | | | 351 | | | | 202.81 | | | | _N/A_ | | | | _N/A_ | |
| Exercised | | | (233 | ) | | | 118.29 | | | | _N/A_ | | | | _N/A_ | |
| Outstanding at December 31, 2023 | | | 2,072 | | | $ | 180.56 | | | | 5.9 | | | $ | 135 | |
| Vested or expected to vest at December 31, 2023 | | | 2,053 | | | $ | 180.23 | | | | 5.9 | | | $ | 134 | |
| Options exercisable at December 31, 2023 | | | 1,423 | | | $ | 164.48 | | | | 4.8 | | | $ | 115 | |
| Granted | | | 297 | | | | 202.88 | |
| Vested | | | (317 | ) | | | 165.34 | |
| Forfeited | | | (53 | ) | | | 206.43 | |
| Nonvested at December 31, 2023 | | | 996 | | | $ | 207.76 | |
| Granted | | | 251 | | | | 202.81 | |
| Vested | | | (78 | ) | | | 189.29 | |
| Unearned | | | (127 | ) | | | 186.11 | |
| Forfeited | | | (23 | ) | | | 218.31 | |
| Nonvested at December 31, 2023 | | | 617 | | | $ | 204.50 | |
Actuarial losses that increase the PBO were driven by a decrease in _2023_ discount rates from 5.21% to 5.00%.
| _Percentages_ | | __2023__ | | | | __2022__ | | |
| 2023 | | $ | \- | | | $ | 32 | |
| 2024 | | $ | 230 | |
| 2025 | | | 229 | |
| 2026 | | | 229 | |
| 2027 | | | 230 | |
| 2028 | | | 231 | |
| Years 2029 - 2033 | | $ | 1,188 | |
We met our target endpoint of _25%_ equity and _75%_ debt in _2023._ The average credit rating of the debt portfolio was AA- and A+ at _December 31, 2023_ and _2022_, respectively.
| Corporate stock | | | 176 | | | | 5 | | | | \- | | | | 181 | |
The liability is based on discount rate assumptions of 4.97% and 5.23% at _December 31, 2023_ and _2022,_ respectively.
| Interest income \[a\] | | | 52 | | | | 23 | | | | 4 | |
Properties, net were $56,038 million as of December 31, 2022 and, during 2022, the Corporation’s capital investments were $3.6 billion.
February 10, 2023
| Gain on non-operating asset dispositions | | | (176 | ) | | | (98 | ) | | | (115 | ) |
| Proceeds from asset sales | | | 194 | | | | 178 | | | | 149 | |
| Maturities of short-term investments (Note 13) | | | 46 | | | | 94 | | | | 141 | |
| Purchases of short-term investments (Note 13) | | | (46 | ) | | | (70 | ) | | | (136 | ) |
| Net issued/(paid) commercial paper (Note 14) | | | (205 | ) | | | 325 | | | | (127 | ) |
| Debt exchange (Note 14) | | | \- | | | | (270 | ) | | | (328 | ) |
| Balance at January 1, 2020 | | | 1,112.0 | | | | (419.9 | ) | | $ | 2,780 | | | $ | 4,523 | | | $ | 48,605 | | | $ | (36,424 | ) | | $ | (1,356 | ) | | $ | 18,128 | |
In _November 2021,_ the FASB issued Accounting Standards Update _No._ (ASU) _2021_\-_10,_ _Government Assistance (Topic _832_): Disclosures by Business Entities about Government Assistance_, which requires business entities to provide certain disclosures when they have received government assistance and use a grant or contribution accounting model by analogy to other accounting guidance.
The ASU was effective _January 1, 2022,_ and had _no_ material impact on our consolidated financial statements and related disclosures.
In _March 2020,_ the FASB issued ASU _2020_\-_04,_ _Reference Rate Reform (Topic _848_): Facilitation of the Effects of Reference Rate Reform on Financial Reporting_, which provides optional expedients and exceptions for applying GAAP principles to contracts, hedging relationships, and other transactions that reference London Interbank Offered Rate (LIBOR) or another reference rate expected to be discontinued due to reference rate reform.
In _December_ _2022,_ the FASB issued ASU _2022_\-_06,_ _Reference Rate Reform (Topic _848_): Deferral of the Sunset Date of Topic _848,__ which extended the adoption date.
This guidance was effective beginning on _March 12, 2020,_ and can be adopted on a prospective basis _no_ later than _December 31, 2024,_ with early adoption permitted.
The Company early adopted the ASU, and it did _not_ have an impact on our consolidated financial statements.
The Union Pacific Corporation _2004_ Stock Incentive Plan (_2004_ Plan) was approved by shareholders in _April 2004._ The _2004_ Plan reserved 84,000,000 shares of our common stock for issuance, plus any shares subject to awards made under previous plans that were outstanding on _April 16, 2004,_ and became available for regrant pursuant to the terms of the _2004_ Plan.
Under the _2004_ Plan, non-qualified stock options, stock appreciation rights, retention shares, stock units, and incentive bonus awards _may_ be granted to eligible employees of the Corporation and its subsidiaries.
Non-employee directors are _not_ eligible for awards under the _2004_ Plan.
We _no_ longer grant any stock options or other stock or unit awards under this plan.
As of _December 31, 2022_, 659,135 stock options and 707,361 retention shares were outstanding under the _2021_ Plan.
| Outstanding at January 1, 2022 | | | 2,106 | | | $ | 149.84 | | | | 6.3 | | | $ | 215 | |
| Granted | | | 328 | | | | 244.35 | | | | _N/A_ | | | | _N/A_ | |
| Exercised | | | (421 | ) | | | 124.60 | | | | _N/A_ | | | | _N/A_ | |
| Vested or expected to vest at December 31, 2022 | | | 1,954 | | | $ | 169.12 | | | | 6.0 | | | $ | 85 | |
| Options exercisable at December 31, 2022 | | | 1,308 | | | $ | 144.09 | | | | 4.9 | | | $ | 82 | |
| Nonvested at January 1, 2022 | | | 1,287 | | | $ | 165.10 | |
| Granted | | | 252 | | | | 241.37 | |
| Vested | | | (410 | ) | | | 126.26 | |
| Forfeited | | | (60 | ) | | | 191.98 | |
The _February 2020_ performance stock unit grants expense recognition and basic terms were similar to the _February 2022_ grant except the relative OIG targets were a modifier as compared to companies included in the S&P _500_ Industrials Index.
The modifier can be up to +/- 25% of the award earned based on the ROIC achieved.
| Nonvested at January 1, 2022 | | | 641 | | | $ | 173.03 | |
| Granted | | | 209 | | | | 244.35 | |
| Vested | | | (56 | ) | | | 162.64 | |
| Unearned | | | (163 | ) | | | 161.57 | |
| Forfeited | | | (37 | ) | | | 211.96 | |
| 2021 | | | \- | | | | 31 | |
| 2023 | | $ | 230 | |
| 2024 | | | 228 | |
| 2025 | | | 227 | |
An excerpt. Shown here: 40 of 427 rewritten, 40 of 76 added and 40 of 98 removed. The counts are complete. For every sentence, read Item 8. Financial Statements and Supplementary Data in the FY2023 filing and the FY2022 filing.
Item 9A. Controls and Procedures
6 rewritten, 2 added, 2 removed, 29 unchanged
Read the full itemFY2023 item · filed February 9, 2024FY2022 item · filed February 10, 2023
The Corporation’s management assessed the effectiveness of the Corporation’s internal control over financial reporting as of December 31, [removed: 2022.][added: 2023.]
In making this assessment, it used the criteria set forth by the Committee of Sponsoring Organizations of the Treadway Commission (COSO) in _Internal Control_ [removed: –] [added: \-] _Integrated Framework (2013)_.
Based on our assessment, management believes that, as of December 31, [removed: 2022,] [added: 2023,] the Corporation’s internal control over financial reporting is effective based on those criteria.
We have audited the internal control over financial reporting of Union Pacific Corporation and Subsidiary Companies (the “Corporation”) as of December 31, [removed: 2022,] [added: 2023,] based on criteria established in _Internal Control_ — _Integrated Framework (2013)_ issued by the Committee of Sponsoring Organizations of the Treadway Commission (COSO).
In our opinion, the Corporation maintained, in all material respects, effective internal control over financial reporting as of December 31, [removed: 2022,] [added: 2023,] based on criteria established in _Internal Control_ — _Integrated Framework (2013)_ issued by COSO.
We have also audited, in accordance with the standards of the Public Company Accounting Oversight Board (United States) (PCAOB), the consolidated financial statements as of and for the year ended December 31, [removed: 2022,] [added: 2023,] of the Corporation and our report dated February [removed: 10, 2023,] [added: 9, 2024,] expressed an unqualified opinion on those financial statements.
February 8, 2024
February 9, 2024
February 9, 2023
February 10, 2023
Item 9B. Other Information
0 rewritten, 4 added, 1 removed, 0 unchanged
Read the full itemFY2023 item · filed February 9, 2024FY2022 item · filed February 10, 2023
On _October 24, 2023,_ Elizabeth F.
Whited, President, adopted a trading plan intended to satisfy Rule 10b5\-1(c) to sell up to 7,500 shares of Union Pacific Corporation common stock, of which 7,500 are to be acquired upon the exercise of vested stock options, between _February 14, 2024,_ and _April 18, 2024,_ subject to certain conditions.
On _December 15, 2023,_ Todd M.
Rynaski, Senior Vice President and Chief Accounting, Risk, and Compliance Officer, adopted a trading plan intended to satisfy Rule 10b5\-1(c) to sell up to 5,271 shares of Union Pacific Corporation common stock, of which 5,271 are to be acquired upon the exercise of vested stock options, between _March 15, 2024,_ and _September 16, 2024,_ subject to certain conditions.
None.
Item 10. Directors, Executive Officers, and Corporate Governance
1 rewritten, 0 added, 0 removed, 10 unchanged
Read the full itemFY2023 item · filed February 9, 2024FY2022 item · filed February 10, 2023
Information concerning compliance with Section 16(a) of the Securities Exchange Act of 1934 is set forth in the [added: Delinquent] Section 16(a) [removed: Beneficial Ownership Reporting Compliance] [added: Reports] segment of the Proxy Statement and is incorporated herein by reference.
Item 11. Executive Compensation
2 rewritten, 0 added, 0 removed, 1 unchanged
Read the full itemFY2023 item · filed February 9, 2024FY2022 item · filed February 10, 2023
Information concerning compensation received by our directors and our named executive officers is presented in the Compensation Discussion and Analysis, Summary Compensation Table, Grants of Plan-Based Awards in Fiscal Year [removed: 2022,] [added: 2023,] Outstanding Equity Awards at [removed: 2022] [added: 2023] Fiscal Year-End, Option Exercises and Stock Vested in Fiscal Year [removed: 2022,] [added: 2023,] Pension Benefits at [removed: 2022] [added: 2023] Fiscal Year-End, Nonqualified Deferred Compensation at [removed: 2022] [added: 2023] Fiscal Year-End, Potential Payments Upon Termination or Change in Control and Director Compensation in Fiscal Year [removed: 2022] [added: 2023] segments of the Proxy Statement and is incorporated herein by reference.
Information regarding the Compensation and Benefits Committee is set forth in the Compensation Committee [removed: Interlocks and Insider Participation and Compensation Committee Report segments] [added: segment] of the Proxy Statement and is incorporated herein by reference.
Item 12. Security Ownership of Certain Beneficial Owners and Management and Related Stockholder Matters
4 rewritten, 3 added, 4 removed, 1 unchanged
Read the full itemFY2023 item · filed February 9, 2024FY2022 item · filed February 10, 2023
The following table summarizes the equity compensation plans under which UPC common stock may be issued as of December 31, [removed: 2022:][added: 2023:]
| _Plan Category_ | | _Number of securities to be issued upon exercise of outstanding options, warrants and rights_ | | | | | _Weighted-average exercise price of outstanding options, warrants and rights_ | | | | | [removed: __Number] [added: _Number] of securities remaining available for future issuance under equity compensation plans (excluding securities reflected in column [removed: (a))__] [added: (a))_] | | | |
| _\[1\]_ | _Includes [removed: 364,038] [added: 366,046] retention units that do not have an exercise price. Does not include [removed: 1,022,053] [added: 954,405] retention shares that have been issued and are outstanding._ |
| _\[2\]_ | _Does not include the retention units or retention shares described above in footnote [removed: 1._] [added: \[1\]._] |
| | | _(a)_ | | | | | _(b)_ | | | | | _(c)_ | | | |
| Equity compensation plans approved by security holders | | | 2,438,300 | | \[1\] | | $ | 147.06 | | \[1\] | | | 31,979,909 | | \[2\] |
| Total | | | 2,438,300 | | | | $ | 147.06 | | | | | 31,979,909 | | |
| | | _(a)_ | | | | | _(b)_ | | | | | __(c)__ | | | |
| Equity compensation plans approved by security holders | | | 2,337,851 | | \[1\] | | $ | 169.63 | | \[2\] | | | 33,185,971 | | \[2\] |
| Total | | | 2,337,851 | | | | $ | 169.63 | | | | | 33,185,971 | | |
| _\[3\]_ | _Includes 9,635,719 shares available for issuance under the 2021 Employee Stock Purchase Plan, 22,176,052 shares available for issuance under the 2021 Stock Incentive Plan and 1,374,200 shares available for issuance under the 2000 Directors Plan._ |
Item 13. Certain Relationships and Related Transactions, and Director Independence
1 rewritten, 0 added, 0 removed, 2 unchanged
Read the full itemFY2023 item · filed February 9, 2024FY2022 item · filed February 10, 2023
Information on related transactions is set forth in the [removed: Certain Relationships and] Related [removed: Transactions and Compensation Committee Interlocks] [added: Party Policy] and [removed: Insider Participation segments] [added: Procedures segment] of the Proxy Statement and is incorporated herein by reference.
Item 14. Principal Accountant Fees and Services
1 rewritten, 0 added, 0 removed, 2 unchanged
Read the full itemFY2023 item · filed February 9, 2024FY2022 item · filed February 10, 2023
Information concerning our Audit Committee’s policies and procedures pertaining to pre-approval of audit and non-audit services rendered by our independent registered public accounting firm is set forth in the [added: Pre-approval of] Audit [removed: Committee] [added: and Non-Audit Services Policy] segment of the Proxy Statement and is incorporated herein by reference.
Item 15. Exhibit and Financial Statement Schedules
32 rewritten, 4 added, 7 removed, 21 unchanged
Read the full itemFY2023 item · filed February 9, 2024FY2022 item · filed February 10, 2023
The financial statements filed as part of this filing are listed on the index to the Financial Statements and Supplementary Data, Item 8, on page [removed: [41](#i8).][added: [40](#i8).]
Exhibits are listed in the exhibit index beginning on page [removed: [77](#Exhibits_).][added: [76](#Exhibits_).]
| 10(a)† | [Form of Performance Stock Unit Agreement dated February [removed: 9, 2023.](https://www.sec.gov/Archives/edgar/data/100885/000143774923002959/ex_421477.htm)] [added: 8, 2024.](https://www.sec.gov/Archives/edgar/data/100885/000143774924003599/ex_605064.htm)] |
| 10(b)† | [Form of Non-Qualified Stock Option Agreement for Executives dated February [removed: 9, 2023.](https://www.sec.gov/Archives/edgar/data/100885/000143774923002959/ex_421478.htm)] [added: 8, 2024.](https://www.sec.gov/Archives/edgar/data/100885/000143774924003599/ex_605065.htm)] |
| 21 | [List of the Corporation’s significant subsidiaries and their respective states of [removed: incorporation.](https://www.sec.gov/Archives/edgar/data/100885/000143774923002959/ex_421480.htm)] [added: incorporation.](https://www.sec.gov/Archives/edgar/data/100885/000143774924003599/ex_605066.htm)] |
| 23 | [Independent Registered Public Accounting Firm’s [removed: Consent.](https://www.sec.gov/Archives/edgar/data/100885/000143774923002959/ex_421481.htm)] [added: Consent.](https://www.sec.gov/Archives/edgar/data/100885/000143774924003599/ex_605067.htm)] |
| 24 | [Powers of attorney executed by the directors of [removed: UPC.](https://www.sec.gov/Archives/edgar/data/100885/000143774923002959/ex_421482.htm)] [added: UPC.](https://www.sec.gov/Archives/edgar/data/100885/000143774924003599/ex_605068.htm)] |
| 31(a) | [Certifications Pursuant to Rule 13a-14(a), of the Exchange Act, as Adopted pursuant to Section 302 of the Sarbanes-Oxley Act of 2002 - [removed: Lance M. Fritz.](https://www.sec.gov/Archives/edgar/data/100885/000143774923002959/ex_421483.htm)] [added: V. James Vena.](https://www.sec.gov/Archives/edgar/data/100885/000143774924003599/ex_605069.htm)] |
| 31(b) | [Certifications Pursuant to Rule 13a-14(a), of the Exchange Act, as Adopted pursuant to Section 302 of the Sarbanes-Oxley Act of 2002 [removed: –Jennifer] [added: - Jennifer] L. [removed: Hamann.](https://www.sec.gov/Archives/edgar/data/100885/000143774923002959/ex_421484.htm)] [added: Hamann.](https://www.sec.gov/Archives/edgar/data/100885/000143774924003599/ex_605070.htm)] |
| 32 | [Certifications Pursuant to 18 U.S.C. Section 1350, as Adopted pursuant to Section 906 of the Sarbanes-Oxley Act of 2002 - [removed: Lance M. Fritz] [added: V. James Vena] and Jennifer L. [removed: Hamann.](https://www.sec.gov/Archives/edgar/data/100885/000143774923002959/ex_421485.htm)] [added: Hamann.](https://www.sec.gov/Archives/edgar/data/100885/000143774924003599/ex_605071.htm)] |
| 101 | The following financial and related information from Union Pacific Corporation’s Annual Report on Form 10-K for the year ended December 31, [removed: 2022] [added: 2023] (filed with the SEC on February [removed: 10, 2023),] [added: 9, 2024),] formatted in Inline Extensible Business Reporting Language (iXBRL) includes (a) Consolidated Statements of Income for the years ended December 31, [added: 2023,] 2022, [removed: 2021,] and [removed: 2020,] [added: 2021,] (b) Consolidated Statements of Comprehensive Income for the years ended December 31, [added: 2023,] 2022, [removed: 2021,] and [removed: 2020,] [added: 2021,] (c) Consolidated Statements of Financial Position at December 31, [removed: 2022] [added: 2023] and [removed: 2021,] [added: 2022,] (d) Consolidated Statements of Cash Flows for the years ended December 31, [added: 2023,] 2022, [removed: 2021,] and [removed: 2020,] [added: 2021,] (e) Consolidated Statements of Changes in Common Shareholders’ Equity for the years ended December 31, [added: 2023,] 2022, [removed: 2021,] and [removed: 2020,] [added: 2021,] and (f) the Notes to the Consolidated Financial Statements. |
| 4(d) | [Form of [removed: 2.800%] [added: 4.750%] Note due [removed: 2032] [added: 2026] is incorporated by reference to Exhibit 4.1 to the Corporation’s Current Report on Form 8-K dated February [removed: 14, 2022.](http://www.sec.gov/Archives/edgar/data/100885/000143774922003268/ex_334547.htm)] [added: 21, 2023.](http://www.sec.gov/Archives/edgar/data/100885/000143774923003966/ex_477375.htm)] |
| 4(e) | [Form of [removed: 3.375%] [added: 4.950%] Note due [removed: 2042] [added: 2053] is incorporated by reference to Exhibit 4.2 to the Corporation’s Current Report on Form 8-K dated February [removed: 14, 2022.](http://www.sec.gov/Archives/edgar/data/100885/000143774922003268/ex_334548.htm)] [added: 21. 2023.](http://www.sec.gov/Archives/edgar/data/100885/000143774923003966/ex_477376.htm)] |
| [removed: 10(c)†] [added: 10(g)†] | [Union Pacific Corporation Key Employee Continuity Plan, as amended December 10, 2021, is incorporated herein by reference to Exhibit 10(c) to the Corporation's Annual Report on Form 10-K for the year ended December 31, 2021.](http://www.sec.gov/Archives/edgar/data/100885/000143774922002494/ex_321031.htm) |
| [removed: 10(d)†] [added: 10(h)†] | [Supplemental Thrift Plan (409A Grandfathered Component) of Union Pacific Corporation, as amended March 1, 2013, is incorporated herein by reference to Exhibit 10(d) to the Corporation’s Quarterly Report on Form 10-Q for the quarter ended March 31, 2013.](http://www.sec.gov/Archives/edgar/data/100885/000119312513160892/d521471dex10d.htm) |
| [removed: 10(e)†] [added: 10(i)†] | [Supplemental Thrift Plan (409A Non-Grandfathered Component) of Union Pacific Corporation, as amended January 1, 2018, is incorporated herein by reference to Exhibit 10(d) to the Corporation’s Annual Report on Form 10-K for the year ended December 31, 2017.](http://www.sec.gov/Archives/edgar/data/100885/000010088518000048/unp-20171231xex10_d.htm) |
| [removed: 10(f)†] [added: 10(j)†] | [Supplemental Pension Plan for Officers and Managers (409A Grandfathered Component) of Union Pacific Corporation and Affiliates, as amended February 1, 2013, and March 1, 2013 is incorporated herein by reference to Exhibit 10(f) to the Corporation’s Quarterly Report on Form 10-Q for the quarter ended March 31, 2013.](http://www.sec.gov/Archives/edgar/data/100885/000119312513160892/d521471dex10f.htm) |
| [removed: 10(g)†] [added: 10(l)†] | [removed: [Supplemental Pension] [added: [Deferred Compensation] Plan [removed: for Officers and Managers] (409A Non-Grandfathered Component) of Union Pacific [removed: Corporation and Affiliates,] [added: Corporation,] as amended December 9, 2020, is incorporated herein by reference to Exhibit [removed: 10(d)] [added: 10(c)] to the Corporation’s Annual Report on Form 10-K for the year ended December 31, [removed: 2020.](http://www.sec.gov/Archives/edgar/data/100885/000010088521000068/unp-20201231xex10_d.htm)] [added: 2020.](http://www.sec.gov/Archives/edgar/data/100885/000010088521000068/unp-20201231xex10_c.htm)] |
| [removed: 10(h)†] [added: 10(k)†] | [Deferred Compensation Plan (409A Grandfathered Component) of Union Pacific Corporation, as amended March 1, 2013, is incorporated herein by reference to Exhibit 10(b) to the Corporation’s Quarterly Report on Form 10-Q for the quarter ended March 31, 2013.](http://www.sec.gov/Archives/edgar/data/100885/000119312513160892/d521471dex10b.htm) |
| [removed: 10(i)†] [added: 10(n)†] | [removed: [Deferred] [added: [Union Pacific Corporation Stock Unit Grant and Deferred] Compensation Plan [added: for the Board of Directors] (409A Non-Grandfathered [removed: Component) of Union Pacific Corporation,] [added: Component), effective] as [removed: amended December 9, 2020,] [added: of January 1, 2009] is incorporated herein by reference to Exhibit [removed: 10(c)] [added: 10(k)] to the Corporation’s Annual Report on Form 10-K for the year ended December 31, [removed: 2020.](http://www.sec.gov/Archives/edgar/data/100885/000010088521000068/unp-20201231xex10_c.htm)] [added: 2008.](http://www.sec.gov/Archives/edgar/data/100885/000119312509021370/dex10k.htm)] |
| [removed: 10(j)†] [added: 10(m)†] | [Union Pacific Corporation 2000 Directors Plan, effective as of April 21, 2000, as amended November 16, 2006, January 30, 2007 and January 1, 2009 is incorporated herein by reference to Exhibit 10(j) to the Corporation’s Annual Report on Form 10-K for the year ended December 31, 2008.](http://www.sec.gov/Archives/edgar/data/100885/000119312509021370/dex10j.htm) |
| [removed: 10(k)†] [added: 10(o)†] | [Union Pacific Corporation Stock Unit Grant and Deferred Compensation Plan for the Board of Directors (409A [removed: Non-Grandfathered] [added: Grandfathered] Component), [added: as amended and restated in its entirety,] effective as of January 1, 2009 is incorporated herein by reference to Exhibit [removed: 10(k)] [added: 10(l)] to the Corporation’s Annual Report on Form 10-K for the year ended December 31, [removed: 2008.](http://www.sec.gov/Archives/edgar/data/100885/000119312509021370/dex10k.htm)] [added: 2008.](http://www.sec.gov/Archives/edgar/data/100885/000119312509021370/dex10l.htm)] |
| [removed: 10(l)†] [added: 10(q)†] | [Union Pacific Corporation [removed: Stock Unit Grant and Deferred Compensation Plan for the Board of Directors (409A Grandfathered Component), as] [added: Executive Incentive Plan, effective May 5, 2005,] amended and restated [removed: in its entirety,] effective [removed: as of] January 1, [removed: 2009] [added: 2020] is incorporated herein by reference to Exhibit [removed: 10(l)] [added: 10(e)] to the Corporation’s Annual Report on Form 10-K for the year ended December 31, [removed: 2008.](http://www.sec.gov/Archives/edgar/data/100885/000119312509021370/dex10l.htm)] [added: 2019.](http://www.sec.gov/Archives/edgar/data/100885/000010088520000065/unp-20191231xex10_e.htm)] |
| [removed: 10(m)†] [added: 10(p)†] | [removed: [UPC 2004] [added: [Union Pacific Corporation 2013] Stock Incentive [removed: Plan] [added: Plan, effective May 16, 2013, as] amended [removed: March] [added: effective as of January] 1, [removed: 2013,] [added: 2020] is incorporated herein by reference to Exhibit [removed: 10(g)] [added: 10(d)] to the Corporation’s [removed: Quarterly] [added: Annual] Report on Form [removed: 10-Q] [added: 10-K] for the [removed: quarter] [added: year] ended [removed: March] [added: December] 31, [removed: 2013.](http://www.sec.gov/Archives/edgar/data/100885/000119312513160892/d521471dex10g.htm)] [added: 2019.](http://www.sec.gov/Archives/edgar/data/100885/000010088520000065/unp-20191231xex10_d.htm)] |
| [removed: 10(n)†] [added: 10(z)†] | [removed: [Union Pacific Corporation Policy for Recoupment of] [added: [Executive] Incentive [removed: Compensation, effective January 1, 2020] [added: Plan (2005) - Deferred Compensation Program, dated December 21, 2005] is incorporated herein by reference to Exhibit [removed: 10(c)] [added: 10(g)] to the Corporation’s Annual Report on Form 10-K for the year ended December 31, [removed: 2019.](http://www.sec.gov/Archives/edgar/data/100885/000010088520000065/unp-20191231xex10_c.htm)] [added: 2005.](http://www.sec.gov/Archives/edgar/data/100885/000119312506038383/dex10g.htm)] |
| [removed: 10(o)†] [added: 10(y)†] | [removed: [Union Pacific Corporation 2013 Stock Incentive Plan, effective May 16, 2013, as amended effective as] [added: [Form] of [removed: January 1, 2020] [added: 2023 Long Term Plan Stock Unit Agreement] is incorporated herein by reference to Exhibit [removed: 10(d)] [added: 10(a)] to the Corporation’s Annual Report on Form 10-K for the year ended December 31, [removed: 2019.](http://www.sec.gov/Archives/edgar/data/100885/000010088520000065/unp-20191231xex10_d.htm)] [added: 2022.](http://www.sec.gov/Archives/edgar/data/100885/000143774923002959/ex_421477.htm)] |
| [removed: 10(p)†] [added: 97] | [Union Pacific Corporation [removed: Executive Incentive Plan, effective May 5, 2005,] [added: Policy for Recoupment of Certain Compensation,] amended and restated effective [removed: January 1, 2020] [added: October 2, 2023,] is incorporated [removed: herein] by reference to Exhibit [removed: 10(e)] [added: 10(a)] to the [removed: Corporation’s Annual] [added: Corporation Quarterly] Report on Form [removed: 10-K] [added: 10-Q] for the [removed: year] [added: quarter] ended [removed: December 31, 2019.](http://www.sec.gov/Archives/edgar/data/100885/000010088520000065/unp-20191231xex10_e.htm)] [added: September 30, 2023.](http://www.sec.gov/Archives/edgar/data/100885/000143774923028607/ex_577643.htm)] |
| [removed: 10(q)†] [added: 10(r)†] | [Union Pacific Corporation 2021 Stock Incentive Plan, effective as of May 13, 2021 is incorporated by reference to Exhibit 99.1 to the Corporation's Form S-8 dated May 25, 2021.](http://www.sec.gov/Archives/edgar/data/100885/000114036121018681/brhc10025044_ex99-1.htm) |
| [removed: 10(r)] [added: 10(s)] | [Amended and Restated Registration Rights Agreement, dated as of July 12, 1996, among UPC, UP Holding Company, Inc., Union Pacific Merger Co. and Southern Pacific Rail Corporation (SP) is incorporated herein by reference to Annex J to the Joint Proxy Statement/Prospectus included in Post-Effective Amendment No. 2 to UPC’s Registration Statement on Form S-4 (No. 33-64707).](http://www.sec.gov/Archives/edgar/data/100885/0000889812-96-000886.txt) |
| [removed: 10(s)] [added: 10(t)] | [Agreement, dated September 25, 1995, among UPC, UPRR, Missouri Pacific Railroad Company (MPRR), SP, Southern Pacific Transportation Company (SPT), The Denver & Rio Grande Western Railroad Company (D&RGW), St. Louis Southwestern Railway Company (SLSRC) and SPCSL Corp. (SPCSL), on the one hand, and Burlington Northern Railroad Company (BN) and The Atchison, Topeka and Santa Fe Railway Company (Santa Fe), on the other hand, is incorporated by reference to Exhibit 10.11 to UPC’s Registration Statement on Form S-4 (No. 33-64707).](http://www.sec.gov/Archives/edgar/data/100885/0000889812-95-000752.txt) |
| [removed: 10(t)] [added: 10(u)] | [Supplemental Agreement, dated November 18, 1995, between UPC, UPRR, MPRR, SP, SPT, D&RGW, SLSRC and SPCSL, on the one hand, and BN and Santa Fe, on the other hand, is incorporated herein by reference to Exhibit 10.12 to UPC’s Registration Statement on Form S-4 (No. 33-64707).](http://www.sec.gov/Archives/edgar/data/100885/0000889812-95-000752.txt) |
| [removed: 10(u)†] [added: 10(v)†] | [Form of Non-Qualified Stock Option Agreement for Executives is incorporated herein by reference to Exhibit 10(c) to the Corporation’s Annual Report on Form 10-K for the year ended December 31, 2013.](http://www.sec.gov/Archives/edgar/data/100885/000119312514040752/d668613dex10c.htm) |
| 10(c)† | [Performance Stock Unit Agreement dated February 8, 2024, for V. James Vena.](https://www.sec.gov/Archives/edgar/data/100885/000143774924003599/ex_615376.htm) |
| 10(d)† | [Non-Qualified Option Agreement dated February 8, 2024, for V. James Vena.](https://www.sec.gov/Archives/edgar/data/100885/000143774924003599/ex_615377.htm) |
| 10(e)† | [Supplemental Pension Plan for Officers and Managers (409A Non-Grandfathered Component) of Union Pacific Corporation and Affiliates, as amended November 1, 2023.](https://www.sec.gov/Archives/edgar/data/100885/000143774924003599/ex_615378.htm) |
| 10(f)† | [Transition and Separation Agreement between the Corporation, the Railroad and Lance M. Fritz dated August 11, 2023, is incorporated by reference to Exhibit 10.1 to the Corporation’s Current Report on Form 8-K dated August 11, 2023.](http://www.sec.gov/Archives/edgar/data/100885/000143774923023361/ex_558886.htm) |
| 4(f) | [Form of 3.500% Note due 2053 is incorporated by reference to Exhibit 4.3 to the Corporation’s Current Report on Form 8-K dated February 14, 2022.](http://www.sec.gov/Archives/edgar/data/100885/000143774922003268/ex_334549.htm) |
| 4(g) | [Form of 3.850% Note due 2072 is incorporated by reference to Exhibit 4.4 to the Corporation’s Current Report on Form 8-K dated February 14, 2022.](http://www.sec.gov/Archives/edgar/data/100885/000143774922003268/ex_334550.htm) |
| 4(h) | [Form of 4.500% Note due 2033 is incorporated herein by reference to Exhibit 4.1 to the Corporation’s Current Report on Form 8-K dated September 9, 2022.](http://www.sec.gov/Archives/edgar/data/100885/000143774922022126/ex_421448.htm) |
| 4(i) | [Form of 4.950% Note due 2052 is incorporated herein by reference to Exhibit 4.2 to the Corporation’s Current Report on Form 8-K dated September 9, 2022.](http://www.sec.gov/Archives/edgar/data/100885/000143774922022126/ex_421449.htm) |
| 4(j) | [Form of 5.150% Note due 2063 is incorporated herein by reference to Exhibit 4.3 to the Corporation’s Current Report on Form 8-K dated September 9, 2022.](http://www.sec.gov/Archives/edgar/data/100885/000143774922022126/ex_421450.htm) |
| 10(v)† | [Form of 2020 Long Term Plan Stock Unit Agreement is incorporated herein by reference to Exhibit 10(a) to the Corporation’s Annual Report on Form 10-K for the year ended December 31, 2019.](http://www.sec.gov/Archives/edgar/data/100885/000010088520000065/unp-20191231xex10_a.htm) |
| 10(y)† | [Executive Incentive Plan (2005) – Deferred Compensation Program, dated December 21, 2005 is incorporated herein by reference to Exhibit 10(g) to the Corporation’s Annual Report on Form 10-K for the year ended December 31, 2005.](http://www.sec.gov/Archives/edgar/data/100885/000119312506038383/dex10g.htm) |
Item 16. Form 10-K Summary
7 rewritten, 8 added, 9 removed, 20 unchanged
Read the full itemFY2023 item · filed February 9, 2024FY2022 item · filed February 10, 2023
Pursuant to the requirements of Section 13 or 15(d) of the Securities Exchange Act of 1934, the registrant has duly caused this report to be signed on its behalf by the undersigned, thereunto duly authorized, on this [removed: 10th] [added: 9th] day of February, [removed: 2023.][added: 2024.]
| | UNION PACIFIC CORPORATION | | [added: |]
| | | Chief Executive Officer | [added: |]
| | | Union Pacific Corporation | [added: |]
Pursuant to the requirements of the Securities Exchange Act of 1934, this report has been signed below, on this [removed: 10th] [added: 9th] day of February, [removed: 2023,] [added: 2024,] by the following persons on behalf of the registrant and in the capacities indicated.
| [removed: William J. DeLaney* |] Jane H. Lute* | [added: |]
| Deborah C. Hopkins* | [added: Christopher J. Williams*] |
| | By | /s/ V. James Vena | |
| | | V. James Vena, | |
| | | By | /s/ V. James Vena | |
| | | | V. James Vena, | |
| William J. DeLaney* | Michael R. McCarthy* |
| David B. Dillon* | Doyle R. Simons* |
| Sheri H. Edison* | John K. Tien* |
| Teresa M. Finley* | John P. Wiehoff* |
| | By | /s/ Lance M. Fritz |
| | | Lance M. Fritz, |
| | | Chairman, President, and |
| | | By | /s/ Lance M. Fritz | |
| | | | Lance M. Fritz, | |
| | | | Chairman, President, and | |
| David B. Dillon* | Michael R. McCarthy* |
| Sheri H. Edison* | Jose H. Villarreal* |
| Teresa M. Finley | Christopher J. Williams* |