 filings.tools
Item 5. Market for Registrant’s Common Equity, Related Stockholder Matters and Issuer Purchases of Equity Securities
6K characters. Original on sec.gov · Markdown
Item 5. Market for Registrant’s Common Equity, Related Stockholder Matters and Issuer Purchases of Equity Securities
Our class A common stock is not listed on a national securities exchange or traded in an organized over-the-counter market, but each share of our class A common stock is convertible into one share of our class B common stock.
The following is a summary of our class B common stock price activity and dividend information for 2017 and 2016. Our class B common stock is listed on the New York Stock Exchange under the symbol “UPS”.
| High | Low | Close | Dividends Declared | ||||||||||||
| 2017: | |||||||||||||||
| First Quarter | $ | 118.19 | $ | 103.23 | $ | 107.30 | $ | 0.83 | |||||||
| Second Quarter | $ | 111.55 | $ | 102.12 | $ | 110.59 | $ | 0.83 | |||||||
| Third Quarter | $ | 120.42 | $ | 106.98 | $ | 120.09 | $ | 0.83 | |||||||
| Fourth Quarter | $ | 125.16 | $ | 111.30 | $ | 119.15 | $ | 0.83 | |||||||
| 2016: | |||||||||||||||
| First Quarter | $ | 106.10 | $ | 88.70 | $ | 105.47 | $ | 0.78 | |||||||
| Second Quarter | $ | 107.72 | $ | 100.66 | $ | 107.72 | $ | 0.78 | |||||||
| Third Quarter | $ | 111.50 | $ | 106.86 | $ | 109.36 | $ | 0.78 | |||||||
| Fourth Quarter | $ | 120.16 | $ | 106.84 | $ | 114.64 | $ | 0.78 |
As of February 8, 2018, there were 154,033 and 18,863 shareowners of record of class A and class B common stock, respectively.
Our practice has been to pay dividends on a quarterly basis. The declaration of dividends is subject to the discretion of the Board of Directors and will depend on various factors, including our net income, financial condition, cash requirements, future prospects and other relevant factors.
On February 8, 2018, our Board declared a dividend of $0.91 per share, which is payable on March 7, 2018 to shareowners of record on February 20, 2018. This represents a 10% increase from the previous $0.83 quarterly dividend in 2017.
A summary of repurchases of our class A and class B common stock during the fourth quarter of 2017 is as follows (in millions, except per share amounts):
| Total Number of Shares Purchased(1) | Total Number of Shares Purchased as Part of Publicly Announced Program | Average Price Paid Per Share | Approximate Dollar Value of Shares that May Yet be Purchased Under the Program (as of month-end) | ||||||||||
| October 1—October 31 | 1.3 | 1.3 | $ | 119.28 | $ | 4,644 | |||||||
| November 1—November 30 | 1.2 | 1.2 | 123.47 | 4,490 | |||||||||
| December 1—December 31 | 1.3 | 1.3 | 119.50 | 4,339 | |||||||||
| Total October 1—December 31 | 3.8 | 3.8 | $ | 120.71 |
| (1) | Includes shares repurchased through our publicly announced share repurchase program and shares tendered to pay the exercise price and tax withholding on employee stock options. |
In May 2016, the Board of Directors approved a share repurchase authorization of $8.0 billion, which replaced an authorization previously announced in 2013. The new share repurchase authorization has no expiration date. We anticipate repurchasing approximately $1.0 billion of shares in 2018.
Shareowner Return Performance Graph
The following performance graph and related information shall not be deemed “soliciting material” or to be “filed” with the SEC, nor shall such information be incorporated by reference into any future filing under the Securities Act of 1933 or Securities Exchange Act of 1934, each as amended, except to the extent that the Company specifically incorporates such information by reference into such filing.
The following graph shows a five-year comparison of cumulative total shareowners’ returns for our class B common stock, the Standard & Poor’s 500 Index and the Dow Jones Transportation Average. The comparison of the total cumulative return on investment, which is the change in the quarterly stock price plus reinvested dividends for each of the quarterly periods, assumes that $100 was invested on December 31, 2012 in the Standard & Poor’s 500 Index, the Dow Jones Transportation Average and our class B common stock.
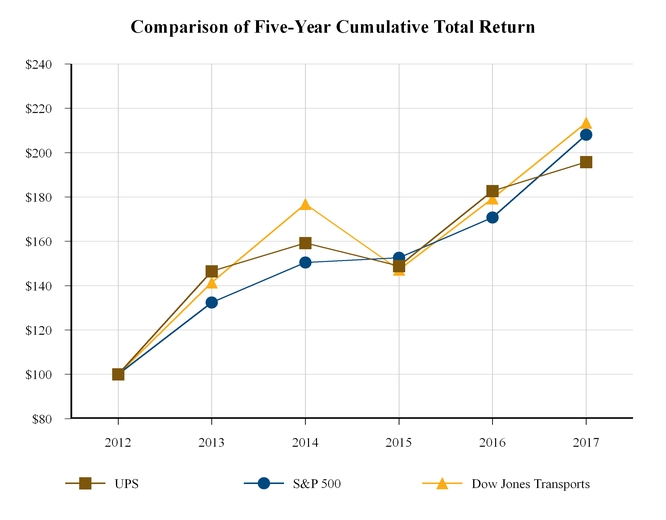
| 12/31/2012 | 12/31/2013 | 12/31/2014 | 12/31/2015 | 12/31/2016 | 12/31/2017 | ||||||||||||||||||
| United Parcel Service, Inc. | $ | 100.00 | $ | 146.54 | $ | 159.23 | $ | 148.89 | $ | 182.70 | $ | 195.75 | |||||||||||
| Standard & Poor’s 500 Index | $ | 100.00 | $ | 132.38 | $ | 150.49 | $ | 152.55 | $ | 170.79 | $ | 208.06 | |||||||||||
| Dow Jones Transportation Average | $ | 100.00 | $ | 141.38 | $ | 176.83 | $ | 147.19 | $ | 179.37 | $ | 213.49 |
Previous: Item 4. Mine Safety Disclosures · Next: Item 6. Selected Financial Data