 filings.tools
Item 5. MARKET FOR REGISTRANT’S COMMON EQUITY, RELATED STOCKHOLDER MATTERS AND ISSUER PURCHASES OF EQUITY SECURITIES
3K characters. Original on sec.gov · Markdown
Item 5. MARKET FOR REGISTRANT’S COMMON EQUITY, RELATED STOCKHOLDER MATTERS AND ISSUER PURCHASES OF EQUITY SECURITIES
Market Price of Class A Common Stock
Our Class A common stock is listed on the New York Stock Exchange under the symbol “VEEV.”
Stockholders
As of January 31, 2020, we had 12 holders of record of our Class A common stock and 45 holders of record of our Class B common stock. The actual number of holders of Class A common stock is greater than this number of record holders and includes stockholders who are beneficial owners but whose shares are held in street name by brokers and other nominees. This number of holders of record also does not include stockholders whose shares may be held in trust by other entities.
Purchases of Equity Securities by the Issuer and Affiliated Purchasers
None.
Recent Sales of Unregistered Securities
None.
Stock Performance Graph
This performance graph shall not be deemed “filed” for purposes of Section 18 of the Securities Exchange Act of 1934, as amended (Exchange Act), or incorporated by reference into any of our other filings under the Exchange Act or the Securities Act except to the extent we specifically incorporate it by reference into such filing.
This chart compares the cumulative total return on our common stock with that of the S&P 500 Index and the S&P 1500 Application Software Index. The chart assumes $100 was invested at the close of market on January 31, 2015 in the Class A common stock of Veeva Systems Inc., the S&P 500 Index, and the S&P 1500 Application Software Index and assumes the reinvestment of any dividends. The stock price performance on the following graph is not necessarily indicative of future stock price performance.
Veeva Systems Inc. | Form 10-K 35
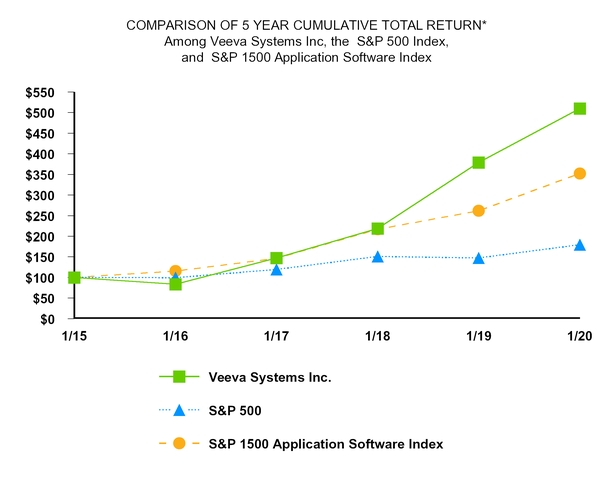
*$100 invested on 1/31/15 in stock or index, including reinvestment of dividends.
Fiscal year ending January 31.
Copyright@ 2020 Standard & Poor's, a division of S&P Global. All rights reserved.
| 1/31/2015 | 1/31/2016 | 1/31/2017 | 1/31/2018 | 1/31/2019 | 1/31/2020 | ||||||||||||
| Veeva Systems Inc. | 100.00 | 83.80 | 147.18 | 218.57 | 379.21 | 509.77 | |||||||||||
| S&P 500 | 100.00 | 99.33 | 119.24 | 150.73 | 147.24 | 179.17 | |||||||||||
| S&P 1500 Application Software Index | 100.00 | 115.47 | 146.41 | 217.10 | 261.67 | 352.46 | |||||||||||
36 Veeva Systems Inc. | Form 10-K
Previous: Item 4. MINE SAFETY DISCLOSURES · Next: Item 6. SELECTED CONSOLIDATED FINANCIAL DATA