 filings.tools
Item 5. MARKET FOR REGISTRANT’S COMMON EQUITY, RELATED STOCKHOLDER MATTERS, AND ISSUER PURCHASES OF EQUITY SECURITIES
6K characters. Original on sec.gov · Markdown
Item 5. MARKET FOR REGISTRANT’S COMMON EQUITY, RELATED STOCKHOLDER MATTERS, AND ISSUER PURCHASES OF EQUITY SECURITIES
Our common stock trades on the New York Stock Exchange under the symbol “VLO.”
As of January 31, 2013, there were 7,305 holders of record of our common stock.
The following table shows the high and low sales prices of and dividends declared on our common stock for each quarter of 2012 and 2011.
| Sales Prices of the Common Stock | Dividends Per Common Share | |||||||||||
| Quarter Ended | High | Low | ||||||||||
| 2012: | ||||||||||||
| December 31 | $ | 34.38 | $ | 28.20 | $ | 0.175 | ||||||
| September 30 | 33.75 | 23.64 | 0.175 | |||||||||
| June 30 | 26.33 | 20.37 | 0.150 | |||||||||
| March 31 | 28.56 | 19.61 | 0.150 | |||||||||
| 2011: | ||||||||||||
| December 31 | 26.70 | 17.17 | 0.150 | |||||||||
| September 30 | 26.89 | 17.78 | 0.050 | |||||||||
| June 30 | 30.50 | 23.18 | 0.050 | |||||||||
| March 31 | 30.73 | 23.19 | 0.050 |
On January 23, 2013, our board of directors declared a quarterly cash dividend of $0.20 per common share payable March 13, 2013 to holders of record at the close of business on February 13, 2013.
Dividends are considered quarterly by the board of directors and may be paid only when approved by the board.
The following table discloses purchases of shares of Valero’s common stock made by us or on our behalf during the fourth quarter of 2012.
| Period | Total Number of Shares Purchased | Average Price Paid per Share | Total Number of Shares Not Purchased as Part of Publicly Announced Plans or Programs (a) | Total Number of Shares Purchased as Part of Publicly Announced Plans or Programs | Approximate Dollar Value of Shares that May Yet Be Purchased Under the Plans or Programs (b) | |||||
| October 2012 | 50,163 | $ | 29.01 | 50,163 | — | $ 3.46 billion | ||||
| November 2012 | 927,587 | $ | 30.43 | 427,587 | 500,000 | $ 3.44 billion | ||||
| December 2012 | 3,214,969 | $ | 32.10 | 14,637 | 3,200,332 | $ 3.34 billion | ||||
| Total | 4,192,719 | $ | 31.69 | 492,387 | 3,700,332 | $ 3.34 billion |
| (a) | The shares reported in this column represent purchases settled in the fourth quarter of 2012 relating to (i) our purchases of shares in open-market transactions to meet our obligations under incentive compensation plans, and (ii) our purchases of shares from our employees and non-employee directors in connection with the exercise of stock options, the vesting of restricted stock, and other stock compensation transactions in accordance with the terms of our incentive compensation plans. |
| (b) | On April 26, 2007, we publicly announced an increase in our common stock purchase program from $2 billion to $6 billion, as authorized by our board of directors on April 25, 2007. The $6 billion common stock purchase program has no expiration date. On February 28, 2008, we announced that our board of directors approved a $3 billion common stock purchase program, which is in addition to the $6 billion program. This $3 billion program has no expiration date. |
The following performance graph is not “soliciting material,” is not deemed filed with the SEC, and is not to be incorporated by reference into any of Valero’s filings under the Securities Act of 1933 or the Securities Exchange Act of 1934, as amended, respectively.
This performance graph and the related textual information are based on historical data and are not indicative of future performance. The following line graph compares the cumulative total return1 on an investment in our common stock against the cumulative total return of the S&P 500 Composite Index and an index of peer companies (that we selected) for the five-year period commencing December 31, 2007 and ending December 31, 2012. Our peer group consists of the following ten companies: Alon USA Energy, Inc.; BP plc (BP); CVR Energy, Inc.; Hess Corporation; HollyFrontier Corporation; Marathon Petroleum Corporation; Phillips 66 (PSX); Royal Dutch Shell plc (RDS); Tesoro Corporation; and Western Refining, Inc. Our peer group previously included Chevron Corporation (CVX) and Exxon Mobil Corporation (XOM) but they were replaced with BP, PSX, and RDS. In 2012, PSX became an independent downstream energy company and was added to our peer group. CVX and XOM were replaced with BP and RDS as they were viewed as having operations that more closely aligned with our core businesses.
COMPARISON OF 5 YEAR CUMULATIVE TOTAL RETURN1
Among Valero Energy Corporation, the S&P 500 Index,
Old Peer Group, and New Peer Group
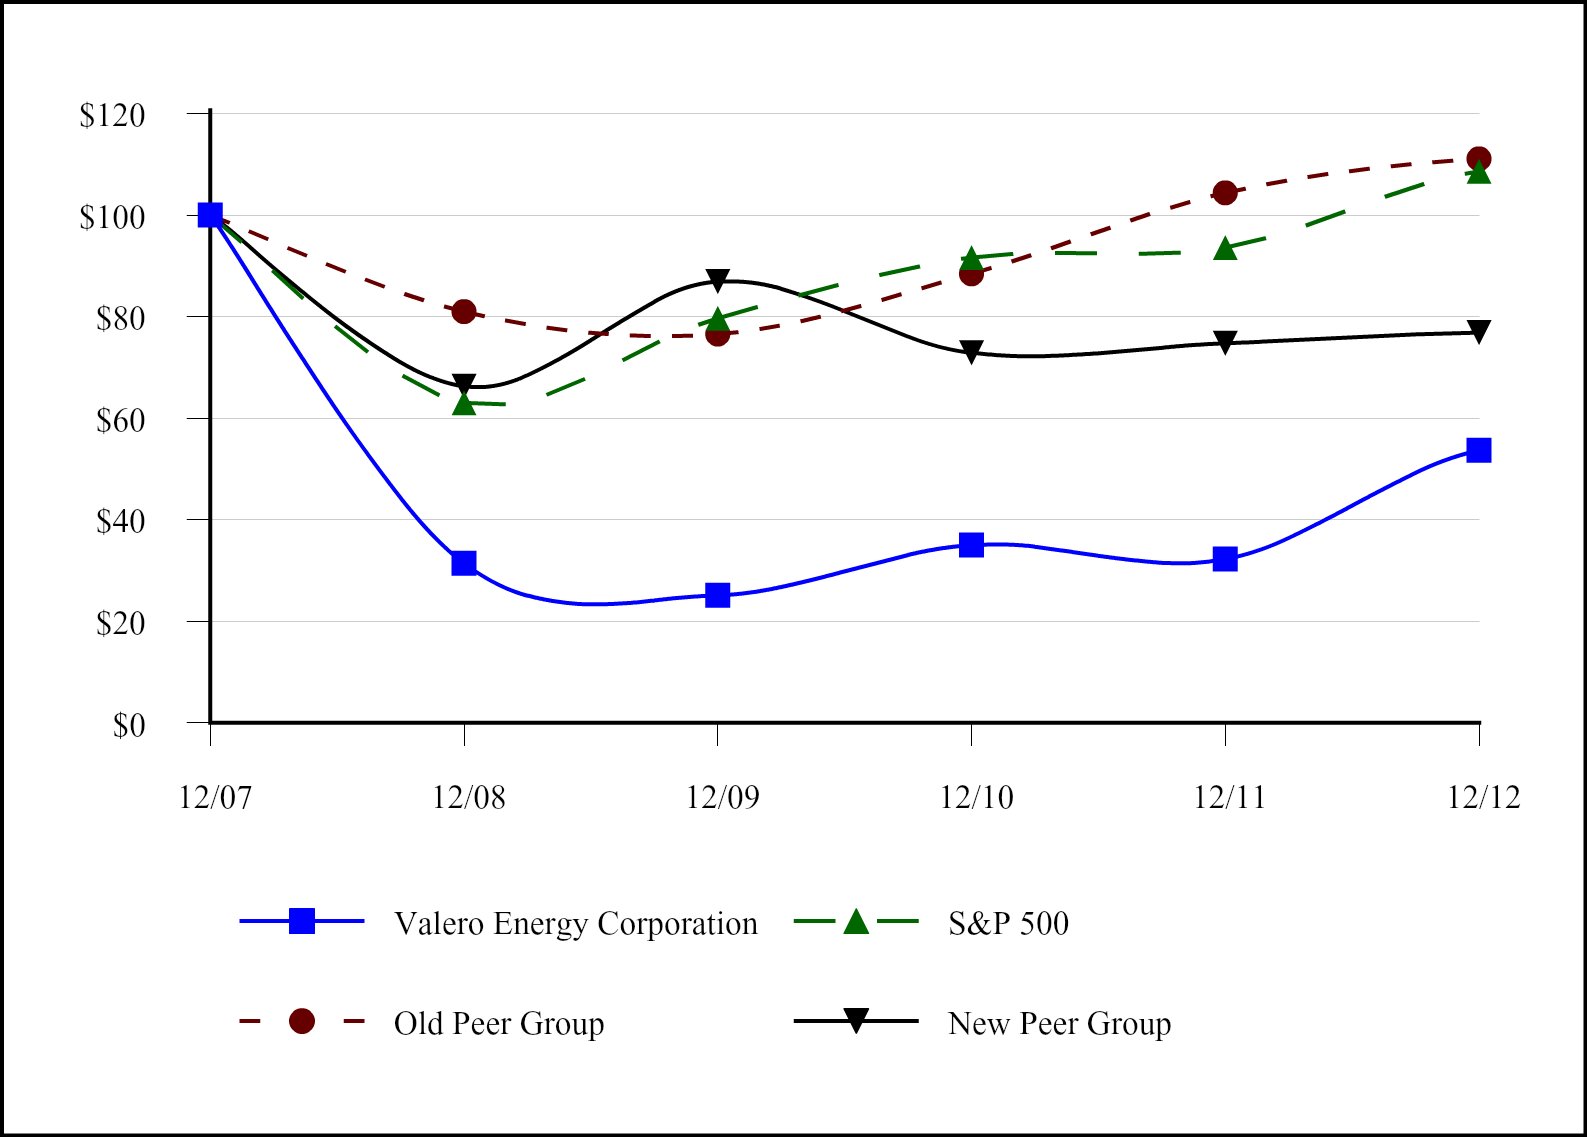
| 12/2007 | 12/2008 | 12/2009 | 12/2010 | 12/2011 | 12/2012 | ||||||||||||||||||
| Valero Common Stock | $ | 100.00 | $ | 31.45 | $ | 25.09 | $ | 35.01 | $ | 32.26 | $ | 53.61 | |||||||||||
| S&P 500 | 100.00 | 63.00 | 79.67 | 91.67 | 93.61 | 108.59 | |||||||||||||||||
| Old Peer Group | 100.00 | 80.98 | 76.54 | 88.41 | 104.33 | 111.11 | |||||||||||||||||
| New Peer Group | 100.00 | 66.27 | 86.87 | 72.84 | 74.70 | 76.89 |
| 1 | Assumes that an investment in Valero common stock and each index was $100 on December 31, 2007. “Cumulative total return” is based on share price appreciation plus reinvestment of dividends from December 31, 2007 through December 31, 2012. |
Previous: Item 4. MINE SAFETY DISCLOSURES · Next: Item 6. SELECTED FINANCIAL DATA