 filings.tools
Item 5. MARKET FOR REGISTRANT’S COMMON EQUITY, RELATED STOCKHOLDER MATTERS AND ISSUER PURCHASES OF EQUITY SECURITIES
7K characters. Original on sec.gov ·
Item 5. MARKET FOR REGISTRANT’S COMMON EQUITY, RELATED STOCKHOLDER MATTERS AND ISSUER PURCHASES OF EQUITY SECURITIES
Our common stock trades on the NYSE under the trading symbol “VLO.”
As of January 31, 2023, there were 4,562 holders of record of our common stock.
Dividends are considered quarterly by the Board, may be paid only when approved by the Board, and will depend on our financial condition, results of operations, cash flows, prospects, industry conditions, capital requirements, and other factors and restrictions our Board deems relevant. There can be no assurance that we will pay a dividend in the future at the rates we have paid historically, or at all.
The following table discloses purchases of shares of our common stock made by us or on our behalf during the fourth quarter of 2022.
| Period | Total Number of Shares Purchased (a) | Average Price Paid per Share | Total Number of Shares Purchased as Part of Publicly Announced Plans or Programs | Approximate Dollar Value of Shares that May Yet Be Purchased Under the Plans or Programs (b) | ||||||||||||||||||||||||||||
| October 2022 | 94,879 | $ | 127.85 | — | $4.1 billion | |||||||||||||||||||||||||||
| November 2022 | 5,718,669 | $ | 134.80 | 5,670,935 | $3.3 billion | |||||||||||||||||||||||||||
| December 2022 | 7,983,898 | $ | 122.03 | 7,980,785 | $2.3 billion | |||||||||||||||||||||||||||
| Total | 13,797,446 | $ | 127.36 | 13,651,720 | $2.3 billion |
(a)The shares reported in this column include 145,726 shares related to our purchases of shares from our employees and non-employee directors in connection with the exercise of stock options, the vesting of restricted stock, and other stock compensation transactions in accordance with the terms of our stock-based compensation plans.
(b)On January 23, 2018, we announced that our Board authorized our purchase of up to $2.5 billion of our outstanding common stock with no expiration date, and we completed all authorized share purchases under that program during the second quarter of 2022. On July 7, 2022, we announced that our Board authorized our purchase of up to an additional $2.5 billion of our outstanding common stock with no expiration date, and we completed all authorized share purchases under that program during the fourth quarter of 2022. On October 26, 2022, our Board authorized our purchase of up to an additional $2.5 billion of our outstanding common stock with no expiration date (the October 2022 Program). As of December 31, 2022, we had $2.3 billion of our outstanding common stock remaining available for purchase under this program. On February 23, 2023, our Board authorized our purchase of up to an additional $2.5 billion of our outstanding common stock with no expiration date, which is in addition to the amount remaining under the October 2022 Program.
The performance graph below is not “soliciting material,” is not deemed filed with the SEC, and is not to be incorporated by reference into any of our filings under the Securities Act of 1933 or the Securities Exchange Act of 1934, as amended, respectively.
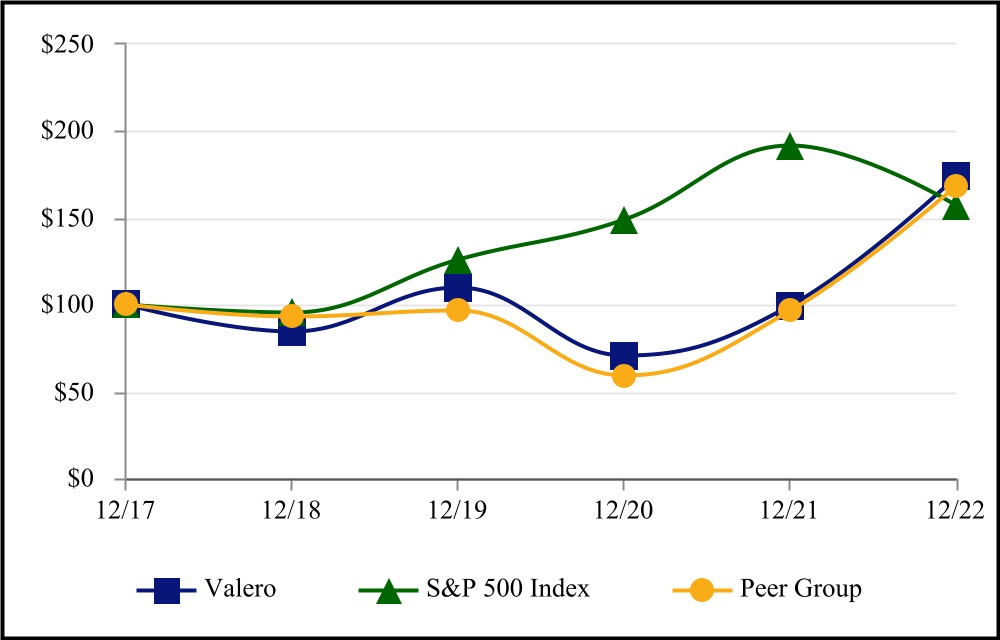
This performance graph and the related textual information are based on historical data and are not indicative of future performance. The following line graph compares the cumulative total return3 on an investment in our common stock against the cumulative total return of the S&P 500 Composite Index and an index of peers (that we selected) for the five-year period commencing December 31, 2017 and ending December 31, 2022. Our selected peer group comprises the following ten members: ConocoPhillips; CVR Energy, Inc.; Delek US Holdings, Inc.; the Energy Select Sector SPDR Fund; EOG Resources, Inc.; HF Sinclair Corporation; Marathon Petroleum Corporation; Occidental Petroleum Corporation; PBF Energy Inc.; and Phillips 66. The Energy Select Sector SPDR Fund (XLE) serves as a proxy for stock price performance of the energy sector and includes energy companies with which we compete for capital. We believe that our peer group represents a group of companies for making head-to-head performance comparisons in a competitive operating environment that is primarily characterized by U.S.-based companies that have business models predominantly consisting of downstream refining operations, together with similarly sized energy companies that share operating similarities to us, and that are in adjacent segments of the oil and gas industry.
COMPARISON OF 5 YEAR CUMULATIVE TOTAL RETURN3
Among Valero, the S&P 500 Index, and Peer Group
| As of December 31, | |||||||||||||||||||||||||||||||||||
| 2017 | 2018 | 2019 | 2020 | 2021 | 2022 | ||||||||||||||||||||||||||||||
| Valero common stock | $ | 100.00 | $ | 84.28 | $ | 109.87 | $ | 70.75 | $ | 99.28 | $ | 173.77 | |||||||||||||||||||||||
| S&P 500 Index | 100.00 | 95.62 | 125.72 | 148.85 | 191.58 | 156.89 | |||||||||||||||||||||||||||||
| Peer Group | 100.00 | 93.30 | 96.50 | 59.30 | 96.35 | 168.49 |
3 Assumes that an investment in Valero common stock, the S&P 500 index, and our peer group was $100 on December 31, 2017. Cumulative total return is based on share price appreciation plus reinvestment of dividends from December 31, 2017 through December 31, 2022.
Previous: Item 4. MINE SAFETY DISCLOSURES · Next: Item 6. [RESERVED]