 filings.tools
Item 1. BUSINESS
48K characters. Original on sec.gov · Markdown
Item 1. BUSINESS
BUSINESS
Vulcan Materials Company, a New Jersey corporation, is the nation’s largest producer of construction aggregates (primarily crushed stone, sand and gravel) and a major producer of asphalt mix and ready-mixed concrete. As of December 31, 2015, we had 344 active aggregates facilities.
VULCAN’S VALUE PROPOSITION
We are the largest producer of construction aggregates in the country with coast-to-coast aggregates operations. Our leading position is based upon:
| § | a favorable geographic footprint serving nearly all key growth corridors and the most rapidly growing population centers |
|---|
| § | a pure-play aggregates business with one of the largest proven and probable reserve bases in the U.S. |
|---|
| § | excellent multi-modal logistics capabilities, plus the inherent advantages of our Playa del Carmen, Mexico quarry and supporting port facilities |
|---|

These factors, together with our strong operating expertise and price discipline, allow us to deliver the highest margins per ton shipped in the industry.
PORTFOLIO MANAGEMENT
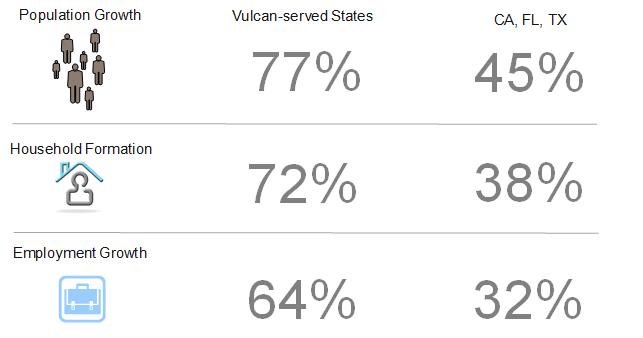
| § | Our aggregates reserves are strategically located throughout the United States in areas that are projected to grow faster than the national average and that require large amounts of aggregates to meet construction demand. Vulcan-served states are estimated to generate 77% of the total growth in U.S. population and 72% of the total growth in U.S. household formations between 2015 and 2025. |
|---|
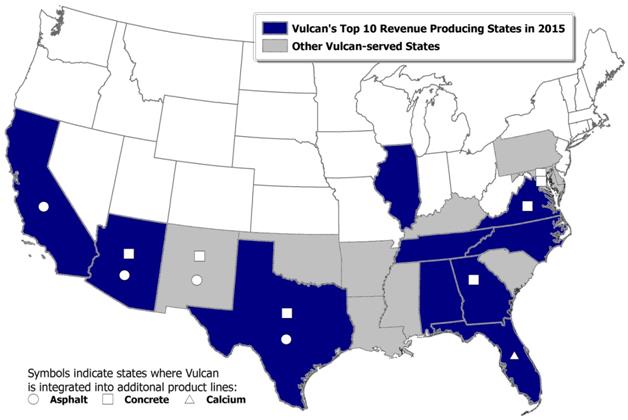
| VULCAN’S TOP TEN REVENUE PRODUCING STATES IN 2015 | ||||||||||||
| 1. | Texas | 6. | Tennessee | |||||||||
| 2. | California | 7. | Arizona | |||||||||
| 3. | Virginia | 8. | Illinois | |||||||||
| 4. | Georgia | 9. | North Carolina | |||||||||
| 5. | Florida | 10. | Alabama |
Our top ten revenue producing states accounted for 83% of our 2015 revenues while our top five accounted for 59%.
| Part I | 3 |
| § | We take a disciplined approach to strengthening our footprint by increasing our presence in U.S. metropolitan areas that are expected to grow more rapidly and by divesting assets that are no longer considered part of our long-term growth strategy. In 2015, we completed a swap of twelve ready-mixed concrete plants in California for thirteen asphalt plants primarily in Arizona. We also acquired three aggregates facilities and seven ready-mixed concrete plants in Arizona and New Mexico. These transactions, together with acquisitions completed in 2014, position us as the #1 aggregates supplier in the New Mexico market and a leading aggregates supplier in Arizona. |
|---|
| § | Where practical, we have operations located close to our local markets because the cost of trucking materials long distances is prohibitive. Approximately 80% of our total aggregates shipments are delivered exclusively from the producing location to the customer by truck, and another 16% are delivered by truck after reaching a sales yard by rail or water. The remaining 4% of aggregates shipments are delivered directly to the customer by rail or water. |
|---|
COMPETITORS
We operate in an industry that generally is fragmented with a large number of small, privately-held companies. We estimate that the ten largest aggregates producers accounted for approximately 30% to 35% of total U.S. aggregates production in 2015. Despite being the industry leader, Vulcan’s total U.S. market share is less than 10%. Other publicly traded companies among the ten largest U.S. aggregates producers include the following:
| § | Cemex S.A.B. de C.V. |
|---|
| § | CRH plc |
|---|
| § | HeidelbergCement AG |
|---|
| § | LafargeHolcim |
|---|
| § | Martin Marietta Materials, Inc. |
|---|
| § | MDU Resources Group, Inc. |
|---|
| § | Summit Materials, Inc. |
|---|
Because the U.S. aggregates industry is highly fragmented, with over 5,900 companies managing almost 11,000 operations during 2015, many opportunities for consolidation exist. Therefore, companies in the industry tend to grow by acquiring existing facilities to enter new markets or by extending their existing market positions.
BUSINESS STRATEGY AND COMPETITIVE ADVANTAGE
Vulcan provides the basic materials for the infrastructure needed to maintain and expand the U.S. economy. Our strategy and competitive advantages are based on our strength in aggregates. Aggregates are used in most types of construction and in the production of asphalt mix and ready-mixed concrete. Our materials are used to build the roads, tunnels, bridges, railroads and airports that connect us, and to build the hospitals, churches, schools, shopping centers, and factories that are essential to our lives and the economy.
business strategies
Our business strategies include: 1) aggregates focus, 2) coast-to-coast footprint, 3) profitable growth, 4) managing volume, product mix and price to grow profitability, and 5) effective land management.
- AGGREGATES FOCUS
Aggregates are used in virtually all types of public and private construction and practically no substitutes for quality aggregates exist. Our focus on aggregates allows us to:
BUILD AND HOLD SUBSTANTIAL RESERVES: The locations of our reserves are critical to our long-term success because of barriers to entry created in many metropolitan markets by zoning and permitting regulations and high costs associated with transporting aggregates. Our reserves are strategically located throughout the United States in high-growth areas that will require large amounts of aggregates to meet future construction demand. Aggregates operations have flexible production capabilities and, other than energy inputs required to process the materials, require virtually no other raw material. Our downstream businesses (asphalt mix and concrete) use Vulcan-produced aggregates almost exclusively.
| Part I | 4 |
TAKE ADVANTAGE OF BEING THE LARGEST PRODUCER: Each aggregates operation is unique because of its location within a local market with particular geological characteristics. Every operation, however, uses a similar group of assets to produce saleable aggregates and provide customer service. Vulcan is the largest aggregates company in the U.S., measured by shipments. Our 344 active aggregates facilities as of December 31, 2015 provide opportunities to standardize operating practices and procure equipment (fixed and mobile), parts, supplies and services in an efficient and cost-effective manner, both regionally and nationally. Additionally, we are able to share best practices across the organization and leverage our size for administrative support, customer service, accounting, procurement, technical support and engineering.
- COAST-TO-COAST FOOTPRINT
Demand for construction aggregates correlates positively with changes in population growth, household formation and employment. We have pursued a strategy to increase our presence in U.S. metropolitan areas that are expected to grow the most rapidly. Our strategic locations serve nineteen of the top 25 highest-growth U.S. metropolitan areas and as shown below, we serve twenty states plus the District of Columbia.
- PROFITABLE GROWTH
Our long-term growth is a result of strategic acquisitions and investments in key operations.
Strategic acquisitions AND DISPOSITIONS: Since becoming a public company in 1956, Vulcan has principally grown by mergers and acquisitions. For example, in 1999 we acquired CalMat Co., thereby expanding our aggregates operations into California and Arizona and making us one of the nation’s leading producers of asphalt mix. In 2007, we acquired Florida Rock Industries, Inc., the largest acquisition in our history. This acquisition expanded our aggregates business in Florida and our aggregates and ready-mixed concrete businesses in other southeastern and mid-Atlantic states. In 2014, we completed eight transactions that expanded our aggregates business in Arizona, California, New
| Part I | 5 |
Mexico, Texas, Virginia and Washington D.C., our asphalt mix business in Arizona and New Mexico, and our ready-mixed concrete business in New Mexico. In January 2015, we completed an asset exchange transaction in which we exited our ready-mixed concrete business in California and added thirteen asphalt plant locations, primarily in Arizona.
Additionally, throughout our history we have completed many bolt-on acquisitions that have contributed significantly to our growth. For example, in 2015 we completed strategic bolt-on acquisitions in Arizona, New Mexico and Tennessee.
| § | Reinvestment opportunities with high returns: During the next decade, Moody's Analytics projects that 77% of the U.S. population growth, 72% of household formation and 64% of new jobs will occur in Vulcan-served states. The close proximity of our production facilities and our aggregates reserves to this projected population growth create many opportunities to invest capital in high-return projects — projects that will add reserves, increase production capacity and improve costs. |
|---|
Source: Moody’s Analytics as of November 16, 2015
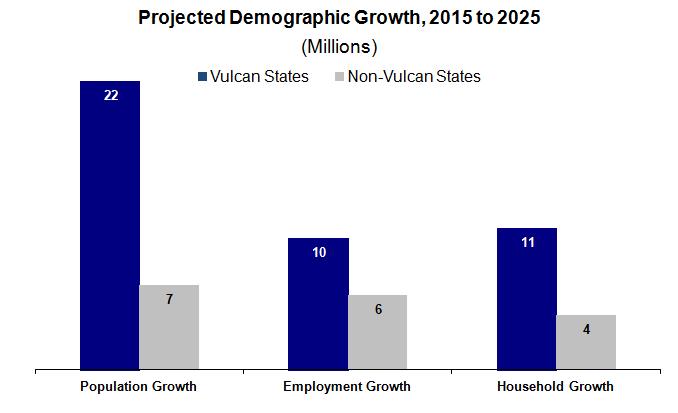
The following graphic illustrates the projected growth (2015 – 2025) by key demographics for Vulcan-served states:
Source: Moody’s Analytics as of November 16, 2015.
| Part I | 6 |
- MANAGING VOLUME, PRODUCT MIX AND PRICE TO GROW PROFITABILITY
We focus on three major profit drivers that must be managed in combination.
| § | Price for Service — We seek to receive full and fair value for the quality of products and service we provide. We should be paid appropriately for helping our customers be successful. |
|---|
| § | Operating Efficiency and Leverage — We focus on rigorous cost management throughout the economic cycle. Small savings per ton add up to significant cost reductions. |
|---|
| § | Sales and Production Mix — We adjust production levels to meet varying market conditions. Managing inventories responsibly results in improved cost performance and an improved return on capital. |
|---|
We manage these factors locally, and align our talent and incentives accordingly. Our knowledgeable and experienced workforce and our flexible production capabilities allow us to manage operational and overhead costs aggressively. Recovery in demand serves as a tailwind for all three major profit drivers.
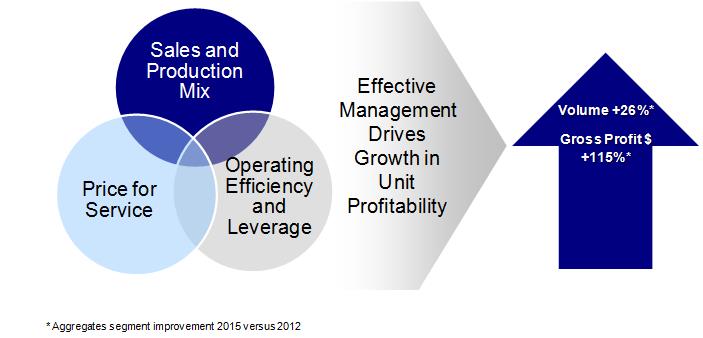
While Aggregates segment gross profit has grown at a significantly greater rate than volume over the past couple of years, we expect continuing improvement in unit profitability.
| § | On Price for Service — Our expanding margins have just begun to benefit from the mid-to-high single digit price gains associated with cyclical recoveries. |
|---|
| § | On Operating Efficiency and Leverage — We are operating a capital-intensive business at 55-60% capacity and are extremely well positioned to further leverage fixed costs to sales as we move forward. |
|---|
| § | On Sales and Production Mix — As the recovery continues and as we see a larger portion of new construction activity in the end-use mix, we will sell the entire production mix much more efficiently and at fuller value. |
|---|
- EFFECTIVE LAND MANAGEMENT
We believe that effective land management is both a business strategy and a social responsibility that contributes to our success. Good stewardship requires the careful use of existing resources as well as long-term planning because mining, ultimately, is an interim use of the land. Therefore, we strive to achieve a balance between the value we create through our mining activities and the value we create through effective post-mining land management. We continue to focus our actions on prudent decisions regarding the life cycle management of the 120,000 acres of land we currently own.
| Part I | 7 |
COMPETITIVE ADVANTAGes
The competitive advantages of our aggregates focused business strategy include:
COAST-TO-COAST FOOTPRINT
| § | largest aggregates company in the U.S. (measured by shipments) |
|---|
| § | high-growth markets requiring large amounts of aggregates to meet construction demand |
|---|
| § | extensive and advantaged logistics network (as shown on map on page 9) |
|---|
| § | diversified regional exposure |
|---|
| § | benefits of scale in operations, procurement and administrative support |
|---|
| § | complementary asphalt mix and concrete businesses in select markets |
|---|
| § | effective land management |
|---|
PROFITABLE GROWTH
| § | quality top-line growth that converts to higher-margin earnings and cash flow generation |
|---|
| § | tightly managed operational and overhead costs |
|---|
| § | more opportunities to manage our portfolio of locations to further enhance long-term earnings growth |
|---|
STRATEGICALLY LOCATED ASSETS
| § | our reserves are primarily located in high-growth markets that require large amounts of aggregates to meet demand |
|---|
| § | zoning and permitting regulations in many metropolitan markets have made it increasingly difficult to expand existing quarries or to develop new quarries |
|---|
| § | such regulations, while potentially curtailing expansion in certain areas, could also increase the value of our reserves at existing locations |
|---|
PRODUCT LINES
We have four operating (and reportable) segments organized around our principal product lines:
| 1. | Aggregates |
|---|
| 2. | Asphalt Mix |
|---|
| 3. | Concrete |
|---|
| 4. | Calcium |
|---|
See Note 15 "Segment Reporting" in Item 8 "Financial Statements and Supplementary Data.”
- AGGREGATES
Our construction aggregates are used in a number of ways:
| § | as a base material underneath highways, walkways, airport runways, parking lots and railroads |
|---|
| § | to aid in water filtration, purification and erosion control |
|---|
| § | as a raw material used in combination with other resources to construct many of the items we rely on to sustain our quality of life including: |
|---|
| § | houses and apartments |
|---|
| § | roads, bridges and parking lots |
|---|
| § | schools and hospitals |
|---|
| § | commercial buildings and retail space |
|---|
| § | sewer systems |
|---|
| § | airports and runways |
|---|
| Part I | 8 |
Factors that affect the U.S. aggregates industry and our business, include:
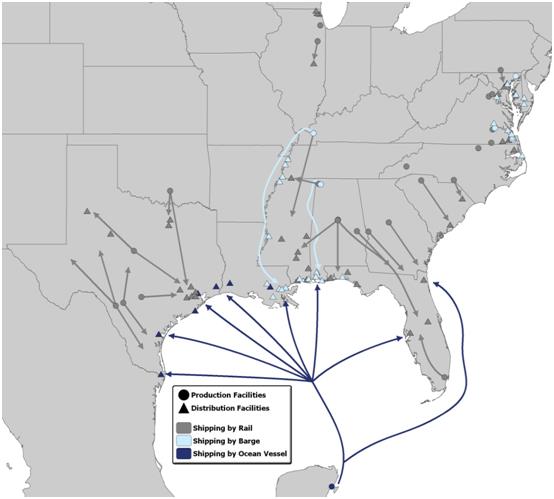
| § | Local markets: Aggregates have a high weight-to-value ratio and, in most cases, are produced near where they are used; if not, transportation can cost more than the materials, rendering them uncompetitive compared to locally produced materials. Exceptions to this typical market structure include areas along the U.S. Gulf Coast and the Eastern Seaboard where there are limited supplies of locally available high quality aggregates. We serve these markets from quarries that have access to long-haul transportation — shipping by barge and rail — and from our Playa del Carmen quarry on Mexico’s Yucatan Peninsula with our fleet of Panamax-class, self-unloading ships. |
|---|
We operate an extensive logistics network along the U.S. Gulf Coast and the Eastern Seaboard as shown below:
| § | Location and quality of reserves: We currently have 15.7 billion tons of permitted and proven or probable aggregates reserves. The bulk of these reserves are located in areas where we expect greater than average rates of growth in population, jobs and households, which require new infrastructure, housing, offices, schools and other development. Zoning and permitting regulations in some markets have made it increasingly difficult for the aggregates industry to expand existing quarries or to develop new quarries. These restrictions curtail expansion in certain areas, but they also increase the value of our reserves at existing locations. |
|---|
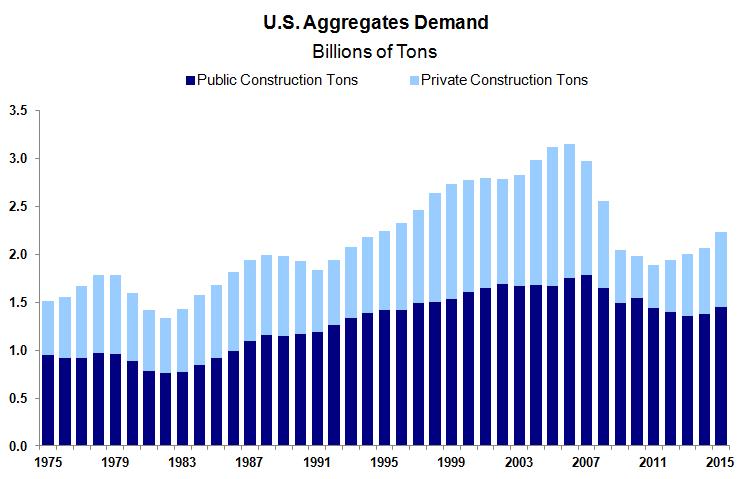
| § | Demand cycles: Long-term growth in demand for aggregates is largely driven by growth in population, jobs and households. While short- and medium-term demand for aggregates fluctuates with economic cycles, declines have historically been followed by strong recoveries, with each peak establishing a new historical high. |
|---|
| Part I | 9 |
| § | Flexible production capabilities: The production of aggregates is a mechanical process in which stone is crushed and, through a series of screens, separated into various sizes depending on how it will be used. Production capacity can be flexible by adjusting operating hours to meet changing market demand. |
|---|
| § | Highly fragmented industry: The U.S. aggregates industry is composed of over 5,900 companies that manage almost 11,000 operations. This fragmented structure provides many opportunities for consolidation. Companies in the industry commonly enter new markets or expand positions in existing markets through the acquisition of existing facilities. |
|---|
| § | Limited product substitution: There are limited substitutes for quality aggregates. Recycled concrete and asphalt have certain applications as a lower-cost alternative to virgin aggregates. However, due to technical specifications many types of construction projects cannot be served by recycled concrete, but require the use of virgin aggregates to meet specifications and performance-based criteria for durability, strength and other qualities. Moreover, the amount of recycled asphalt included in asphalt mix as a substitute for aggregates is limited due to specifications. |
|---|
| § | raw material inputs largely under our control: Unlike typical industrial manufacturing industries, the aggregates industry does not require the input of raw material beyond owned or leased aggregates reserves. Stone, sand and gravel are naturally occurring resources. However, production does require the use of explosives, hydrocarbon fuels and electric power. |
|---|
AGGREGATES MARKETS
We focus on the U.S. markets with above-average long-term expected population growth and where construction is expected to expand. Because transportation is a significant part of the delivered cost of aggregates, our facilities are typically located in the markets they serve or have access to economical transportation via rail, barge or ship to a particular end market. We serve both the public and the private sectors.
Public sector construction activity has historically been more stable and less cyclical than privately-funded construction, and generally requires more aggregates per dollar of construction spending. Private sector construction (primarily residential and nonresidential buildings) typically is more affected by general economic cycles than publicly funded projects (particularly highways, roads and bridges), which tend to receive more consistent levels of funding throughout economic cycles.
| Part I | 10 |
PUBLIC SECTOR CONSTRUCTION
Public sector construction includes spending by federal, state, and local governments for highways, bridges, buildings and airports as well as other infrastructure construction for sewer and waste disposal systems, water supply systems, dams, reservoirs and other public construction projects. Construction for power plants and other utilities is funded from both public and private sources. In 2015, publicly funded construction accounted for approximately 49% of our total aggregates shipments.
| § | Public Sector Funding: Generally, public sector construction spending is more stable than private sector construction because public sector spending is less sensitive to interest rates and has historically been supported by multi-year legislation and programs. For example, the federal surface transportation bill is a principal source of funding for public infrastructure and transportation projects. For over four decades, a portion of transportation projects has been funded through a series of multi-year bills. Some 35% of transportation projects are federally-funded, with special emphasis given to the largest and most complex projects. The long-term nature of such legislation is important because it provides state departments of transportation with the ability to plan and execute long-range, complex highway projects. Federal highway spending is governed by multi-year authorization bills and annual budget appropriations using funds largely from the Federal Highway Trust Fund. This Trust Fund receives funding from taxes on gasoline and other levies. The level of state spending on infrastructure varies across the United States and depends on individual state needs and economies. In 2015, approximately 26% of our aggregates sales by volume were used in highway construction projects. |
|---|
| § | federal highway funding: On December 4, 2015, the President signed a new, long-term federal highway bill into law. The final legislation, Fixing America’s Surface Transportation Infrastructure Act (FAST Act), received strong, bipartisan support in both the House and the Senate. |
|---|
The Federal-Aid Highway Program is the largest component of the law and has provided, on average, 52% of all state capital investment in roads and bridges over the last 10 years. The FAST Act increases Federal-Aid Highway Program funding from $41 billion in the federal fiscal year (FFY) 2015 to $47 billion in FFY 2020. This spending is supported by the current user-fee revenue streams (excise taxes on gasoline and diesel fuels, taxes on heavy truck sales and use, and heavy truck tire taxes, totaling some $208 billion) and by a $70 billion transfer of general funds to the Federal Highway Trust Fund. The funding levels and five years of stability will help to rebuild America’s aging infrastructure and protect millions of jobs.
The FAST Act also contains important policy changes. To further accelerate the project delivery process, it augments the environmental review and permitting process reforms contained in the prior law, Moving Ahead for Progress in the 21st Century Act (MAP-21). The new law also provides assistance for states making investments in major capital projects—particularly freight projects. In states where Vulcan operates, we are well-positioned to serve the large general contractors who will compete for new freight and other major capacity projects that will move forward with this FAST Act funding.
Although the Transportation Infrastructure Finance & Innovation Act (TIFIA) program was reduced to $275 million, growing to $300 million by 2020, the authorization is still in line with the previous program outlays and remains an important additional component of overall spending. The FAST Act also created a new National Surface Transportation and Innovative Finance Bureau to provide technical assistance to states seeking to pursue public-private partnerships and other financing arrangements.
| § | WATER INFRASTRUCTURE: In 2014 we, along with numerous business allies, strongly supported the Water Resources Reform and Development Act (WRRDA) for its importance to the U.S. economy and the pressing need to upgrade U.S. harbors, ports and inland waterways. Congress created a five-year pilot program to promote private-sector participation in water projects: the Water Infrastructure Financing and Innovation Act (WIFIA). Modeled after the highly popular TIFIA program in the surface transportation sector, WIFIA allows for federal credit assistance to water resources projects in the form of low-cost loans, loan guarantees and lines of credit. |
|---|
Unlike TIFIA, WIFIA as originally crafted did not allow for federal credit assistance to projects financed, in whole or in part, by tax exempt municipal bonds. The FAST Act lifts that restriction and should make it easier for project sponsors to use the credit program and advance water projects that would otherwise go unaddressed due to the lack of resources.
| Part I | 11 |
Private sector CONSTRUCTION
The private sector construction markets include both nonresidential building construction and residential construction and are considerably more cyclical than public construction. In 2015, privately-funded construction accounted for approximately 51% of our total aggregates shipments.
| § | Nonresidential Construction: Private nonresidential building construction includes a wide array of projects. Such projects generally are more aggregates intensive than residential construction. Overall demand in private nonresidential construction generally is driven by job growth, vacancy rates, private infrastructure needs and demographic trends. The growth of the private workforce creates demand for offices, hotels and restaurants. Likewise, population growth generates demand for stores, shopping centers, warehouses and parking decks as well as hospitals, churches and entertainment facilities. Large industrial projects, such as a new manufacturing facility, can increase the need for other manufacturing plants to supply parts and assemblies. Construction activity in this end market is influenced by a firm's ability to finance a project and the cost of such financing. This end market also includes capital investments in public nonresidential facilities to meet the needs of a growing population. |
|---|
Nonresidential construction is expected to continue to be a stable source of volume growth in 2016 based on the following assumptions: (1) continuing employment growth should provide support, as it has in the past, (2) current backlogs that our customers and industry groups are reporting should continue to be a source of demand in 2016 and (3) growing state and local tax revenues should provide local governments with the funds to make capital investments in schools and other public nonresidential facilities to meet the needs of a growing population.
| § | Residential Construction: The majority of residential construction is for single-family houses with the remainder consisting of multi-family construction (i.e., two family houses, apartment buildings and condominiums). Public housing comprises only a small portion of housing demand. Household formations in our markets continue to outpace household formations in the rest of the United States. Construction activity in this end market is influenced by the cost and availability of mortgage financing. |
|---|
U.S. housing starts, as measured by Dodge Analytics data, peaked in early 2006 at over 2 million units annually. By the end of 2009, total housing starts had declined to less than 0.6 million units, well below prior historical lows of approximately 1 million units annually. In 2015, total annual housing starts increased to more than 1.1 million units. The growth in residential construction bodes well for continued recovery in our markets.
ADDITIONAL AGGREGATES PRODUCTS AND MARKETS
We sell aggregates that are used as ballast for construction and maintenance of railroad tracks. We also sell riprap and jetty stone for erosion control along roads and waterways. In addition, stone can be used as a feedstock for cement and lime plants and for making a variety of adhesives, fillers and extenders. Coal-burning power plants use limestone in scrubbers to reduce harmful emissions. Limestone that is crushed to a fine powder can be sold as agricultural lime.
We sell a relatively small amount of construction aggregates outside of the United States, principally in the areas surrounding our large quarry on the Yucatan Peninsula in Mexico. Nondomestic sales and long-lived assets outside the United States are reported in Note 15 "Segment Reporting" in Item 8 "Financial Statements and Supplementary Data."
| Part I | 12 |
- ASPHALT MIX
We produce and sell asphalt mix in Arizona, California, New Mexico and Texas. This segment relies on our reserves of aggregates, functioning essentially as a customer to our aggregates operations. Aggregates are a major component in asphalt mix, comprising approximately 95% by weight of this product. We meet the aggregates requirements for our Asphalt Mix segment primarily through our Aggregates segment. These product transfers are made at local market prices for the particular grade and quality of material required.
Because asphalt mix hardens rapidly, delivery typically is within close proximity to the producing facility. The asphalt mix production process requires liquid asphalt cement, which we purchase from third-party producers. We do not anticipate any significant difficulties in obtaining the raw materials necessary for this segment to operate. We serve our Asphalt Mix segment customers from our local production facilities.
- CONCRETE
We produce and sell ready-mixed concrete in Arizona, Georgia, Maryland, New Mexico, Texas, Virginia, Washington D.C. and the Bahamas. In May 2015, we entered the Arizona ready-mixed concrete market through the acquisition of ready-mixed concrete operations in conjunction with the acquisition of aggregates operations in Arizona and New Mexico. In January 2015, we swapped our ready-mixed concrete operations in California for asphalt mix operations, primarily in Arizona. In March 2014, we sold our cement and concrete businesses in the Florida area. For additional details see Note 19 “Acquisitions and Divestitures” in Item 8 “Financial Statements and Supplementary Data.”
This segment relies on our reserves of aggregates, functioning essentially as a customer to our aggregates operations. Aggregates are a major component in ready-mixed concrete, comprising approximately 80% by weight of this product. We meet the aggregates requirements of our Concrete segment primarily through our Aggregates segment. These product transfers are made at local market prices for the particular grade and quality of material required.
We serve our Concrete segment customers from our local production facilities or by truck. Because ready-mixed concrete hardens rapidly, delivery typically is within close proximity to the producing facility.
Ready-mixed concrete production also requires cement which we purchase from third-party producers. We do not anticipate any significant difficulties in obtaining the raw materials necessary for this segment to operate.
- CALCIUM
As previously noted, in March 2014, we sold our cement and concrete businesses in the Florida area. For additional details see Note 19 “Acquisitions and Divestitures” in Item 8 “Financial Statements and Supplementary Data.” We retained our former Cement segment’s calcium operation in Brooksville, Florida. This facility produces calcium products for the animal feed, paint, plastics, water treatment and joint compound industries with high quality calcium carbonate material mined at the Brooksville quarry.
OTHER BUSINESS-RELATED ITEMS
SEASONALITY AND CYCLICAL NATURE OF OUR BUSINESS
Almost all of our products are produced and consumed outdoors. Seasonal changes and other weather-related conditions can affect the production and sales volumes of our products. Therefore, the financial results for any quarter do not necessarily indicate the results expected for the year. Normally, the highest sales and earnings are in the third quarter and the lowest are in the first quarter. Furthermore, our sales and earnings are sensitive to national, regional and local economic conditions and particularly to cyclical swings in construction spending, primarily in the private sector. The levels of construction spending are affected by a number of factors including changing interest rates and demographic and population fluctuations.
| Part I | 13 |
CUSTOMERS
No material part of our business depends upon any single customer whose loss would have a significant adverse effect on our business. In 2015, our five largest customers accounted for 7.0% of our total revenues (excluding internal sales), and no single customer accounted for more than 2.3% of our total revenues. Our products typically are sold to private industry and not directly to governmental entities. Although approximately 45% to 55% of our aggregates shipments have historically been used in publicly funded construction, such as highways, airports and government buildings, relatively insignificant sales are made directly to federal, state, county or municipal governments/agencies. Therefore, although reductions in state and federal funding can curtail publicly funded construction, our business is not directly subject to renegotiation of profits or termination of contracts with state or federal governments.
ENVIRONMENTAL COSTS AND GOVERNMENTAL REGULATION
Our operations are subject to numerous federal, state and local laws and regulations relating to the protection of the environment and worker health and safety; examples include regulation of facility air emissions and water discharges, waste management, protection of wetlands, listed and threatened species, noise and dust exposure control for workers, and safety regulations under both Mine Safety and Health Administration (MSHA) and Occupational Safety and Health Administration (OSHA). Compliance with these various regulations requires a substantial capital investment, and ongoing expenditures for the operation and maintenance of systems and implementation of programs. We estimate that capital expenditures for environmental control facilities in 2016 and 2017 will be approximately $12.5 million and $15.4 million, respectively. These anticipated expenditures are not expected to have a material impact on our earnings or competitive position.
Frequently, we are required by state and local regulations or contractual obligations to reclaim our former mining sites. These reclamation liabilities are recorded in our financial statements as a liability at the time the obligation arises. The fair value of such obligations is capitalized and depreciated over the estimated useful life of the owned or leased site. The liability is accreted through charges to operating expenses. To determine the fair value, we estimate the cost for a third party to perform the legally required reclamation, which is adjusted for inflation and risk and includes a reasonable profit margin. All reclamation obligations are reviewed at least annually. Reclaimed quarries often have potential for use in commercial or residential development or as reservoirs or landfills. However, no projected cash flows from these anticipated uses have been considered to offset or reduce the estimated reclamation liability.
For additional information regarding reclamation obligations (referred to in our financial statements as asset retirement obligations), see Notes 1 and 17 to the consolidated financial statements in Item 8 "Financial Statements and Supplementary Data."
PATENTS AND TRADEMARKS
We do not own or have a license or other rights under any patents, registered trademarks or trade names that are material to any of our reporting segments.
OTHER INFORMATION REGARDING VULCAN
Vulcan is a New Jersey corporation incorporated on February 14, 2007, while its predecessor company was incorporated on September 27, 1956. Our principal sources of energy are electricity, diesel fuel, natural gas and coal. We do not anticipate any difficulty in obtaining sources of energy required for operation of any of our reporting segments in 2016.
As of January 1, 2016, we employed 6,799 people in the United States. Of these employees, 589 are represented by labor unions. Also, as of that date, we employed 387 people in Mexico and 1 in the Bahamas, 315 of whom are represented by a labor union. We do not anticipate any significant issues with any unions in 2016.
We do not use a backlog of orders to evaluate and understand our business at a Company level.
| Part I | 14 |
EXECUTIVE OFFICERS OF THE REGISTRANT
The names, positions and ages, as of February 20, 2016, of our executive officers are as follows:
| __ | ||
|---|---|---|
| Name | Position | Age |
| J. Thomas Hill | Chairman and Chief Executive Officer | 56 |
| John R. McPherson | Executive Vice President, Chief Financial and Strategy Officer | 47 |
| Stanley G. Bass | Chief Growth Officer | 54 |
| Michael R. Mills | Chief Administrative Officer | 55 |
| Jerry F. Perkins | General Counsel | 46 |
| David P. Clement | President – Central Division | 55 |
| William K. Duke | President – Mideast Division | 60 |
| David J. Grayson | President – Southeast Division | 57 |
| C. Brockway Lodge, Jr. | President – Western Division | 43 |
| Jeffery G. Lott | President – Southwest Division | 57 |
| David B. Pasley | President – Mountain West Division | 57 |
| Jason B. Teter | President – Southern and Gulf Coast Division | 41 |
| Ejaz A. Khan | Vice President, Controller and Chief Information Officer | 58 |
The principal occupations of the executive officers during the past five years are set forth below:
J. Thomas Hill was elected Chairman of the Board of Directors effective January 1, 2016. He was elected President and Chief Executive Officer in July 2014. Prior to that he served as Executive Vice President and Chief Operating Officer (January 2014 – July 2014), Senior Vice President – South Region (December 2011 – December 2013) and President, Florida Rock Division (September 2010 – December 2011).
John R. McPherson was elected Executive Vice President, Chief Financial and Strategy Officer in July 2014. Prior to that he served as Executive Vice President and Chief Financial Officer (January 2014 – July 2014), Senior Vice President – East Region (November 2012 – December 2013) and Senior Vice President, Strategy and Business Development (October 2011 – November 2012). Before joining Vulcan in October 2011, Mr. McPherson was a senior partner at McKinsey & Company, a global management consulting firm, from 1995 to 2011.
Stanley G. Bass was elected Chief Growth Officer in February 2016. He served as Senior Vice President – Western and Mountain West Divisions from January 2015 to February 2016. He served as Senior Vice President – West Region from September 2013 to December 2014. Prior to that, he served as Senior Vice President – Central and West Regions (February 2013 – September 2013), Senior Vice President – Central Region (December 2011 – February 2013) and President, Midsouth and Southwest Divisions (September 2010 – December 2011).
Michael R. Mills was elected Chief Administrative Officer in February 2016. He served as Senior Vice President and General Counsel from November 2012 to February 2016; and as Senior Vice President – East Region from December 2011 to October 2012. Prior to that, he was President, Southeast Division.
Jerry F. Perkins, Jr. was elected General Counsel in February 2016. He served as Assistant General Counsel since 2011.
David P. Clement was named President – Central Division effective January 1, 2015. He served as Senior Vice President – Central Region from September 2013 through December 2014. During the five years prior to such role, he served in a number of positions with Vulcan including Vice President and General Manager, Midwest Division and Vice President of Operations, Midwest Division.
William K. Duke was named President – Mideast Division effective January 1, 2015. Prior to that, he served in a number of roles over the past five years for Vulcan, including: Vice President and General Manager, Florida (August 2012 – December 2014) and Vice President and General Manager, Aggregates – Florida Rock Division (January 2010 – August 2012).
| Part I | 15 |
David J. Grayson began serving as President – Southeast Division on January 1, 2015. Before assuming that role, he served as Vice President and General Manager, Georgia for the preceding five years.
C. Brockway (Brock) Lodge, Jr. was named President – Western Division in February 2016. He served as Vice President and General Manager, Western Division from April 2015 to February 2016. Before that, he was Senior Area General Manager – Central Division (June 2013 – March 2015) and Director of Sales and Marketing – Midsouth Division (April 2010 – May 2013).
Jeffery G. Lott was named President – Southwest Division effective January 1, 2015. Prior to that, he served in a number of roles over the past five years for Vulcan, including Vice President and General Manager, Texas (July 2010 – December 2014).
David B. Pasley began serving as President – Mountain West Division in January 2015. Before that, he was Vice President and General Manager of Central and Northern California (February 2013 – December 2014); Vice President and General Manager of Arizona and Central and Northern California (February 2012 – January 2013); and Vice President and General Manager of Arizona and New Mexico (August 2010 – January 2012).
Jason P. Teter began serving as President – Southern and Gulf Coast Division on January 1, 2015. Prior to that, he served as Vice President – Business Development from October 2013 to December 2014. Before joining Vulcan, for four years he was the Vice President and General Manager, Georgia Aggregates for Lafarge North America.
Ejaz A. Khan was elected Vice President and Controller in February 1999. He was elected Chief Information Officer in February 2000.
shareholder return performance presentation
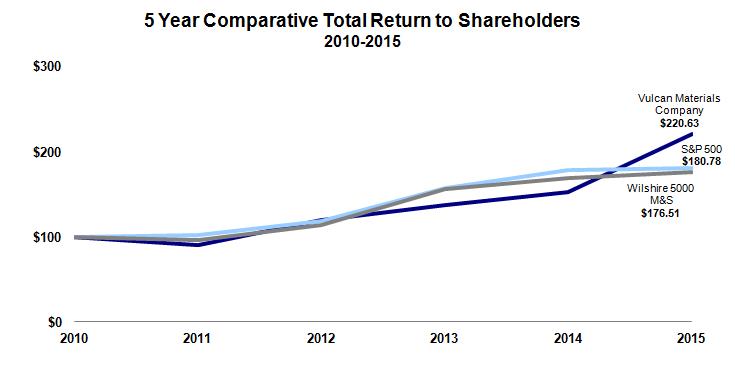
Below is a graph comparing the performance of our common stock, with dividends reinvested, to that of the Standard & Poor’s 500 Stock Index (S&P 500) and the Materials and Services Sector of the Wilshire 5000 Index (Wilshire 5000 M&S) from December 31, 2010 to December 31, 2015. The Wilshire 5000 M&S is a market capitalization weighted sector containing public equities of firms in the Materials and Services sector, which includes our company and approximately 1,300 other companies.
| 2010 | 2011 | 2012 | 2013 | 2014 | 2015 | |||||||||||||||||
| Comparative Total Return 1 | ||||||||||||||||||||||
| Vulcan Materials Company | $ 100.00 | $ 90.60 | $ 119.95 | $ 136.99 | $ 152.06 | $ 220.63 | ||||||||||||||||
| S&P 500 | $ 100.00 | $ 102.11 | $ 118.45 | $ 156.81 | $ 178.28 | $ 180.78 | ||||||||||||||||
| Wilshire 5000 M&S | $ 100.00 | $ 96.60 | $ 114.18 | $ 155.51 | $ 168.42 | $ 176.51 |
| 1 | Assumes an initial investment at December 31, 2010 of $100 in each stock/index, with quarterly reinvestment of dividends. |
| Part I | 16 |
INVESTOR INFORMATION
We make available on our website, www.vulcanmaterials.com, free of charge, copies of our:
| § | Annual Report on Form 10-K |
|---|
| § | Quarterly Reports on Form 10-Q |
|---|
| § | Current Reports on Form 8-K |
|---|
We also provide amendments to those reports filed with or furnished to the Securities and Exchange Commission (SEC) pursuant to Section 13(a) or 15(d) of the Securities Exchange Act of 1934 as well as all Forms 3, 4 and 5 filed with the SEC by our executive officers and directors, as soon as the filings are made publicly available by the SEC on its EDGAR database (www.sec.gov).
The public may read and copy materials filed with the SEC at the Public Reference Room of the SEC at 100 F Street, NE, Washington, D.C. 20549. The public may obtain information on the operation of the Public Reference Room by calling the SEC at 1-800-732-0330. In addition to accessing copies of our reports online, you may request a copy of our Annual Report on Form 10-K, including financial statements, by writing to Jerry F. Perkins Jr., Secretary, Vulcan Materials Company, 1200 Urban Center Drive, Birmingham, Alabama 35242.
We have a:
| § | Business Conduct Policy applicable to all employees and directors |
|---|
| § | Code of Ethics for the CEO and Senior Financial Officers |
|---|
Copies of the Business Conduct Policy and the Code of Ethics are available on our website under the heading "Corporate Governance." If we make any amendment to, or waiver of, any provision of the Code of Ethics, we will disclose such information on our website as well as through filings with the SEC.
Our Board of Directors has also adopted:
| § | Corporate Governance Guidelines |
|---|
| § | Charters for its Audit, Compensation, Executive, Finance, Governance and Safety, Health & Environmental Affairs Committees |
|---|
These documents meet all applicable SEC and New York Stock Exchange (NYSE) regulatory requirements.
The Audit, Compensation and Governance Charters are available on our website under the heading, "Corporate Governance," or you may request a copy of any of these documents by writing to Jerry F. Perkins Jr., Secretary, Vulcan Materials Company, 1200 Urban Center Drive, Birmingham, Alabama 35242.
Information included on our website is not incorporated into, or otherwise made a part of, this report.
CERTIFICATIONS AND ASSERTIONS
The certifications of our Chief Executive Officer and Chief Financial Officer made pursuant to Section 302 of the Sarbanes-Oxley Act of 2002 are included as exhibits to this Annual Report on Form 10-K. Additionally, on June 2, 2015 our Chief Executive Officer submitted to the NYSE the annual written affirmation required by the rules of the NYSE certifying that he was not aware of any violations of Vulcan Materials Company of NYSE corporate governance listing standards.
| Part I | 17 |
Previous: Cover and table of contents · Next: Item 1A. RISK FACTORS