 filings.tools
Item 7. MANAGEMENT'S DISCUSSION AND ANALYSIS OF FINANCIAL CONDITION AND RESULTS OF OPERATIONS
101K characters. Original on sec.gov · Markdown
Item 7. MANAGEMENT'S DISCUSSION AND ANALYSIS OF FINANCIAL CONDITION AND RESULTS OF OPERATIONS
MANAGEMENT'S DISCUSSION AND ANALYSIS OF FINANCIAL CONDITION AND RESULTS OF OPERATIONS
EXECUTIVE SUMMARY
FINANCIAL SUMMARY FOR 2019 (compared to 2018)
Total revenues increased $546.2 million, or 12%, to $4,929.1 million
Gross profit increased $155.0 million, or 14%, to $1,255.9 million
Aggregates segment sales increased $476.6 million, or 14%, to $3,990.3 million
Aggregates segment freight-adjusted revenues increased $346.9 million, or 13%, to $3,014.2 million
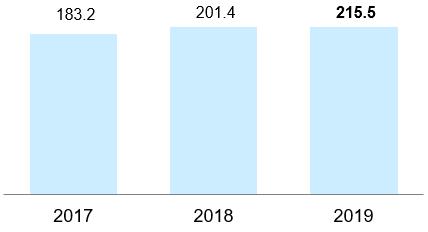
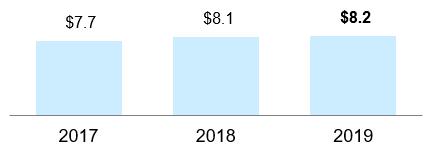
Shipments increased 7%, or 14.1 million tons, to 215.5 million tons
Same-store shipments increased 6%, or 12.2 million tons, to 213.5 million tons
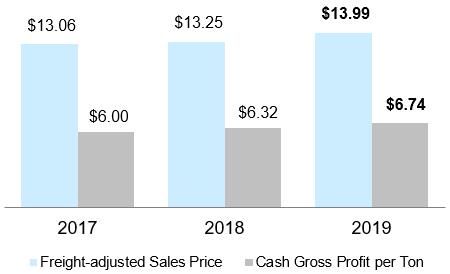
Freight-adjusted sales price increased 6%, or $0.74 per ton
Same-store freight-adjusted sales price increased 6%, or $0.74 per ton
Segment gross profit increased $154.8 million, or 16%, to $1,146.6 million
Asphalt, Concrete and Calcium segment gross profit increased $0.2 million, or 0%, to $109.3 million, collectively
Selling, administrative and general (SAG) expenses increased 11% to $370.5 million and decreased 0.10 percentage points (10 basis points) as a percentage of total revenues
Operating earnings increased $129.7 million, or 17%, to $877.5 million
Earnings from continuing operations before income taxes were $757.7 million compared to $623.3 million
Earnings from continuing operations were $622.5 million, or $4.67 per diluted share, compared to $517.8 million, or $3.87 per diluted share
Discrete items in 2019 include:
pretax gains of $13.4 million for the sale of businesses and property donation
pretax charges of $10.8 million for property donation
pretax charges of $3.0 million for divested operations
pretax charges of $1.7 million associated with non-routine business development
pretax charges of $6.5 million for restructuring
Discrete items in 2018 include:
$0.6 million of tax expense related to the Tax Cuts and Jobs Act (TCJA)
pretax interest charges of $7.4 million related to the January and March early debt retirements
pretax gains of $2.9 million for the sale of businesses
pretax charges of $18.5 million for divested operations
pretax gains of $2.3 million for business interruption claims
pretax charges of $5.2 million associated with non-routine business development
pretax charges of $6.2 million for restructuring
Adjusted (for the discrete pretax items noted above) earnings from continuing operations were $4.70 per diluted share, compared to $4.05 per diluted share
Net earnings were $617.7 million, an increase of $101.9 million, or 20%
Adjusted EBITDA was $1,270.0 million, an increase of $138.3 million, or 12%
Returned capital to shareholders via dividends ($164.0 million versus $148.1 million) and share repurchases ($2.6 million versus $134.0 million)
| Part II | 29 |
2019 marked another year of strong earnings growth and cash generation. We are particularly proud of our people who worked hard to achieve these results while ensuring another year of world class safety performance. Widespread improvements in pricing helped drive 8% growth in our industry-leading unit profitability (gross profit per ton) in aggregates and double-digit growth in Adjusted EBITDA. Industry leadership in safety and pace-setting unit margins are both evidence of a strong and healthy business. Going forward, our compounding unit margins and our disciplined capital allocation position us well to increase our cash flows and improve our return on invested capital.
Full year revenues were $4.9 billion, up 12% as compared to the prior year, and net earnings were $617.7 million, an increase of 20%. Adjusted EBITDA increased 12% to $1,270.0 million.
At year end, total debt was $2.8 billion, or 2.2 times 2019 Adjusted EBITDA. Our weighted-average debt maturity was 14 years and the weighted-average interest rate was 4.4%.
As the leading aggregates producer in the U.S., we are well positioned for continued top line growth, particularly as federal, state and local governments increase spending on public infrastructure construction, while demand for private sector projects gain momentum. In addition, our keen focus on operational excellence, cost control and disciplined investment should enable us to enhance profitability and drive sustainable, long-term shareholder value.
CAPITAL ALLOCATION
We will continue to make disciplined investments in organic and acquisition-led growth, while continuing to emphasize capital returns and cost control. We are completely focused on actions that improve returns to our shareholders. We seek continuous, compounding improvement, generating big results through small actions. Our capital allocation priorities remain unchanged:
deploying operating capital to sustain our franchise
maintaining the financial strength and flexibility needed through the cycle
strategic growth through mergers and acquisitions and internal development
returning excess cash to shareholders through a healthy mix of sustainable dividend growth and stock repurchases
Our capital allocation and investment-grade rating priorities remain unchanged. For the full year, capital expenditures were $404.3 million. This amount included $239.3 million of core operating and maintenance capital investments to improve or replace existing property, plant & equipment. In addition, we invested $165.0 million in internal growth projects to secure new aggregates reserves, develop new production sites, enhance our distribution capabilities and support the targeted growth of our asphalt and concrete operations.
We continue to pursue opportunities for value-creating acquisitions, swaps and greenfield investments. We remain active in the pursuit of bolt-on acquisitions and other value-creating growth investments. We closed two business acquisitions during 2019 for total consideration of $45.3 million. These acquisitions strengthened both our aggregates position in Tennessee and our ready-mixed concrete position in Virginia.
During 2019, we returned $166.6 million to our shareholders through dividends and share repurchases.
For a detailed discussion of our acquisitions and divestitures, see Note 19 “Acquisitions and Divestitures” in Item 8 “Financial Statements and Supplementary Data.”
| Part II | 30 |
MARKET DEVELOPMENTS AND OUTLOOK
Demand in our markets will continue to benefit from higher levels of highway funding and continued growth in residential and nonresidential markets. Residential construction should continue to strengthen after some softness in certain of our markets during the second half of 2019. Private nonresidential construction activity should also improve as leading indicators point to positive growth in 2020. Demand fundamentals, including population and employment growth, continue to support longer-term growth in residential and nonresidential construction.
We are seeing a positive pricing environment driven by shipment momentum in private demand and visibility of public demand. This visibility to demand growth sets the stage for solid price improvement in 2020. Price improvement coupled with our four strategic initiatives (operational excellence, strategic sourcing, commercial excellence and logistics innovation) should continue to increase unit profitability.
Management expectations for 2020 include:
Aggregates shipments growth of 2% to 4%
Aggregates freight-adjusted price increase of 4% to 6%
Collective Asphalt, Concrete and Calcium segment gross profit growth of 10% to 15%
SAG expenses of approximately $365 million
Interest expense of approximately $125 million
Depreciation, depletion, accretion and amortization expense of approximately $385 million
An effective tax rate of approximately 20%
Earnings from continuing operations of $5.20 to $5.80 per diluted share
Net earnings of $695 million to $775 million
Adjusted EBITDA of $1.385 billion to $1.485 billion
Additionally, we expect to spend approximately $275 million on maintenance capital and $200 million for internal growth projects that are largely underway.
In summary, we expect another year of strong earnings growth in 2020. Vulcan-served markets should continue to benefit from robust public construction demand, led by higher levels of highway funding in our key states. Our focus remains the same — compounding our unit margins through all parts of the cycle.
| Part II | 31 |
COMPETITIVE ADVANTAGES
AGGREGATES FOOTPRINT
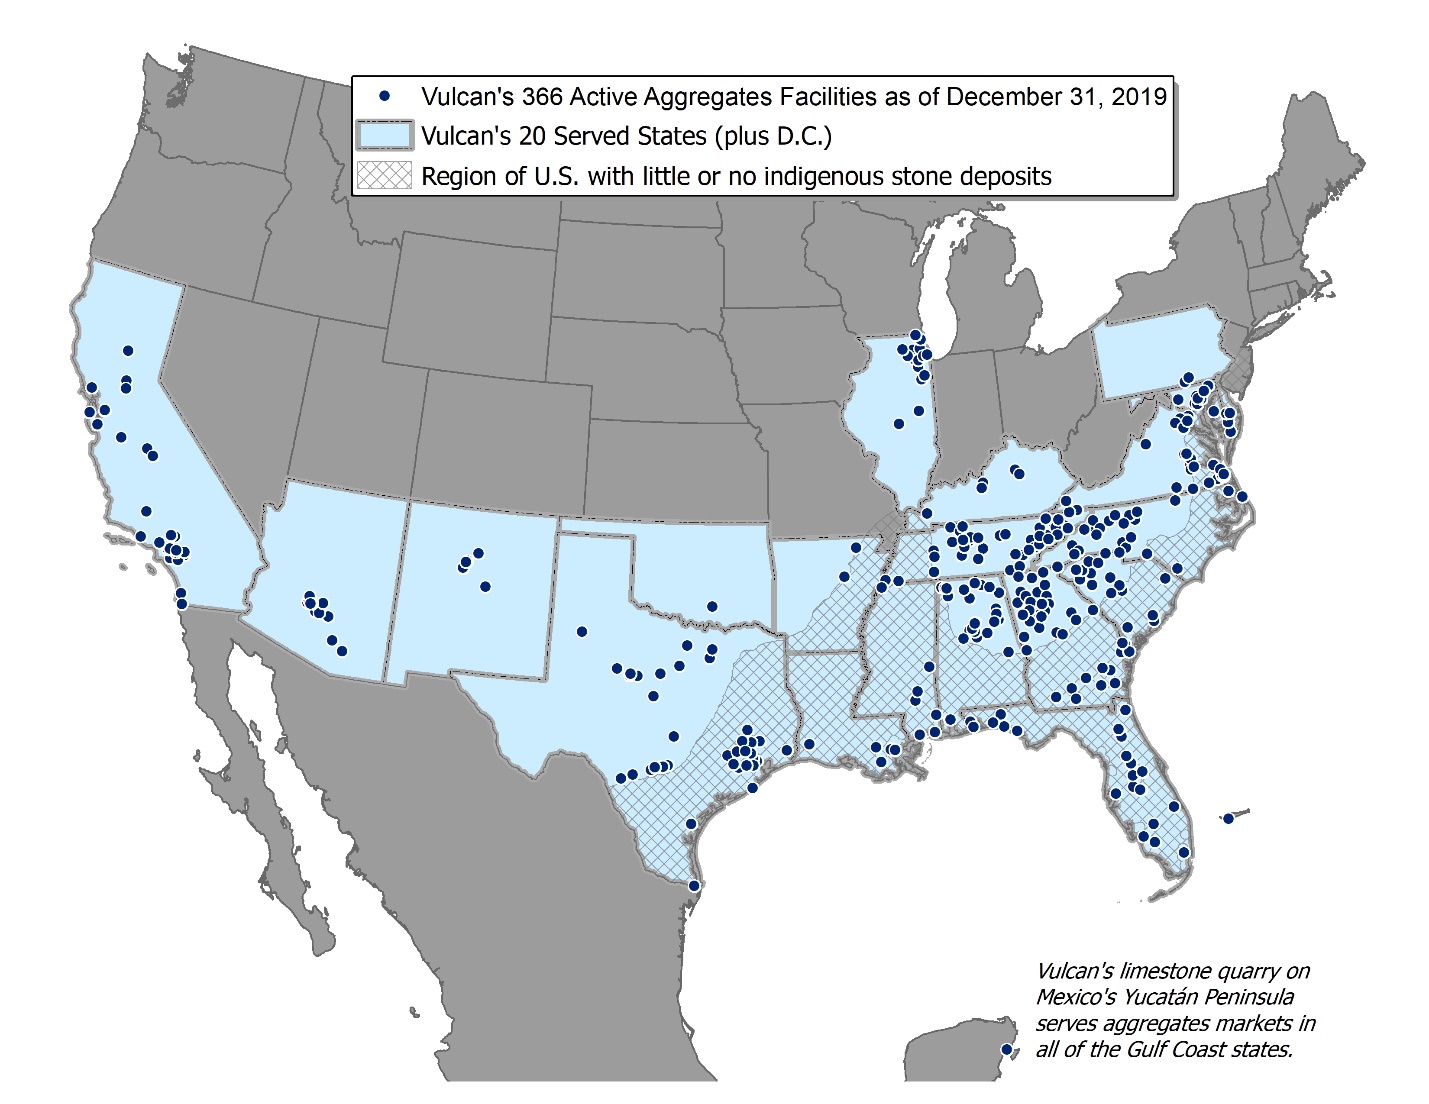
Over time, we have strategically and systematically built one of the most valuable aggregates franchises in the U.S., with a footprint that is impossible to replicate. Zoning and permitting regulations have made it increasingly difficult to expand existing quarries or to develop new quarries. Such regulations, while curtailing expansion, also increase the value of our reserves that were zoned and permitted decades ago.
Demand for aggregates correlates positively with changes in population growth, household formation and employment. We have a coast-to-coast footprint that serves 19 of the top 25 highest-growth metropolitan areas and states where 72% of U.S. population growth from 2020 to 2030 is projected to occur. As state and federal spending increases, Vulcan is poised to benefit greatly from growing private and public demand for aggregates, thereby delivering significant long-term value for our shareholders.
| Part II | 32 |
COMPOUNDING IMPROVEMENT IN PROFITABILITY
We have continued to deliver strong financial performance over time and through business cycles. Through our aggregates-led strategy and focus on our four strategic initiatives — operational excellence, strategic sourcing, commercial excellence and logistics innovation (as outlined in Item 1 “Business” under the “Business Strategy” heading) — we have created one of the most profitable public companies in our industry as measured by aggregates gross profit per ton.

Current economic indicators and market fundamentals point toward continued market growth. We are currently operating considerably below full capacity making us extremely well positioned to further benefit from economies of scale as this growth continues.
SAFETY, HEALTH AND ENVIRONMENTAL PERFORMANCE
A strategy for sustainable, long-term value creation must include doing right by your employees, your neighbors and the environment in which you operate. Over our more than six decades as a public company, we have built a strong, resilient and vital business on this foundation of doing things the right way.
We are a leader in our industry in safety, health and environmental performance, with a safety record substantially better than the industry average. We apply the shared experiences, expertise and resources at each of our locally led sites, with an emphasis on taking care of one another. The result is a record of safety excellence consistently outperforming the industry.
.
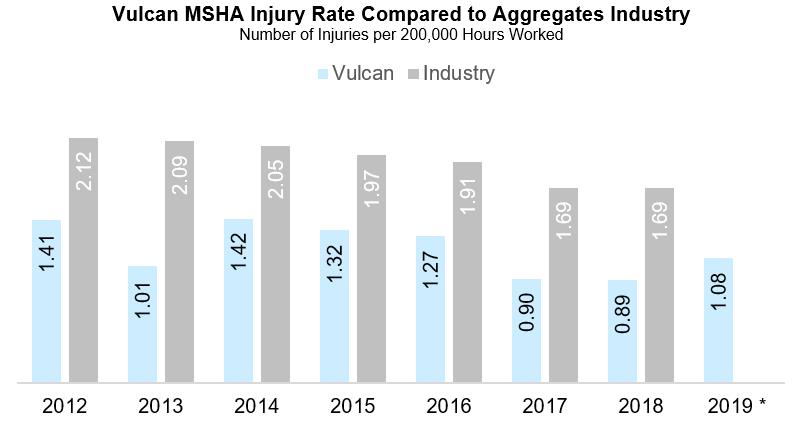
Source: Mine Safety and Health Administration (MSHA) records and Internal Vulcan Data.
| *** | The aggregates industry MSHA injury rate for 2019 was not available as of the filing of this report. |
We focus on our environmental stewardship programs with the same intensity that we bring to our health and safety initiatives resulting in 98% citation-free inspections out of all 2019 federal and state environmental inspections.
| Part II | 33 |
We lead community relations programs that serve our neighbors while ensuring that we grow and thrive in the communities where we operate. During 2019, we operated 40 certified wildlife habitat sites, the third largest number of sites in the nation, as certified by the Wildlife Habitat Council. We conducted tours for more than 25,000 students and neighbors at our operations, partnered with 235 adopted schools, and provided 145 scholarships to students nationwide.
We recognize that the aggregates mining in which we engage is an interim use of the approximately 240,000 acres of land in our portfolio. Our land and water assets will be converted to other valuable uses at the end of mining. Effective management throughout the life cycle of our land — from pre-mining utilization as agriculture and timber development, to post-mining development as water reservoirs or residential and commercial development — not only generates significant additional value for our shareholders but greatly benefits the communities in which we operate.
CUSTOMER SERVICE
More than an aggregates supplier, we are a business dedicated to customer service and finding creative solutions to meet our customers’ needs. Being a valued partner and trusted supplier means that we are providing the right product, with the right specifications, that is the right quality, delivered the right way — on time and safely. Our One-Vulcan, Locally Led approach, in which our employees work together to leverage the size and strengths of Vulcan as a whole, while running their operations with a strong entrepreneurial spirit and sense of ownership, allows us to deliver market-leading services to our customers.
Transportation costs are passed along to our customers, and because aggregates have a very high weight-to-value ratio, those costs can add up quickly when transporting aggregates long distances. Having the most extensive distribution network of any aggregates producer sets us apart. Combining our trucking, rail, barge and ocean vessel shipping logistics capabilities allows us to provide better customer solutions and create a seamless customer experience at a competitive price.

As an approximation, a truck has a capacity of 20-25 tons of aggregates; a railcar has a capacity of 4-5 truckloads; a barge has a capacity of 65 truckloads and our ocean vessels have the capacity of 2,500 truckloads.
| Part II | 34 |
STRONG FINANCIAL FOUNDATION
Our strong balance sheet gives us the financial flexibility to implement our strategy and initiatives and allows us to negotiate from a position of strength. We have a well-established set of priorities with respect to capital allocation, as follows:
1.Operating Capital (maintain and grow value of franchise)
2.Growth Capital (including greenfields and business acquisitions)
3.Dividend Growth with Earnings (with a keen focus on sustainability)
4.Return Excess Cash to Shareholders (primarily via share repurchases)
Our first and highest use of cash is to maintain and protect our valuable franchise by keeping our operations in good working order to ensure the timely delivery of goods and services to our customers. This cash use takes the form of operating and maintenance capital and the requirements expand and contract as volume changes.
Our second priority is to grow and expand our franchise. We do this through internal growth projects and business acquisitions. Internal growth projects have generally been among our highest returning projects and include the opening of greenfield production and/or distribution sites and the acquisition of new reserves. For business acquisitions, we tend to look for small bolt-on acquisitions which are easy to integrate and will pursue large business combinations that are the right fit and the right price. We use strategic and returns-based criteria to price potential acquisitions and are disciplined in our approach. We look at a lot of potential acquisitions and only make offers on a few.
Our third priority is dividend growth to a level that we confidently believe we can maintain through the cycle.
And finally, if there is excess cash after fulfilling the first three capital allocation priorities, we will consider returning cash to shareholders via share repurchases.
Additionally, our leverage, as measured by total debt to Adjusted EBITDA, has improved from 6.5x at December 31, 2012 to 2.2x as of December 31, 2019, well within our stated leverage target of 2.0 to 2.5x. Over that period, we also improved the structure of our debt (average maturity from 7 years to 14 years) and reduced the cost of the debt (weighted average interest rate from 7.55% to 4.36%).

| Part II | 35 |
RESULTS OF OPERATIONS
Total revenues are primarily derived from our product sales of aggregates, asphalt mix and ready-mixed concrete, and include freight & delivery costs that we pass along to our customers to deliver these products. We also generate service revenues from our asphalt construction paving business and services related to our aggregates business. We present separately our discontinued operations, which consists of our former Chemicals business.
The following table highlights significant components of our consolidated operating results including EBITDA and Adjusted EBITDA.
CONSOLIDATED OPERATING RESULTS HIGHLIGHTS
| For the years ended December 31 | 2019 | 2018 | 2017 | |||||||
| in millions, except unit and per share data | ||||||||||
| Total revenues | $ 4,929.1 | $ 4,382.9 | $ 3,890.3 | |||||||
| Cost of revenues | 3,673.2 | 3,282.0 | 2,896.8 | |||||||
| Gross profit | $ 1,255.9 | $ 1,100.9 | $ 993.5 | |||||||
| Gross profit margin | 25.5% | 25.1% | 25.5% | |||||||
| Selling, administrative and general expenses (SAG) | $ 370.5 | $ 333.4 | $ 325.0 | |||||||
| SAG as a percentage of total revenues | 7.5% | 7.6% | 8.4% | |||||||
| Operating earnings | $ 877.5 | $ 747.7 | $ 639.0 | |||||||
| Interest expense | $ 130.2 | $ 138.0 | $ 295.5 | |||||||
| Earnings from continuing operations | ||||||||||
| before income taxes | $ 757.7 | $ 623.3 | $ 361.3 | |||||||
| Earnings from continuing operations | $ 622.5 | $ 517.8 | $ 593.4 | |||||||
| Earnings (loss) on discontinued operations, net of income taxes | (4.8) | (2.0) | 7.8 | |||||||
| Net earnings | $ 617.7 | $ 515.8 | $ 601.2 | |||||||
| Diluted earnings (loss) per share | ||||||||||
| Continuing operations | $ 4.67 | $ 3.87 | $ 4.40 | |||||||
| Discontinued operations | (0.04) | (0.02) | 0.06 | |||||||
| Diluted net earnings per share | $ 4.63 | $ 3.85 | $ 4.46 | |||||||
| EBITDA 1 | $ 1,261.3 | $ 1,107.0 | $ 958.4 | |||||||
| Adjusted EBITDA 1 | $ 1,270.0 | $ 1,131.7 | $ 981.9 | |||||||
| Average Sales Price and Unit Shipments | ||||||||||
| Aggregates | ||||||||||
| Tons (thousands) | 215,465 | 201,375 | 183,179 | |||||||
| Freight-adjusted sales price | $ 13.99 | $ 13.25 | $ 13.06 | |||||||
| Asphalt Mix | ||||||||||
| Tons (thousands) | 12,665 | 11,318 | 10,892 | |||||||
| Average sales price | $ 57.79 | $ 55.13 | $ 52.23 | |||||||
| Ready-mixed concrete | ||||||||||
| Cubic yards (thousands) | 3,104 | 3,223 | 3,568 | |||||||
| Average sales price | $ 126.38 | $ 123.35 | $ 116.45 | |||||||
| Calcium | ||||||||||
| Tons (thousands) | 294 | 285 | 273 | |||||||
| Average sales price | $ 27.85 | $ 28.44 | $ 28.26 |
| 1 | Non-GAAP measures are defined and reconciled within this Item 7 under the caption Reconciliation of Non-GAAP Measures. |
| Part II | 36 |
Net earnings for 2019 were $617.7 million ($4.63 per diluted share) compared to $515.8 million ($3.85 per diluted share) in 2018 and $601.2 million ($4.46 per diluted share) in 2017. Each year's results were impacted by discrete items, as follows:
Earnings for 2019 include:
pretax gains of $13.4 million related to the sale of real estate and businesses
pretax charges of $10.8 million for property donation
pretax charges of $3.0 million associated with divested operations
pretax charges of $1.7 million associated with non-routine business development
pretax charges of $6.5 million for restructuring
Earnings for 2018 include:
$0.6 million of tax expense related to TCJA
pretax gains of $2.9 million related to the sale of businesses
pretax charges of $18.5 million associated with divested operations
pretax gains of $2.3 million for business interruption claims
pretax charges of $5.2 million associated with non-routine business development
pretax charges of $6.2 million for restructuring
pretax interest charges of $7.4 million related to early debt retirements
Earnings for 2017 include:
$297.0 million of net tax benefits (TCJA — $268.2 million, and partial release of the Alabama NOL carryforward valuation allowance — $28.8 million)
pretax gains of $10.5 million related to the sale of real estate and businesses
pretax charges of $4.3 million for property donation
pretax charges of $18.1 million associated with divested operations
pretax charges of $6.7 million for one-time employee bonuses
pretax charges of $3.1 million associated with non-routine business development, net of an asset purchase agreement termination fee
pretax charges of $1.9 million for restructuring
a pretax loss on debt purchases of $148.0 million presented as a component of interest expense
EARNINGS FROM CONTINUING OPERATIONS BEFORE INCOME TAXES
Year-over-year changes in earnings from continuing operations before income taxes are summarized below:
| in millions | |||||||
| 2017 | $ 361.3 | 2018 | $ 623.3 | ||||
| Higher aggregates gross profit | 137.3 | 154.8 | |||||
| Higher (lower) asphalt gross profit | (34.8) | 6.5 | |||||
| Higher (lower) concrete gross profit | 4.7 | (6.7) | |||||
| Higher calcium gross profit | 0.2 | 0.4 | |||||
| Higher selling, administrative and general expenses | (8.4) | (37.2) | |||||
| Higher (lower) gain on sale of property, plant & equipment and businesses | (2.9) | 8.8 | |||||
| Lower interest expense | 157.5 | 7.8 | |||||
| All other | 8.4 | 0.0 | |||||
| 2018 | $ 623.3 | 2019 | $ 757.7 |
| Part II | 37 |
OPERATING RESULTS BY SEGMENT
We present our results of operations by segment at the gross profit level. We have four operating (and reportable) segments organized around our principal product lines: (1) Aggregates, (2) Asphalt, (3) Concrete and (4) Calcium. Management reviews earnings for our reporting segments principally at the gross profit level.
1. AGGREGATES
Our year-over-year aggregates shipments:
increased 7% in 2019
increased 10% in 2018 1
increased 1% in 2017
| 1 | Of the 10% increase in 2018 shipments, 3% was attributable to the fourth quarter 2017 acquisition of Aggregates USA. |
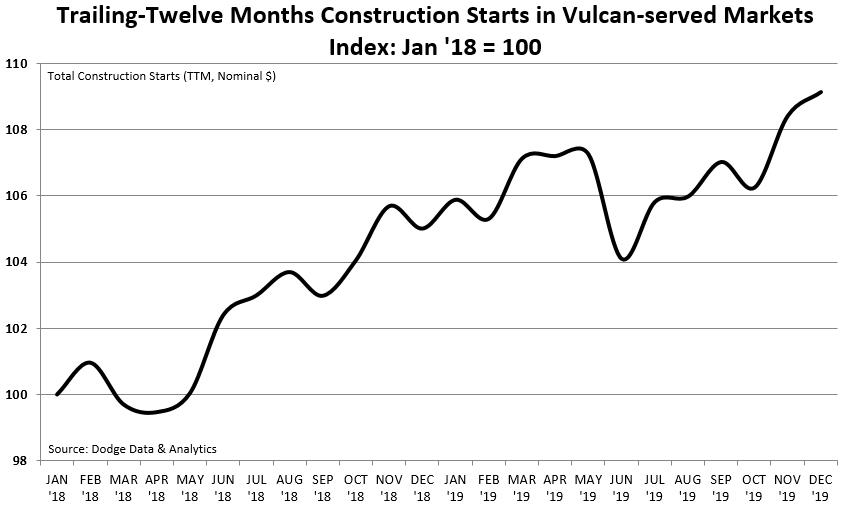
Aggregates shipments increased 7% (6% same-store) led by double-digit growth in Alabama, Texas and Virginia. Vulcan-served markets benefitted from strong public construction demand, led by significantly higher levels of highway funding in our key states. Conversely, residential construction in our markets experienced a slowdown during the second half of 2019. We expect both residential and private nonresidential construction to improve in 2020 as leading indicators point to their growth potential.
Our year-over-year freight-adjusted selling price1 for aggregates:
increased 5.6% in 2019
increased 1.5% in 2018
increased 3.2% in 2017
| 1 | We routinely arrange the delivery of our aggregates to the customer. Additionally, we incur freight costs to move aggregates from the production site to remote distribution sites. These costs are passed on to our customers in the aggregates price. We remove these pass-through freight & delivery revenues (and any other aggregates-derived revenues, such as landfill tipping fees) from the freight-adjusted selling price for aggregates. See the Reconciliation of Non-GAAP Financial Measures within this Item 7 for a reconciliation of freight-adjusted revenues. |
| Part II | 38 |
Aggregates freight-adjusted pricing increased 5.6%, or $0.74 per ton, with widespread improvement throughout our key markets. On a mix-adjusted basis, price increased 5.2% versus the prior year. Our disciplined approach to pricing and execution positions us well for compounding improvement. Demand growth in our markets continues to benefit from higher levels of highway funding while leading indicators for private construction point towards a return to growth in 2020. Positive trends in booking pace, along with visibility of public demand and shipment momentum in private demand should help drive sales price increases into 2020.
| AGGREGATES SEGMENT SALES ANDFREIGHT-ADJUSTED REVENUES | AGGREGATES GROSS PROFIT ANDCASH GROSS PROFIT |
| in millions | in millions |
 |  |
| AGGREGATES UNIT SHIPMENTS | AGGREGATES SELLING PRICE ANDCASH GROSS PROFIT PER TON | ||
| tons, in millions | Freight-adjusted average sales price per ton 1 | ||
 |  | ||
| 1 | Freight-adjusted sales price is calculated as freight-adjusted revenues divided by aggregates unit shipments |
Unit cost of sales (freight-adjusted) increased 4% (same-store +4%) versus the prior year. Unit profitability (as measured by gross profit per ton) grew by 8% to $5.32 per ton. We remain focused on compounding unit margins in order to achieve the 12% compound annual growth realized since the recovery began in the second half of 2013.
Incremental gross profit as a percentage of segment sales excluding freight & delivery was 44%. On a same-store basis, this metric at 48% was below our longer-term expectations of 60% due to the aforementioned increase in unit cost of sales. We evaluate this metric on a trailing-twelve month basis as quarterly gross profit flow-through rates can vary widely from quarter to quarter.
| Part II | 39 |
2. ASPHALT
Our year-over-year asphalt mix shipments:
increased 12% in 2019
increased 4% in 2018 1
increased 14% in 2017 2
| 1 | The 4% increase in asphalt mix shipments in 2018 was attributable to first and second quarter 2018 acquisitions of asphalt mix operations and construction paving businesses in Alabama and Texas, coupled with the fourth quarter 2017 swap of our concrete operations for asphalt operations in Arizona. Same-store declined 2%. |
| 2 | The 14% increase in asphalt mix shipments in 2017 was largely attributable to a first quarter 2017 acquisition of asphalt mix operations and a construction paving business in Tennessee. |
Asphalt segment gross profit of $63.0 million was $6.5 million or 12% higher than 2018. Asphalt mix shipments increased 12% (+10% same-store) while selling prices increased 4.8%, or $2.66 per ton. The average unit cost for liquid asphalt was 6% higher than 2018, negatively affecting earnings by $15.7 million. Material margins declined $0.28 per ton, or approximately $3.5 million, as higher prices partially offset the effect of higher liquid asphalt costs. Higher volume drove the increase in gross profit from 2018.
| ASPHALT SEGMENT SALES | ASPHALT GROSS PROFIT ANDCASH GROSS PROFIT |
| in millions | in millions |
 |  |
| Part II | 40 |
3. CONCRETE
Our year-over-year ready-mixed concrete shipments:
decreased 4% in 2019
decreased 10% in 2018 1
increased 19% in 2017 2
| 1 | The 10% decrease in ready-mixed concrete shipments in 2018 was attributable to the March 2018 disposition of ready-mixed concrete facilities in Georgia, and the fourth quarter 2017 swap of our concrete operations for asphalt operations in Arizona. |
| 2 | Of the 19% increase in ready-mixed concrete shipments in 2017, 9% was attributable to a March 2017 acquisition of ready-mixed concrete facilities in California. |
Concrete segment gross profit was $43.2 million, down 14% from 2018 on a 4% decline in shipments (2% same-store). While material margins per cubic yard improved 2% (2% same-store), unit profitability (as measured by gross profit per cubic yard) declined 10% (12% same-store) due primarily to reduced volume leverage on fixed cost.
| CONCRETE SEGMENT SALES | CONCRETE GROSS PROFIT ANDCASH GROSS PROFIT |
| in millions | in millions |
 |  |
4. CALCIUM
Calcium segment gross profit increased 13% from 2018 to $3.1 million.
| CALCIUM SEGMENT SALES | CALCIUM GROSS PROFIT ANDCASH GROSS PROFIT |
| in millions | in millions |
 |  |
In total, the 2019 gross profit contribution from our three non-aggregates (Asphalt, Concrete and Calcium) segments was $109.3 million, a $0.2 million increase over 2018, and a $29.7 million or 21% decrease from 2017.
| Part II | 41 |
SELLING, ADMINISTRATIVE AND GENERAL (SAG) EXPENSES
in millions

As a percentage of total revenues, SAG expense was:
7.5% in 2019 — decreased 0.10 percentage points (10 basis points)
7.6% in 2018 — decreased 0.75 percentage points (75 basis points)
8.4% in 2017 — decreased 0.45 percentage points (45 basis points)
Our comparative total company employment levels at year end:
increased 6% in 2019
increased 6% in 2018
increased 11% in 2017
Increases in our employment levels were partially driven by our acquisitions (see Note 19 “Acquisitions and Divestitures” in Item 8 “Financial Statements and Supplementary Data”). As noted above, 2019 SAG expenses were $370.5 million or 7.5% as a percentage of total revenues, down from 7.6% in 2018. We remain focused on further leveraging our overhead structure.
GAIN ON SALE OF PROPERTY, PLANT & EQUIPMENT AND BUSINESSES
in millions

The 2019 gain on sale of property, plant & equipment and businesses of $23.8 million includes: (1) $4.1 million of pretax gain from the sale of two aggregates operations in Georgia, (2) the reversal of a contingent payable related to the 2017 Department of Justice required divestiture of former Aggregates USA operations and (3) $9.3 million of pretax gain related to property donations. The 2018 gain on sale of property, plant & equipment and businesses of $14.9 million includes $2.9 million of pretax gain from the sale of our ready-mixed concrete operations in Georgia, $3.8 million of pretax gain related to the sale of mitigation credits and $1.3 million of pretax gain from the sale of one of the replaced self-unloading ships. The 2017 gain on sale of property, plant & equipment and businesses of $17.8 million includes $8.0 million of pretax gain from a swap of ready-mixed concrete operations for an asphalt operation (all in Arizona) and $2.5 million of pretax gain related to a property donation. See Note 19 “Acquisitions and Divestitures” in Item 8 “Financial Statements and Supplementary Data.”
| Part II | 42 |
OTHER OPERATING EXPENSE, NET
Other operating expense, which has an approximate run-rate of $12.0 million a year (exclusive of discrete items), is composed of various operating items not specifically presented in the accompanying Consolidated Statements of Comprehensive Income. The total other operating expense, net and significant items included in the total were:
$31.6 million in 2019 — includes discrete items as follows:
$10.8 million of charges related to property donations
$3.0 million of charges associated with divested operations, composed entirely of environmental liability accruals associated with previously divested properties
$6.5 million of managerial restructuring charges
$34.8 million in 2018 — includes discrete items as follows:
$5.2 million of non-routine business development charges
$18.5 million of charges associated with divested operations
$6.2 million of managerial restructuring charges
$47.3 million in 2017 — includes discrete items as follows:
$3.1 million of non-routine business development charges, net of a termination fee. These net charges were composed of $11.1 million of non-routine business development charges partially offset by an $8.0 million credit related to an asset purchase agreement termination fee
$18.1 million of charges associated with divested operations including $16.6 million of environmental liability accruals related to the Hewitt Landfill matter (see Note 12 “Commitments and Contingencies” in Item 8 “Financial Statements and Supplementary Data”)
$6.7 million of one-time cash bonuses for non-incentive eligible employees ($1,000 per employee)
$4.3 million of charges related to a property donation
OTHER NONOPERATING INCOME, NET
Other nonoperating income (2019 — $9.2 million, 2018 — $13.0 million and 2017 — $13.4 million) is composed primarily of pension and postretirement benefit costs (excluding service costs), foreign currency transaction gains/losses, Rabbi Trust gains/losses and net earnings/losses of nonconsolidated equity method investments.
| Part II | 43 |
INTEREST EXPENSE
in millions

Interest expense was $130.2 million in 2019 compared to $138.0 million in 2018 and $295.5 million in 2017. Interest expense for 2017 included $148.0 million of charges related to the 2017 debt purchases. See Note 6 “Debt” in Item 8 “Financial Statements and Supplementary Data” for additional discussion.
INCOME TAXES
Our income tax expense (benefit) from continuing operations for the years ended December 31 is shown below:
| dollars in millions | 2019 | 2018 | 2017 | |||||||
| Earnings from continuing operations | ||||||||||
| before income taxes | $ 757.7 | $ 623.3 | $ 361.3 | |||||||
| Income tax expense (benefit) | $ 135.2 | $ 105.4 | $ (232.1) | |||||||
| Effective tax rate | 17.8% | 16.9% | -64.2% |
The $29.8 million increase in our 2019 income tax expense was primarily related to an increase in earnings.
The $337.5 million increase in our 2018 income tax expense was primarily due to $297.0 million of net discrete tax benefits recorded in the fourth quarter of 2017. These discrete items were composed of two tax benefits: (1) a $301.6 million remeasurement of our deferred tax assets and liabilities at the new 21% federal corporate income tax rate and (2) a $28.8 million partial release of our Alabama NOL carryforward valuation allowance which were partially offset by two tax charges: (1) $21.1 million of lost tax benefits associated with tax deductions accelerated into 2017 (e.g., lost U.S. production deduction) and (2) a $12.3 million tax expense for the one-time Deemed Repatriation Transition Tax
See Note 9 “Income Taxes” in Item 8 “Financial Statements and Supplementary Data.”
DISCONTINUED OPERATIONS
Pretax earnings (loss) from discontinued operations were:
$(6.5) million in 2019
$(2.7) million in 2018
$13.0 million in 2017
Pretax earnings (loss) from discontinued operations for 2019, 2018 and 2017, resulted primarily from general and product liability costs, including legal defense costs and environmental remediation costs associated with our former Chemicals business. The 2017 results also include insurance recoveries from previously incurred general liability costs. For additional information about discontinued operations, see Note 1 “Summary of Significant Accounting Policies” in Item 8 “Financial Statements and Supplementary Data” under the caption Discontinued Operations.
| Part II | 44 |
RECONCILIATION OF NON-GAAP FINANCIAL MEASURES
SAME-STORE
We have provided certain information on a same-store basis. When discussing our financial results in comparison to prior periods, we may exclude the operating results of recently acquired/divested businesses that do not have comparable results in the periods being discussed. These recently acquired/divested businesses are disclosed in Note 19 “Acquisitions and Divestitures” in Item 8 “Financial Statements and Supplementary Data.” This approach allows us to evaluate the performance of our operations on a comparable basis. We believe that measuring performance on a same-store basis is useful to investors because it enables evaluation of how our operations are performing period over period without the effects of acquisition and divestiture activity. Our same-store information may not be comparable to similar measures used by other companies.
AGGREGATES SEGMENT FREIGHT-ADJUSTED REVENUES
Aggregates segment freight-adjusted revenues is not a Generally Accepted Accounting Principle (GAAP) measure. We present this measure as it is consistent with the basis by which we review our operating results. We believe that this presentation is consistent with our competitors and meaningful to our investors as it excludes revenues associated with freight & delivery, which are pass-through activities. It also excludes immaterial other revenues related to services, such as landfill tipping fees, that are derived from our aggregates business. Additionally, we use this metric as the basis for calculating the average sales price of our aggregates products. Reconciliation of this metric to its nearest GAAP measure is presented below:
| in millions, except per ton data | 2019 | 2018 | 2017 | |||||||
| Aggregates segment | ||||||||||
| Segment sales | $ 3,990.3 | $ 3,513.6 | $ 3,096.1 | |||||||
| Less | ||||||||||
| Freight & delivery revenues 1 | 921.1 | 796.9 | 670.7 | |||||||
| Other revenues | 55.0 | 49.4 | 32.7 | |||||||
| Freight-adjusted revenues | $ 3,014.2 | $ 2,667.3 | $ 2,392.7 | |||||||
| Unit shipments - tons | 215.5 | 201.4 | 183.2 | |||||||
| Freight-adjusted sales price | $ 13.99 | $ 13.25 | $ 13.06 |
| 1 | At the segment level, freight & delivery revenues include intersegment freight & delivery (which are eliminated at the consolidated level) and freight to remote distribution sites. |
| Part II | 45 |
AGGREGATES SEGMENT INCREMENTAL GROSS PROFIT
Aggregates segment incremental gross profit flow-through rate is not a GAAP measure and represents the year-over-year change in gross profit divided by the year-over-year change in segment sales excluding freight & delivery (revenues and costs). We present this metric as it is consistent with the basis by which we review our operating results. We believe that this presentation is consistent with our competitors and meaningful to our investors as it excludes revenues associated with freight & delivery, which are pass-through activities. Reconciliation of this metric to its nearest GAAP measure is presented below:
MARGIN IN ACCORDANCE WITH GAAP
| dollars in millions | 2019 | 2018 | 2017 | |||||||
| Aggregates segment | ||||||||||
| Gross profit | $ 1,146.6 | $ 991.9 | $ 854.5 | |||||||
| Segment sales | $ 3,990.3 | $ 3,513.6 | $ 3,096.1 | |||||||
| Gross profit margin | 28.7% | 28.2% | 27.6% | |||||||
| Incremental gross profit margin | 32.5% | 32.9% |
FLOW-THROUGH RATE (NON-GAAP)
| dollars in millions | 2019 | 2018 | ||||||||
| Aggregates segment | ||||||||||
| Gross profit | $ 1,146.6 | $ 991.9 | ||||||||
| Less: Contribution from acquisitions (same-store) | 2.1 | 0.1 | ||||||||
| Same-store gross profit | $ 1,144.5 | $ 991.8 | ||||||||
| Segment sales | $ 3,990.3 | $ 3,513.6 | ||||||||
| Less: Freight & delivery revenues 1 | 921.1 | 796.9 | ||||||||
| Segment sales excluding freight & delivery | $ 3,069.2 | $ 2,716.7 | ||||||||
| Less: Contribution from acquisitions (same-store) | 35.2 | 1.6 | ||||||||
| Same-store segment sales excluding freight & delivery | $ 3,034.0 | $ 2,715.1 | ||||||||
| Gross profit flow-through rate | 37.4% | 36.5% | ||||||||
| Same-store gross profit flow-through rate | 37.7% | 36.5% | ||||||||
| Incremental gross profit flow-through rate | 43.9% | 47.1% | ||||||||
| Same-store incremental gross profit flow-through rate | 47.9% | 64.2% |
| 1 | At the segment level, freight & delivery revenues include intersegment freight & delivery (which are eliminated at the consolidated level) and freight to remote distribution sites. |
| Part II | 46 |
CASH GROSS PROFIT
GAAP does not define “cash gross profit,” and it should not be considered as an alternative to earnings measures defined by GAAP. We and the investment community use this metric to assess the operating performance of our business. Additionally, we present this metric as we believe that it closely correlates to long-term shareholder value. We do not use this metric as a measure to allocate resources. Cash gross profit adds back noncash charges for depreciation, depletion, accretion and amortization to gross profit. Aggregates segment cash gross profit per ton is computed by dividing Aggregates segment cash gross profit by tons shipped. Reconciliation of this metric to its nearest GAAP measure is presented below:
| in millions, except per ton data | 2019 | 2018 | 2017 | |||||||
| Aggregates segment | ||||||||||
| Gross profit | $ 1,146.6 | $ 991.9 | $ 854.5 | |||||||
| Depreciation, depletion, accretion and amortization | 305.1 | 281.6 | 245.2 | |||||||
| Aggregates segment cash gross profit | $ 1,451.7 | $ 1,273.5 | $ 1,099.7 | |||||||
| Unit shipments - tons | 215.5 | 201.4 | 183.2 | |||||||
| Aggregates segment gross profit per ton | $ 5.32 | $ 4.93 | $ 4.66 | |||||||
| Aggregates segment cash gross profit per ton | $ 6.74 | $ 6.32 | $ 6.00 | |||||||
| Asphalt segment | ||||||||||
| Gross profit | $ 63.0 | $ 56.5 | $ 91.3 | |||||||
| Depreciation, depletion, accretion and amortization | 35.2 | 31.3 | 25.4 | |||||||
| Asphalt segment cash gross profit | $ 98.2 | $ 87.8 | $ 116.7 | |||||||
| Concrete segment | ||||||||||
| Gross profit | $ 43.2 | $ 49.9 | $ 45.2 | |||||||
| Depreciation, depletion, accretion and amortization | 13.6 | 12.5 | 13.8 | |||||||
| Concrete segment cash gross profit | $ 56.8 | $ 62.4 | $ 59.0 | |||||||
| Calcium segment | ||||||||||
| Gross profit | $ 3.1 | $ 2.7 | $ 2.5 | |||||||
| Depreciation, depletion, accretion and amortization | 0.2 | 0.3 | 0.7 | |||||||
| Calcium segment cash gross profit | $ 3.3 | $ 3.0 | $ 3.2 |
| Part II | 47 |
EBITDA AND ADJUSTED EBITDA
GAAP does not define “Earnings Before Interest, Taxes, Depreciation and Amortization” (EBITDA), and it should not be considered as an alternative to earnings measures defined by GAAP. We use this metric to assess the operating performance of our business and as a basis for strategic planning and forecasting as we believe that it closely correlates to long-term shareholder value. We do not use this metric as a measure to allocate resources. We adjust EBITDA for certain items to provide a more consistent comparison of earnings performance from period to period. Reconciliation of this metric to its nearest GAAP measure is presented below (numbers may not foot due to rounding):
| in millions | 2019 | 2018 | 2017 | |||||||
| Net earnings | $ 617.7 | $ 515.8 | $ 601.2 | |||||||
| Income tax expense (benefit) | 135.2 | 105.4 | (232.1) | |||||||
| Interest expense, net of interest income | 129.0 | 137.6 | 291.1 | |||||||
| (Earnings) loss on discontinued operations, net of tax | 4.8 | 2.0 | (7.8) | |||||||
| EBIT | 886.7 | 760.8 | 652.4 | |||||||
| Depreciation, depletion, accretion and amortization | 374.6 | 346.2 | 306.0 | |||||||
| EBITDA | $ 1,261.3 | $ 1,107.0 | $ 958.4 | |||||||
| Gain on sale of businesses 1 | $ (13.4) | $ (2.9) | $ (10.5) | |||||||
| Property donation | 10.8 | 0.0 | 4.3 | |||||||
| Business interruption claims recovery | 0.0 | (2.3) | 0.0 | |||||||
| Charges associated with divested operations | 3.0 | 18.5 | 18.1 | |||||||
| Business development 2 | 1.7 | 5.2 | 3.1 | |||||||
| One-time employee bonuses | 0.0 | 0.0 | 6.7 | |||||||
| Restructuring charges | 6.5 | 6.2 | 1.9 | |||||||
| Adjusted EBITDA | $ 1,270.0 | $ 1,131.7 | $ 981.9 | |||||||
| Depreciation, depletion, accretion and amortization | 374.6 | 346.2 | 306.0 | |||||||
| Adjusted EBIT | $ 895.4 | $ 785.5 | $ 675.9 |
| 1 | Includes $9.2 million of gains associated with property donations in 2019. The net effect of the 2019 property donation was a loss of $1.6 million. |
| 2 | Represents non-routine charges associated with acquisitions including the cost impact of purchase accounting inventory valuations. |
ADJUSTED DILUTED EPS FROM CONTINUING OPERATIONS
Similar to our presentation of Adjusted EBITDA, we present Adjusted diluted earnings per share (EPS) from continuing operations to provide a more consistent comparison of earnings performance from period to period. This metric is not defined by GAAP and should not be considered as an alternative to earnings measures defined by GAAP. Reconciliation of this metric to its nearest GAAP measure is presented below:
| 2019 | 2018 | 2017 | ||||||||
| Diluted Earnings Per Share | ||||||||||
| Net earnings | $ 4.63 | $ 3.85 | $ 4.46 | |||||||
| Less: Discontinued operations earnings (loss) | (0.04) | (0.02) | 0.06 | |||||||
| Diluted EPS from continuing operations | $ 4.67 | $ 3.87 | $ 4.40 | |||||||
| Items included in Adjusted EBITDA above | 0.03 | 0.14 | 0.11 | |||||||
| Debt refinancing costs | 0.00 | 0.04 | 0.73 | |||||||
| Tax reform | 0.00 | 0.00 | (1.99) | |||||||
| NOL carryforward valuation allowance release | 0.00 | 0.00 | (0.21) | |||||||
| Adjusted diluted EPS - continuing operations | $ 4.70 | $ 4.05 | $ 3.04 |
| Part II | 48 |
2020 PROJECTED EBITDA
The following reconciliation to the mid-point of the range of 2020 Projected EBITDA excludes adjustments (as noted in Adjusted EBITDA above) as they are difficult to forecast (timing or amount). Due to the difficulty of forecasting such adjustments, we are unable to estimate their significance. This metric is not defined by GAAP and should not be considered as an alternative to earnings measures defined by GAAP. Reconciliation of this metric to its nearest GAAP measure is presented below:
| 2020 Projected 1 | ||||
| in millions | Mid-point | |||
| Net earnings | $ 735 | |||
| Income tax expense | 190 | |||
| Interest expense, net of interest income | 125 | |||
| Discontinued operations, net of tax | 0 | |||
| Depreciation, depletion, accretion and amortization | 385 | |||
| Projected EBITDA | $ 1,435 |
| 1 | See the Market Developments and Outlook section (earlier within this Item 7) for the assumptions used to build this projection. |
LIQUIDITY AND FINANCIAL RESOURCES
Our primary sources of liquidity are cash provided by our operating activities and a substantial, committed bank line of credit. Additional sources of capital include access to the capital markets, the sale of surplus real estate, and dispositions of nonstrategic operating assets. We believe these financial resources are sufficient to fund our business requirements for 2020, including:
contractual obligations
capital expenditures
debt service obligations
dividend payments
potential share repurchases
potential acquisitions
Our balanced approach to capital deployment remains unchanged. We intend to balance reinvestment in our business, growth through acquisitions and return of capital to shareholders, while sustaining financial strength and flexibility. In 2019 and 2018, we returned $164.0 million and $148.1 million, respectively, in cash to shareholders through our dividends and $2.6 million and $134.0 million, respectively, through share repurchases.
We actively manage our capital structure and resources in order to balance the cost of capital and the risk of financial stress. We seek to meet these objectives by adhering to the following principles:
maintain substantial bank line of credit borrowing capacity
proactively manage our debt maturity schedule such that repayment/refinancing risk in any single year is low
maintain an appropriate balance of fixed-rate and floating-rate debt
minimize financial and other covenants that limit our operating and financial flexibility
| Part II | 49 |
CASH
Included in our December 31, 2019 cash and cash equivalents and restricted cash balances of $274.5 million is $2.9 million of restricted cash (see Note 1 “Summary of Significant Accounting Policies” in Item 8 “Financial Statements and Supplementary Data” under the caption Restricted Cash).
CASH FROM OPERATING ACTIVITIES
in millions
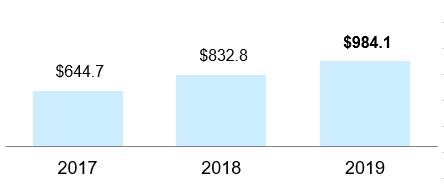
Net cash provided by operating activities is derived primarily from net earnings before noncash deductions for depreciation, depletion, accretion and amortization.
| in millions | 2019 | 2018 | 2017 | |||||||
| Net earnings | $ 617.7 | $ 515.8 | $ 601.2 | |||||||
| Depreciation, depletion, accretion | ||||||||||
| and amortization (DDA&A) | 374.6 | 346.2 | 306.0 | |||||||
| Noncash operating lease expense | 35.3 | 0.0 | 0.0 | |||||||
| Contributions to pension plans | (8.9) | (109.6) | (20.0) | |||||||
| Deferred tax expense (benefit) | 76.0 | 64.6 | (235.7) | |||||||
| Cost of debt purchase | 0.0 | 6.9 | 140.8 | |||||||
| Other operating cash flows, net 1 | (110.6) | 8.9 | (147.6) | |||||||
| Net cash provided by operating activities | $ 984.1 | $ 832.8 | $ 644.7 |
| 1 | Primarily reflects changes to working capital balances. |
2019 versus 2018 — Net cash provided by operating activities was $984.1 million during 2019, a $151.3 million increase compared to 2018. During 2018, we made a $100.0 million discretionary contribution to our qualified pension plans that was deductible for tax purposes in 2017 and early retired debt incurring premium and transactions costs of $6.9 million (which is added back to operating cash flows and reflected as a financing cash outflow). Additionally, as noted in the table above, beginning with our adoption of ASU 2016-02 in 2019 (see Note 1 to the consolidated financial statements), the noncash amortization component of operating lease expense is added back to operating cash flows.
2018 versus 2017 — Net cash provided by operating activities was $832.8 million during 2018, a $188.1 million increase compared to 2017. As noted above, during 2018 we made a $100.0 million discretionary contribution to our qualified pension plans and early retired debt incurring premium and transaction costs of $6.9 million (added back to operating cash flows and reflected as a financing cash outflow). During 2017, we made a discretionary pension plan contribution of $10.6 million and early retired debt incurring premium and transaction costs of $140.8 million which was added back to operating cash flows and is reflected as a financing cash outflow.
| Part II | 50 |
CASH FROM INVESTING ACTIVITIES
in millions

2019 versus 2018 — Net cash used for investing activities was $415.8 million during 2019, a $254.1 million decrease compared to 2018. We invested $384.1 million in our existing operations in 2019, an $85.0 million decrease compared to 2018. Of this $384.1 million, $165.0 million was invested in internal growth projects to enhance our distribution capabilities, develop new production sites and enhance existing production facilities. Additionally, during 2019 we acquired businesses for $44.2 million of cash consideration as compared to $221.4 million of cash consideration for businesses in 2018.
2018 versus 2017 — Net cash used for investing activities was $669.9 million during 2018, a $599.6 million decrease compared to 2017. We invested $469.1 million in our existing operations in 2018, a $9.5 million increase compared to 2017. Of this $469.1 million, $247.4 million was invested in internal growth projects to secure new aggregates reserves, develop new production sites, enhance our distribution capabilities and support the targeted growth of our asphalt and concrete operations. As noted above, acquisitions during 2018 totaled $221.4 million of cash consideration. During 2017, we acquired businesses for $822.4 million (excluding the assets immediately divested in the Aggregates USA acquisition for $287.3 million) of cash consideration (see Note 19 “Acquisitions and Divestitures” in Item 8 “Financial Statements and Supplementary Data”).
CASH FROM FINANCING ACTIVITIES
in millions
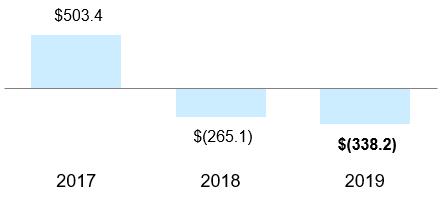
2019 VERSUS 2018 — Net cash used for financing activities in 2019 was $338.2 million, compared to $265.1 million in 2018. The 2019 results include a net $133.0 million payment on our bank line of credit while debt refinancing activities during 2018 netted proceeds of $48.8 million. Additionally, the capital returned to our shareholders decreased by $115.5 million as higher dividends of $15.9 million ($1.24 per share compared to $1.12 per share) were offset by lower share repurchases (18,600 shares @ $139.90 per share compared to 1,191,928 shares @ $112.41 per share).
2018 VERSUS 2017 — Net cash used for financing activities in 2018 was $265.1 million, compared to $503.4 million provided by financing activities in 2017. The 2017 results included $721.4 million of net proceeds from debt refinancing activities compared to 2018 net proceeds of $48.8 million. Additionally, we increased by $89.5 million the return of capital to our shareholders via higher dividends of $15.8 million ($1.12 per share compared to $1.00 per share) and higher share repurchases of $73.7 million (1,191,928 shares @ $112.41 per share compared to 510,283 shares @ $118.18 per share).
| Part II | 51 |
DEBT
Certain debt measures as of December 31 are outlined below:
| dollars in millions | 2019 | 2018 | ||||||||
| Debt | ||||||||||
| Current maturities of long-term debt | $ 0.0 | $ 0.0 | ||||||||
| Short-term debt | 0.0 | 133.0 | ||||||||
| Long-term debt 1 | 2,784.3 | 2,779.4 | ||||||||
| Total debt | $ 2,784.3 | $ 2,912.4 | ||||||||
| Capital | ||||||||||
| Total debt | $ 2,784.3 | $ 2,912.4 | ||||||||
| Equity | 5,621.9 | 5,202.9 | ||||||||
| Total capital | $ 8,406.2 | $ 8,115.3 | ||||||||
| Total Debt as a Percentage of Total Capital | 33.1% | 35.9% | ||||||||
| Weighted-average Effective Interest Rates | ||||||||||
| Line of credit 2 | 1.25% | 1.25% | ||||||||
| Term debt | 4.36% | 4.56% | ||||||||
| Fixed versus Floating Interest Rate Debt | ||||||||||
| Fixed-rate debt | 73.7% | 70.4% | ||||||||
| Floating-rate debt | 26.3% | 29.6% |
| 1 | Long-term debt includes the $250.0 million floating-rate notes due June 2020 (see Note 6 “Debt” in Item 8 “Financial Statements and Supplementary Data”) as we intend to refinance these notes, and we have the ability to do so by borrowing on our line of credit. |
| 2 | Reflects the margin above LIBOR for LIBOR-based borrowings; we also paid upfront fees that are amortized to interest expense and pay fees for unused borrowing capacity and standby letters of credit. |
At December 31, 2019, our total debt of $2,784.3 million was 2.2 times 2019 Adjusted EBITDA and our weighted-average debt maturity was 14 years.
LINE OF CREDIT
Our unsecured $750.0 million line of credit matures December 2021. Covenants, borrowings, cost ranges and other details are described in Note 6 “Debt” in Item 8 “Financial Statements and Supplementary Data.” As of December 31, 2019, we were in compliance with the line of credit covenants and the credit margin for LIBOR borrowings was 1.25%, the credit margin for base rate borrowings was 0.25%, and the commitment fee for the unused portion was 0.15%.
As of December 31, 2019, our available borrowing capacity under the line of credit was $697.4 million. Utilization of the borrowing capacity was as follows:
none was borrowed
$52.6 million was used to provide support for outstanding standby letters of credit
TERM DEBT
All of our $2,846.4 million (face value) of term debt is unsecured. $2,846.2 million of such debt is governed by three essentially identical indentures that contain customary investment-grade type covenants. The primary covenant in all three indentures limits the amount of secured debt we may incur without ratably securing such debt. As of December 31, 2019, we were in compliance with all term debt covenants.
Throughout 2017 and during the first quarter of 2018, we completed a number of debt refinancing activities in order to extend the maturity of our debt portfolio consistent with the long-lived nature of our asset base.
| Part II | 52 |
As a result of the first quarter 2018 early debt retirements, we recognized premiums of $5.6 million, transaction costs of $1.3 million and noncash expense (acceleration of unamortized deferred transaction costs) of $0.5 million. The combined charge of $7.4 million was a component of interest expense for the year ended December 31, 2018.
As a result of the 2017 early debt retirements, we recognized premiums of $139.2 million, transaction costs of $1.6 million and noncash expense (acceleration of unamortized deferred transaction costs) of $7.2 million. The combined charge of $148.0 million was a component of interest expense for the year ended December 31, 2017.
For additional information regarding term debt, see Note 6 “Debt” in Item 8 “Financial Statements and Supplementary Data.”
DEBT PAYMENTS AND MATURITIES
There were no significant scheduled debt payments during 2019. Scheduled debt payments during 2018 included $350.0 million (which we refinanced in February 2018 via issuing $350.0 million of 30-year 4.70% senior notes due 2048). Additionally, we early retired $396.1 million of debt during the first quarter of 2018. There were no significant scheduled debt payments during 2017; however, we early retired over $1.0 billion of debt.
As of December 31, 2019, maturities for the next four quarters and maturities for the next five years are due as follows (excluding borrowings on the line of credit):
| 2020 | Debt | |||||
| in millions | Debt Maturities | in millions | Maturities | |||
| First quarter | $ 0.0 | 2020 1 | $ 250.0 | |||
| Second quarter 1 | 250.0 | 2021 | 506.1 | |||
| Third quarter | 0.0 | 2022 | 0.0 | |||
| Fourth quarter | 0.0 | 2023 | 0.0 | |||
| 2024 | 0.0 |
| 1 | This second quarter 2020 debt maturity is classified as long-term since we intend to refinance it, and we have the ability to do so by borrowing on our line of credit. |
For additional information regarding debt payments and maturities, see Note 6 “Debt” in Item 8 “Financial Statements and Supplementary Data.”
DEBT RATINGS
Our debt ratings and outlooks as of December 31, 2019 are as follows:
| Rating/Outlook | Date | Description | ||||||||
| Senior Unsecured Term Debt | ||||||||||
| Fitch 1 | BBB-/stable | 9/24/2018 | rating/outlook affirmed | |||||||
| Moody's | Baa3/stable | 3/29/2019 | rating/outlook affirmed | |||||||
| Standard & Poor's | BBB/stable | 4/4/2019 | rating/outlook affirmed |
| 1 | Subsequent to year end, in February 2020, Fitch upgraded our outlook from stable to positive. |
LIBOR TRANSITION
The London Interbank Offered Rate (LIBOR) is an indicative measure of the average rate at which major global banks could borrow from one another and is used extensively globally as a reference rate for financial contracts (e.g., corporate bonds and loans) and commercial contracts (e.g., real estate leases). The United Kingdom’s Financial Conduct Authority, which regulates LIBOR, announced in July 2017 that it intends to cease requiring banks to submit LIBOR rates after 2021.
The expected discontinuation of LIBOR has led to the formation of working groups in the U.S. and elsewhere to recommend alternative reference rates. The U.S. working group is the Alternative Reference Rates Committee (ARRC) convened by the Federal Reserve Board and the Federal Reserve Bank of New York. The ARRC has selected the Secured Overnight Financing Rate (SOFR) as the preferred alternative to LIBOR.
| Part II | 53 |
We are in the early stages of identifying, evaluating, and addressing the impacts to existing contracts of the discontinuation of LIBOR. We have three material debt instruments with LIBOR as a reference rate, each of which matures before the end of 2021: 1) $250.0 million floating-rate notes due 2020, 2) $500.0 million floating-rate notes due 2021, and 3) $750.0 million line of credit (none outstanding at December 31, 2019) due 2021. At this time, we cannot predict the future impact of a departure from LIBOR as a reference rate; however, if future rates based upon the successor reference rate (or a new method of calculating LIBOR) are higher than LIBOR rates as currently determined, it may have a material adverse effect on our financial condition and results of operations.
EQUITY
The number of our common stock issuances and purchases are as follows:
| in thousands | 2019 | 2018 | 2017 | |||||||
| Common stock shares at January 1, | ||||||||||
| issued and outstanding | 131,762 | 132,324 | 132,339 | |||||||
| Common Stock Issuances | ||||||||||
| Share-based compensation plans | 628 | 630 | 495 | |||||||
| Common Stock Purchases | ||||||||||
| Purchased and retired | (19) | (1,192) | (510) | |||||||
| Common stock shares at December 31, | ||||||||||
| issued and outstanding | 132,371 | 131,762 | 132,324 |
On February 10, 2017, our Board of Directors authorized us to purchase 8,243,243 shares of our common stock to refresh the number of shares we were authorized to purchase to 10,000,000. As of December 31, 2019, there were 8,279,189 shares remaining under the authorization. Depending upon market, business, legal and other conditions, we may purchase shares from time to time through the open market (including plans designed to comply with Rule 10b5-1 of the Securities Exchange Act of 1934) and/or privately negotiated transactions. The authorization has no time limit, does not obligate us to purchase any specific number of shares, and may be suspended or discontinued at any time.
The detail of our common stock purchases (all of which were open market purchases) are as follows:
| in thousands, except average cost | 2019 | 2018 | 2017 | |||||||
| Shares Purchased and Retired | ||||||||||
| Number | 19 | 1,192 | 510 | |||||||
| Total purchase price | $ 2,602 | $ 133,983 | $ 60,303 | |||||||
| Average cost per share | $ 139.90 | $ 112.41 | $ 118.18 |
There were no shares held in treasury as of December 31, 2019, 2018 and 2017.
OFF-BALANCE SHEET ARRANGEMENTS
We have no off-balance sheet arrangements, such as financing or unconsolidated variable interest entities, that either have or are reasonably likely to have a current or future material effect on our:
results of operations and financial position
capital expenditures
liquidity and capital resources
| Part II | 54 |
STANDBY LETTERS OF CREDIT
For a discussion of our standby letters of credit see Note 6 “Debt” in Item 8 “Financial Statements and Supplementary Data.”
CONTRACTUAL OBLIGATIONS
We expect core capital spending (excluding growth) of $275.0 million during 2020. Excluding future cash requirements for capital expenditures and immaterial or contingent contracts, our obligations to make future contractual payments as of December 31, 2019 are summarized in the table below:
| Note | Payments Due by Year | |||||||||||||
| in millions | Reference | 2020 | 2021-2022 | 2023-2024 | Thereafter | Total | ||||||||
| Cash Contractual Obligations | ||||||||||||||
| Bank line of credit | ||||||||||||||
| Principal payments | Note 6 | $ 0.0 | $ 0.0 | $ 0.0 | $ 0.0 | $ 0.0 | ||||||||
| Interest payments and fees 1 | Note 6 | 1.8 | 1.8 | 0.0 | 0.0 | 3.6 | ||||||||
| Term debt | ||||||||||||||
| Principal payments 2 | Note 6 | 250.0 | 506.1 | 0.0 | 2,090.3 | 2,846.4 | ||||||||
| Interest payments | Note 6 | 112.7 | 195.7 | 192.0 | 1,386.0 | 1,886.4 | ||||||||
| Leases 3 | Note 7 | 44.3 | 67.8 | 42.9 | 181.9 | 336.9 | ||||||||
| Mineral royalties | Note 12 | 27.1 | 44.1 | 28.8 | 166.3 | 266.3 | ||||||||
| Unconditional purchase obligations | ||||||||||||||
| Capital | Note 12 | 27.7 | 0.0 | 0.0 | 0.0 | 27.7 | ||||||||
| Noncapital 4 | Note 12 | 24.2 | 8.8 | 15.5 | 0.0 | 48.5 | ||||||||
| Benefit plans 5 | Note 10 | 8.6 | 16.5 | 19.5 | 41.5 | 86.1 | ||||||||
| Total cash contractual obligations 6, 7 | $ 496.4 | $ 840.8 | $ 298.7 | $ 3,866.0 | $ 5,501.9 |
| 1 | Includes fees for unused borrowing capacity and fees for standby letters of credit. The figures for all years assume that the amount of unused borrowing capacity and the amount of standby letters of credit do not change from December 31, 2019, and borrowing costs reflect a rising LIBOR. |
| 2 | The 2020 principal term debt payment is classified as long-term since we intend to refinance it, and we have the ability to do so by borrowing on our line of credit. |
| 3 | The above table excludes lease renewal options which are included in the table labeled Maturity of Lease Liabilities in Note 7 “Leases” in Item 8 “Financial Statements and Supplementary Data.” |
| 4 | Noncapital unconditional purchase obligations relate primarily to transportation and electr**icity contracts. |
| 5 | Payments in “Thereafter” column for benefit plans are for the years 2025-2029. The future contributions are based on current economic conditions and may vary based on future interest rates, asset performance, participant longevity and other plan experience. |
| 6 | *The above table excludes discounted asset retirement obligations in the amount of $*210.3 million at December 31, 2019, the majority of which have an estimated settlement date beyond 2024 (see Note 17 “Asset Retirement Obligations” in Item 8 “Financial Statements and Supplementary Data”). |
| 7 | The above table excludes liabilities for *unrecognized tax benefits in the amount of $*5.4 million at December 31, 2019, as we cannot make a reasonably reliable estimate of the amount and period of related future payment of these uncertain tax positions (for more details, see Note 9 “Income Taxes” in Item 8 “Financial Statements and Supplementary Data”). |
| Part II | 55 |
CRITICAL ACCOUNTING POLICIES
We follow certain significant accounting policies when preparing our consolidated financial statements. A summary of these policies is included in Note 1 “Summary of Significant Accounting Policies” in Item 8 “Financial Statements and Supplementary Data.”
We prepare these financial statements to conform with accounting principles generally accepted in the United States of America. These principles require us to make estimates and judgments that affect reported amounts of assets, liabilities, revenues and expenses, and the related disclosures of contingent assets and contingent liabilities at the date of the financial statements. We base our estimates on historical experience, current conditions and various other assumptions we believe reasonable under existing circumstances and evaluate these estimates and judgments on an ongoing basis. The results of these estimates form the basis for our judgments about the carrying values of assets and liabilities as well as identifying and assessing the accounting treatment with respect to commitments and contingencies. Our actual results may materially differ from these estimates.
We believe the following critical accounting policies require the most significant judgments and estimates used in the preparation of our consolidated financial statements:
1.Goodwill impairment
2.Impairment of long-lived assets excluding goodwill
3.Business combinations and purchase price allocation
4.Pension and other postretirement benefits
5.Environmental compliance costs
6.Claims and litigation including self-insurance
7.Income taxes
1. GOODWILL IMPAIRMENT
Goodwill represents the excess of the cost of net assets acquired in business combinations over the fair value of the identifiable tangible and intangible assets acquired and liabilities assumed in a business combination. Goodwill impairment exists when the fair value of a reporting unit is less than its carrying amount. Goodwill is tested for impairment on an annual basis or more frequently whenever events or changes in circumstances would more likely than not reduce the fair value of a reporting unit below its carrying amount. The impairment evaluation is a critical accounting policy because goodwill is material to our total assets (as of December 31, 2019, goodwill represents 30% of total assets) and the evaluation involves the use of significant estimates, assumptions and judgment.
HOW WE TEST GOODWILL FOR IMPAIRMENT
Goodwill is tested for impairment at the reporting unit level, one level below our operating segments. We have identified 17 reporting units (of which 9 carry goodwill) based primarily on geographic location. We have the option of either assessing qualitative factors to determine whether it is more likely than not that the carrying value of our reporting units exceeds their respective fair value or proceeding directly to a quantitative test. We elected to perform the quantitative impairment test for all years presented.
The quantitative impairment test compares the fair value of a reporting unit to its carrying value, including goodwill. If the fair value exceeds its carrying value, the goodwill of the reporting unit is not considered impaired. However, if the carrying value of a reporting unit exceeds its fair value, we recognize an impairment loss equal to that excess.
HOW WE DETERMINE CARRYING VALUE AND FAIR VALUE
First, we determine the carrying value of each reporting unit by assigning assets and liabilities, including goodwill, to those units as of the measurement date. Then, we estimate the fair values of the reporting units using both an income approach (which involves discounting estimated future cash flows) and a market approach (which involves the application of revenue and EBITDA multiples of comparable companies). We consider market factors when determining the assumptions and estimates used in our valuation models. Finally, to assess the reasonableness of the reporting unit fair values, we compare the total of the reporting unit fair values to our market capitalization.
| Part II | 56 |
OUR FAIR VALUE ASSUMPTIONS
We base our fair value estimates on market participant assumptions we believe to be reasonable at the time, but such assumptions are subject to inherent uncertainty and actual results may differ. Changes in key assumptions or management judgment with respect to a reporting unit or its prospects may result from a change in market conditions, market trends, interest rates or other factors outside of our control, or underperformance relative to historical or projected operating results. These conditions could result in a significantly different estimate of the fair value of our reporting units, which could result in an impairment charge in the future.
The significant assumptions in our discounted cash flow models include our estimate of future profitability, capital requirements and the discount rate. The profitability estimates used in the models were derived from internal operating budgets and forecasts for long-term demand and pricing in our industry. Estimated capital requirements reflect replacement capital estimated on a per ton basis and if applicable, acquisition capital necessary to support growth estimated in the models. The discount rate was derived using a capital asset pricing model.
RESULTS OF OUR IMPAIRMENT TESTS
The results of our annual impairment tests for the last three years indicated that the fair values of all reporting units with goodwill substantially exceeded (in excess of 100%) their carrying values.
For additional information about goodwill, see Note 18 “Goodwill and Intangible Assets” in Item 8 “Financial Statements and Supplementary Data.”
2. IMPAIRMENT OF LONG-LIVED ASSETS EXCLUDING GOODWILL
We evaluate the carrying value of long-lived assets, including intangible assets subject to amortization, when events and circumstances indicate that the carrying value may not be recoverable. The impairment evaluation is a critical accounting policy because long-lived assets are material to our total assets (as of December 31, 2019, net property, plant & equipment represents 41% of total assets, while net other intangible assets represents 10% of total assets) and the evaluation involves the use of significant estimates, assumptions and judgment. The carrying value of long-lived assets is considered impaired when the estimated undiscounted cash flows from such assets are less than their carrying value. In that event, we recognize a loss equal to the amount by which the carrying value exceeds the fair value.
Fair value is estimated primarily by using a discounted cash flow methodology that requires considerable judgment and assumptions. Our estimate of net future cash flows is based on historical experience and assumptions of future trends, which may be different from actual results. We periodically review the appropriateness of the estimated useful lives of our long-lived assets.
We test long-lived assets for impairment at the a significantly lower level than the level at which we test goodwill for impairment. In markets where we do not produce downstream products (e.g., asphalt mix and ready-mixed concrete), the lowest level of largely independent identifiable cash flows is at the individual aggregates operation or a group of aggregates operations collectively serving a local market. Conversely, in vertically integrated markets, the cash flows of our downstream and upstream businesses are not largely independently identifiable as the selling price of the upstream products (aggregates) impacts the profitability of the downstream business.
During 2019, 2018 and 2017, we recorded no losses on impairment of long-lived assets.
| Part II | 57 |
We maintain certain long-lived assets that are not currently being used in our operations. These assets totaled $418.2 million at December 31, 2019, representing a 1% increase from December 31, 2018. Of the total $418.2 million, approximately 45% relates to real estate held for future development and expansion of our operations. In addition, approximately 20% is comprised of real estate (principally former mining sites) pending development as commercial or residential real estate, reservoirs or landfills. The remaining 35% is composed of aggregates, asphalt and concrete operating assets idled temporarily. We evaluate the useful lives and the recoverability of these assets whenever events or changes in circumstances indicate that carrying amounts may not be recoverable.
For additional information about long-lived assets and intangible assets, see Note 4 “Property, Plant & Equipment” and Note 18 “Goodwill and Intangible Assets” in Item 8 “Financial Statements and Supplementary Data.”
3. BUSINESS COMBINATIONS AND PURCHASE PRICE ALLOCATION
Our strategic long-term plans include potential investments in value-added acquisitions of related or similar businesses. When an acquisition is completed, our consolidated statements of comprehensive income includes the operating results of the acquired business starting from the date of acquisition, which is the date that control is obtained.
HOW WE DETERMINE AND ALLOCATE THE PURCHASE PRICE
The purchase price is determined based on the fair value of consideration transferred to and liabilities assumed from the seller as of the date of acquisition. We allocate the purchase price to the fair values of the tangible and identifiable intangible assets acquired and liabilities assumed as of the date of acquisition. Goodwill is recorded for the excess of the purchase price over the net of the fair value of the identifiable assets acquired and liabilities assumed. The purchase price allocation is a critical accounting policy because the estimation of fair values of acquired assets and assumed liabilities is judgmental and requires various assumptions. Additionally, the amounts assigned to depreciable and amortizable assets compared to amounts assigned to goodwill, which is not amortized, can significantly affect our results of operations.
Fair value is the price that would be received to sell an asset or paid to transfer a liability in an orderly transaction, and therefore represents an exit price. A fair value measurement assumes the highest and best use of the asset by market participants. The fair value hierarchy prioritizes the inputs to valuation techniques used to measure fair value into three broad levels as described below:
Level 1: Quoted prices in active markets for identical assets or liabilities Level 2: Inputs that are derived principally from or corroborated by observable market data Level 3: Inputs that are unobservable and significant to the overall fair value measurement
Level 1 fair values are used to value investments in publicly-traded entities and assumed obligations for publicly-traded long-term debt.
Level 2 fair values are typically used to value acquired machinery and equipment, land, buildings, and assumed liabilities for asset retirement obligations, environmental remediation and compliance obligations. Additionally, Level 2 fair values are typically used to value assumed contracts at other-than-market rates.
Level 3 fair values are used to value acquired mineral reserves as well as leased mineral interests (referred to in our financial statements as contractual rights in place) and other identifiable intangible assets. We determine the fair values of owned mineral reserves and leased mineral interests using a lost profits approach and/or an excess earnings approach. These valuation techniques require management to estimate future cash flows. The estimate of future cash flows is based on available historical information and future expectations and assumptions determined by management, but is inherently uncertain. Key assumptions in estimating future cash flows include sales price, shipment volumes, production costs and capital needs. The present value of the projected net cash flows represents the fair value assigned to mineral reserves and mineral interests. The discount rate is a significant assumption used in the valuation model and is based on the required rate of return that a hypothetical market participant would assume if purchasing the acquired business, with an adjustment for the risk of these assets not generating the projected cash flows.
| Part II | 58 |
Other identifiable intangible assets may include, but are not limited to, noncompetition agreements. The fair values of these assets are typically determined by an excess earnings method, a replacement cost method or a market approach.
MEASUREMENT PERIOD ADJUSTMENTS
We may adjust the amounts recognized in an acquisition during a measurement period after the acquisition date. Any such adjustments are the result of subsequently obtaining additional information that existed at the acquisition date regarding the assets acquired or the liabilities assumed. Measurement period adjustments are generally recorded as increases or decreases to goodwill, if any, recognized in the transaction. The cumulative impact of measurement period adjustments on depreciation, amortization and other income statement items are recognized in the period the adjustment is determined. The measurement period ends once we have obtained all necessary information that existed as of the acquisition date, but does not extend beyond one year from the date of acquisition. Any adjustments to assets acquired or liabilities assumed beyond the measurement period are recorded through earnings.
4. PENSION AND OTHER POSTRETIREMENT BENEFITS
Accounting for pension and other postretirement benefits requires that we use assumptions for the valuation of projected benefit obligations (PBO) and the performance of plan assets. Each year, we review our assumptions for discount rates (used for PBO, service cost, and interest cost calculations) and the expected return on plan assets. Due to plan changes made in 2012 and 2013, annual pay increases and the per capita cost of healthcare benefits do not materially impact plan obligations.
DISCOUNT RATES — We use a high-quality bond full yield curve approach (specific spot rates for each annual expected cash flow) to establish the discount rates at each measurement date. See Note 10 “Benefit Plans” in Item 8 “Financial Statements and Supplementary Data” for the discount rates used for PBO, service cost, and interest cost calculations.
EXPECTED RETURN ON PLAN ASSETS — Our expected return on plan assets is: (1) a long-term view based on our current asset allocation, and (2) a judgment informed by consultation with our retirement plans’ consultant and our pension plans’ actuary. For the year ended December 31, 2019, the expected return on plan assets was 5.75% (7.0% for 2018).
Changes to the assumptions listed above would have an impact on the PBO and the annual net benefit cost. The following table reflects the favorable and unfavorable outcomes associated with a change in certain assumptions:
| (Favorable) Unfavorable | |||||||||||
| 0.5 Percentage Point Increase | 0.5 Percentage Point Decrease | ||||||||||
| Inc (Dec) in | Inc (Dec) in | Inc (Dec) in | Inc (Dec) in | ||||||||
| in millions | Benefit Obligation | Annual Benefit Cost | Benefit Obligation | Annual Benefit Cost | |||||||
| Actuarial Assumptions | |||||||||||
| Discount rates | |||||||||||
| Pension | $ (61.3) | $ (1.3) | $ 67.7 | $ 1.4 | |||||||
| Other postretirement benefits | (1.2) | (0.0) | 1.3 | 0.0 | |||||||
| Expected return on plan assets | not applicable | (4.4) | not applicable | 4.4 |
As of the December 31, 2019 measurement date, the fair value of our pension plan assets increased from $836.8 million for the prior year-end to $949.0 million due to strong investment returns. Our postretirement plans are unfunded.
The discount rate is the weighted-average of the spot rates for each cash flow on the yield curve for high-quality bonds as of the measurement date. As of the December 31, 2019 measurement date, the PBO of our pension plans increased from $958.9 million to $1,090.9 million. The PBO of our postretirement plans increased from $40.8 million to $41.2 million. The PBO increases were primarily due to lower discount rates, which ranged from 2.67% to 3.37% in 2019 compared with 3.92% to 4.47% in 2018.
| Part II | 59 |
During 2020, we expect to recognize net pension expense of $0.5 million and net postretirement income of $2.4 million compared to expense of $1.7 million and income of $2.5 million, respectively, in 2019. The decrease in pension expense is the result of lower discount rates on frozen plans and better than expected returns during 2019 on plan assets.
We do not anticipate that contributions to the funded pension plans will be required during 2020, and we do not anticipate making a discretionary contribution. We currently do not anticipate that the funded status of any of our plans will fall below statutory thresholds requiring accelerated funding or constraints on benefit levels or plan administration.
For additional information about pension and other postretirement benefits, see Note 10 “Benefit Plans” in Item 8 “Financial Statements and Supplementary Data.”
5. ENVIRONMENTAL COMPLIANCE COSTS
Our environmental compliance costs include the cost of ongoing monitoring programs, the cost of remediation efforts and other similar costs. Our accounting policy for environmental compliance costs is a critical accounting policy because it involves the use of significant estimates and assumptions and requires considerable management judgment.
HOW WE ACCOUNT FOR ENVIRONMENTAL COSTS
To account for environmental costs, we:
expense or capitalize environmental costs consistent with our capitalization policy
expense costs for an existing condition caused by past operations that do not contribute to future revenues
accrue costs for environmental assessment and remediation efforts when we determine that a liability is probable and we can reasonably estimate the cost
At the early stages of a remediation effort, environmental remediation liabilities are not easily quantified due to the uncertainties of various factors. The range of an estimated remediation liability is defined and redefined as events in the remediation effort occur, but generally liabilities are recognized no later than completion of the remedial feasibility study. When we can estimate a range of probable loss, we accrue the most likely amount. If no amount in the range of probable loss is considered most likely, the minimum loss in the range is accrued. As of December 31, 2019, the difference between the amount accrued and the maximum loss in the range for all sites for which a range can be reasonably estimated was $3.1 million — this amount does not represent our maximum exposure to loss for all environmental remediation obligations as it excludes those sites for which a range of loss cannot be reasonably estimated at this time. Our environmental remediation obligations are recorded on an undiscounted basis.
Accrual amounts may be based on technical cost estimations or the professional judgment of experienced environmental managers. Our Safety, Health and Environmental Affairs Management Committee routinely reviews cost estimates and key assumptions in response to new information, such as the kinds and quantities of hazardous substances, available technologies and changes to the parties participating in the remediation efforts. However, a number of factors, including adverse agency rulings and unanticipated conditions as remediation efforts progress, may cause actual results to differ materially from accrued costs.
For additional information about environmental compliance costs, see Note 8 “Accrued Environmental Remediation Costs” in Item 8 “Financial Statements and Supplementary Data.”
| Part II | 60 |
6. CLAIMS AND LITIGATION INCLUDING SELF-INSURANCE
We are involved with claims and litigation, including items covered under our self-insurance program. We are self-insured for losses related to workers' compensation up to $2.0 million per occurrence and automotive and general/product liability up to $3.0 million per occurrence. We have excess coverage on a per occurrence basis beyond these retention levels.
Under our self-insurance program, we aggregate certain claims and litigation costs that are reasonably predictable based on our historical loss experience and accrue losses, including future legal defense costs, based on actuarial studies. Certain claims and litigation costs, due to their unique nature, are not included in our actuarial studies. For matters not included in our actuarial studies, legal defense costs are accrued when incurred.
Our accounting policy for claims and litigation including self-insurance is a critical accounting policy because it involves the use of significant estimates and assumptions and requires considerable management judgment.
HOW WE ASSESS THE PROBABILITY OF LOSS
We use both internal and outside legal counsel to assess the probability of loss, and establish an accrual when the claims and litigation represent a probable loss and the cost can be reasonably estimated. Significant judgment is used in determining the timing and amount of the accruals for probable losses, and the actual liability could differ materially from the accrued amounts.
For additional information about claims and litigation including self-insurance, see Note 1 “Summary of Significant Accounting Policies” in Item 8 “Financial Statements and Supplementary Data” under the caption Claims and Litigation Including Self-insurance.
7. INCOME TAXES
VALUATION OF OUR DEFERRED TAX ASSETS
We file federal, state and foreign income tax returns and account for the current and deferred tax effects of such returns using the asset and liability method. We recognize deferred tax assets and liabilities (which reflect our best assessment of the future taxes we will pay) based on the differences between the book basis and tax basis of assets and liabilities. Deferred tax assets represent items to be used as a tax deduction or credit in future tax returns while deferred tax liabilities represent items that will result in additional tax in future tax returns.
Significant judgments and estimates are required in determining our deferred tax assets and liabilities. These estimates are updated throughout the year to consider income tax return filings, our geographic mix of earnings, legislative changes and other relevant items. We are required to account for the effects of changes in income tax rates on deferred tax balances in the period in which the legislation is enacted.
Each quarter we analyze the likelihood that our deferred tax assets will be realized. Realization of the deferred tax assets ultimately depends on the existence of sufficient taxable income of the appropriate character in either the carryback or carryforward period. A valuation allowance is recorded if, based on the weight of all available positive and negative evidence, it is more likely than not (a likelihood of more than 50%) that some portion, or all, of a deferred tax asset will not be realized. A summary of our deferred tax assets is included in Note 9 “Income Taxes” in Item 8 “Financial Statements and Supplementary Data.”
| Part II | 61 |
LIABILITY FOR UNRECOGNIZED TAX BENEFITS
We recognize a tax benefit associated with a tax position when we judge it is more likely than not that the position will be sustained based upon the technical merits of the position. For a tax position that meets the more likely than not recognition threshold, we measure the income tax benefit as the largest amount that we judge to have a greater than 50% likelihood of being realized. A liability is established for the unrecognized portion of any tax position. Our liability for unrecognized tax benefits is adjusted periodically due to changing circumstances, such as the progress of tax audits, case law developments and new or emerging legislation.
Generally, we are not subject to significant changes in income taxes by any taxing jurisdiction for the years before 2016. While it is often difficult to predict the final outcome or the timing of resolution of any particular tax matter, we believe our liability for unrecognized tax benefits is appropriate.
We consider a tax position to be resolved at the earlier of the issue being “effectively settled,” settlement of an examination, or the expiration of the statute of limitations. Upon resolution of a tax position, any liability for unrecognized tax benefits will be released.
Our liability for unrecognized tax benefits is generally presented as noncurrent. However, if we anticipate paying cash within one year to settle an uncertain tax position, the liability is presented as current. We classify interest and penalties associated with our liability for unrecognized tax benefits as income tax expense.
NEW ACCOUNTING STANDARDS
For a discussion of accounting standards recently adopted or pending adoption and the effect such accounting changes will have on our results of operations, financial position or liquidity, see Note 1 “Summary of Significant Accounting Policies” in Item 8 “Financial Statements and Supplementary Data” under the caption New Accounting Standards.
FORWARD-LOOKING STATEMENTS
The foregoing discussion and analysis, as well as certain information contained elsewhere in this Annual Report, contain “forward-looking statements” within the meaning of Section 27A of the Securities Act of 1933, as amended, and Section 21E of the Securities Exchange Act of 1934, as amended, and are intended to be covered by the safe harbor created thereby. See the discussion in Safe Harbor Statement under the Private Securities Litigation Reform Act of 1995 in Part I, above.
| Part II | 62 |
Previous: Item 6. SELECTED FINANCIAL DATA · Next: Item 7A. QUANTITATIVE AND QUALITATIVE DISCLOSURES ABOUT MARKET RISK