 filings.tools
Vivmark Residential 10-K 2016-12-31
Filed 2017-02-23. 14 sections, 730K characters. Original on sec.gov · Markdown · JSON
Cover and table of contents
10-K 1 eqr-20161231x10k.htm 10-K
UNITED STATES
SECURITIES AND EXCHANGE COMMISSION
Washington, D.C. 20549
FORM 10-K
x ANNUAL REPORT PURSUANT TO SECTION 13 OR 15(d) OF
THE SECURITIES EXCHANGE ACT OF 1934
For the Fiscal Year Ended DECEMBER 31, 2016
OR
¨ TRANSITION REPORT PURSUANT TO SECTION 13 OR 15(d) OF
THE SECURITIES EXCHANGE ACT OF 1934
For the transition period from to
Commission File Number: 1-12252 (Equity Residential)
Commission File Number: 0-24920 (ERP Operating Limited Partnership)
EQUITY RESIDENTIAL
ERP OPERATING LIMITED PARTNERSHIP
(Exact name of registrant as specified in its charter)
| Maryland (Equity Residential) | 13-3675988 (Equity Residential) |
| Illinois (ERP Operating Limited Partnership) | 36-3894853 (ERP Operating Limited Partnership) |
| (State or other jurisdiction of incorporation or organization) | (I.R.S. Employer Identification No.) |
| Two North Riverside Plaza, Chicago, Illinois 60606 | (312) 474-1300 |
| (Address of principal executive offices) (Zip Code) | (Registrant's telephone number, including area code) |
Securities registered pursuant to Section 12(b) of the Act:
| Common Shares of Beneficial Interest, $0.01 Par Value (Equity Residential) | New York Stock Exchange |
| 7.57% Notes due August 15, 2026 (ERP Operating Limited Partnership) | New York Stock Exchange |
| (Title of each class) | (Name of each exchange on which registered) |
Securities registered pursuant to Section 12(g) of the Act:
None (Equity Residential)
Units of Limited Partnership Interest (ERP Operating Limited Partnership)
(Title of each class)
Indicate by check mark if the registrant is a well-known seasoned issuer, as defined in Rule 405 of the Securities Act.
| Equity Residential Yes x No ¨ | ERP Operating Limited Partnership Yes x No o |
Indicate by check mark if the registrant is not required to file reports pursuant to Section 13 or Section 15(d) of the Act.
| Equity Residential Yes ¨ No x | ERP Operating Limited Partnership Yes ¨ No x |
Indicate by check mark whether the registrant (1) has filed all reports required to be filed by Section 13 or 15(d) of the Securities Exchange Act of 1934 during the preceding 12 months (or for such shorter period that the registrant was required to file such reports), and (2) has been subject to such filing requirements for the past 90 days.
| Equity Residential Yes x No ¨ | ERP Operating Limited Partnership Yes x No ¨ |
Indicate by check mark whether the registrant has submitted electronically and posted on its corporate Web site, if any, every Interactive Data File required to be submitted and posted pursuant to Rule 405 of Regulation S-T (§ 232.405 of this chapter) during the preceding 12 months (or for such shorter period that the registrant was required to submit and post such files).
| Equity Residential Yes x No ¨ | ERP Operating Limited Partnership Yes x No ¨ |
Indicate by check mark if disclosure of delinquent filers pursuant to Item 405 of Regulation S-K (§ 229.405 of this chapter) is not contained herein, and will not be contained, to the best of registrant’s knowledge, in definitive proxy or information statements incorporated by reference in Part III of this Form 10-K or any amendment to this Form 10-K.
| Equity Residential x | ERP Operating Limited Partnership x |
Indicate by check mark whether the registrant is a large accelerated filer, an accelerated filer, a non-accelerated filer, or a smaller reporting company. See the definitions of “large accelerated filer,” “accelerated filer” and “smaller reporting company” in Rule 12b-2 of the Exchange Act.
| Equity Residential: | |
| Large accelerated filer x | Accelerated filer ¨ |
| Non-accelerated filer ¨ (Do not check if a smaller reporting company) | Smaller reporting company ¨ |
| ERP Operating Limited Partnership: | |
| Large accelerated filer ¨ | Accelerated filer ¨ |
| Non-accelerated filer x (Do not check if a smaller reporting company) | Smaller reporting company ¨ |
Indicate by check mark whether the registrant is a shell company (as defined in Rule 12b-2 of the Act).
| Equity Residential Yes ¨ No x | ERP Operating Limited Partnership Yes ¨ No x |
The aggregate market value of Common Shares held by non-affiliates of the Registrant was approximately $24.8 billion based upon the closing price on June 30, 2016 of $68.88 using beneficial ownership of shares rules adopted pursuant to Section 13 of the Securities Exchange Act of 1934 to exclude voting shares owned by Trustees and Executive Officers, some of whom may not be held to be affiliates upon judicial determination.
The number of Common Shares of Beneficial Interest, $0.01 par value, outstanding on February 17, 2017 was 367,097,667.
DOCUMENTS INCORPORATED BY REFERENCE
Part III incorporates by reference certain information that will be contained in Equity Residential's Proxy Statement relating to its 2017 Annual Meeting of Shareholders, which Equity Residential intends to file no later than 120 days after the end of its fiscal year ended December 31, 2016, and thus these items have been omitted in accordance with General Instruction G(3) to Form 10-K. Equity Residential is the general partner and 96.2% owner of ERP Operating Limited Partnership.
EXPLANATORY NOTE
This report combines the annual reports on Form 10-K for the year ended December 31, 2016 of Equity Residential and ERP Operating Limited Partnership. Unless stated otherwise or the context otherwise requires, references to “EQR” mean Equity Residential, a Maryland real estate investment trust (“REIT”), and references to “ERPOP” mean ERP Operating Limited Partnership, an Illinois limited partnership. References to the “Company,” “we,” “us” or “our” mean collectively EQR, ERPOP and those entities/subsidiaries owned or controlled by EQR and/or ERPOP. References to the “Operating Partnership” mean collectively ERPOP and those entities/subsidiaries owned or controlled by ERPOP. The following chart illustrates the Company's and the Operating Partnership's corporate structure:
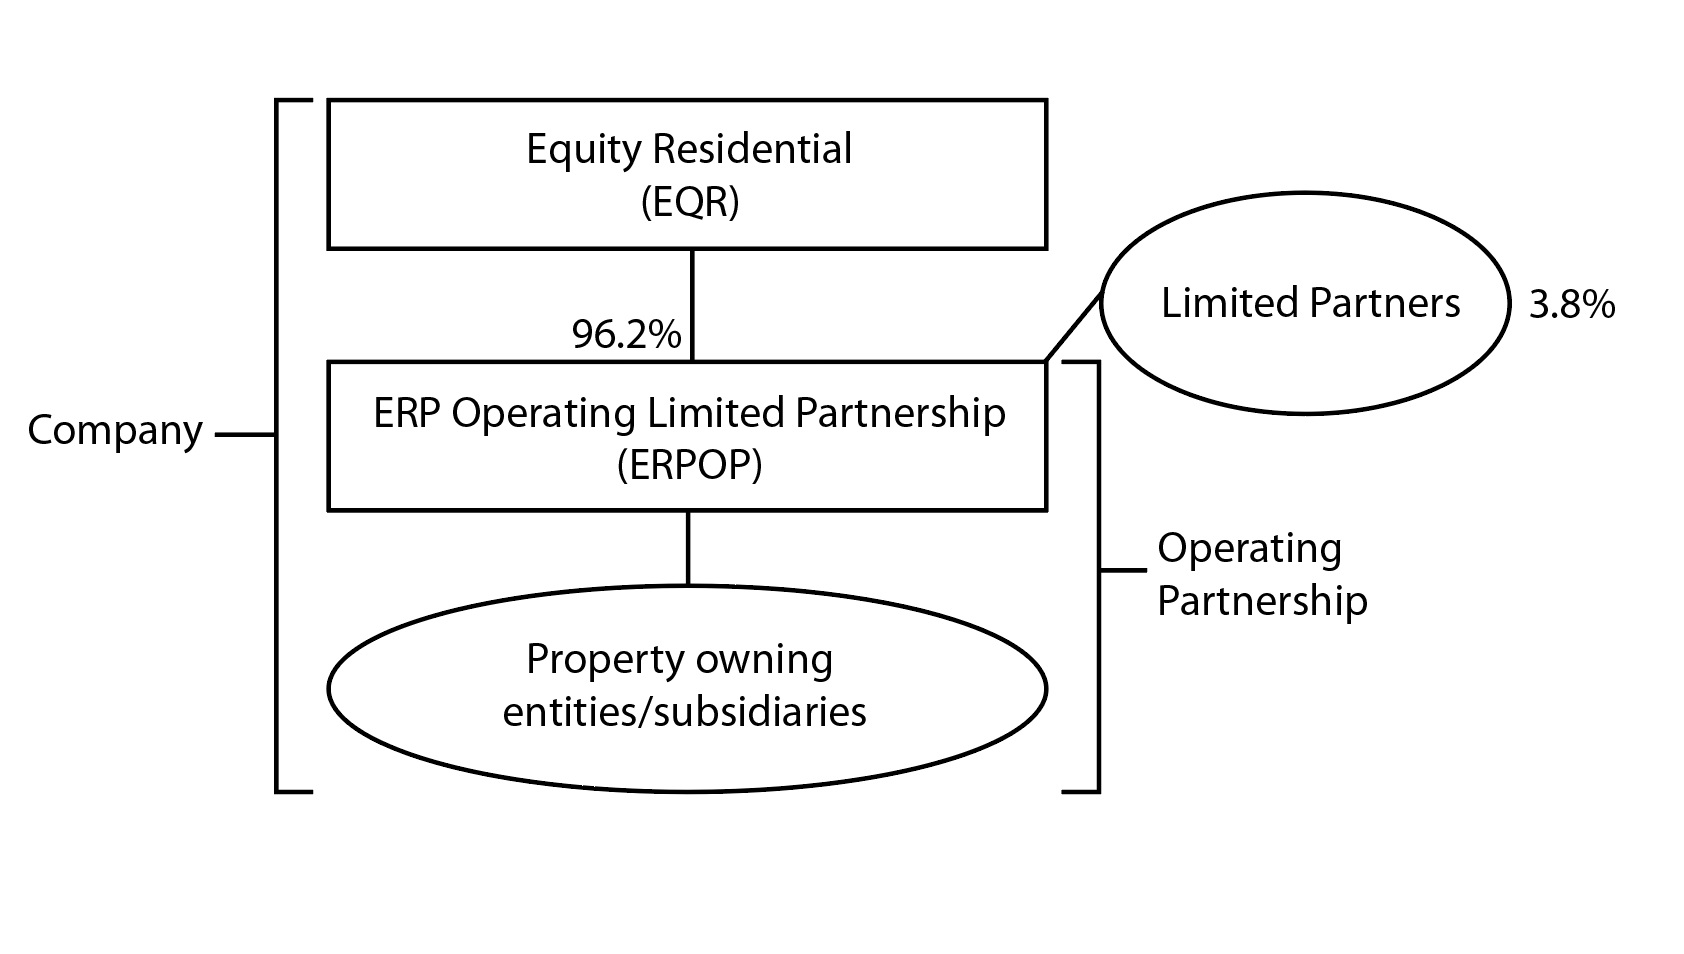
EQR is the general partner of, and as of December 31, 2016 owned an approximate 96.2% ownership interest in, ERPOP. The remaining 3.8% interest is owned by limited partners. As the sole general partner of ERPOP, EQR has exclusive control of ERPOP's day-to-day management. Management operates the Company and the Operating Partnership as one business. The management of EQR consists of the same members as the management of ERPOP.
The Company is structured as an umbrella partnership REIT (“UPREIT”) and EQR contributes all net proceeds from its various equity offerings to ERPOP. In return for those contributions, EQR receives a number of OP Units (see definition below) in ERPOP equal to the number of Common Shares it has issued in the equity offering. The Company may acquire properties in transactions that include the issuance of OP Units as consideration for the acquired properties. Such transactions may, in certain circumstances, enable the sellers to defer in whole or in part, the recognition of taxable income or gain that might otherwise result from the sales. This is one of the reasons why the Company is structured in the manner shown above. Based on the terms of ERPOP's partnership agreement, OP Units can be exchanged with Common Shares on a one-for-one basis because the Company maintains a one-for-one relationship between the OP Units of ERPOP issued to EQR and the outstanding Common Shares.
The Company believes that combining the reports on Form 10-K of EQR and ERPOP into this single report provides the following benefits:
| • | enhances investors' understanding of the Company and the Operating Partnership by enabling investors to view the business as a whole in the same manner as management views and operates the business; |
| • | eliminates duplicative disclosure and provides a more streamlined and readable presentation since a substantial portion of the disclosure applies to both the Company and the Operating Partnership; and |
| • | creates time and cost efficiencies through the preparation of one combined report instead of two separate reports. |
The Company believes it is important to understand the few differences between EQR and ERPOP in the context of how EQR and ERPOP operate as a consolidated company. All of the Company's property ownership, development and related business operations are conducted through the Operating Partnership and EQR has no material assets or liabilities other than its investment in ERPOP. EQR's primary function is acting as the general partner of ERPOP. EQR also issues equity from time to time, the net proceeds of which it is obligated to contribute to ERPOP, and guarantees certain debt of ERPOP, as disclosed in this report. EQR does not have any indebtedness as all debt is incurred by the Operating Partnership. The Operating Partnership holds substantially all of the assets of the Company, including the Company's ownership interests in its joint ventures. The Operating Partnership conducts the operations of the business and is structured as a partnership with no publicly traded equity. Except for the net proceeds from equity offerings by EQR, which are contributed to the capital of ERPOP in exchange for additional partnership interests in ERPOP (“OP Units”) (on a one-for-one Common Share per OP Unit basis) or additional preference units in ERPOP (on a one-
for-one preferred share per preference unit basis), the Operating Partnership generates all remaining capital required by the Company's business. These sources include the Operating Partnership's working capital, net cash provided by operating activities, borrowings under its revolving credit facility and/or commercial paper program, the issuance of secured and unsecured debt and equity securities and proceeds received from disposition of certain properties and joint venture interests.
Shareholders' equity, partners' capital and noncontrolling interests are the main areas of difference between the consolidated financial statements of the Company and those of the Operating Partnership. The limited partners of the Operating Partnership are accounted for as partners' capital in the Operating Partnership's financial statements and as noncontrolling interests in the Company's financial statements. The noncontrolling interests in the Operating Partnership's financial statements include the interests of unaffiliated partners in various consolidated partnerships and development joint venture partners. The noncontrolling interests in the Company's financial statements include the same noncontrolling interests at the Operating Partnership level and limited partner OP Unit holders of the Operating Partnership. The differences between shareholders' equity and partners' capital result from differences in the equity issued at the Company and Operating Partnership levels.
To help investors understand the differences between the Company and the Operating Partnership, this report provides separate consolidated financial statements for the Company and the Operating Partnership; a single set of consolidated notes to such financial statements that includes separate discussions of each entity's debt, noncontrolling interests and shareholders' equity or partners' capital, as applicable; and a combined Management's Discussion and Analysis of Financial Condition and Results of Operations section that includes discrete information related to each entity.
This report also includes separate Part II, Item 9A. Controls and Procedures sections and separate Exhibits 31 and 32 certifications for each of the Company and the Operating Partnership in order to establish that the requisite certifications have been made and that the Company and the Operating Partnership are compliant with Rule 13a-15 or Rule 15d-15 of the Securities Exchange Act of 1934 and 18 U.S.C. §1350.
In order to highlight the differences between the Company and the Operating Partnership, the separate sections in this report for the Company and the Operating Partnership specifically refer to the Company and the Operating Partnership. In the sections that combine disclosure of the Company and the Operating Partnership, this report refers to actions or holdings as being actions or holdings of the Company. Although the Operating Partnership is generally the entity that directly or indirectly enters into contracts and joint ventures and holds assets and debt, reference to the Company is appropriate because the Company is one business and the Company operates that business through the Operating Partnership.
As general partner with control of ERPOP, EQR consolidates ERPOP for financial reporting purposes, and EQR essentially has no assets or liabilities other than its investment in ERPOP. Therefore, the assets and liabilities of the Company and the Operating Partnership are the same on their respective financial statements. The separate discussions of the Company and the Operating Partnership in this report should be read in conjunction with each other to understand the results of the Company on a consolidated basis and how management operates the Company.
EQUITY RESIDENTIAL
ERP OPERATING LIMITED PARTNERSHIP
TABLE OF CONTENTS
PART I
Item 1. Business
General
Equity Residential (“EQR”), a Maryland real estate investment trust (“REIT”) formed in March 1993, is an S&P 500 company focused on the acquisition, development and management of rental apartment properties in urban and high-density suburban coastal gateway markets where today's affluent renters want to live, work and play. ERP Operating Limited Partnership ("ERPOP"), an Illinois limited partnership, was formed in May 1993 to conduct the multifamily residential property business of Equity Residential. EQR has elected to be taxed as a REIT. References to the "Company," "we," "us" or "our" mean collectively EQR, ERPOP and those entities/subsidiaries owned or controlled by EQR and/or ERPOP. References to the "Operating Partnership" mean collectively ERPOP and those entities/subsidiaries owned or controlled by ERPOP.
EQR is the general partner of, and as of December 31, 2016 owned an approximate 96.2% ownership interest in, ERPOP. All of the Company's property ownership, development and related business operations are conducted through the Operating Partnership and EQR has no material assets or liabilities other than its investment in ERPOP. EQR issues public equity from time to time, the net proceeds of which it is obligated to contribute to ERPOP, but does not have any indebtedness as all debt is incurred by the Operating Partnership. The Operating Partnership holds substantially all of the assets of the Company, including the Company's ownership interests in its joint ventures. The Operating Partnership conducts the operations of the business and is structured as a partnership with no publicly traded equity.
As of December 31, 2016, the Company, directly or indirectly through investments in title holding entities, owned all or a portion of 302 properties located in 10 states and the District of Columbia consisting of 77,458 apartment units. The ownership breakdown includes (table does not include various uncompleted development properties):
| Properties | Apartment Units | |||||
| Wholly Owned Properties | 280 | 72,445 | ||||
| Master-Leased Properties – Consolidated | 3 | 853 | ||||
| Partially Owned Properties – Consolidated | 17 | 3,215 | ||||
| Partially Owned Properties – Unconsolidated | 2 | 945 | ||||
| 302 | 77,458 |
The Company’s corporate headquarters is located in Chicago, Illinois and the Company also operates property management offices in each of its six core coastal markets. As of December 31, 2016, the Company had approximately 2,700 employees who provided real estate operations, leasing, legal, financial, accounting, acquisition, disposition, development and other support functions.
Certain capitalized terms used herein are defined in the Notes to Consolidated Financial Statements. See also Note 17 in the Notes to Consolidated Financial Statements for additional discussion regarding the Company’s segment disclosures.
Available Information
You may access our Annual Report on Form 10-K, our Quarterly Reports on Form 10-Q, our Current Reports on Form 8-K and any amendments to any of those reports we file with the SEC free of charge at our website, www.equityapartments.com. These reports are made available at our website as soon as reasonably practicable after we file them with the SEC. The information contained on our website, including any information referred to in this report as being available on our website, is not a part of or incorporated into this report.
Business Objectives and Operating and Investing Strategies
The Company invests in apartment communities located in strategically targeted markets with the goal of maximizing our risk adjusted total return (operating income plus capital appreciation) on invested capital.
We seek to maximize the income and capital appreciation of our properties by investing in markets that are characterized by conditions favorable to multifamily property operations and appreciation. We are focused on the six coastal markets of Boston, New York, Washington D.C., Southern California (including Los Angeles, Orange County and San Diego), San Francisco and Seattle. These markets generally feature one or more of the following characteristics that allow us to increase rents:
| ▪ | High home ownership costs; |
| ▪ | Strong economic growth leading to job growth and household formation, which in turn leads to high demand for our apartments; |
| ▪ | Urban core and high-density suburban locations with an attractive quality of life leading to high resident demand and retention; |
| ▪ | Favorable demographics contributing to a larger pool of target residents with a high propensity to rent apartments; and |
| ▪ | Higher barriers to entry where, because of land scarcity or government regulation, it is typically more difficult or costly to build new apartment properties, creating limits on new supply. |
We believe our strategy also capitalizes on the increasing preference of renters of all ages to live in the urban core of cities or dense suburban locations near transit, entertainment and cultural amenities. Millennials, the 83 million people between ages 18 and 34, are a prime apartment rental demographic. Reports also show a growing trend among aging Baby Boomers, a demographic of more than 76 million people between the ages of 53 and 71, toward apartment rentals. We believe that both groups appreciate the locational values described above as well as the flexibility that rental apartments offer.
Our operating focus is on balancing occupancy and rental rates to maximize our revenue while exercising tight cost control to generate the highest possible return to our shareholders. Revenue is maximized by attracting qualified prospects to our properties, cost-effectively converting these prospects into new residents and keeping our residents satisfied so they will renew their leases upon expiration. While we believe that it is our high-quality, well-located assets that bring our customers to us, it is the customer service and superior value provided by our on-site personnel that keeps them renting with us and recommending us to their friends.
We use technology to engage our customers in the way that they want to be engaged. Many of our residents utilize our web-based resident portal which allows them to sign and renew their leases, review their accounts and make payments, provide feedback and make service requests on-line.
Acquisitions and developments may be financed from various sources of capital, which may include retained cash flow, issuance of additional equity and debt, sales of properties and joint venture agreements. In addition, the Company may acquire properties in transactions that include the issuance of partnership interests in the Operating Partnership (“OP Units”) as consideration for the acquired properties. Such transactions may, in certain circumstances, enable the sellers to defer, in whole or in part, the recognition of taxable income or gain that might otherwise result from the sales. As part of its strategy, the Company purchases completed and fully occupied apartment properties, partially completed or partially occupied properties and may acquire land parcels to hold and/or sell based on market opportunities as well as options to buy more land in the future. The Company may also seek to acquire properties by purchasing defaulted or distressed debt that encumbers desirable properties in the hope of obtaining title to property through foreclosure or deed-in-lieu of foreclosure proceedings.
Over the past several years, the Company has done an extensive repositioning of its portfolio into urban and highly walkable, close-in suburban assets. Since 2005, the Company has sold nearly 198,000 apartment units primarily located in the less dense portions of suburban markets for an aggregate sales price of approximately $23.5 billion, acquired nearly 69,000 apartment units primarily located in urban and high-density suburban markets for approximately $20.0 billion and began approximately $5.7 billion of development projects primarily located in urban and high-density suburban markets. We are currently seeking to acquire and develop assets in the following six core coastal metropolitan areas: Boston, New York, Washington D.C., Southern California, San Francisco and Seattle. The sale of the Starwood Portfolio (as defined below) combined with the other 2016 dispositions has resulted in the Company's exit from the South Florida, Denver and New England (excluding Boston) markets and has substantially completed the Company's portfolio transformation which started approximately ten years ago. See further discussion below regarding the Company's 2016 disposition activity.
We endeavor to attract and retain the best employees by providing them with the education, resources and opportunities to succeed. We have a commitment to diversity in all of its forms and strive to promote and maintain a work environment where all employees are treated with dignity and respect, offered opportunities for professional development and valued for their unique contributions to the Company's success. We provide many classroom and on-line training courses to assist our employees in interacting with prospects and residents as well as extensively train our customer service specialists in maintaining our properties and improvements, equipment and appliances. We actively promote from within and many senior corporate and property leaders have risen from entry level or junior positions. We monitor our employees' engagement by surveying them annually and have consistently received high engagement scores.
We have a commitment to sustainability and consider the environmental impacts of our business activities. Sustainability and social responsibility are key drivers of our focus on creating the best apartment communities for residents to live, work and play. We have a dedicated in-house team that initiates and applies sustainable practices in all aspects of our business, including investment activities, development, property operations and property management activities. With its high density, multifamily housing is, by its nature, an environmentally friendly property type. Our recent acquisition and development activities have been primarily concentrated in pedestrian-friendly urban and close-in suburban locations near public transportation. When developing and renovating our properties, we strive to reduce energy and water usage by investing in energy saving technology while positively impacting the experience of our residents and the value of our assets. We continue to implement a combination of irrigation, lighting, HVAC and renewable energy improvements at our properties that will reduce energy and water consumption. The Company was named the 2016 Global Residential Listed Sector Leader in Sustainability by GRESB, a globally recognized analysis of the sustainability indicators of more than 750 real estate portfolios worldwide. The Company was also recently awarded the Residential Leader in the Light award for sustainability by the National Association of Real Estate Investment Trusts ("NAREIT"). For additional information regarding our sustainability efforts, see our December 2016 Corporate Social Responsibility and Sustainability Report at our website, www.equityapartments.com. For 2017, we continue to have an express company-wide goal regarding enhanced sustainability efforts. Employees, including our executives, will have their performance against our various social responsibility goals evaluated as part of our annual performance review process.
Competition
All of the Company's properties are located in developed areas that include other multifamily properties. The number of competitive multifamily properties in a particular area could have a material effect on the Company's ability to lease apartment units at its properties and on the rents charged. The Company may be competing with other entities that have greater resources than the Company and whose managers have more experience than the Company's managers. In addition, other forms of rental properties and single family housing provide housing alternatives to potential residents of multifamily properties. See Item 1A. Risk Factors for additional information with respect to competition.
Starwood Transaction
Following the approval by the Company's Board of Trustees, the Company executed an agreement with controlled affiliates of Starwood Capital Group ("Starwood") on October 23, 2015 to sell a portfolio of 72 operating properties consisting of 23,262 apartment units located in five markets across the United States for $5.365 billion (the "Starwood Transaction" or "Starwood Portfolio"). On January 26 and 27, 2016, the Company closed on the sale of the entire portfolio described above. The sale of the Starwood Portfolio, combined with the other 2016 dispositions, has resulted in the Company's exit from the South Florida, Denver and New England (excluding Boston) markets and has substantially completed the Company's portfolio transformation which started approximately ten years ago. These sales have narrowed the Company's focus, which is now entirely directed towards our six coastal markets. We believe the assets sold will have lower long-term returns (as compared to investments in our six coastal markets) and that we sold them for prices that are favorable. Given the strong demand for multifamily assets in our six coastal markets from institutional investors and the challenge in recycling $6.8 billion of capital in this competitive marketplace, the Company believed the best risk-adjusted use of the sale proceeds was to distribute a portion to our shareholders and use the remainder to repay outstanding debt (see further discussion below).
The Company used the majority of the proceeds from the Starwood Transaction and other 2016 dispositions to pay two special dividends to its shareholders and holders of OP Units of $11.00 per share/unit in the aggregate. The Company paid special dividends of $8.00 per share/unit (approximately $3.0 billion) on March 10, 2016 and $3.00 per share/unit (approximately $1.1 billion) on October 14, 2016. The Company used the majority of the remaining proceeds to reduce aggregate indebtedness in order to make the transaction leverage neutral. The Company retired approximately $2.0 billion in secured and unsecured debt, the majority of which was scheduled to mature in 2016 and 2017, improving the Company's already strong credit metrics.
Debt and Equity Activity
EQR issues public equity from time to time and guarantees certain debt of ERPOP. EQR does not have any indebtedness as all debt is incurred by the Operating Partnership. In addition, ERPOP issues OP Units and preference interests ("Preference Units") from time to time.
Please refer to Item 7, Management’s Discussion and Analysis of Financial Condition and Results of Operations, for the Company’s and the Operating Partnership's Capital Structure charts as of December 31, 2016.
Major Debt and Equity Activities for the Years Ended December 31, 2016, 2015 and 2014
During 2016:
| • | The Company repaid $440.8 million of 6.256% mortgage debt held in a Fannie Mae loan pool maturing in 2017 and incurred a prepayment penalty of approximately $29.3 million; |
| • | The Company repaid $65.5 million of various tax-exempt mortgage bonds maturing in 2026 through 2037 and incurred a prepayment penalty of approximately $0.2 million |
| • | The Company repaid $75.9 million of conventional fixed-rate mortgage loans and incurred prepayment penalties of approximately $2.2 million; |
| • | The Company repaid $0.9 million of conventional floating-rate mortgage loans; |
| • | The Company repaid $8.5 million of scheduled principal repayments on various mortgage debt; |
| • | The Company assumed $43.4 million of mortgage debt on one acquired property; |
| • | The Company repaid $228.9 million of 5.125% unsecured notes maturing in 2016 and incurred a prepayment penalty of approximately $1.4 million and repaid the remaining $271.1 million of 5.125% unsecured notes at maturity; |
| • | The Company repaid $400.0 million of 5.375% unsecured notes maturing in 2016 and incurred a prepayment penalty of approximately $9.5 million; |
| • | The Company repaid $255.9 million of 5.750% unsecured notes maturing in 2017 and incurred a prepayment penalty of approximately $16.5 million; |
| • | The Company repaid $46.1 million of 7.125% unsecured notes maturing in 2017 and incurred a prepayment penalty of approximately $4.6 million; |
| • | The Company repaid $250.0 million of 4.625% unsecured notes maturing in 2021 and incurred a prepayment penalty of approximately $31.6 million; |
| • | The Company repaid $48.0 million of 7.570% unsecured notes maturing in 2026 and incurred a prepayment penalty of approximately $19.3 million; |
| • | The Company issued $500.0 million of ten-year 2.85% fixed rate public notes, receiving net proceeds of $496.7 million before underwriting fees, hedge termination costs and other expenses, at an all-in effective interest rate of approximately 3.10% after termination of a forward starting swap in conjunction with the issuance (see Note 9 in the Notes to Consolidated Financial Statements for further discussion); |
| • | The Company issued 815,044 Common Shares pursuant to its Share Incentive Plans and received net proceeds of approximately $35.8 million; and |
| • | The Company issued 63,909 Common Shares pursuant to its Employee Share Purchase Plan and received net proceeds of approximately $3.7 million. |
During 2015:
| • | The Company repaid $368.5 million of mortgage debt; |
| • | The Company repaid $300.0 million of 6.584% unsecured notes at maturity; |
| • | The Company issued $450.0 million of ten-year 3.375% fixed rate public notes, receiving net proceeds of $447.5 million before underwriting fees, hedge termination costs and other expenses, at an all-in effective interest rate of 3.81% after termination of various forward starting swaps in conjunction with the issuance (see Note 9 in the Notes to Consolidated Financial Statements for further discussion); |
| • | The Company issued $300.0 million of thirty-year 4.50% fixed rate public notes, receiving net proceeds of $298.9 million before underwriting fees and other expenses, at an all-in effective interest rate of 4.55%; |
| • | The Company issued 1,456,363 Common Shares pursuant to its Share Incentive Plans and received net proceeds of approximately $59.5 million; |
| • | The Company issued 68,462 Common Shares pursuant to its Employee Share Purchase Plan and received net proceeds of approximately $4.4 million; and |
| • | The Company repurchased and retired 254,400 of its Series K Cumulative Redeemable Preferred Shares with a par value of $12.7 million for total cash consideration of approximately $16.3 million inclusive of premiums and accrued dividends through the redemption date. |
During 2014:
| • | The Company assumed $28.9 million of mortgage debt on one property; |
| • | The Company repaid $100.7 million of mortgage debt; |
| • | The Company repaid $500.0 million of 5.250% unsecured notes at maturity; |
| • | The Company repaid its $750.0 million unsecured term loan facility in conjunction with the note issuances discussed below; |
| • | The Company issued $450.0 million of five-year 2.375% fixed rate public notes, receiving net proceeds of $449.6 million before underwriting fees and other expenses, at an all-in effective interest rate of 2.52% and swapped the notes to a floating interest rate in conjunction with the issuance (see Note 9 in the Notes to Consolidated Financial Statements for further discussion); |
| • | The Company issued $750.0 million of thirty-year 4.50% fixed rate public notes, receiving net proceeds of $744.7 million before underwriting fees, hedge termination costs and other expenses, at an all-in effective interest rate of 4.57% after termination of various forward starting swaps in conjunction with the issuance (see Note 9 in the Notes to Consolidated Financial Statements for further discussion); |
| • | The Company issued 2,086,380 Common Shares pursuant to its Share Incentive Plans and received net proceeds of approximately $82.6 million; |
| • | The Company issued 68,807 Common Shares pursuant to its Employee Share Purchase Plan and received net proceeds of approximately $3.4 million; and |
| • | The Company repurchased and retired 31,240 of its Common Shares at a price of $56.87 per share for total consideration of $1.8 million (all related to the vesting of employee restricted shares). See Note 3 in the Notes to Consolidated Financial Statements for further discussion. |
EQR and ERPOP currently have an active universal shelf registration statement for the issuance of equity and debt securities that automatically became effective upon filing with the SEC on June 28, 2016 and expires on June 28, 2019. Per the terms of ERPOP’s partnership agreement, EQR contributes the net proceeds of all equity offerings to the capital of ERPOP in exchange for additional OP Units (on a one-for-one Common Share per OP Unit basis) or preference units (on a one-for-one preferred share per preference unit basis).
Credit Facilities
EQR does not have any indebtedness as all debt is incurred by the Operating Partnership. EQR guarantees the Operating Partnership’s revolving credit facility up to the maximum amount and for the full term of the facility.
On November 3, 2016, the Company replaced its existing $2.5 billion facility with a $2.0 billion unsecured revolving credit facility maturing January 10, 2022. The Company has the ability to increase available borrowings by an additional $750.0 million by adding additional banks to the facility or obtaining the agreement of existing banks to increase their commitments. The interest rate on advances under the facility will generally be LIBOR plus a spread (currently 0.825%), or based on bids received from the lending group, and the Company pays an annual facility fee (currently 12.5 basis points). Both the spread and the facility fee are dependent on the credit rating of the Company's long-term debt.
The Company's previous $2.5 billion unsecured revolving credit facility was set to mature on April 2, 2018. The Company had the ability to increase available borrowings by an additional $500.0 million by adding additional banks to the facility or obtaining the agreement of existing banks to increase their commitments. The interest rate on advances under the facility was generally LIBOR plus a spread (was 0.95% at termination), or based on bids received from the lending group, and the Company paid an annual facility fee (was 15 basis points at termination). Both the spread and the facility fee were dependent on the credit rating of the Company's long-term debt.
On February 2, 2015, the Company entered into an unsecured commercial paper note program in the United States. The Company may borrow up to a maximum of $500.0 million under this program subject to market conditions. The notes will be sold under customary terms in the United States commercial paper note market and will rank pari passu with all of the Company's other unsecured senior indebtedness. The Company does not intend to borrow more than $2.0 billion on the commercial paper program and new revolving credit facility combined. As of February 17, 2017, there was a balance of $100.0 million outstanding on the commercial paper program. As of December 31, 2016, there was a balance of $20.0 million outstanding on the commercial paper program. As of December 31, 2015, there was a balance of $387.3 million on the commercial paper program ($387.5 million in principal outstanding net of an unamortized discount of $0.2 million). The notes bear interest at various floating rates with a weighted average of 0.90% and 0.56% for the years ended December 31, 2016 and 2015, respectively, and a weighted average maturity of 4 days and 19 days as of December 31, 2016 and 2015, respectively.
As of February 17, 2017, no amounts were outstanding and the amount available on the revolving credit facility was $1.88 billion (net of $20.6 million which was restricted/dedicated to support letters of credit and net of the $100.0 million outstanding
on the commercial paper program). As of December 31, 2016, the amount available on the revolving credit facility was $1.96 billion (net of $20.6 million which was restricted/dedicated to support letters of credit and net of the $20.0 million outstanding on the commercial paper program). During the year ended December 31, 2016, the weighted average interest rate on the revolving credit facility was 1.37%. As of December 31, 2015, the amount available on the revolving credit facility was $2.07 billion (net of $45.1 million which was restricted/dedicated to support letters of credit and net of the $387.5 million outstanding on the commercial paper program). During the year ended December 31, 2015, the weighted average interest rate on the revolving credit facility was 1.07%.
Environmental Considerations
See Item 1A. Risk Factors for information concerning the potential effects of environmental regulations on our operations.
Item 1A. Risk Factors
General
References to "EQR" mean Equity Residential, a Maryland real estate investment trust ("REIT"), and references to "ERPOP" mean ERP Operating Limited Partnership, an Illinois limited partnership. Unless otherwise indicated, when used in this section, the terms “Company,” “we,” “us” or “our” mean collectively EQR, ERPOP and those entities/subsidiaries owned or controlled by EQR and/or ERPOP and the term “Operating Partnership” means collectively ERPOP and those entities/subsidiaries owned or controlled by ERPOP. This Item 1A. includes forward-looking statements. You should refer to our discussion of the qualifications and limitations on forward-looking statements included in Item 7, Management's Discussion and Analysis of Financial Condition and Results of Operations.
The occurrence of the events discussed in the following risk factors could adversely affect, possibly in a material manner, our business, financial condition or results of operations, which could adversely affect the value of our common shares of beneficial interest or preferred shares of beneficial interest (which we refer to collectively as “Shares”), Preference Units, OP Units, restricted units and our public unsecured debt. In this section, we refer to the Shares, Preference Units, OP Units, restricted units and public unsecured debt together as our “securities” and the investors who own such securities as our “security holders”.
Our performance and securities value are subject to risks associated with the real estate industry.
General
Real property investments are subject to varying degrees of risk and are relatively illiquid. Numerous factors may adversely affect the economic performance and value of our properties and the ability to realize that value. These factors include changes in the global, national, regional and local political and economic climates, local conditions such as an oversupply of multifamily properties or a reduction in demand for our multifamily properties, the attractiveness of our properties to residents, competition from other multifamily properties and single family homes (both as rentals and owned housing) and changes in market rental rates. Our performance also depends on our ability to collect rent from residents and to pay for adequate maintenance, insurance and other operating costs, including real estate taxes, all of which could increase over time. These operating expenses could rise faster than our revenues causing our income to decline. In circumstances where we buy or sell properties, including large portfolios of properties, overhead (property management expense and general and administrative expense) may not increase/decrease proportionally with the associated changes in revenue. Costs of labor and materials required for maintenance, repair, capital expenditure or development may be more expensive than anticipated. Also, the expenses of owning and operating a property are not necessarily reduced when circumstances such as market factors and competition cause a reduction in income from the property.
We may be unable to renew leases or relet units as leases expire.
When our residents decide to leave our apartments, we may not be able to relet their apartment units. Even if the residents do renew or we can relet the apartment units, the terms of renewal or reletting may be less favorable than current lease terms. If we are unable to promptly renew the leases or relet the apartment units, or if the rental rates upon renewal or reletting are significantly lower than expected rates, then our results of operations and financial condition will be adversely affected. If residents do not experience increases in their income, we may be unable to increase rent and/or delinquencies may increase. Occupancy levels and market rents may be adversely affected by national and local political, economic and market conditions including, without limitation, new construction and excess inventory of multifamily and owned housing/condominiums, increasing portions of owned housing/condominium stock being converted to rental use, rental housing subsidized by the government, other government programs that favor single family rental housing or owner occupied housing over multifamily rental housing, governmental
regulations, slow or negative employment growth and household formation, the availability of low-interest mortgages or the availability of mortgages requiring little or no down payment for single family home buyers, changes in social preferences and the potential for geopolitical instability, all of which are beyond our control. In addition, various state and local municipalities have enacted and may continue to enact rent control legislation or take other actions which could limit our ability to raise rents. Finally, the federal government's policies, many of which may encourage home ownership, can increase competition and possibly limit our ability to raise rents. Consequently, our cash flow and ability to service debt and make distributions to security holders could be reduced.
The retail/commercial space at our properties primarily serves as an additional amenity for our residents and neighbors. The long term nature of our retail/commercial leases (generally five to ten years with market based renewal options) and the characteristics of many of our tenants (generally small, local businesses) may subject us to certain risks. We may not be able to lease new space for rents that are consistent with our projections or for market rates. Also, when leases for our existing retail/commercial space expire, the space may not be relet or the terms of reletting, including the cost of allowances and concessions to tenants, may be less favorable than the current lease terms. Our properties compete with other properties with retail/commercial space. The presence of competitive alternatives may affect our ability to lease space and the level of rents we can obtain. If our retail/commercial tenants experience financial distress or bankruptcy, they may fail to comply with their contractual obligations, seek concessions in order to continue operations or cease their operations which could adversely impact our results of operations and financial condition. The revenues from our retail/commercial space represent approximately 4.5% of our total rental income.
We have increased our concentration of properties in our core markets, which could have an adverse effect on our operations if a particular market is adversely affected by economic or other conditions.
Over the past ten years, the Company has exited its non-core markets as part of its strategy to reposition its portfolio, leaving the Company highly concentrated in its six core coastal markets. If any one or more of our core markets (Boston, New York, Washington D.C., Southern California, San Francisco and Seattle) is adversely affected by local or regional economic conditions (such as business layoffs, industry slowdowns, changing demographics and other factors) or local real estate conditions (such as oversupply of or reduced demand for multifamily properties), such conditions may have an increased adverse impact on our results of operations than if our portfolio were more geographically diverse.
Because real estate investments are illiquid, we may not be able to sell properties when appropriate.
Real estate investments generally cannot be sold quickly. We may not be able to reconfigure our portfolio promptly in response to economic or other conditions. We may be unable to consummate such dispositions in a timely manner, on attractive terms, or at all. This inability to reallocate our capital promptly could adversely affect our financial condition and ability to make distributions to our security holders.
New acquisitions, development projects and/or rehabs may fail to perform as expected and competition for acquisitions may result in increased prices for properties that we would like to acquire.
We intend
Showing the first 8K of 104K characters. Open the full section
Item 1B. Unresolved Staff Comments
None.
Item 2. Properties
As of December 31, 2016, the Company, directly or indirectly through investments in title holding entities, owned all or a portion of 302 properties located in 10 states and the District of Columbia consisting of 77,458 apartment units. See Note 4 in the Notes to Consolidated Financial Statements for discussion of the Starwood Transaction and the significant dispositions which occurred during 2016. See also Item 1, Business, for additional information regarding the Comapany's properties and the markets/metro areas upon which we are focused. The Company’s properties are summarized by building type in the following table:
| Type | Properties | Apartment Units | Average Apartment Units | ||||||
| Garden | 110 | 27,769 | 252 | ||||||
| Mid/High-Rise | 192 | 49,689 | 259 | ||||||
| 302 | 77,458 | 256 |
The Company’s properties are summarized by ownership type in the following table:
| Properties | Apartment Units | |||||
| Wholly Owned Properties | 280 | 72,445 | ||||
| Master-Leased Properties – Consolidated | 3 | 853 | ||||
| Partially Owned Properties – Consolidated | 17 | 3,215 | ||||
| Partially Owned Properties – Unconsolidated | 2 | 945 | ||||
| 302 | 77,458 |
The following table sets forth certain information by market relating to the Company's properties at December 31, 2016:
| Portfolio Summary | |||||||||||||
| Markets/Metro Areas | Properties | Apartment Units | % of Stabilized NOI (A) | Average Rental Rate (B) | |||||||||
| Los Angeles | 70 | 15,857 | 18.3 | % | $ | 2,382 | |||||||
| Orange County | 12 | 3,684 | 3.9 | % | 2,028 | ||||||||
| San Diego | 13 | 3,505 | 3.9 | % | 2,198 | ||||||||
| Subtotal – Southern California | 95 | 23,046 | 26.1 | % | 2,295 | ||||||||
| San Francisco | 54 | 12,959 | 19.7 | % | 3,064 | ||||||||
| New York | 40 | 10,632 | 17.9 | % | 3,751 | ||||||||
| Washington D.C. | 47 | 15,637 | 17.6 | % | 2,341 | ||||||||
| Boston | 26 | 7,007 | 10.7 | % | 2,819 | ||||||||
| Seattle | 37 | 7,096 | 8.0 | % | 2,161 | ||||||||
| Other Markets | 1 | 136 | — | % | 1,146 | ||||||||
| Total | 300 | 76,513 | 100.0 | % | 2,674 | ||||||||
| Unconsolidated Properties | 2 | 945 | — | — | |||||||||
| Grand Total | 302 | 77,458 | 100.0 | % | $ | 2,674 |
Note: Projects under development are not included in the Portfolio Summary until construction has been completed.
(A) % of Stabilized NOI - Represents budgeted 2017 NOI for stabilized properties and projected annual NOI at stabilization (defined as having achieved 90% occupancy for three consecutive months) for properties that are in lease-up.
(B) Average Rental Rate - Total residential rental revenues divided by the weighted average occupied apartment units for the reporting period presented.
The Company’s properties had an average occupancy of approximately 94.6% (95.7% on a same store basis) at December 31, 2016. Certain of the Company’s properties are encumbered by mortgages and additional detail can be found on Schedule III – Real Estate and Accumulated Depreciation. Resident leases are generally for twelve months in length and can require security deposits. The garden-style properties are generally defined as properties with two and/or three story buildings while the mid-rise/high-rise are defined as properties with greater than three story buildings. These two property types typically provide residents with amenities, such as rooftop decks and swimming pools, exercise rooms and community rooms. Certain of these properties offer additional amenities such as saunas, whirlpools, spas, sports courts and exercise rooms or other amenities. In addition, many of our urban properties have parking garage and/or retail components.
The consolidated properties currently in various stages of development and lease-up at December 31, 2016 are included in the following table:
| Development and Lease-Up Projects as of December 31, 2016 | |||||||||||||||||||||||||||||||||||
| (Amounts in thousands except for project and apartment unit amounts) | |||||||||||||||||||||||||||||||||||
| Projects | Location | No. of Apartment Units | Total Capital Cost (1) | Total Book Value to Date | Total Book Value Not Placed in Service | Total Debt | Percentage Completed | Percentage Leased | Percentage Occupied | Estimated Completion Date | Estimated Stabilization Date | ||||||||||||||||||||||||
| Projects Under Development: | |||||||||||||||||||||||||||||||||||
| The Alton (formerly Millikan) | Irvine, CA | 344 | $ | 102,331 | $ | 101,907 | $ | 39,993 | $ | — | 96 | % | 23 | % | 17 | % | Q1 2017 | Q1 2018 | |||||||||||||||||
| 455 Eye Street | Washington, DC | 174 | 73,157 | 58,558 | 58,558 | — | 72 | % | — | — | Q3 2017 | Q2 2018 | |||||||||||||||||||||||
| 855 Brannan (formerly 801 Brannan) | San Francisco, CA | 449 | 304,035 | 208,268 | 208,268 | — | 66 | % | — | — | Q3 2017 | Q1 2019 | |||||||||||||||||||||||
| Helios (formerly 2nd & Pine) | Seattle, WA | 398 | 215,787 | 180,505 | 180,505 | — | 81 | % | — | — | Q3 2017 | Q2 2019 | |||||||||||||||||||||||
| Cascade | Seattle, WA | 477 | 176,378 | 123,462 | 123,462 | — | 68 | % | — | — | Q3 2017 | Q2 2019 | |||||||||||||||||||||||
| 100 K Street | Washington, DC | 222 | 88,023 | 26,382 | 26,382 | — | 9 | % | — | — | Q4 2018 | Q4 2019 | |||||||||||||||||||||||
| Projects Under Development | 2,064 | 959,711 | 699,082 | 637,168 | — | ||||||||||||||||||||||||||||||
| Completed Not Stabilized (2): | |||||||||||||||||||||||||||||||||||
| Potrero 1010 | San Francisco, CA | 453 | 224,474 | 219,668 | — | — | 97 | % | 96 | % | Completed | Q1 2017 | |||||||||||||||||||||||
| 340 Fremont (formerly Rincon Hill) | San Francisco, CA | 348 | 292,054 | 286,996 | — | — | 80 | % | 73 | % | Completed | Q2 2017 | |||||||||||||||||||||||
| One Henry Adams | San Francisco, CA | 241 | 172,337 | 162,647 | — | — | 26 | % | 22 | % | Completed | Q4 2017 | |||||||||||||||||||||||
| Altitude (formerly Village at Howard Hughes) | Los Angeles, CA | 545 | 193,231 | 191,702 | — | — | 54 | % | 52 | % | Completed | Q1 2018 | |||||||||||||||||||||||
| Projects Completed Not Stabilized | 1,587 | 882,096 | 861,013 | — | — | ||||||||||||||||||||||||||||||
| Completed and Stabilized During the Quarter: | |||||||||||||||||||||||||||||||||||
| Vista 99 (formerly Tasman) | San Jose, CA | 554 | 204,223 | 202,884 | — | — | 94 | % | 93 | % | Completed | Stabilized | |||||||||||||||||||||||
| Projects Completed and Stabilized During the Quarter | 554 | 204,223 | 202,884 | — | — | ||||||||||||||||||||||||||||||
| Total Development Projects | 4,205 | $ | 2,046,030 | $ | 1,762,979 | $ | 637,168 | $ | — | ||||||||||||||||||||||||||
| Land Held for Development | N/A | N/A | $ | 118,816 | $ | 118,816 | $ | — | |||||||||||||||||||||||||||
| Note: All development projects listed are wholly owned by the Company. | |||||||||||||||||||||||||||||||||||
| (1) | Total Capital Cost - Estimated cost for projects under development and/or developed and all capitalized costs incurred to date plus any estimates of costs remaining to be funded for all projects, including land acquisition costs, construction costs, capitalized real estate taxes and insurance, capitalized interest and loan fees, permits, professional fees, allocated development overhead and other regulatory fees, all in accordance with GAAP. | ||||||||||||||||||||||||||||||||||
| (2) | Properties included here are substantially complete. However, they may still require additional exterior and interior work for all apartment units to be available for leasing. |
Item 3. Legal Proceedings
The Company was party to a housing discrimination lawsuit brought by a non-profit civil rights organization in April 2006 in the U.S. District Court for the District of Maryland. The suit alleged that the Company designed and built many of its properties in violation of the accessibility requirements of the Fair Housing Act (“FHA”) and Americans With Disabilities Act (“ADA”). The suit sought actual and punitive damages, injunctive relief (including modification of non-compliant properties), costs and attorneys’ fees. On March 31, 2016, the Court found that certain features at seven of the Company’s properties did not satisfy the accessibility requirements of the FHA. During the fourth quarter of 2016, the Company settled the lawsuit for $3.1 million, net of insurance recoveries already received. The Company also agreed to undertake the remediation of certain inaccessible features at a limited number of properties.
The Company does not believe there is any other litigation pending or threatened against it that, individually or in the aggregate, may reasonably be expected to have a material adverse effect on the Company.
Item 4. Mine Safety Disclosures
Not applicable.
PART II
Item 5. Market for Registrant’s Common Equity, Related Stockholder Matters and Issuer Purchases of Equity Securities
Common Share Market Prices and Dividends (Equity Residential)
The following table sets forth, for the years indicated, the high, low and closing sales prices for and the distributions declared on the Company’s Common Shares, which trade on the New York Stock Exchange under the trading symbol EQR.
| Sales Price | ||||||||||||||||
| High | Low | Closing | Distributions | |||||||||||||
| 2016 | ||||||||||||||||
| Fourth Quarter Ended December 31, 2016 | $ | 65.14 | $ | 58.28 | $ | 64.36 | $ | 0.50375 | ||||||||
| Third Quarter Ended September 30, 2016 | $ | 71.53 | $ | 62.39 | $ | 64.33 | $ | 3.50375 | ||||||||
| Second Quarter Ended June 30, 2016 | $ | 75.49 | $ | 63.11 | $ | 68.88 | $ | 0.50375 | ||||||||
| First Quarter Ended March 31, 2016 | $ | 81.76 | $ | 66.62 | $ | 75.03 | $ | 8.50375 | ||||||||
| 2015 | ||||||||||||||||
| Fourth Quarter Ended December 31, 2015 | $ | 82.39 | $ | 74.38 | $ | 81.59 | $ | 0.55250 | ||||||||
| Third Quarter Ended September 30, 2015 | $ | 81.98 | $ | 61.90 | $ | 75.12 | $ | 0.55250 | ||||||||
| Second Quarter Ended June 30, 2015 | $ | 79.23 | $ | 69.94 | $ | 70.17 | $ | 0.55250 | ||||||||
| First Quarter Ended March 31, 2015 | $ | 82.53 | $ | 72.06 | $ | 77.86 | $ | 0.55250 |
Note: In addition to the regular quarterly dividends, the Company paid special dividends of $8.00 per share/unit (approximately $3.0 billion) on March 10, 2016 and $3.00 per share/unit (approximately $1.1 billion) on October 14, 2016.
The number of record holders of Common Shares at February 17, 2017 was approximately 2,400. The number of outstanding Common Shares as of February 17, 2017 was 367,097,667.
Unit Dividends (ERP Operating Limited Partnership)
There is no established public market for the Units (OP Units and restricted units).
The following table sets forth, for the years indicated, the distributions declared on the Operating Partnership's Units.
| Distributions | ||||||||
| 2016 | 2015 | |||||||
| Fourth Quarter Ended December 31, | $ | 0.50375 | $ | 0.55250 | ||||
| Third Quarter Ended September 30, | $ | 3.50375 | $ | 0.55250 | ||||
| Second Quarter Ended June 30, | $ | 0.50375 | $ | 0.55250 | ||||
| First Quarter Ended March 31, | $ | 8.50375 | $ | 0.55250 |
Note: In addition to the regular quarterly dividends, the Company paid special dividends of $8.00 per share/unit (approximately $3.0 billion) on March 10, 2016 and $3.00 per share/unit (approximately $1.1 billion) on October 14, 2016.
The number of record holders of Units in the Operating Partnership at February 17, 2017 was approximately 500. The number of outstanding Units as of February 17, 2017 was 380,926,413.
Unregistered Common Shares Issued in the Quarter Ended December 31, 2016 (Equity Residential)
During the quarter ended December 31, 2016, EQR issued 1,670 Common Shares in exchange for 1,670 OP Units held by various limited partners of ERPOP. OP Units are generally exchangeable into Common Shares on a one-for-one basis or, at the option of ERPOP, the cash equivalent thereof, at any time one year after the date of issuance. These shares were either registered under the Securities Act of 1933, as amended (the “Securities Act”), or issued in reliance on an exemption from registration under Section 4(2) of the Securities Act and the rules and regulations promulgated thereunder, as these were transactions by an issuer not involving a public offering. In light of the manner of the sale and information obtained by EQR from the limited partners in
connection with these transactions, EQR believes it may rely on these exemptions.
Equity Compensation Plan Information
The following table provides information as of December 31, 2016 with respect to the Company's Common Shares that may be issued under its existing equity compensation plans.
| Number of securities to be issued upon exercise of outstanding options, warrants and rights | Weighted average exercise price of outstanding options, warrants and rights | Number of securities remaining available for future issuance under equity compensation plans (excluding securities in column (a)) | ||||
| Plan Category | ||||||
| (a) (1) | (b) (1) | (c) (2) | ||||
| Equity compensation plans approved by shareholders | 6,023,101 | $42.05 | 11,501,716 | |||
| Equity compensation plans not approved by shareholders | N/A | N/A | N/A |
| (1) | The amounts shown in columns (a) and (b) of the above table do not include 452,034 outstanding Common Shares (all of which are restricted and subject to vesting requirements) that were granted under the Company's 2011 Share Incentive Plan, as amended (the "2011 Plan") and outstanding Common Shares that have been purchased by employees and trustees under the Company's ESPP. |
| (2) | Includes 8,595,553 Common Shares that may be issued under the 2011 Plan, of which only 33% may be in the form of restricted shares/units, and 2,906,163 Common Shares that may be sold to employees and trustees under the ESPP. |
Any Common Shares issued pursuant to EQR's incentive equity compensation and employee share purchase plans will result in ERPOP issuing OP Units to EQR on a one-for-one basis, with ERPOP receiving the net cash proceeds of such issuances.
| Item 6. | Selected Financial Data |
The following tables set forth selected financial and operating information on a historical basis for the Company and the Operating Partnership. The following information should be read in conjunction with all of the financial statements and notes thereto included elsewhere in this Form 10-K. The historical operating and balance sheet data have been derived from the historical financial statements of the Company and the Operating Partnership. Selected balance sheet amounts have also been restated in accordance with the new deferred financing cost guidance effective January 1, 2016 (see Note 2 in the Notes to Consolidated Financial Statements for further discussion). Certain capitalized terms as used herein are defined in the Notes to Consolidated Financial Statements.
| EQUITY RESIDENTIAL | ||||||||||||||||||||
| CONSOLIDATED HISTORICAL FINANCIAL INFORMATION | ||||||||||||||||||||
| (Financial information in thousands except for per share and property data) | ||||||||||||||||||||
| Year Ended December 31, | ||||||||||||||||||||
| 2016 | 2015 | 2014 | 2013 | 2012 | ||||||||||||||||
| OPERATING DATA: | ||||||||||||||||||||
| Total revenues from continuing operations | $ | 2,425,800 | $ | 2,744,965 | $ | 2,614,748 | $ | 2,387,702 | $ | 1,747,502 | ||||||||||
| Interest and other income |
Showing the first 8K of 165K characters. Open the full section
Item 7A. Quantitative and Qualitative Disclosures about Market Risk
Market risks relating to the Company’s financial instruments result primarily from changes in short-term LIBOR interest rates and changes in the Securities Industry and Financial Markets Association ("SIFMA") index for tax-exempt debt. The Company’s exposure to market risk for changes in interest rates relates to the unsecured revolving credit facility and commercial paper program, the floating rate tax-exempt debt and the fair value hedges that convert fixed rate debt to floating rate debt as well as exposure on the refinancing of its debt. The Company typically incurs fixed rate debt obligations to finance acquisitions while it typically incurs floating rate debt obligations to finance working capital needs and as a temporary measure in advance of securing long-term fixed rate financing. The Company continuously evaluates its level of floating rate debt with respect to total debt and other factors, including its assessment of the current and future economic environment. To the extent the Company carries substantial cash balances, this will tend to partially counterbalance any increase or decrease in interest rates.
The Company also utilizes certain derivative financial instruments to manage market risk. Interest rate protection agreements are used to convert floating rate debt to a fixed rate basis or vice versa as well as to partially lock in rates on future debt issuances. Derivatives are used for hedging purposes rather than speculation. The Company does not enter into financial instruments for trading purposes. See also Note 9 in the Notes to Consolidated Financial Statements for additional discussion of derivative instruments.
The fair values of the Company’s financial instruments (including such items in the financial statement captions as cash and cash equivalents, other assets, accounts payable and accrued expenses and other liabilities) approximate their carrying or contract values based on their nature, terms and interest rates that approximate current market rates. The fair value of the Company’s mortgage notes payable and unsecured debt (including its commercial paper) were approximately $4.2 billion and $5.0 billion, respectively, at December 31, 2016.
At December 31, 2016, the Company had total outstanding floating rate debt of approximately $1.1 billion, or 12.3% of total debt, net of the effects of any derivative instruments. If market rates of interest on all of the floating rate debt permanently increased by 11 basis points (a 10% increase from the Company’s existing weighted average interest rates), the increase in interest expense on the floating rate debt would decrease future earnings and cash flows by approximately $1.3 million. If market rates of interest on all of the floating rate debt permanently decreased by 11 basis points (a 10% decrease from the Company’s existing weighted average interest rates), the decrease in interest expense on the floating rate debt would increase future earnings and cash flows by approximately $1.3 million.
At December 31, 2016, the Company had total outstanding fixed rate debt of approximately $7.9 billion, or 87.7% of total debt, net of the effects of any derivative instruments. If market rates of interest permanently increased by 49 basis points (a 10% increase from the Company’s existing weighted average interest rates), the estimated fair value of the Company’s fixed rate debt would be approximately $7.2 billion. If market rates of interest permanently decreased by 49 basis points (a 10% decrease
from the Company’s existing weighted average interest rates), the estimated fair value of the Company’s fixed rate debt would be approximately $8.8 billion.
At December 31, 2016, the Company’s derivative instruments had a net asset fair value of approximately $1.9 million. If market rates of interest permanently increased by 24 basis points (a 10% increase from the Company’s existing weighted average interest rates), the net asset fair value of the Company’s derivative instruments would be approximately $0.4 million. If market rates of interest permanently decreased by 24 basis points (a 10% decrease from the Company’s existing weighted average interest rates), the net asset fair value of the Company’s derivative instruments would be approximately $3.4 million.
At December 31, 2015, the Company had total outstanding floating rate debt of approximately $1.5 billion, or 14.1% of total debt, net of the effects of any derivative instruments. If market rates of interest on all of the floating rate debt permanently increased by 8 basis points (a 10% increase from the Company’s existing weighted average interest rates), the increase in interest expense on the floating rate debt would decrease future earnings and cash flows by approximately $1.2 million. If market rates of interest on all of the floating rate debt permanently decreased by 8 basis points (a 10% decrease from the Company’s existing weighted average interest rates), the decrease in interest expense on the floating rate debt would increase future earnings and cash flows by approximately $1.2 million.
At December 31, 2015, the Company had total outstanding fixed rate debt of approximately $9.4 billion, or 85.9% of total debt, net of the effects of any derivative instruments. If market rates of interest permanently increased by 51 basis points (a 10% increase from the Company’s existing weighted average interest rates), the estimated fair value of the Company’s fixed rate debt would be approximately $8.6 billion. If market rates of interest permanently decreased by 51 basis points (a 10% decrease from the Company’s existing weighted average interest rates), the estimated fair value of the Company’s fixed rate debt would be approximately $10.5 billion.
At December 31, 2015, the Company’s derivative instruments had a net asset fair value of approximately $3.0 million. If market rates of interest permanently increased by 17 basis points (a 10% increase from the Company’s existing weighted average interest rates), the net asset fair value of the Company’s derivative instruments would be approximately $1.8 million. If market rates of interest permanently decreased by 17 basis points (a 10% decrease from the Company’s existing weighted average interest rates), the net asset fair value of the Company’s derivative instruments would be approximately $4.2 million.
These amounts were determined by considering the impact of hypothetical interest rates on the Company’s financial instruments. The foregoing assumptions apply to the entire amount of the Company’s debt and derivative instruments and do not differentiate among maturities. These analyses do not consider the effects of the changes in overall economic activity that could exist in such an environment. Further, in the event of changes of such magnitude, management would likely take actions to further mitigate its exposure to the changes. However, due to the uncertainty of the specific actions that would be taken and their possible effects, this analysis assumes no changes in the Company’s financial structure or results.
The Company cannot predict the effect of adverse changes in interest rates on its debt and derivative instruments and, therefore, its exposure to market risk, nor can there be any assurance that long-term debt will be available at advantageous pricing. Consequently, future results may differ materially from the estimated adverse changes discussed above.
Item 8. Financial Statements and Supplementary Data
See Index to Consolidated Financial Statements and Schedule on page F-1 of this Form 10-K.
Item 9. Changes in and Disagreements with Accountants on Accounting and Financial Disclosure
None.
Item 9A. Controls and Procedures
Equity Residential
(a) Evaluation of Disclosure Controls and Procedures:
Effective as of December 31, 2016, the Company carried out an evaluation, under the supervision and with the participation of the Company’s management, including the Chief Executive Officer and Chief Financial Officer, of the effectiveness of the Company’s disclosure controls and procedures pursuant to Exchange Act Rules 13a-15 and 15d-15. Based on that evaluation, the Chief Executive Officer and Chief Financial Officer concluded that the disclosure controls and procedures are effective to ensure that information required to be disclosed by the Company in its Exchange Act filings is recorded, processed, summarized and
reported within the time periods specified in the SEC’s rules and forms.
(b) Management’s Report on Internal Control over Financial Reporting:
Equity Residential’s management is responsible for establishing and maintaining adequate internal control over financial reporting, as such term is defined in Rule 13a-15(f) under the Exchange Act. Under the supervision and with the participation of management, including the Company’s Chief Executive Officer and Chief Financial Officer, management conducted an evaluation of the effectiveness of internal control over financial reporting based on the framework in Internal Control – Integrated Framework issued by the Committee of Sponsoring Organizations of the Treadway Commission (2013 framework).
Because of its inherent limitations, internal control over financial reporting may not prevent or detect misstatements. Therefore, even those systems determined to be effective can only provide reasonable assurance with respect to financial statement preparation and presentation.
Based on the Company’s evaluation under the framework in Internal Control – Integrated Framework, management concluded that its internal control over financial reporting was effective as of December 31, 2016. Our internal control over financial reporting has been audited as of December 31, 2016 by Ernst & Young LLP, an independent registered public accounting firm, as stated in their report which is included herein.
(c) Changes in Internal Control over Financial Reporting:
There were no changes to the internal control over financial reporting of the Company identified in connection with the Company’s evaluation referred to above that occurred during the fourth quarter of 2016 that have materially affected, or are reasonably likely to materially affect, the Company’s internal control over financial reporting.
ERP Operating Limited Partnership
(a) Evaluation of Disclosure Controls and Procedures:
Effective as of December 31, 2016, the Operating Partnership carried out an evaluation, under the supervision and with the participation of the Operating Partnership's management, including the Chief Executive Officer and Chief Financial Officer of EQR, of the effectiveness of the Operating Partnership's disclosure controls and procedures pursuant to Exchange Act Rules 13a-15 and 15d-15. Based on that evaluation, the Chief Executive Officer and Chief Financial Officer concluded that the disclosure controls and procedures are effective to ensure that information required to be disclosed by the Operating Partnership in its Exchange Act filings is recorded, processed, summarized and reported within the time periods specified in the SEC's rules and forms.
(b) Management’s Report on Internal Control over Financial Reporting:
ERP Operating Limited Partnership's management is responsible for establishing and maintaining adequate internal control over financial reporting, as such term is defined in Rule 13a-15(f) under the Exchange Act. Under the supervision and with the participation of management, including the Chief Executive Officer and Chief Financial Officer of EQR, management conducted an evaluation of the effectiveness of internal control over financial reporting based on the framework in Internal Control – Integrated Framework issued by the Committee of Sponsoring Organizations of the Treadway Commission (2013 framework).
Because of its inherent limitations, internal control over financial reporting may not prevent or detect misstatements. Therefore, even those systems determined to be effective can only provide reasonable assurance with respect to financial statement preparation and presentation.
Based on the Operating Partnership's evaluation under the framework in Internal Control – Integrated Framework, management concluded that its internal control over financial reporting was effective as of December 31, 2016. Our internal control over financial reporting has been audited as of December 31, 2016 by Ernst & Young LLP, an independent registered public accounting firm, as stated in their report which is included herein.
(c) Changes in Internal Control over Financial Reporting:
There were no changes to the internal control over financial reporting of the Operating Partnership identified in connection with the Operating Partnership’s evaluation referred to above that occurred during the fourth quarter of 2016 that have materially affected, or are reasonably likely to materially affect, the Operating Partnership’s internal control over financial reporting.
Item 9B. Other Information
None.
PART III
| Items 10, 11, 12, 13 and 14. |
Trustees, Executive Officers and Corporate Governance; Executive Compensation; Security Ownership of Certain Beneficial Owners and Management and Related Stockholder Matters; Certain Relationships and Related Transactions, and Trustee Independence; and Principal Accounting Fees and Services.
The information required by Item 10, Item 11, Item 12, Item 13 and Item 14 is incorporated by reference to, and will be contained in, Equity Residential's Proxy Statement, which the Company intends to file no later than 120 days after the end of its fiscal year ended December 31, 2016, and thus these items have been omitted in accordance with General Instruction G(3) to Form 10-K. Equity Residential is the general partner and 96.2% owner of ERP Operating Limited Partnership.
PART IV
Item 15. Exhibits and Financial Statement Schedules.
(a) The following documents are filed as part of this Report:
| (1) | Financial Statements: See Index to Consolidated Financial Statements and Schedule on page F-1 of this Form 10-K. |
| (2) | Exhibits: See the Exhibit Index. |
| (3) | Financial Statement Schedules: See Index to Consolidated Financial Statements and Schedule on page F-1 of this Form 10-K. |
SIGNATURES
Pursuant to the requirements of Section 13 or 15(d) of the Securities Exchange Act of 1934, each registrant has duly caused this report to be signed on its behalf by the undersigned thereunto duly authorized.
| EQUITY RESIDENTIAL | |||
| By: | /s/ David J. Neithercut | ||
| David J. Neithercut President and Chief Executive Officer (Principal Executive Officer) | |||
| Date: | February 23, 2017 |
| ERP OPERATING LIMITED PARTNERSHIP BY: EQUITY RESIDENTIAL ITS GENERAL PARTNER | |||
| By: | /s/ David J. Neithercut | ||
| David J. Neithercut President and Chief Executive Officer (Principal Executive Officer) | |||
| Date: | February 23, 2017 |
EQUITY RESIDENTIAL
ERP OPERATING LIMITED PARTNERSHIP
POWER OF ATTORNEY
KNOW ALL MEN/WOMEN BY THESE PRESENTS, that each person whose signature appears below, hereby constitutes and appoints David J. Neithercut, Mark J. Parrell and Ian S. Kaufman, or any of them, his or her attorneys-in-fact and agents, with full power of substitution and resubstitution for him or her in any and all capacities, to do all acts and things which said attorneys and agents, or any of them, deem advisable to enable the company to comply with the Securities Exchange Act of 1934, as amended, and any requirements or regulations of the Securities and Exchange Commission in respect thereof, in connection with the company’s filing of an annual report on Form 10-K for the company’s fiscal year 2016, including specifically, but without limitation of the general authority hereby granted, the power and authority to sign his or her name as a trustee or officer, or both, of the company, as indicated below opposite his or her signature, to the Form 10-K, and any amendment thereto; and each of the undersigned does hereby fully ratify and confirm all that said attorneys and agents, or any of them, or the substitute of any of them, shall do or cause to be done by virtue hereof.
Pursuant to the requirements of the Securities Exchange Act of 1934, this report has been signed below by the following persons on behalf of each registrant and in the capacities set forth below and on the dates indicated:
| Name | Title | Date | ||
| /s/ David J. Neithercut | President, Chief Executive Officer and Trustee | February 23, 2017 | ||
| David J. Neithercut | (Principal Executive Officer) | |||
| /s/ Mark J. Parrell | Executive Vice President and Chief Financial Officer | February 23, 2017 | ||
| Mark J. Parrell | (Principal Financial Officer) | |||
| /s/ Ian S. Kaufman | Senior Vice President and Chief Accounting Officer | February 23, 2017 | ||
| Ian S. Kaufman | (Principal Accounting Officer) | |||
| /s/ John W. Alexander | Trustee | February 23, 2017 | ||
| John W. Alexander | ||||
| /s/ Charles L. Atwood | Trustee | February 23, 2017 | ||
| Charles L. Atwood | ||||
| /s/ Linda Walker Bynoe | Trustee | February 23, 2017 | ||
| Linda Walker Bynoe | ||||
| /s/ Connie K. Duckworth | Trustee | February 23, 2017 | ||
| Connie K. Duckworth | ||||
| /s/ Mary Kay Haben | Trustee | February 23, 2017 | ||
| Mary Kay Haben | ||||
| /s/ Bradley A. Keywell | Trustee | February 23, 2017 | ||
| Bradley A. Keywell | ||||
| /s/ John E. Neal | Trustee | February 23, 2017 | ||
| John E. Neal | ||||
| /s/ Mark S. Shapiro | Trustee | February 23, 2017 | ||
| Mark S. Shapiro | ||||
| /s/ Stephen E. Sterrett | Trustee | February 23, 2017 | ||
| Stephen E. Sterrett | ||||
| /s/ B. Joseph White | Trustee | February 23, 2017 | ||
| B. Joseph White | ||||
| /s/ Gerald A. Spector | Vice Chairman of the Board of Trustees | February 23, 2017 | ||
| Gerald A. Spector | ||||
| /s/ Samuel Zell | Chairman of the Board of Trustees | February 23, 2017 | ||
| Samuel Zell |
INDEX TO CONSOLIDATED FINANCIAL STATEMENTS AND SCHEDULE
EQUITY RESIDENTIAL
ERP OPERATING LIMITED PARTNERSHIP
| PAGE | ||
| FINANCIAL STATEMENTS FILED AS PART OF THIS REPORT | ||
| Report of Independent Registered Public Accounting Firm (Equity Residential) | F-2 | |
| Report of Independent Registered Public Accounting Firm (ERP Operating Limited Partnership) | F-3 | |
| Report of Independent Registered Public Accounting Firm on Internal Control Over Financial Reporting (Equity Residential) | F-4 | |
| Report of Independent Registered Public Accounting Firm on Internal Control Over Financial Reporting (ERP Operating Limited Partnership) | F-5 | |
| Financial Statements of Equity Residential: | ||
| Consolidated Balance Sheets as of December 31, 2016 and 2015 | F-6 | |
| Consolidated Statements of Operations and Comprehensive Income for the years ended December 31, 2016, 2015 and 2014 | F-7 to F-8 | |
| Consolidated Statements of Cash Flows for the years ended December 31, 2016, 2015 and 2014 | F-9 to F-12 | |
| Consolidated Statements of Changes in Equity for the years ended December 31, 2016, 2015 and 2014 | F-13 to F-14 | |
| Financial Statements of ERP Operating Limited Partnership: | ||
| Consolidated Balance Sheets as of December 31, 2016 and 2015 | F-15 | |
| Consolidated Statements of Operations and Comprehensive Income for the years ended December 31, 2016, 2015 and 2014 | F-16 to F-17 | |
| Consolidated Statements of Cash Flows for the years ended December 31, 2016, 2015 and 2014 | F-18 to F-21 | |
| Consolidated Statements of Changes in Capital for the years ended December 31, 2016, 2015 and 2014 | F-22 to F-23 | |
| Notes to Consolidated Financial Statements of Equity Residential and ERP Operating Limited Partnership | F-24 to F-63 | |
| SCHEDULE FILED AS PART OF THIS REPORT | ||
| Schedule III – Real Estate and Accumulated Depreciation of Equity Residential and ERP Operating Limited Partnership | S-1 to S-11 |
All other schedules have been omitted because they are inapplicable, not required or the information is included elsewhere in the consolidated financial statements or notes thereto.
REPORT OF INDEPENDENT REGISTERED PUBLIC ACCOUNTING FIRM
To the Board of Trustees and Shareholders
Equity Residential
We have audited the accompanying consolidated balance sheets of Equity Residential (the “Company”) as of December 31, 2016 and 2015 and the related consolidated
Showing the first 8K of 389K characters. Open the full section