 filings.tools
Verisk Analytics (VRSK) 10-K risk factor changes: FY2020 vs FY2019
The 2020-12-31 10-K against the 2019-12-31 one, compared heading by heading and sentence by sentence.
Item 1A78 rewritten53 added80 removed160 unchanged
All filing items1,634 rewritten598 added998 removed1,094 unchanged
Summary
counted, not written
- Item 1A lists 25 risk factor headings: 0 new, 0 reworded and 25 unchanged since FY2019. 0 headings from FY2019 no longer appear.
- Sentence by sentence, 598 added, 998 removed, 1,634 rewritten and 1,094 unchanged across 22 items that differ.
New Item 1A headings (0)
No risk factor heading in this filing is absent from FY2019.
Removed Item 1A headings (0)
Every FY2019 risk factor heading is still here, word for word or reworded.
A heading is new when no FY2019 heading matches it after ignoring case and punctuation, and reworded when it shares at least 60 percent of its words with one that went away. All current risk factor headings.
Sentences by item
22 items, with every count and a link to each item that changed
Underlined words on a shaded ground are new in FY2020; struck-through words were in FY2019. Sentences that are wholly new or wholly gone are labelled rather than marked.
Item 1A. Risk Factors
78 rewritten, 53 added, 80 removed, 160 unchanged
Read the full itemFY2020 item · filed February 23, 2021FY2019 item · filed February 18, 2020
[removed: *You] [added: _You] should carefully consider the following risks and all of the other information set forth in this annual report on Form 10-K before deciding to invest in any of our securities.
In such case, the trading price of our securities, including our common stock, could decline due to any of these risks, and you may lose all or part of your [removed: investment.*][added: investment.]
[removed: We] [added: _We] could lose our access to data from external sources, which could prevent us from providing our [removed: solutions.][added: solutions._]
[removed: Fraudulent] [added: _Fraudulent] or unpermitted data access and other cyber-security or privacy breaches may negatively impact our business and harm our [removed: reputation.][added: reputation._]
| [added: |] • | deterring customers from using our solutions; |
| [added: |] • | deterring data suppliers from supplying data to us; |
| [added: |] • | harming our reputation; |
| [added: |] • | exposing us to liability; |
| [added: |] • | increasing operating expenses to correct problems caused by the breach; |
| [added: |] • | affecting our ability to meet customers’ expectations; and/or |
| [added: |] • | causing inquiry from governmental authorities. |
[removed: We] [added: _We] derive a substantial portion of our revenues from U.S. P&C primary insurers.
If there is a downturn in the U.S. insurance industry or that industry does not continue to accept our solutions, our revenues will [removed: decline.][added: decline._]
During the year ended December 31, [removed: 2019,] [added: 2020,] approximately [removed: 49%] [added: 51%] of our revenue was derived from solutions provided to U.S. P&C primary insurers.
Also, [added: our] invoices for certain of our solutions are linked in part to premiums in the U.S. P&C insurance market, which may rise or fall in any given year due to loss experience and capital capacity and other factors in the insurance industry that are beyond our control.
| [added: |] • | changes in the business analytics industry, |
| [added: |] • | changes in technology, |
| [added: |] • | our inability to obtain or use state fee schedule or claims data in our insurance solutions, |
| [added: |] • | saturation of market demand, |
| [added: |] • | loss of key customers, |
| [added: |] • | industry consolidation, and |
| [added: |] • | failure to execute our customer-focused selling approach. |
[removed: Acquisitions] [added: _Acquisitions] could result in operating difficulties, dilution and other harmful consequences, and we may not be successful in achieving growth through [removed: acquisitions.][added: acquisitions._]
| [added: |] • | failing to implement or remediate controls, procedures and policies appropriate for a larger public company at acquired companies that prior to the acquisition lacked such controls, procedures and policies, |
| [added: |] • | paying more than fair market value for an acquired company or assets, |
| [added: |] • | failing to integrate the operations and personnel of the acquired businesses in an efficient, timely manner, |
| [added: |] • | assuming potential liabilities of an acquired company, |
| [added: |] • | managing the potential disruption to our ongoing business, |
| [added: |] • | distracting management focus from our core businesses, |
| [added: |] • | failing to retain management at the acquired company, |
| [added: |] • | difficulty in acquiring suitable businesses, including challenges in predicting the value an acquisition will ultimately contribute to our business, |
| [added: |] • | possibility of overpaying for acquisitions, particularly those with significant intangible assets that derive value using novel tools and/or are involved in niche markets, |
| [added: |] • | impairing relationships with employees, customers, and strategic partners, |
| [added: |] • | incurring expenses associated with the amortization of intangible assets particularly for intellectual property and other intangible assets, |
| [added: |] • | incurring expenses associated with an impairment of all or a portion of goodwill and other intangible assets due to changes in market conditions, weak economies in certain competitive markets, or the failure of certain acquisitions to realize expected benefits, and |
| [added: |] • | diluting the share value and voting power of existing stockholders. |
[removed: There] [added: _There] may be consolidation in our end customer market, which could reduce the use of our [removed: services.][added: services._]
[removed: If] [added: _If] we are unable to develop successful new solutions or if we experience defects, failures and delays associated with the introduction of new solutions, our business could suffer serious [removed: harm.][added: harm._]
Our growth and success [removed: depends] [added: depend] upon our ability to develop and sell new solutions.
[removed: We] [added: _We] will continue to rely upon proprietary technology rights, and if we are unable to protect them, our business could be [removed: harmed.][added: harmed._]
In addition to the effects of the COVID-19 pandemic and resulting global disruptions on our business and operations discussed in Item 7 of Part II, "Management's Discussion Analysis of Financial Condition and Results of Operations," and in the risk factors below, additional or unforeseen effects from the COVID-19 pandemic and the global economic climate may give rise to or amplify many of the risks discussed below._
Risks Related to Our Business
| --- | --- | --- |
| | | |
| | | |
| | | |
| | | |
| | | |
| | | |
| --- | --- | --- |
| | | |
| --- | --- | --- |
| | | |
| | | |
| | | |
| | | |
| --- | --- | --- |
| | | |
| | | |
| --- | --- | --- |
| | | |
| | | |
| | | |
| | | |
| | | |
Risks Related to Our Intellectual Property and Cybersecurity
| --- | --- | --- |
| | | |
| | | |
| | | |
| | | |
| | | |
| | | |
Risks Related to Legal, Regulatory and Compliance Matters
| --- | --- | --- |
| | | |
| | | |
| | | |
In the Xactware Solutions, Inc. patent litigation, on February 16, 2021, the United States District Court for the District of New Jersey granted the plaintiff's motion for enhanced damages and attorneys' fees.
The Court trebled the jury's award of $125.0 million, awarding enhanced damages for a total of $375.0 million, and also awarded the plaintiff pre-judgment and post-judgment interest.
| | |
| --- | --- |
| | |
| --- | --- |
| | |
| --- | --- |
| | |
| --- | --- |
| | |
| --- | --- |
| | |
| --- | --- |
| | |
| --- | --- |
| | |
| --- | --- |
| | |
| --- | --- |
| | |
| --- | --- |
| | |
| --- | --- |
| | |
| --- | --- |
| | |
| --- | --- |
| | |
| --- | --- |
| | |
| --- | --- |
| | |
| --- | --- |
| | |
| --- | --- |
| | |
| --- | --- |
| | |
| --- | --- |
| | |
| --- | --- |
An excerpt. Shown here: 40 of 78 rewritten, 40 of 53 added and 40 of 80 removed. The counts are complete. For every sentence, read Item 1A. Risk Factors in the FY2020 filing and the FY2019 filing.
Item 7. Management’s Discussion and Analysis of Financial Condition and Results of Operations
212 rewritten, 115 added, 128 removed, 136 unchanged
Read the full itemFY2020 item · filed February 23, 2021FY2019 item · filed February 18, 2020
[removed: *The] [added: _The] following discussion should be read in conjunction with our historical financial statements and the related notes included elsewhere in this annual report on Form 10-K, as well as the discussion under “Selected Consolidated Financial Data.” This discussion contains forward-looking statements that involve risks and [removed: uncertainties.][added: uncertainties, including the impact of the 2019 novel coronavirus ("COVID-19").]
Our actual results may differ materially from those discussed in or implied by any of the forward-looking statements as a result of various factors, including but not limited to those listed under “Risk Factors” and “Special Note Regarding Forward-Looking [removed: Statements.”*][added: Statements.”_]
[removed: *This] [added: _This] discussion includes a comparison of our results of operations, liquidity and capital resources, financing and financing capacity and cash flow for the years [removed: ended* *December] [added: ended December] 31, [removed: 2019* *and* *2018*.][added: 2020 and 2019_.]
[removed: *A] [added: _A] discussion of changes in our results of operations and cash flows for the years [removed: ended* *December] [added: ended December] 31, [removed: 2018* *and* *2017* *can] [added: 2019 and 2018_ _can] be found in "Item 7.
Management's Discussion and Analysis of Financial Condition and Results of Operations" within the annual report on Form 10-K for the year [removed: ended* *December] [added: ended December] 31, [removed: 2018* *filed] [added: 2019 filed] on February [removed: 19, 2019.*][added: 18, 2020._]
In the [removed: United States, or] U.S., and around the world, we help customers protect people, property, and financial assets.
Refer to [removed: Item 1.][added: [Item 1](#i1).]
This segment's revenues represented approximately 71% of our revenues for the years ended December 31, [removed: 2019] [added: 2020] and [removed: 2018.][added: 2019.]
Our Energy and Specialized Markets segment provides research and consulting data analytics for the global energy, [added: chemicals, and metals and mining industries.]
Our Energy and Specialized Markets segment's revenues represented approximately [added: 23% and] 22% of our revenues for the years ended December 31, [removed: 2019] [added: 2020] and [removed: 2018.][added: 2019, respectively.]
Our Financial Services segment's revenues represented approximately [added: 6% and] 7% of our revenues for the years ended December 31, [removed: 2019] [added: 2020] and [removed: 2018.][added: 2019, respectively.]
[removed: Key] [added: _Key] Performance [removed: Metrics][added: Metrics_]
EBITDA and EBITDA margin are non-GAAP financial measures (see Note [removed: 2 within Item 6.][added: 3.]
[removed: *Revenue growth.*] [added: _Revenue growth._] We use year-over-year revenue growth as a key performance metric.
[removed: *EBITDA growth*.][added: _EBITDA growth_.]
[removed: *EBITDA margin.*] [added: _EBITDA margin._] We use EBITDA margin as a metric to assess segment performance and scalability of our business.
[removed: Revenues][added: _Revenues_]
Approximately 82% of the revenues in our Insurance segment for the years ended December 31, [removed: 2019] [added: 2020] and [removed: 2018] [added: 2019] were derived from hosted subscriptions through agreements (generally one to five years) for our solutions.
Our customers in this segment include most of the P&C insurance providers in the U.S. Approximately [added: 84% and] 78% of the revenues in our Energy and Specialized Markets segment for the years ended December 31, [removed: 2019] [added: 2020] and [removed: 2018] [added: 2019, respectively,] were derived from hosted subscriptions with long-term agreements for our solutions.
Approximately [removed: 72%] [added: 77%] and [removed: 73%] [added: 72%] of the revenues in our Financial Services segment for the years ended December 31, [removed: 2019] [added: 2020] and [removed: 2018,] [added: 2019,] respectively, were derived from subscriptions with long-term agreements for our solutions, respectively.
Our customers in this segment include financial institutions, payment networks and processors, alternative lenders, regulators, merchants, and [removed: all of] the top 30 credit card issuers in North America, the United Kingdom, and Australia.
For the years ended December 31, [removed: 2019] [added: 2020] and [removed: 2018,] [added: 2019,] approximately [removed: 19%] [added: 18%] and [removed: 20%] [added: 19%] of our consolidated revenues were derived from providing transactional and advisory/consulting solutions, respectively.
[removed: Principal] [added: _Principal] Operating Costs and [removed: Expenses][added: Expenses_]
Personnel expenses, which represented approximately [removed: 52%] [added: 59%] and [removed: 58%] [added: 52%] of our total operating expenses for the years ended December 31, [removed: 2019] [added: 2020] and [removed: 2018,] [added: 2019,] respectively, include salaries, benefits, incentive compensation, equity compensation costs, sales commissions, employment taxes, recruiting costs, and outsourced temporary agency costs.
We categorize employees who maintain our solutions as cost of revenues, and all other personnel, including executive managers, [removed: sales people,] [added: salespeople,] marketing, business development, finance, legal, human resources, and administrative services, as selling, general and administrative expenses.
[removed: *Cost] [added: _Cost] of [removed: Revenues.*] [added: Revenues._] Our cost of revenues consists primarily of personnel expenses.
[removed: *Selling,] [added: _Selling,] General and Administrative [removed: Expense.*] [added: Expense._] Our selling, general and administrative expense also consists primarily of personnel costs.
[removed: Trends] [added: _Trends] Affecting Our [removed: Business][added: Business_]
Growth in P&C insurers’ direct written premiums is cyclical, with total industry premium growth receding from a peak of 14.8% in 2002 to a trough of negative 3.1% in 2009 and subsequently recovering to 4.4% in 2012, [removed: 4.3% in 2013, 4.4% in 2014, 3.7% in 2015,] [added: slowing down to] 3.7% in [added: 2015 and] 2016, [added: accelerating to] 4.7% in 2017 [removed: and,] [added: and] 5.5% in [removed: 2018.][added: 2018, then again slowing down to 5.1% in 2019.]
Based on the most recent results available, direct premium growth and net premium growth [removed: accelerated] [added: slowed down significantly] in [removed: 2018.][added: 2020 due to the COVID-19 pandemic.]
[removed: Many companies] [added: We expect investment to increase with the recovery] in the [added: global economy though the] natural resources [removed: sector] [added: industry will] continue to demonstrate tight capital discipline which may affect our business.
The [removed: energy] transition presents both a threat and an opportunity for the sector and our revenues.
Fossil fuels will meet much of global demand for some decades, but [added: investments in] zero carbon energy (renewables and emerging technologies such as electric vehicles and energy storage) [added: and the associated infrastructure] will grow in importance.
[removed: The infrastructure needed for the electrification] [added: Electrification] of economies will drive demand for base metals, some bulk commodities and battery raw materials.
Climate change and [removed: decarbonisation] [added: decarbonization] are rising up the agenda, and policy on environmental and social governance is intensifying.
Trends in the banking and retail [removed: sectors] [added: sectors, as well as material external factors] can influence revenues in our Financial Services segment in many ways.
[removed: Fraud] [added: Our sector specific trends have remained broadly consistent with fraud] and similar financial crimes [removed: in particular] [added: continuing to] impact our customers in ways ranging from regulatory risk and credit loss for financial institutions, to counterfeit loss and inventory shrinkage for [removed: merchants.][added: merchants, with risks being elevated at times of financial stress.]
[removed: Description] [added: _Description] of [removed: Acquisitions][added: Acquisitions_]
We acquired [removed: twenty-three] [added: thirteen] businesses since January 1, [removed: 2017.][added: 2018.]
See a description of our [removed: 2019] [added: 2020] acquisitions below and [removed: Note 10.][added: [Note 10](#FN_10_-_Acquisitions).]
COVID-19
Since January 2020, an outbreak of the 2019 novel coronavirus ("COVID-19") has evolved into a worldwide pandemic.
We have modified our operations in line with our business continuity plans due to COVID-19.
While our facilities generally remain open, we are making extensive use of the work-from-home model at this moment.
On a daily basis, management is reviewing our operations and there have been to date minimal interruptions in our customer facing operations.
Given the digital nature of our business and the move toward cloud enablement, we expect to remain operationally stable and fully available to our customers.
We are in compliance with all financial and non-financial covenants and have not observed a loss of any significant customers, a significant deterioration in the collectability of receivables, a significant reduction in our liquidity, nor a significant decline in the subscription renewal rates.
We have analyzed our solutions and services to assess the impact of COVID-19 on our revenue streams.
We have not identified any material impact stemming from COVID-19 on approximately 85% of our revenues at this point, as much of these revenues are subscription in nature and subject to long-term contracts.
These revenues grew approximately 6% for the year ended December 31, 2020.
Of the remaining 15%, we have identified specific solutions and services, largely transactional in nature, that are being impacted by COVID-19.
The primary causal factors are lower auto and travel insurance activity, the inability to enter commercial buildings to perform engineering analyses, decreased capital expenditure in the energy sector, and reduced levels of advertising by financial institutions and marketers.
The portion of our revenue that is attributable to these solutions has been negatively impacted by COVID-19, and declined approximately 11% for the year ended December 31, 2020.
The deepest impacts were in the categories of travel insurance analytics, auto underwriting and claims analytics in the insurance industry, consulting services in the energy industry, and spend informed analytic solutions in financial services.
Although we have experienced a decline in revenue attributable to these specific solutions during the last two weeks of March 2020 and through the period ended December 31, 2020, currently we do not anticipate lasting impacts of a material nature to our long-term growth profile.
As the global outbreak of COVID-19 is still rapidly evolving, management continues to closely monitor its impact on our business.
within Item 6.
In 2020, insurers were also challenged by heightened catastrophic losses in 2020 associated with a record number of events ISO's Property Claims Service classified as catastrophes, including a major hurricane Laura and the Midwest derecho, both in August 2020, and multiple wildfires in the Western states.
In the life insurance market, carriers are looking to modernize and digitize their core platforms, as well as offer streamlined underwriting decision-making process to expand the number of policies which can be offered more rapidly, and without cumbersome medical tests.
Our no-code modular technology stack and advanced analytics (such as using electronic health records to model mortality and detecting of tobacco use through voice analysis) enable the digital transformation of our customers' core infrastructure and automate their decision-making processes across the policy lifecycle.
The COVID-19 pandemic had a major impact on global economic growth, commodity flows and prices in 2020.
Commodity markets in energy were disrupted with a negative impact on most of our major energy customers.
Brent oil averaged $42 dollar per barrel in 2020 (and a monthly low of $19 dollars per barrel in April), down from $64 dollar per barrel in 2019; the downcycle in globally traded gas prices was exacerbated by weaker demand.
Investment in the natural resources sector fell sharply as companies cut expenditure.
The energy transition is gathering pace with China, Japan, South Korea and Canada among the latest countries committing to net carbon neutral targets in 2020.
COVID-19 has had a significant impact on our one-time consultative revenue streams over the past year as our clients sought to temporary reduce external expenditure while they focused on critical customer needs.
Additionally, governmental intervention and actions to support indebted consumers by extending credit terms has created a lag in bankruptcy and similar filings which have adversely impacted our credit analytics business, but we do believe this is a temporary impact which will reverse over time.
As retailers saw reduced consumer spend due to COVID-19 however, this created an opportunity for our spend analytics businesses to work more closely with retailers to help them understand and target emerging spend as the economies in our markets re-emerged.
We continue to see increasing competition for traditional retail banks and consumer lenders from financial technology companies and other on-line lending new entrants, which provides opportunities for us to support many existing and potential clients, with our enhanced digital solutions and analytical tools providing new ways for us to communicate and engage with our clients today in our remote environment, and in the future.
_2020 Acquisitions_
On December 16, 2020, the we acquired the stock of Lead Intelligence, Inc. ("Jornaya"), a leading provider of consumer behavioral data and intelligence.
The acquisition added Jornaya's proprietary view of consumer buying journeys to our growing set of marketing solutions for the insurance and financial services markets, as well as provide customers with the intelligence and agility to time and tailor interactions based on actual in-market behaviors.
On September 9, 2020, we acquired the stock of Franco Signor LLC ("Franco Signor").
Franco Signor is a Medicare Secondary Payer compliance solutions provider to large employers, insurers and third-party administrators in the U.S. Franco Signor has become part of the claims category within our Insurance segment and enhanced the solutions we currently offer, as well as added professional administrative services for Medicare Set Asides to our suite of solutions.
_Description of Dispositions_
In the first quarter of 2020, our data warehouse business within the Financial Services segment qualified as assets held for sale and was sold on March 1, 2020.
We recorded a gain of $3.5 million in "Other operating loss (income)" within the accompanying consolidated statements of operations for the year ended December 31, 2020.
On February 14, 2020, the sale of the compliance background screening business was completed for net cash proceeds of $23.1 million.
A gain of $15.9 million was included in "Other operating loss (income)" within the accompanying consolidated statements of operations for the year ended December 31, 2020.
We contributed assets related to the disposed business, including cash of $63.8 million, in exchange for a non-controlling 35.0% ownership interest in a nonpublic company, Vexcel.
We previously reported results based on two operating segments, Decision Analytics and Risk Assessment.
During the first quarter of 2018, the chief operating decision maker, or CODM, changed how he makes operating decisions, assesses the performance of the business, and allocates resources in a manner that caused the Company's operating segments to change.
Consequently, effective as of the first quarter of 2018, our operating segments are based on three vertical markets we serve: Insurance, Energy and Specialized Markets, and Financial Services.
These three operating segments are also our reportable segments, which have been retroactively recast to reflect the new segments in all periods presented.
chemicals, and metals and mining industries.
However, insurers were also challenged by heightened catastrophic losses in 2018 associated with major hurricanes, such as Florence and Michael, and several devastating wildfires in the state of California, coupled with additional losses reported from the three major hurricanes in 2017 - Harvey, Irma, and Maria.
These include geopolitical risks such as the U.S.-China trade dispute and heightened tension in the Middle East, among others, which influenced commodity flows and prices in 2019.
Commodity markets in energy were also oversupplied challenging the revenues for some of our major energy customers.
Brent oil averaged $64 dollar per barrel in 2019, down from
$71 dollar per barrel in 2018; U.S. and globally traded gas prices are also in a downcycle.
Investment in the natural resources sector fell sharply mid-decade but has stabilised at a lower level in recent years.
Increasing global economic growth will lead to higher energy demand and, in turn, potentially our services.
Following regulatory intervention, some markets are seeing increased standardization of offered products across issuers which could stifle competition and innovation for consumers.
Additionally, traditional retail banks and consumer lenders face increasing competition from financial technology companies and on-line lending new entrants, and finally the market is reacting to increased data privacy laws such as General Data Protection Regulation, or GDPR, by demanding broader use of tokenization-based solutions and managing data use rights more closely.
Our data model has relied on tokenization, and we address these emerging issues by leveraging our extensive wallet-based market and product data and expertise, and also support an active and ongoing dialogue with regulators worldwide to fully understand the impact and adverse consequences of any intended legislation.
On December 23, 2019, we acquired 100 percent of the stock of Flexible Architecture and Simplified Technology, LLC., or FAST, a software company for the life insurance and annuity industry.
FAST offers a flexible policy administration system that helps insurers accelerate underwriting and claims to enhance the customer experience and support profitable growth.
FAST has become part of the claims category within our Insurance segment, and expanded and enhanced the suite of solutions we are developing across the enterprise for life insurers looking to transform the customer experience throughout the life of the policy, from quote to claims.
On December 19, 2019, we acquired selected assets of Commerce Signals, Inc., or Commerce Signals, a software company that offers a data sharing platform for retail, restaurant and entertainment marketers.
Commerce Signals has become part of our Financial Services segment, and enhanced the existing solutions we currently offer.
On November 5, 2019, we acquired 100 percent of the stock of Genscape, Inc., or Genscape, a global provider of real-time data and intelligence for commodity and energy markets.
Genscape has become part of the Energy and Specialized Markets segment, and enhanced our business’ existing sector intelligence in energy data and analytics.
On October 10, 2019, we acquired 100 percent of the stock of BuildFax, Inc., or BuildFax.
BuildFax uses building permit, contractor, and inspection data to provide information about the condition of properties to insurance and financial institutions.
The data from BuildFax enhances property analytics under the underwriting & rating category within our Insurance segment while helping underwriters gain insight into changes in the property insured.
On August 28, 2019, we acquired substantially all of the assets of Property Pres Wizard, LLC, or PPW.
PPW is a web and mobile application that manages work order details and property status in the field services industry throughout the supply chain.
PPW has become part of the claims category within our Insurance segment and added a service order and project management application to our PropTech suite of solutions.
On July 31, 2019, we acquired 100 percent of the stock of Keystone Aerial Surveys, Inc., or Keystone, to expand our remote imagery business.
Keystone was a component within the aerial imagery sourcing group, which was qualified as assets held for sale on December 2, 2019.
On February 1, 2020, the sale of the aerial imagery sourcing group was
closed.
See *Description of Businesses Held for Sale and Disposition* below and Note 10.
On March 29, 2019, we entered into an agreement with an enterprise application software provider to acquire their Content as a Service (“CaaS”) business, which included the Environmental Health and Safety Regulatory Content and Environmental Health and Safety Regulatory Documentation teams and data assets.
The CaaS business has become part of our Energy and Specialized Markets segment.
This transaction strengthened our environmental health and safety services business and extended its global customer footprint and European operations.
During the fourth quarter of 2019, our compliance background screening business and the aerial imagery sourcing group within the remote imagery business qualified as assets held for sale, respectively.
These assets held for sale were part of the claims category within our Insurance segment as of December 31, 2019.
Our board of directors approved the actions to make these assets held for sale available for immediate sale at their current fair value in the fourth quarter of 2019.
We contributed the assets and stock related to the business held for sale and cash of $60.0 million in exchange for a non-controlling 35.0% ownership interest in Vexcel Group, Inc. On February 14, 2020, the sale of the compliance background screening business was also completed.
An excerpt. Shown here: 40 of 212 rewritten, 40 of 115 added and 40 of 128 removed. The counts are complete. For every sentence, read Item 7. Management’s Discussion and Analysis of Financial Condition and Results of Operations in the FY2020 filing and the FY2019 filing.
Item 7A. Quantitative and Qualitative Disclosures about Market Risk
6 rewritten, 2 added, 4 removed, 18 unchanged
Read the full itemFY2020 item · filed February 23, 2021FY2019 item · filed February 18, 2020
[removed: Interest] [added: _Interest] Rate [removed: Risk][added: Risk_]
[removed: At December 31, 2019, we had] [added: The] borrowings [removed: outstanding under our credit facility of $495.0 million, which] bear interest at variable rates based on LIBOR plus 1.0% to 1.625% depending on [removed: certain ratios] [added: the public debt rating] defined in the credit agreement.
Based on our overall interest rate exposure at December 31, [removed: 2019,] [added: 2020,] a one percent change in interest rate would result in a change in annual pre-tax interest expense of approximately [removed: $5.0] [added: $0.5] million based on our current borrowing levels.
[removed: Foreign] [added: _Foreign] Currency [removed: Risk][added: Risk_]
Movements in the U.S. dollar to British pounds and other foreign currency exchange rates did not have a material effect on our revenue for the year ended December 31, [removed: 2019.][added: 2020.]
The information required by this Item is set forth on pages [removed: 52] [added: 45] through [removed: 103] [added: 89] of this annual report on Form 10-K.
At December 31, 2020, we had borrowings outstanding under our credit facility of $50.0 million, which was subsequently repaid.
The current margin is 1.25% as a result of the current public debt rating.
| | |
| | |
| | |
| | |
Item 1. Business
72 rewritten, 41 added, 16 removed, 269 unchanged
Read the full itemFY2020 item · filed February 23, 2021FY2019 item · filed February 18, 2020
In the United [removed: States, or U.S.,] [added: States ("U.S.")] and around the world, we help customers protect people, property, and financial assets.
These solutions take various forms, including [removed: data,] [added: proprietary data assets,] expert [added: industry] insight, statistical models, [removed: and] tailored [removed: analytics,] [added: analytic object, and robust software platforms] all designed to allow our customers to make more [removed: logical] [added: informed risk] decisions.
In [removed: 2019,] [added: 2020,] our customers included all of the top 100 property and [removed: casualty, or P&C,] [added: casualty ("P&C")] insurance providers in the U.S. for the lines of P&C services we offer and [removed: all of] the top 30 credit card issuers in North America, the United Kingdom, and Australia as well as nine of the top ten global energy producers around the world.
We offer our solutions and services primarily through annual subscriptions or long-term agreements, which are typically prepaid and represented over [removed: 81%] [added: 82%] of our revenues in [removed: 2019.][added: 2020.]
For the year ended December 31, [removed: 2019,] [added: 2020,] we had revenues of [removed: $2,607.1] [added: $2,784.6] million and net income of [removed: $449.9] [added: $712.7] million.
For the five-year period ended December 31, [removed: 2019,] [added: 2020,] our consolidated revenues grew at a compound annual growth [removed: rate, or CAGR,] [added: rate ("CAGR")] of [removed: 10.3%] [added: 8.7%] and our net income [removed: declined] [added: grew] at [removed: 3.0%.][added: 4.8%.]
We trace our history to 1971, when Insurance Services Office, [removed: Inc., or ISO,] [added: Inc. ("ISO")] started operations as a not-for-profit advisory and rating organization providing services to the U.S. P&C insurance industry.
On May 23, 2008, in contemplation of our initial public [removed: offering, or IPO,] [added: offering ("IPO"),] ISO formed Verisk Analytics, [removed: Inc., or Verisk,] [added: Inc. ("Verisk"),] a Delaware corporation, to be the holding company for our business.
On October 6, 2009, in connection with our IPO, [removed: the Company] [added: we] effected a reorganization whereby ISO became a wholly owned subsidiary of Verisk.
Our expansion into analytics began when we acquired the American Insurance Services [removed: Group, or AISG,] [added: Group ("AISG")] and certain operations and assets of the National Insurance Crime Bureau in 1997 and 1998, respectively.
To further expand our business, in 2002, we acquired AIR [removed: Worldwide, or AIR,] [added: Worldwide ("AIR"),] the technological leader in catastrophe modeling.
In 2012, we acquired Argus Information & Advisory Services, [removed: LLC, or Argus,] [added: LLC ("Argus")] to expand our global presence providing information, competitive benchmarking, analytics, and customized services to financial institutions in the payments space.
In 2015, we acquired Wood Mackenzie [removed: Limited, or Wood Mackenzie,] [added: Limited ("Wood Mackenzie")] to advance our strategy to expand internationally and position us in the global energy market.
In 2017, we acquired G2 Web Services, [removed: LLC, or G2;] [added: LLC ("G2");] Sequel Business Solutions [removed: Ltd., or Sequel;] [added: Ltd. ("Sequel");] Lundquist Consulting, [removed: Inc., or LCI;] [added: Inc. ("LCI");] and PowerAdvocate, [removed: Inc., or PowerAdvocate,] [added: Inc. ("PowerAdvocate")] to further strengthen our position in their respective segments.
In 2018, we acquired Rulebook [removed: Limited, or Rulebook,] [added: Limited ("Rulebook")] to further our international insurance presence in the overseas market.
In 2019, we acquired Genscape, [removed: Inc., or Genscape,] [added: Inc. ("Genscape")] and Flexible Architecture and Simplified Technology, [removed: LLC, or FAST,] [added: LLC ("FAST")] to enhance our solutions within the Energy and Specialized Markets segment and Insurance segment, respectively.
See [removed: Note 19.][added: [Note 19](#FN_19_-_Segment_Reporting).]
We also develop [removed: predictive] [added: and utilize machine learned and artificially intelligent] models to forecast scenarios and produce both standard and customized analytics that help our customers better manage their businesses, including detecting fraud before and after a loss event and quantifying losses.
Our customers include most of the P&C insurance providers in the U.S. In recent years, we have expanded our offerings [removed: also] to [added: also] serve certain non-U.S. markets.
[removed: Underwriting] [added: _Underwriting] & [removed: rating][added: rating_]
We provide policy language, prospective loss costs, policy writing rules, and a variety of [removed: other] [added: underwriting] solutions for [added: risk selection and segmentation, pricing, and workflow optimization across] 30 lines of insurance.
They must also make sure their policies remain competitive by promptly changing coverages in response to changes in [removed: statutes or] [added: statutes,] case [removed: law.][added: law, or regulatory requirements.]
We have more than [removed: 120] [added: 195] specialized lawyers and insurance experts reviewing changes in each state’s insurance rules and regulations, including an average of [removed: approximately 15,000 legislative bills,] [added: over] 11,000 [added: legislative actions, over 9,200] regulatory actions, and 2,000 court decisions per year, to make any required changes to our policy language and rating information.
For example, in the homeowners line of insurance, we maintain policy language and rules for 6 basic coverages, [removed: 282] [added: 283] national endorsements, and [removed: 612] [added: 616] state-specific endorsements.
Over the past four decades, we have developed core expertise in acquiring, processing, managing, [added: protecting,] and operating large and comprehensive databases that are the foundation of our insurance offerings.
[removed: Each year,] [added: In 2020 alone,] P&C insurers [removed: send] [added: sent] us approximately [removed: 4.4] [added: 3.1] billion detailed individual records of insurance transactions, such as insurance premiums collected or losses incurred.
We maintain a database of more than [removed: 22.5] [added: 22.9] billion statistical records, including approximately [removed: 9.5] [added: 9.9] billion commercial lines records and approximately 13.0 billion personal lines records.
Our property-specific rating and underwriting information allows our customers to understand, quantify, underwrite, mitigate, and avoid potential loss for [added: residential and] commercial properties.
[added: Our database contains data and analytics on approximately 12.0 million commercial properties in the U.S.] We have a staff of approximately [removed: 540] [added: 530] field representatives strategically located around the U.S. who observe and report on conditions at commercial and residential properties, evaluate community fire-protection capabilities and assess the effectiveness of municipal building-code enforcement.
Each year, our field staff visits more than [removed: 292,000] [added: 375,000] commercial properties to collect information on new buildings and verify building attributes.
We are a leading provider of [added: innovative] solutions for the personal underwriting markets, including homeowners and auto lines.
[removed: We] [added: Drawing on an array of resources from proprietary and third-party data to geospatial imagery, we] build and maintain widely used industry-standard tools that assist insurers in underwriting and [removed: rating, that] [added: rating—that] is, measuring and selecting risks and pricing coverage appropriately to [added: help] ensure fairness to the consumer and a reasonable return for the insurer.
Our solutions apply advanced predictive analytics to our deep reservoir of data and information to gauge the degree and cost of risk quickly and [removed: precisely.][added: precisely, and our workflow tools help insurers increase speed and cost-efficiency while delivering superior customer experiences.]
[removed: Claims][added: _Claims_]
Our claims insurance solutions provide our customers analytics in the areas of fraud detection, [added: compliance reporting, subrogation] and repair cost estimation, including emerging areas of interest within these categories.
Our [removed: anti fraud] [added: anti-fraud] solutions improve our customers’ profitability by both predicting the likelihood that fraud [removed: is] [added: may be] occurring and detecting suspicious activity after it has occurred.
When a claim is submitted, our system searches our [added: all-claims] database and returns information about other claims filed by the same individuals or businesses (either as claimants or insurers) that helps our customers determine if fraud [removed: has occurred.][added: may be occurring.]
We [added: also] have a comprehensive [added: case management] system used by claims adjusters and investigation professionals to process claims and fight fraud.
[removed: Claims] [added: Our claims] databases are one of the key tools in the fight against insurance fraud.
[removed: Our] [added: The] database contains information for more than [removed: 1.4] [added: 1.5] billion claims and is the world’s largest database of P&C claims information used for claims [added: processing] and investigations.
In 2020, we acquired Franco Signor, LLC to further our offerings in the Medicare space and Lead Intelligence, Inc. ("Jornaya") to grow our set of marketing solutions for the insurance and financial services markets.
Finally, we have also expanded into the life and annuity sectors through the acquisition of FAST in December 2019, as well as internal solutions development, to enable the transformation of the industry across the policy lifecycle through no-code technology, data analytics, and modeling.
These premier solutions span a range of applications—from using precise home reconstruction costs to ensure policyholders have the right amount of coverage, to providing auto insurers with data to bind policies in minutes with once-and-done quoting.
Our international insurance markets grew through acquisitions, and today serves a large proportion of those insurers operating in both the UK and Irish property and casualty markets.
Additionally, our international market provides services to much of the Lloyd's and London market, whilst also serving customers in Canada, Continental Europe, Singapore, China, Australia, and New Zealand.
The international enhanced commercial and residential property models and enriched data sets help insurers with triage, reconstruction value, risk selection, pricing, benchmarking, and portfolio management across multiple insured segments, with an emphasis on residential and commercial property.
Insurers also use our solutions to finetune the accuracy of their rating models, to drive underwriting results through a set of analytical products that predict the relative risk and variation of major insurance perils including theft, flood, storm, fire, freeze, etc. Our international small and medium size commercial lines casualty solutions help customers digitally transform, enabling straight through processing and underwriting.
In addition to property data and solutions, customers benefit from decision and benchmarking analytics using firmographic, technographic, and business intelligence, and proprietary management competency scores.
Our database also helps insurers fulfill on their regulatory compliance reporting requirements at both the state and federal level for delinquent child support liens and other required checks.
We also offer solutions to help the P&C industry comply with the federal Medicare Secondary Payer ("MSP") Statute; mandating reporting of claims data, repayment of conditional payments liabilities, and ongoing protection of the Medicare Trust Fund.
Our solutions include highly accurate Medicare reporting with flexible solutions that are customized to the way insurers, self-insured employers and third-party administrators ("TPAs") do business, including integrated conditional payment processing, and a full range of Medicare Set-Aside ("MSA") services.
In addition to full compliance support, including First Report of Injury ("FROI")/Subsequent Report of Injury ("SROI") and other Electronic Data Interchange ("EDI") reporting, claims professionals can also access robust analytic solutions for workers' compensation and liability claims and can leverage litigation analytics for improved claim results.
Customers access our claims ecosystem to provide valuable insights into weather peril impact to their book of business, remotely connect with their policyholders to enhance communication for faster claims resolution, and analyze and benchmark performance against peers in the industry.
Increasingly, the Verisk suite of claims products leverages artificial intelligence and automation to streamline claims handling, connect vital data points, and improve the customer experience.
For life and annuity insurers, we offer digital solutions including electronic applications and policy administration systems to enable automated/accelerated triage, underwriting, fraud detection, and modeling.
Finally, in the life insurance sector, our solutions compete against vendors such as Accenture, Oracle, DXC, Majesco and iPipeline, as well as the in-house technology departments of Life Insurers.
Salespeople manage the overall sales process and technical consultants manage the rigorous integration and functional fit discussions to ensure mutual success and satisfaction.
Human Capital
Our global workforce is united by our mission to serve, add value, and innovate for our customers.
As a knowledge-based business, we carefully integrate the skills and talents of 8,960 employees worldwide as of December 31, 2020.
Our highly credentialed team holds advanced degrees and professional certifications specializing in actuarial science, chemistry and physics, commercial banking and finance, commodity analytics, data science and artificial intelligence, economics, engineering, GIS mapping, meteorology, natural resources, predictive analytics, supply chain, and other fields.
Approximately 66% of our employees are based in the United States, 14% in the United Kingdom, 7% in India, with the remainder serving in 37 countries across the globe.
None of our employees are represented by unions or subject to collective bargaining agreements, other than a small number of employees in Germany who are represented by a works council.
We support and inspire our people with a warm and professional atmosphere, personal and career development opportunities at all levels, competitive compensation and benefits, an ongoing focus on well-being, and responsive leadership.
We have a culture of continuous learning and improvement.
All employees have access to our world-class online learning platform, which features thousands of courses taught by industry experts, ranging from public speaking, to balancing work and personal life, to data science fundamentals.
Our Leadership Institute also conducts four leadership development programs tailored to leaders from first-time managers to senior executives.
More than 1,000 participants have graduated to date, gaining practical tools to lead themselves, others, and the business.
We offer competitive salaries, annual merit salary reviews, and the opportunity for advancement.
In addition, our program includes an incentive compensation component for eligible job categories, paid time off ("PTO"), flextime and telecommuting options, and a 401(k) program with a 100% company cash match (up to 6%).
We also offer health insurance plans, no-cost life insurance equivalent to annual salary (with the option to purchase more), a discounted stock purchase program, a variety of physical, mental, and financial well-being offerings and resources, and more.
Details vary by business unit and country.
Employees can also take advantage of our employee networks, grassroots groups that help support diversity-related programs and events and promote an inclusive community.
As of 2020, there are eight networks: the Verisk Women's Network, the Verisk Pride Network, the Verisk Veterans and Military Service Members Network, the Verisk REACH Network (dedicated to empowering Black employees), the Verisk Parents Network, the Verisk Unidos Network (promoting awareness of Hispanic and Latinx culture), the Verisk Asian Network, and the Verisk Accessibility Network.
To support our goal to have a workforce that reflects the diversity of the communities we operate in, our Board of Directors adopted our Statement on Racial Equity and Diversity in 2020.
Its purpose is to confront and overcome barriers to individual achievement based on race, ethnicity, gender, sexual orientation, identity, and beliefs.
We continually strive to encourage collaboration throughout the organization, involve and empower all of our employees, and develop a diverse workforce.
Surveys conducted by outside organizations and our annual employee engagement survey measure our progress against these critical metrics.
In 2020, our employee engagement score rose from 70% to 78%, and for the fifth consecutive year, we received U.S. certification from Great Place to Work® for our outstanding workplace culture.
We also received first-time certification in the United Kingdom, India, and Spain.
The decrease in our net income was primarily attributable to the recognition of our litigation reserve of $125.0 million, higher acquisition related costs (earn-outs) and a higher effective tax rate for the year ended December 31, 2019.
Our database contains loss costs and other relevant information on more than 3.8 million commercial risks in the U.S. and also holds information on more than 6.9 million individual businesses within those risks.
| | |
| --- | --- |
| | |
| --- | --- |
EH&S compliance information and management needs of our customers.
credit bureaus to deepen ongoing relationships and create new value solutions.
Much of the technology we use and provide to our customers is developed, maintained, and supported by approximately 18% of our employee population.
common law copyrights; and the licensing of those materials to our customers for their use represents a large portion of our revenue.
The patents and patent applications include claims, that pertain to technology, including a patent for our Liability Navigator®™ product.
Employees
As of December 31, 2019, we employed 9,060 full-time and 240 part-time employees.
None of our employees located in the U.S. are represented by unions.
Our employees include more than 200 actuarial professionals, including 35 Fellows and 40 Associates of the Casualty Actuarial Society as well as 137 Chartered Property Casualty Underwriters, 16 Associate Insurance Data Managers, 14 Certified Insurance Data Managers, 1 Fellow Insurance Data Manager, and more than 1,000 professionals with advanced degrees, including PhDs in mathematics and statistical modeling who review both the data and the models.
trade practice statutes within or outside state insurance codes, which are typically enforced by state attorneys general and/or insurance regulators.
An excerpt. Shown here: 40 of 72 rewritten, 40 of 41 added and all 16 removed. The counts are complete. For every sentence, read Item 1. Business in the FY2020 filing and the FY2019 filing.
Item 3. Legal Proceedings
0 rewritten, 1 added, 41 removed, 1 unchanged
Read the full itemFY2020 item · filed February 23, 2021FY2019 item · filed February 18, 2020
See [Note 21](#FN_21_-_Commitments_and_Contingencies), Commitments and Contingencies, to the consolidated financial statements included in Item 8 Part II of this 10-K for information regarding certain legal proceedings in which we are involved.
We are party to legal proceedings with respect to a variety of matters in the ordinary course of business, including the matters described below.
With respect to ongoing matters, we are unable, at the present time, to determine the ultimate resolution of or provide a reasonable estimate of the range of possible loss attributable to these matters or the impact they may have on our results of operations, financial position or cash flows.
In the case of the *360Value Litigation*, this is primarily because the matter is generally in early stages and discovery has not yet commenced.
Although we believe we have strong defenses and intend to vigorously defend these matters, we could in the future incur judgments or enter into settlements of claims that could have a material adverse effect on our results of operations, financial position or cash flows.
*Xactware Solutions, Inc. Patent Litigation*
On October 8, 2015, we were served with a summons and complaint in an action titled Eagle View Technologies, Inc. and Pictometry International Group, Inc. v.
Xactware Solutions, Inc. and Verisk Analytics, Inc. filed in the United States District Court for the District of New Jersey.
The complaint alleged that our Roof InSight (now known as Geomni Roof), Property InSight product (now known as Geomni Property) and Aerial Sketch product in combination with our Xactimate product infringe seven patents owned by Eagle View and Pictometry namely, Patent Nos. 8,078,436 (the "436 patent"), 8,170,840 (the "840 patent"), 8,209,152 (the "152 patent"), 8,542,880 (the "880 patent"), 8,818,770 (the "770 patent"), 8,823,732 (the "732 patent"), and 8,825,454 (the "454 patent").
On November 30, 2015, plaintiffs filed a First Amended Complaint adding Patent Nos. 9,129,376 (the "376 patent") and 9,135,737 (the "737 patent") to the lawsuit.
The First Amended Complaint sought an entry of judgment by the Court that defendants have and continue to directly infringe and/or indirectly infringe, including by way of inducement the Patents-in-Suit, permanent injunctive relief, damages, costs and attorney’s fees.
On May 19, 2017, the District Court entered a Joint Stipulated Order of Partial Dismissal with Prejudice dismissing all claims or assertions pertaining to the 880 and 732 patents and certain asserted claims of the 436, 840, 152, 770, 454, 376 and 737 patents (collectively the “Patents in Suit”).
Eagle View further reduced the number of asserted claims pertaining to the Patents in Suit to 18 asserted claims.
Thereafter, Eagle View dropped the 152 patent and further reduced the number of asserted claims from the six remaining Patents in Suit to 11 asserted claims.
Fact discovery and expert discovery closed in 2018 and our summary judgment motions were fully submitted on October 26, 2018.
On December 6, 2018, the Court denied Eagle View’s motion for summary judgment that a key prior art reference be excluded.
On December 20, 2018, the Court denied our motion for summary judgment of equitable estoppel.
On January 29, 2019, the Court denied our motion for summary judgment of unpatentability pursuant to Section 101 of the Patent Act.
Thereafter, Eagle View dropped the 737 patent and further reduced the number of asserted claims from the five remaining Patents in Suit to 6 asserted claims.
On September 25, 2019, following a trial, the jury determined that we had willfully infringed the 6 asserted claims, and assessed damages in the amount of $125.0 million, for which we have recorded a reserve.
The impact associated with the reserve was recorded in our consolidated financial statements included in this annual report on Form 10-K.
After trial, Eagle View moved for a temporary restraining order (“TRO”) and a permanent injunction preventing our sales of the Geomni Roof, Geomni Property and Aerial Sketch products in combination with Xactimate.
The Court granted the motion for a TRO on September 26, 2019 and on October 18, 2019, issued an Order permanently enjoining defendants’ sales of the Geomni Roof, Geomni Property and Aerial Sketch products in combination with Xactimate.
We plan to appeal these results.
Eagle View has petitioned the Court to award up to treble damages, together with fees and expenses.
The parties’ post- trial motions were fully submitted on December 10, 2019 and the parties are awaiting a decision on these motions.
We have established a $125.0 million reserve in connection with this litigation, however, at this time it is not reasonably possible to determine the ultimate resolution of this matter.
*360Value Litigation*
On December 10, 2018, we were served with a First Amended Complaint filed in the United States District Court for the Northern District of California titled *Sheahan, et al.
v.
State Farm General Insurance Co., Inc., et al.* The action is brought by California homeowners, on their own behalf and on behalf of an unspecified putative class of State Farm policyholders whose homes were damaged or lost during the Northern California wildfires of 2017, against State Farm as well as us, ISO, and Xactware Solutions, Inc. Plaintiffs served a Second Amended Complaint on January 6, 2019.
Like the First Amended Complaint, it alleges that defendants through the use of our 360Value product conspired to under-insure plaintiffs’ homes by issuing undervalued policies and underestimating the costs of rebuilding those homes.
Plaintiffs claim that defendants violated federal antitrust law as well as California consumer protection law and common law.
Defendants filed their motions to dismiss the Second Amended Complaint on March 8, 2019.
On July 2, 2019, the Court granted those motions, dismissing various claims with leave to amend, and dismissing other claims with prejudice.
Plaintiffs filed their Third Amended Complaint on August 1, 2019.
As in the Second Amended Complaint plaintiffs claim in the Third Amended Complaint that defendants violated federal antitrust law as well as California consumer protection law and common law.
Defendants filed their motions to dismiss the Third Amended Complaint on September 19, 2019.
The motions were fully submitted on October 31, 2019 and oral argument, originally scheduled for November 27, 2019, has been postponed to February 13, 2020.
At this time, it is not reasonably possible to determine the ultimate resolution of, or estimate the liability related to, this matter.
| | |
An excerpt. Shown here: all 0 rewritten, all 1 added and 40 of 41 removed. The counts are complete. For every sentence, read Item 3. Legal Proceedings in the FY2020 filing and the FY2019 filing.
Cover and table of contents
42 rewritten, 2 added, 13 removed, 70 unchanged
Read the full itemFY2020 item · filed February 23, 2021FY2019 item · filed February 18, 2020
For the fiscal year [removed: ended December] [added: ended December] 31, [removed: 2019][added: 2020]
[removed: *(Exact] [added: _(Exact] name of registrant as specified in its [removed: charter)*][added: charter)_]
As of June 30, [removed: 2019,] [added: 2020,] the last business day of the registrant’s most recently completed second fiscal quarter, the aggregate market value of the registrant’s common stock held by non-affiliates of the registrant was [removed: $22,756,706,943] [added: $26,448,164,972] based on the closing price reported on the NASDAQ Global Select Market on such date.
As of February [removed: 14, 2020,] [added: 19, 2021,] there were [removed: 163,075,947] [added: 162,791,583] shares outstanding of the registrant's Common Stock, par value $.001.
Certain information required by Part III of this annual report on Form 10-K is incorporated by reference to our definitive Proxy Statement for our [removed: 2020] [added: 2021] Annual Meeting of Stockholders, which will be filed with the Securities and Exchange Commission not later than 120 days after December 31, [removed: 2019.][added: 2020.]
[removed: INDEX][added: [](# "toc")INDEX]
| [removed: PART I] [added: [PART I](#p1)] | | | |
| | Item 1. | [removed: [Business](#s05715FD6679F55268439910CFDC92B90)] [added: [Business](#i1)] | [removed: [4](#s05715FD6679F55268439910CFDC92B90)] [added: [4](#i1)] |
| | Item 1A. | [Risk [removed: Factors](#s76915B954EC05709A3FCA3375C1B811A)] [added: Factors](#i1a)] | [removed: [15](#s76915B954EC05709A3FCA3375C1B811A)] [added: [14](#i1a)] |
| | Item 1B. | [Unresolved Staff [removed: Comments](#sBD552F6E7DA75716B44107DB444F8068)] [added: Comments](#i1b)] | [removed: [23](#sBD552F6E7DA75716B44107DB444F8068)] [added: [21](#i1b)] |
| | Item 2. | [removed: [Properties](#sE78751C0392E5AC7A1B3EFFF2CD11442)] [added: [Properties](#i2)] | [removed: [23](#sE78751C0392E5AC7A1B3EFFF2CD11442)] [added: [21](#i2)] |
| | Item 3. | [Legal [removed: Proceedings](#s6FBBFB88F55758CCBD10D07E245B9585)] [added: Proceedings](#i3)] | [removed: [23](#s6FBBFB88F55758CCBD10D07E245B9585)] [added: [21](#i3)] |
| | Item 4. | [Mine Safety [removed: Disclosures](#s1BF4576DBA345B9C9002DEC92B195668)] [added: Disclosures](#i4)] | [removed: [24](#s1BF4576DBA345B9C9002DEC92B195668)] [added: [21](#i4)] |
| [removed: PART II] [added: [PART II](#p2)] | | | |
| | Item 5. | [Market for Registrant’s Common Equity, Related Stockholder Matters and Issuer Purchases of Equity [removed: Securities](#sCCF3DAA019B4593793A7C163B48BC3B5)] [added: Securities](#i5)] | [removed: [25](#sCCF3DAA019B4593793A7C163B48BC3B5)] [added: [22](#i5)] |
| | Item 6. | [Selected Financial [removed: Data](#s7FF0F683ACA65D229DD7E642EB866841)] [added: Data](#i6)] | [removed: [27](#s7FF0F683ACA65D229DD7E642EB866841)] [added: [24](#i6)] |
| | Item 7. | [Management’s Discussion and Analysis of Financial Condition and Results of [removed: Operations](#s8EE46B9AD3EF522BACC22786E0902C3C)] [added: Operations](#i7)] | [removed: [30](#s8EE46B9AD3EF522BACC22786E0902C3C)] [added: [26](#i7)] |
| | Item 7A. | [Quantitative and Qualitative Disclosures About Market [removed: Risk](#s6B7AB0A6E6E952369A2C47CB161E960A)] [added: Risk](#i7a)] | [removed: [44](#s6B7AB0A6E6E952369A2C47CB161E960A)] [added: [39](#i7a)] |
| | Item 8. | [Consolidated Financial Statements and Supplementary [removed: Data](#sE36E0086D4FD5C9BB3D9927126023632)] [added: Data](#i8)] | [removed: [44](#sE36E0086D4FD5C9BB3D9927126023632)] [added: [39](#i8)] |
| | | [Consolidated Balance [removed: Sheets](#s486D3485156253CDB6E64AD8EC9DF33D)] [added: Sheets](#cbs)] | [removed: [55](#s486D3485156253CDB6E64AD8EC9DF33D)] [added: [48](#cbs)] |
| | | [Consolidated Statements of [removed: Operations](#s02c88915273148df9ffb3b49206a7f93)] [added: Operations](#cso)] | [removed: [56](#s02c88915273148df9ffb3b49206a7f93)] [added: [49](#cso)] |
| | | [Consolidated Statements of Comprehensive [removed: Income](#s7380EF78147A56A59D1C789A8EF701C9)] [added: Income](#cci)] | [removed: [57](#s7380EF78147A56A59D1C789A8EF701C9)] [added: [50](#cci)] |
| | | [Consolidated Statements of Changes in Stockholders' [removed: Equity](#s2B4ABCC3CC355A4290F39F51098A65A5)] [added: Equity](#csse)] | [removed: [58](#s2B4ABCC3CC355A4290F39F51098A65A5)] [added: [51](#csse)] |
| | | [Consolidated Statements of Cash [removed: Flows](#sA5BEB1B0F5EE5B30A23C2D939E5F7598)] [added: Flows](#ccf)] | [removed: [59](#sA5BEB1B0F5EE5B30A23C2D939E5F7598)] [added: [52](#ccf)] |
| | | [Notes to Consolidated Financial [removed: Statements](#s4D2261F7FBCE58899D376079C919BF3E)] [added: Statements](#notes)] | [removed: [61](#s4D2261F7FBCE58899D376079C919BF3E)] [added: [54](#notes)] |
| | Item 9. | [Changes in and Disagreements with Accountants on Accounting and Financial [removed: Disclosure](#s8E0D7AAE9E1F510695A40E31FA91DA06)] [added: Disclosure](#i9)] | [removed: [44](#s8E0D7AAE9E1F510695A40E31FA91DA06)] [added: [39](#i9)] |
| | Item 9A. | [Controls and [removed: Procedures](#s44100FE53AFE58B999DEC7369FD26A56)] [added: Procedures](#i9a)] | [removed: [44](#s44100FE53AFE58B999DEC7369FD26A56)] [added: [39](#i9a)] |
| | Item 9B. | [Other [removed: Information](#s9F7BF196221F582A952450AC886F75B0)] [added: Information](#i9b)] | [removed: [49](#s9F7BF196221F582A952450AC886F75B0)] [added: [42](#i9b)] |
| [removed: PART III] [added: [PART III](#p3)] | | | |
| | Item 10. | [Directors, Executive Officers and Corporate [removed: Governance](#sD84F2BD592DA51B888600A52FE42AD8E)] [added: Governance](#i10)] | [removed: [50](#sD84F2BD592DA51B888600A52FE42AD8E)] [added: [43](#i10)] |
| | Item 11. | [Executive [removed: Compensation](#sDA66692287065EE6BE5FF7455829C390)] [added: Compensation](#i11)] | [removed: [50](#sDA66692287065EE6BE5FF7455829C390)] [added: [43](#i11)] |
| | Item 12. | [Security Ownership of Certain Beneficial Owners and Management and Related Stockholder [removed: Matters](#s4D60F0F0F87952108D755DD61564E90F)] [added: Matters](#i12)] | [removed: [50](#s4D60F0F0F87952108D755DD61564E90F)] [added: [43](#i12)] |
| | Item 13. | [Certain Relationships and Related Transactions and Director [removed: Independence](#s7888138F23375201AFA2D7053E2E1332)] [added: Independence](#i13)] | [removed: [50](#s7888138F23375201AFA2D7053E2E1332)] [added: [43](#i13)] |
| | Item 14. | [Principal Accounting Fees and [removed: Services](#s265060884F3C591095B6079205EC9497)] [added: Services](#i14)] | [removed: [50](#s265060884F3C591095B6079205EC9497)] [added: [43](#i14)] |
| [removed: PART IV] [added: [PART IV](#p4)] | | | |
| | Item 15. | [Exhibits and Financial Statement [removed: Schedule](#s8A7AE75222D655A5A517921DAC0472E9)] [added: Schedule](#i15)] | [removed: [51](#s8A7AE75222D655A5A517921DAC0472E9)] [added: [44](#i15)] |
| | Item 16. | [Form 10-K [removed: Summary](#sCF13BCE5DCB75C48AA29C8045E766B0A)] [added: Summary](#i16)] | [removed: [51](#sCF13BCE5DCB75C48AA29C8045E766B0A)] [added: [44](#i16)] |
| | | [EXHIBIT [removed: INDEX](#sF402B08B0E4256428840C6022825093A)] [added: INDEX](#exind)] | [removed: [105](#sF402B08B0E4256428840C6022825093A)] [added: [90](#exind)] |
[removed: Unless] [added: _Unless] the context otherwise indicates or requires, as used in this annual report on Form 10-K, references to “we,” “us,” “our” or the “Company” refer to Verisk Analytics, Inc. and its [removed: subsidiaries.][added: subsidiaries._]
[removed: In] [added: _In] this annual report on Form 10-K, all dollar amounts are expressed in millions, unless indicated [removed: otherwise.][added: otherwise._]
Indicate by check mark whether the registrant has filed a report on and attestation to its management's assessment on the effectiveness of its internal control over financial reporting under Section 404(b) of the Sarbanes-Oxley Act (15 U.S.C. 7262(b)) by the registered public accounting firm that prepared or issued its audit report.
| | | [SIGNATURES](#sigs) | [93](#sigs) |
| | |
| --- | --- |
| | |
| | |
| | |
| | | |
| | | |
| | | | | |
| | | | | | | |
| | | | |
| | | | |
| | | [SIGNATURES](#s7F89A8C57B8157FE9A68FB3584795C54) | [104](#s7F89A8C57B8157FE9A68FB3584795C54) |
| | |
An excerpt. Shown here: 40 of 42 rewritten, all 2 added and all 13 removed. The counts are complete. For every sentence, read Cover and table of contents in the FY2020 filing and the FY2019 filing.
Item 1B. Unresolved Staff Comments
0 rewritten, 0 added, 2 removed, 2 unchanged
Read the full itemFY2020 item · filed February 23, 2021FY2019 item · filed February 18, 2020
| | |
| | |
Item 2. Properties
7 rewritten, 2 added, 6 removed, 4 unchanged
Read the full itemFY2020 item · filed February 23, 2021FY2019 item · filed February 18, 2020
As of December 31, [removed: 2019,] [added: 2020,] our principal offices consisted of the following properties:
| Location | [removed: Square Feet] | [added: Square Feet] | [added: |] Lease Expiration Date |
| Jersey City, New Jersey | [added: |] 352,765 | | December 31, 2033 |
| Lehi, Utah | [added: |] 200,000 | | January 31, 2024 |
| White Plains, New York | [added: |] 63,461 | | September 29, 2021 |
| Houston, Texas | [added: |] 56,584 | | April 30, 2023 |
We also lease offices in [removed: 28] [added: 22] states in the U.S., and offices outside the U.S. to support our international operations in Argentina, Australia, Bahrain, [added: Belgium,] Brazil, Bulgaria, Canada, China, [added: Czech Republic,] Denmark, [added: France,] Germany, India, Indonesia, Ireland, Israel, Italy, Japan, [removed: Kazakhstan,] Malaysia, Mexico, Nepal, Netherlands, New Zealand, Nigeria, Poland, Russia, Singapore, South Africa, South Korea, Spain, Thailand, the United Arab Emirates, and the U.K.
| --- | --- | --- | --- | --- |
| Boston, Massachusetts | | 115,271 | | November 30, 2030 |
| | | | |
| --- | --- | --- | --- |
| | | | |
| Boston, Massachusetts | 69,806 | | November 30, 2020 |
| | |
| | |
Item 4. Mine Safety Disclosures
1 rewritten, 0 added, 2 removed, 2 unchanged
Read the full itemFY2020 item · filed February 23, 2021FY2019 item · filed February 18, 2020
[removed: PART] [added: [](# "p2")PART] II
| | |
| | |
Item 5. Market for Registrant’s Common Equity, Related Stockholder Matters and Issuer Purchases of Equity Securities
28 rewritten, 8 added, 11 removed, 9 unchanged
Read the full itemFY2020 item · filed February 23, 2021FY2019 item · filed February 18, 2020
[removed: Market Information][added: _Market Information_]
As of February [removed: 14, 2020,] [added: 19, 2021,] there were approximately [removed: 50] [added: 59] stockholders of record.
We believe the number of beneficial owners is substantially greater than the number of record [removed: holders,] [added: holders] because a large portion of common stock is held in “street name” by brokers.
On February [removed: 13, 2019,] [added: 12, 2020,] April 29, [removed: 2019,] [added: 2020,] July [removed: 24, 2019,] [added: 29, 2020,] and October [removed: 23, 2019,] [added: 28, 2020,] our Board approved a cash dividend of [removed: $0.25] [added: $0.27] per share of common stock issued and outstanding to the holders of record as of March [removed: 15, 2019,] [added: 13, 2020,] June [removed: 14, 2019,] [added: 15, 2020,] September [removed: 13, 2019,] [added: 15, 2020,] and December [removed: 13, 2019,] [added: 15, 2020,] respectively.
The cash dividends of [removed: $40.9] [added: $43.9] million, [removed: $41.0] [added: $44.0] million, [removed: and $40.8] [added: $43.9] million, and [removed: $40.8] [added: $43.9] million were paid on March [removed: 29, 2019,] [added: 31, 2020,] June [removed: 28, 2019,] [added: 30, 2020,] September 30, [removed: 2019,] [added: 2020,] and December 31, [removed: 2019,] [added: 2020,] respectively.
We have a publicly announced share repurchase plan and repurchased a total of [removed: 60,053,306] [added: 62,208,390] shares since our IPO through December 31, [removed: 2019.][added: 2020.]
[removed: Performance Graph][added: _Performance Graph_]
The [added: prior] peer issuers used for this graph are Alliance Data Systems Corporation, CoStar Group Inc., Equifax Inc., Factset Research Systems Inc., Fidelity National Information Services, Inc., Fiserv, Inc., Gartner, Inc., IHS Markit, Moody’s Corporation, MSCI Inc., Nielsen Holdings plc, S&P Global, and TransUnion.
The [removed: prior peer issuers used for this] graph [removed: are the same as above excluding CoStar Group, Inc. The graph] assumes that the value of investment in our [removed: Common] [added: common] stock and [removed: in] each index was $100 at December 31, [removed: 2014] [added: 2015] and that all cash dividends were reinvested.
Assumes $100 Invested on December 31, [removed: 2014][added: 2015]
Fiscal Year Ended December [removed: 31, 2019][added: 31, 2020]
[removed: 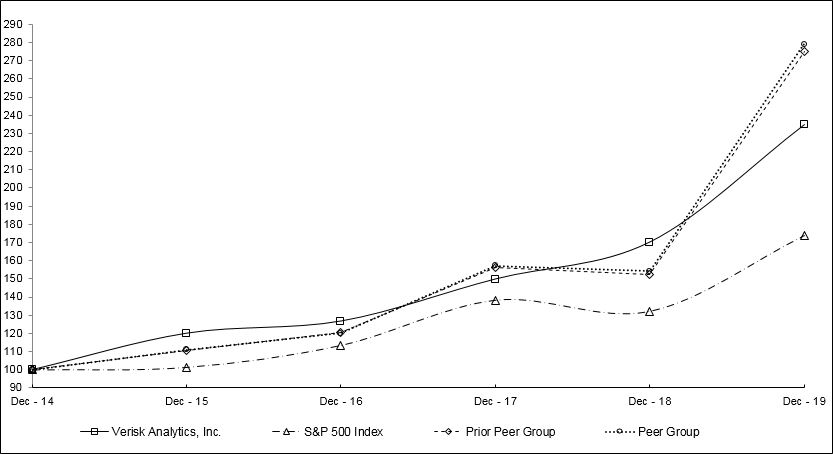][added: ]
[removed: Recent] [added: _Recent] Sales of Unregistered [removed: Securities][added: Securities_]
[removed: There were] [added: We had] no unregistered sales of equity securities [removed: by the Company] during [removed: 2019.][added: 2020.]
[removed: Issuer] [added: _Issuer] Purchases of Equity [removed: Securities][added: Securities_]
Our board of directors has authorized a share repurchase [removed: program, or Repurchase Program,] [added: program ("Repurchase Program")] since May 2010, of up to $3.8 billion, inclusive of the $500.0 million authorization approved by the board on February 12, 2020.
As of December 31, [removed: 2019, $127.6] [added: 2020, $278.8] million remains available for share repurchases.
In December [removed: 2018, March] 2019, [added: March 2020,] June [removed: 2019,] [added: 2020,] and September [removed: 2019,] [added: 2020,] we entered into four Accelerated Share [removed: Repurchase, or ASR,] [added: Repurchase ("ASR")] agreements to repurchase shares of [removed: its] [added: our] common stock for an aggregate purchase price of [removed: $250.0] [added: $225.0] million.
These ASRs were settled in [removed: March 2019,] [added: February 2020,] June [removed: 2019,] [added: 2020,] September [removed: 2019,] [added: 2020,] and [removed: November 2019.][added: December 2020.]
In December [removed: 2019,] [added: 2020,] we entered into an additional ASR agreement to repurchase shares of [removed: its] [added: our] common stock for an aggregate purchase price of $50.0 million.
This ASR will be settled in [removed: February 2020.][added: March 2021.]
Since the introduction of share repurchase as a feature of our capital management strategies in 2010, we have repurchased shares with an aggregated value of [removed: $3,172.4] [added: $3,521.2] million.
Our share repurchases for the quarter ended December 31, [removed: 2019] [added: 2020] are set forth below:
| Period | [added: |] Total Number of Shares Purchased | | | | Average Price Paid per Share | | | [added: |] Total Number of Shares Purchased as Part of Publicly Announced Plans or Programs | | | | Approximate Dollar Value of Shares that May Yet Be Purchased Under the Plans or Programs | | [added: |]
| | | | | | | | | | | | | [added: | |] (in millions) | | [added: |]
(1) In September [removed: 2019,] [added: 2020,] we entered into an ASR agreement to repurchase shares of our common stock for an aggregate purchase price of $50.0 million with [removed: HSBC Bank USA,] [added: Citibank,] N.A. The ASR agreement is accounted for as a treasury stock transaction and a forward stock purchase agreement indexed to our common stock.
Upon the payment of the aggregate purchase price of $50.0 million on October 1, [removed: 2019,] [added: 2020,] we received [removed: 252,940] [added: 215,855] shares of our common stock at a price of [removed: $158.14] [added: $185.31] per share.
Upon final settlement in [removed: November 2019,] [added: December 2020,] we received an additional [removed: 81,862] [added: 47,042] shares as determined by the daily volume weighted average share price of our common stock during the term of the ASR agreement, bringing the total shares received under this ASR agreement to [removed: 334,802] [added: 262,897] and a final average price paid of [removed: $149.34] [added: $190.19] per share.
As of December 31, 2020, we had 381,185,512 shares of treasury stock.
The peer issuers used for this graph are Black Knight, Inc., CoreLogic Inc., CoStar Group Inc., Equifax Inc., Fair Isaac Corp., Gartner, Inc., Global Payments, Inc., IHS Markit, Intercontinental Exchange, Inc., Jack Henry & Associates Inc., Moody’s Corporation, MSCI Inc., S&P Global, and TransUnion.
On February 16, 2021, our board of directors approved an additional share repurchase authorization of $300.0 million.
| --- | --- | --- | --- | --- | --- | --- | --- | --- | --- | --- | --- | --- | --- | --- | --- | --- |
| October 1, 2020 through October 31, 2020 | | | 215,855 | (1) | | $ | 185.31 | (1) | | | 215,855 | | | $ | 278.8 | |
| November 1, 2020 through November 30, 2020 | | | — | | | | — | | | | — | | | $ | 278.8 | |
| December 1, 2020 through December 31, 2020 | | | 47,042 | (1) | | $ | 190.19 | (1) | | | 47,042 | | | $ | 278.8 | |
| | | | 262,897 | (1) | | $ | 190.19 | (1) | | | 262,897 | | | | | |
As of December 31, 2019, we had 380,841,474 shares of treasury stock.
| | | | | | | | | | | | | | |
| --- | --- | --- | --- | --- | --- | --- | --- | --- | --- | --- | --- | --- | --- |
| | | | | | | | | | | | | | |
| October 1, 2019 through October 31, 2019 | 252,940 | | | $ | 158.14 | | (1) | 252,940 | | | $ | 177.6 | |
| November 1, 2019 through November 30, 2019 | 409,021 | | (1) | $ | 140.62 | | (1) | 409,021 | | | $ | 131.6 | |
| December 1, 2019 through December 31, 2019 | 27,411 | | | $ | 145.94 | | | 27,411 | | | $ | 127.6 | |
| | 689,372 | | | | 145.07 | | (1) | 689,372 | | | | | |
In addition to the ASR agreement, we also repurchased 327,159 shares of our common stock at an average price of $140.62 in November 2019.
| | |
| | |
Item 6. Selected Financial Data
67 rewritten, 18 added, 41 removed, 7 unchanged
Read the full itemFY2020 item · filed February 23, 2021FY2019 item · filed February 18, 2020
The consolidated statement of operations data for the years ended December 31, [added: 2020,] 2019, [removed: 2018,] and [removed: 2017] [added: 2018] and the consolidated balance sheet data as of December 31, [removed: 2019] [added: 2020] and [removed: 2018] [added: 2019] are derived from the audited consolidated financial statements included elsewhere in this annual report on Form 10-K.
The consolidated statement of operations data for the years ended December 31, [removed: 2016] [added: 2017] and [removed: 2015] [added: 2016] and the consolidated balance sheet data as of December 31, [added: 2018,] 2017, [removed: 2016,] and [removed: 2015] [added: 2016] are derived from consolidated financial statements that are not included in this annual report on Form 10-K.
Results for the year ended December 31, [removed: 2019] [added: 2020] are not necessarily indicative of results that may be expected in any other future period.
Between January 1, [removed: 2015] [added: 2016] and December 31, [removed: 2019,] [added: 2020,] we acquired [removed: 32 businesses (most notably Wood Mackenzie on May 19, 2015),] [added: 31 businesses,] which may affect the comparability of our consolidated financial statements.
| | [removed: 2019] | [added: 2020] | | | [removed: 2018] | [added: 2019] | | | [removed: 2017] | [added: 2018] | | | [removed: 2016] | [added: 2017] | | | [removed: 2015] | [added: 2016] | | [added: |]
| | [added: |] (in millions, except for share and per share data) | | | | | | | | | | | | | | | | | | |
| Revenues: | | | | | | | | | | | | | | | | | | | | [added: |]
| Financial Services | | [removed: 178.0] | [added: 156.7] | | | [removed: 175.9] | [added: 178.0] | | | [removed: 150.0] | [added: 175.9] | | | [removed: 133.3] | [added: 150.0] | | | [removed: 121.3] | [added: 133.3] | [added: |]
| Revenues | | [removed: 2,607.1] | [added: 2,784.6] | | | [removed: 2,395.1] | [added: 2,607.1] | | | [removed: 2,145.2] | [added: 2,395.1] | | | [removed: 1,995.2] | [added: 2,145.2] | | | [removed: 1,760.7] | [added: 1,995.2] | [added: |]
| Operating expenses: | | | | | | | | | | | | | | | | | | | | [added: |]
| Cost of revenues (exclusive of items shown separately below) | | [removed: 976.8] | [added: 993.9] | | | [removed: 886.2] | [added: 976.8] | | | [removed: 783.8] | [added: 886.2] | | | [removed: 714.4] | [added: 783.8] | | | [removed: 612.0] | [added: 714.4] | [added: |]
| Selling, general and administrative | | [removed: 603.5] | [added: 413.9] | | | [removed: 378.7] | [added: 603.5] | | | [removed: 322.8] | [added: 378.7] | | | [removed: 301.6] | [added: 322.8] | | | [removed: 278.3] | [added: 301.6] | [added: |]
| Depreciation and amortization of fixed assets | | [removed: 185.7] | [added: 192.2] | | | [removed: 165.3] | [added: 185.7] | | | [removed: 135.6] | [added: 165.3] | | | [removed: 119.1] | [added: 135.6] | | | [removed: 96.6] | [added: 119.1] | [added: |]
| Amortization of intangible assets | | [removed: 138.0] | [added: 165.9] | | | [removed: 130.8] | [added: 138.0] | | | [removed: 101.8] | [added: 130.8] | | | [removed: 92.5] | [added: 101.8] | | | [removed: 70.4] | [added: 92.5] | [added: |]
| Other operating [removed: expenses] [added: (income) loss] | | [removed: 6.2] | [added: (19.4] | [added: )] | | [removed: —] | [added: 6.2] | | | [added: |] — | | | | — | | | | — | |
| Total operating expenses | | [removed: 1,910.2] | [added: 1,746.5] | | | [removed: 1,561.0] | [added: 1,910.2] | | | [removed: 1,344.0] | [added: 1,561.0] | | | [removed: 1,227.6] | [added: 1,344.0] | | | [removed: 1,057.3] | [added: 1,227.6] | [added: |]
| Operating income | | [removed: 696.9] | [added: 1,038.1] | | | [removed: 834.1] | [added: 696.9] | | | [removed: 801.2] | [added: 834.1] | | | [removed: 767.6] | [added: 801.2] | | | [removed: 703.4] | [added: 767.6] | [added: |]
| Other income (expense): | | | | | | | | | | | | | | | | | | | | [added: |]
| Investment (loss) income and others, net | | [removed: (1.7] | [added: (2.4 |] ) | | | [removed: 15.3] [added: (1.7] | [added: )] | | | [removed: 9.2] [added: 15.3] | | | | [removed: 6.1] [added: 9.2] | | | | [removed: 16.9] [added: 6.1] | |
| Interest expense | | [removed: (126.8] | [added: (138.2 |] ) | | | [removed: (129.7] [added: (126.8] | ) | | | [removed: (119.4] [added: (129.7] | ) | | | [removed: (120.0] [added: (119.4] | ) | | | [removed: (121.4] [added: (120.0] | ) |
| Total other expense, net | | [removed: (128.5] | [added: (140.6 |] ) | | | [removed: (114.4] [added: (128.5] | ) | | | [removed: (110.2] [added: (114.4] | ) | | | [removed: (113.9] [added: (110.2] | ) | | | [removed: (19.3] [added: (113.9] | ) |
| Income before income taxes from continuing operations | | [removed: 568.4] | [added: 897.5] | | | [removed: 719.7] | [added: 568.4] | | | [removed: 691.0] | [added: 719.7] | | | [removed: 653.7] | [added: 691.0] | | | [removed: 684.1] | [added: 653.7] | [added: |]
| Provision for income taxes | | [removed: (118.5] | [added: (184.8 |] ) | | | [removed: (121.0] [added: (118.5] | ) | | | [removed: (135.9] [added: (121.0] | ) | | | [removed: (202.2] [added: (135.9] | ) | | | [removed: (196.6] [added: (202.2] | ) |
| Income from continuing operations | | [removed: 449.9] | [added: 712.7] | | | [removed: 598.7] | [added: 449.9] | | | [removed: 555.1] | [added: 598.7] | | | [removed: 451.5] | [added: 555.1] | | | [removed: 487.5] | [added: 451.5] | [added: |]
| Income from discontinued operations, net of tax (1) | | [added: |] — | | | | — | | | | — | | | | [removed: 139.7] [added: —] | | | | [removed: 20.1] [added: 139.7] | |
| Net income | [added: |] $ | [removed: 449.9] [added: 712.7] | | | $ | [removed: 598.7] [added: 449.9] | | | $ | [removed: 555.1] [added: 598.7] | | | $ | [removed: 591.2] [added: 555.1] | | | $ | [removed: 507.6] [added: 591.2] | |
| Basic net income per share | | | | | | | | | | | | | | | | | | | | [added: |]
| Income from continuing operations | [added: |] $ | [removed: 2.75] [added: 4.38] | | | $ | [removed: 3.63] [added: 2.75] | | | $ | [removed: 3.36] [added: 3.63] | | | $ | [removed: 2.68] [added: 3.36] | | | $ | [removed: 2.95] [added: 2.68] | |
| Income from discontinued operations | | [added: |] — | | | | — | | | | — | | | | [removed: 0.83] [added: —] | | | | [removed: 0.12] [added: 0.83] | |
| Basic net income per share | [added: |] $ | [removed: 2.75] [added: 4.38] | | | $ | [removed: 3.63] [added: 2.75] | | | $ | [removed: 3.36] [added: 3.63] | | | $ | [removed: 3.51] [added: 3.36] | | | $ | [removed: 3.07] [added: 3.51] | |
| Diluted net income per share | | | | | | | | | | | | | | | | | | | | [added: |]
| Income from continuing operations | [added: |] $ | [removed: 2.70] [added: 4.31] | | | $ | [removed: 3.56] [added: 2.70] | | | $ | [removed: 3.29] [added: 3.56] | | | $ | [removed: 2.64] [added: 3.29] | | | $ | [removed: 2.89] [added: 2.64] | |
| Income from discontinued operations | | [added: |] — | | | | — | | | | — | | | | [removed: 0.81] [added: —] | | | | [removed: 0.12] [added: 0.81] | |
| Diluted net income per share | [added: |] $ | [removed: 2.70] [added: 4.31] | | | $ | [removed: 3.56] [added: 2.70] | | | $ | [removed: 3.29] [added: 3.56] | | | $ | [removed: 3.45] [added: 3.29] | | | $ | [removed: 3.01] [added: 3.45] | |
| Cash dividends declared per share (2) | [added: |] $ | [removed: 1.00] [added: 1.08] | | | $ | [removed: —] [added: 1.00] | | | $ | — | | | $ | — | | | $ | — | |
| Weighted average shares outstanding: | | | | | | | | | | | | | | | | | | | | [added: |]
| Basic | | [removed: 163,535,438] | [added: 162,610,586] | | | [removed: 164,808,110] | [added: 163,535,438] | | | [removed: 165,168,224] | [added: 164,808,110] | | | [removed: 168,248,304] | [added: 165,168,224] | | | [removed: 165,090,380] | [added: 168,248,304] | [added: |]
| Diluted | | [removed: 166,560,115] | [added: 165,320,709] | | | [removed: 168,297,836] | [added: 166,560,115] | | | [removed: 168,688,868] | [added: 168,297,836] | | | [removed: 171,171,572] | [added: 168,688,868] | | | [removed: 168,451,343] | [added: 171,171,572] | [added: |]
| | [removed: 2019] | [added: 2020] | | | [removed: 2018] | [added: 2019] | | | [removed: 2017] | [added: 2018] | | | [removed: 2016] | [added: 2017] | | | [removed: 2015] | [added: 2016] | | [added: |]
| | [added: |] (in millions) | | | | | | | | | | | | | | | | | | |
| --- | --- | --- | --- | --- | --- | --- | --- | --- | --- | --- | --- | --- | --- | --- | --- | --- | --- | --- | --- | --- |
| Insurance | | $ | 1,986.3 | | | $ | 1,865.2 | | | $ | 1,714.9 | | | $ | 1,558.0 | | | $ | 1,426.2 | |
| Energy and Specialized Markets | | | 641.6 | | | | 563.9 | | | | 504.3 | | | | 437.2 | | | | 435.7 | |
| --- | --- | --- | --- | --- | --- | --- | --- | --- | --- | --- | --- | --- | --- | --- | --- | --- | --- | --- | --- | --- |
| Insurance | | $ | 1,129.3 | | | $ | 823.3 | | | $ | 929.1 | | | $ | 852.7 | | | $ | 776.3 | |
| Energy and Specialized Markets | | | 216.8 | | | | 141.2 | | | | 157.5 | | | | 136.7 | | | | 154.1 | |
| --- | --- | --- | --- | --- | --- | --- | --- | --- | --- | --- | --- | --- | --- | --- | --- | --- | --- | --- | --- | --- |
| --- | --- | --- |
| | | |
| | | |
| | | |
| | | |
| --- | --- | --- |
| | | |
| | | |
| | | |
| --- | --- | --- |
| | | |
| | | | | | | | | | | | | | | | | | | | |
| --- | --- | --- | --- | --- | --- | --- | --- | --- | --- | --- | --- | --- | --- | --- | --- | --- | --- | --- | --- |
| | | | | | | | | | | | | | | | | | | | |
| | | | | | | | | | | | | | | | | | | | |
| Insurance | $ | 1,855.5 | | | $ | 1,705.9 | | | $ | 1,550.5 | | | $ | 1,419.1 | | | $ | 1,330.6 | |
| Energy and Specialized Markets | | 573.6 | | | | 513.3 | | | | 444.7 | | | | 442.8 | | | | 308.8 | |
| Gain on derivative instruments | | — | | | | — | | | | — | | | | — | | | | 85.2 | |
| | | | | | | | | | | | | | | | | | | | |
| --- | --- | --- | --- | --- | --- | --- | --- | --- | --- | --- | --- | --- | --- | --- | --- | --- | --- | --- | --- |
| | | | | | | | | | | | | | | | | | | | |
| | | | | | | | | | | | | | | | | | | | |
| Insurance | $ | 827.1 | | | $ | 932.2 | | | $ | 855.8 | | | $ | 779.2 | | | $ | 762.5 | |
| Energy and Specialized Markets | | 137.4 | | | | 154.4 | | | | 133.6 | | | | 151.2 | | | | 162.3 | |
| | | | | | | | | | | | | | | | | | | | |
| --- | --- | --- | --- | --- | --- | --- | --- | --- | --- | --- | --- | --- | --- | --- | --- | --- | --- | --- | --- |
| | | | | | | | | | | | | | | | | | | | |
| | | | | | | | | | | | | | | | | | | | |
| | |
| --- | --- |
| | |
| --- | --- |
| | |
| --- | --- |
isolation, or as a substitute for an analysis of our operating income, net income or cash flow from operating activities reported under GAAP.
Management uses EBITDA in conjunction with traditional GAAP operating performance measures as part of its overall assessment of company performance.
Some of these limitations involved in the use of EBITDA are:
| | |
| --- | --- |
| | |
| --- | --- |
| | |
| --- | --- |
| | |
| --- | --- |
| | |
| --- | --- |
| (4) | Refer to Note 8. of our consolidated financial statements included in this annual report on Form 10-K for the impacts of the adoption of Topic 842, *Leases.* |
| | |
| --- | --- |
| | |
An excerpt. Shown here: 40 of 67 rewritten, all 18 added and 40 of 41 removed. The counts are complete. For every sentence, read Item 6. Selected Financial Data in the FY2020 filing and the FY2019 filing.
Item 9. Changes in and Disagreements with Accountants on Accounting and Financial Disclosure
0 rewritten, 0 added, 2 removed, 2 unchanged
Read the full itemFY2020 item · filed February 23, 2021FY2019 item · filed February 18, 2020
| | |
| | |
Item 9A. Controls and Procedures
18 rewritten, 2 added, 4 removed, 32 unchanged
Read the full itemFY2020 item · filed February 23, 2021FY2019 item · filed February 18, 2020
We are required to maintain disclosure controls and procedures (as that term is defined in Rules 13a-15(e) under the Securities Exchange Act of 1934, as amended (the “Exchange Act”)) that are designed to ensure that information required to be disclosed in our reports under the Exchange Act is recorded, processed, summarized, and reported within the time periods [added: specified in the Securities and Exchange Commission’s rules and forms, and that such information is accumulated and communicated to our management, including our Chief Executive Officer and Chief Financial Officer, as appropriate, to allow timely decisions regarding required disclosures.]
Our management, with the participation of the Chief Executive Officer and Chief Financial Officer, has evaluated the effectiveness of [removed: the Company’s] [added: our] disclosure controls and procedures (as defined in Exchange Act Rules 13a-15(e) and 15d-15(e)) as of the end of the period covered by this annual report on Form 10-K for [removed: the Company and] our [added: company and] subsidiaries other than our recent acquisitions in [removed: 2019] [added: 2020] (See [removed: Note 10 of our consolidated financial statements included in this annual report on Form 10-K).][added: [Note 10](#FN_10_-_Acquisitions).]
Management excluded from its assessment the internal control over financial reporting of these acquisitions and collectively represents less than [removed: 1.4%] [added: 0.4%] of total assets (excluding goodwill and intangible assets which were integrated into [removed: the Company's] [added: our] systems and control environment) and less than [removed: 1.7%] [added: 0.3%] of revenues as of and for the year ended December 31, [removed: 2019.][added: 2020.]
Based upon the foregoing assessments, our Chief Executive Officer and Chief Financial Officer have concluded that, as of December 31, [removed: 2019,] [added: 2020,] our disclosure controls and procedures were effective at the reasonable assurance level.
The information required by this Item is set forth on page [removed: 46] [added: 40] of this annual report on Form 10-K.
The information required by this Item is set forth on [removed: pages 47 through 48] [added: page 41] of this annual report on Form 10-K.
We are in the process of integrating our recent acquisitions in [removed: 2019] [added: 2020] into our overall internal control over financial reporting process.
Other than this ongoing integration, there have been no changes in our internal control over financial reporting identified in connection with the evaluation of such internal control that occurred during the fourth quarter of [removed: 2019] [added: 2020] that have materially affected, or are reasonably likely to materially affect, our internal control over financial reporting.
Based on this assessment, management concluded that our internal control over financial reporting was effective at December 31, [removed: 2019.][added: 2020.]
Management excluded from its assessment the internal control over financial reporting for our acquisitions in [removed: 2019] [added: 2020] (See [removed: Note 10.][added: [Note 10](#FN_10_-_Acquisitions).]
The excluded financial statements of these acquisitions constitute approximately [removed: 1.4%] [added: 0.4%] of total assets (excluding goodwill and intangible assets which were integrated into [removed: the Company's] [added: our] systems and control environment) and [removed: 1.7%] [added: 0.3%] of revenues collectively included within our consolidated financial statements as of and for the year ended December 31, [removed: 2019.][added: 2020.]
Deloitte & Touche LLP, the independent registered public accounting firm that audited the consolidated financial statements included in this annual report on Form 10-K has also audited the effectiveness of our internal control over financial reporting as of December 31, [removed: 2019,] [added: 2020,] as stated in their report which is included herein.
We have audited the internal control over financial reporting of Verisk Analytics, Inc. and subsidiaries (the “Company”) as of December 31, [removed: 2019,] [added: 2020,] based on criteria established in [removed: *Internal] [added: _Internal] Control - Integrated Framework [removed: (2013)*] [added: (2013)_] issued by the Committee of Sponsoring Organizations of the Treadway Commission (COSO).
In our opinion, the Company maintained, in all material respects, effective internal control over financial reporting as of December 31, [removed: 2019,] [added: 2020,] based on criteria established in [removed: *Internal] [added: _Internal] Control - Integrated Framework [removed: (2013)*] [added: (2013)_] issued by COSO.
We have also audited, in accordance with the standards of the Public Company Accounting Oversight Board (United States) (PCAOB), the consolidated financial statements as of and for the year ended December 31, [removed: 2019,] [added: 2020,] of the Company and our report dated February [removed: 18, 2020,] [added: 23, 2021,] expressed an unqualified opinion on those consolidated financial [removed: statements and included an explanatory paragraph regarding the Company’s adoption of a new accounting standard.][added: statements.]
As described in Management’s Report on Internal Controls over Financial Reporting, management excluded from its assessment the internal control over financial reporting at [removed: Content as a Service (“Caas”), which was acquired on March 29, 2019, Keystone Aerial Surveys, Inc., which was acquired on July 31, 2019, Property Pres Wizard, LLC., which was acquired on August 28, 2019, BuildFax, Inc., which was acquired on October 10, 2019, Genscape, Inc., which was acquired on November 5, 2019, Commerce Signals, Inc.,] [added: Franco Signor,] which was acquired on [removed: December 19, 2019, and Flexible Architecture] [added: September 9, 2020,] and [removed: Simplified Technology, LLC,] [added: Jornaya,] which was acquired on December [removed: 23, 2019] [added: 16, 2020] (collectively the [removed: “2019] [added: “2020] acquired businesses”).
The [removed: consolidated] financial statements of the [removed: 2019] [added: 2020] acquired businesses constitute less than [removed: 1.4%] [added: 0.4%] of total assets (excluding goodwill and intangible assets which were integrated into the Company's systems and control environment) and less than [removed: 1.7%] [added: 0.3%] of revenues collectively of the consolidated financial statement amounts as of and for the year ended December 31, [removed: 2019.][added: 2020.]
Accordingly, our audit did not include the internal control over financial reporting at the [removed: 2019] [added: 2020] acquired businesses.
of our consolidated financial statements included in this annual report on Form 10-K).
February 23, 2021
specified in the Securities and Exchange Commission’s rules and forms, and that such information is accumulated and communicated to our management, including our Chief Executive Officer and Chief Financial Officer, as appropriate, to allow timely decisions regarding required disclosures.
February 18, 2020
| | |
| | |
Item 9B. Other Information
1 rewritten, 0 added, 2 removed, 2 unchanged
Read the full itemFY2020 item · filed February 23, 2021FY2019 item · filed February 18, 2020
[removed: PART] [added: [](# "p3")PART] III
| | |
| | |
Item 10. Directors, Executive Officers and Corporate Governance
1 rewritten, 0 added, 2 removed, 4 unchanged
Read the full itemFY2020 item · filed February 23, 2021FY2019 item · filed February 18, 2020
is incorporated herein by reference to our Notice of Annual Meeting of Stockholders and Proxy Statement to be filed within 120 days of December 31, [removed: 2019] [added: 2020] (the “Proxy Statement”).
| | |
| | |
Item 11. Executive Compensation
0 rewritten, 1 added, 1 removed, 4 unchanged
Read the full itemFY2020 item · filed February 23, 2021FY2019 item · filed February 18, 2020
| --- | --- |
| | |
Item 12. Security Ownership of Certain Beneficial Owners and Management and Related Stockholder Matters
0 rewritten, 0 added, 1 removed, 4 unchanged
Read the full itemFY2020 item · filed February 23, 2021FY2019 item · filed February 18, 2020
| | |
Item 13. Certain Relationships and Related Transactions and Director Independence
0 rewritten, 0 added, 1 removed, 4 unchanged
Read the full itemFY2020 item · filed February 23, 2021FY2019 item · filed February 18, 2020
| | |
Item 14. Principal Accounting Fees and Services
1 rewritten, 0 added, 3 removed, 2 unchanged
Read the full itemFY2020 item · filed February 23, 2021FY2019 item · filed February 18, 2020
[removed: PART] [added: [](# "p4")PART] IV
| | |
| --- | --- |
| | |
Item 15. Exhibits and Financial Statement Schedule
3 rewritten, 3 added, 8 removed, 2 unchanged
Read the full itemFY2020 item · filed February 23, 2021FY2019 item · filed February 18, 2020
| [added: |] (1) | Financial Statements. See Index to Financial Statements and Schedules in Part II, Item 8. on this Form 10-K. |
| [added: |] (2) | Financial Statement Schedule. See Schedule II. Valuation and Qualifying Accounts and Reserves. |
| [added: |] (3) | Exhibits. See Index to Exhibits in this annual report on Form 10-K. |
| --- | --- | --- |
| | | |
| | | |
| | |
| --- | --- |
| | |
| --- | --- |
| | |
| --- | --- |
| | |
| | |
Item 16. Form 10-K Summary
0 rewritten, 1 added, 0 removed, 1 unchanged
Read the full itemFY2020 item · filed February 23, 2021FY2019 item · filed February 18, 2020
| --- | --- |
Item 8. Consolidated Financial Statements and Supplementary Data
1,097 rewritten, 349 added, 630 removed, 359 unchanged
Read the full itemFY2020 item · filed February 23, 2021FY2019 item · filed February 18, 2020
| Verisk Analytics, Inc. Consolidated Financial Statements as of December 31, [removed: 2019] [added: 2020] and [removed: 2018] [added: 2019] and for the Years Ended December 31, [removed: 2019, 2018] [added: 2020, 2019] and [removed: 2017.] [added: 2018.] | |
| [Report of Independent Registered Public Accounting [removed: Firm](#s42F23FB841DB5FE796FDD153A047E589)] [added: Firm](#report)] | [removed: [53](#s42F23FB841DB5FE796FDD153A047E589)] [added: [46](#report)] |
| [Consolidated Balance [removed: Sheets](#s486D3485156253CDB6E64AD8EC9DF33D)] [added: Sheets](#cbs)] | [removed: [55](#s486D3485156253CDB6E64AD8EC9DF33D)] [added: [48](#cbs)] |
| [Consolidated Statements of [removed: Operations](#s02c88915273148df9ffb3b49206a7f93)] [added: Operations](#cso)] | [removed: [56](#s02c88915273148df9ffb3b49206a7f93)] [added: [49](#cso)] |
[removed: | [Consolidated Statements of Comprehensive Income](#s7380EF78147A56A59D1C789A8EF701C9) | [57](#s7380EF78147A56A59D1C789A8EF701C9) |][added: CONSOLIDATED STATEMENTS OF COMPREHENSIVE INCOME]
| [Consolidated Statements of Changes in Stockholders' [removed: Equity](#s2B4ABCC3CC355A4290F39F51098A65A5)] [added: Equity](#csse)] | [removed: [58](#s2B4ABCC3CC355A4290F39F51098A65A5)] [added: [51](#csse)] |
| [Consolidated Statements of Cash [removed: Flows](#sA5BEB1B0F5EE5B30A23C2D939E5F7598)] [added: Flows](#ccf)] | [removed: [59](#sA5BEB1B0F5EE5B30A23C2D939E5F7598)] [added: [52](#ccf)] |
| [Notes to Consolidated Financial [removed: Statements](#s4D2261F7FBCE58899D376079C919BF3E)] [added: Statements](#notes)] | [removed: [61](#s4D2261F7FBCE58899D376079C919BF3E)] [added: [54](#notes)] |
| [Schedule II, Valuation and Qualifying Accounts and [removed: Reserves](#s44E86E76E0B05E94BB25FD6D0BA64E0C)] [added: Reserves](#schedule2)] | [removed: [103](#s44E86E76E0B05E94BB25FD6D0BA64E0C)] [added: [89](#schedule2)] |
[removed: REPORT] [added: [](# "report")REPORT] OF INDEPENDENT REGISTERED PUBLIC ACCOUNTING FIRM
We have audited the accompanying consolidated balance sheets of Verisk Analytics, Inc. and subsidiaries (the "Company") as of December 31, [removed: 2019] [added: 2020] and [removed: 2018,] [added: 2019,] the related consolidated statements of operations, comprehensive [removed: income (loss),] [added: income,] stockholders' equity, and cash flows, for each of the three years in the period ended December 31, [removed: 2019,] [added: 2020,] and the related notes and the schedule listed in the Index at Item 15 (collectively referred to as the "financial statements").
In our opinion, the financial statements present fairly, in all material respects, the financial position of the Company as of December 31, [removed: 2019] [added: 2020] and [removed: 2018,] [added: 2019,] and the results of its operations and its cash flows for each of the three years in the period ended December 31, [removed: 2019,] [added: 2020,] in conformity with accounting principles generally accepted in the United States of America.
We have also audited, in accordance with the standards of the Public Company Accounting Oversight Board (United States) (PCAOB), the Company's internal control over financial reporting as of December 31, [removed: 2019,] [added: 2020,] based on criteria established in [removed: *Internal] [added: _Internal] Control - Integrated Framework [removed: (2013)*] [added: (2013)_] issued by the Committee of Sponsoring Organizations of the Treadway Commission and our report dated February [removed: 18, 2020,] [added: 23, 2021,] expressed an unqualified opinion on the Company's internal control over financial reporting.
[removed: *Critical] [added: _Critical] Audit Matter [removed: Description*][added: Description_]
[added: The goodwill balance was $4,108.1 million as of] December 31, [removed: 2019] [added: 2020] of which [removed: $2,255] [added: $2,287.0] million was attributable to a reporting unit within the Energy & Specialized Markets reportable segment.
[removed: *How] [added: _How] the Critical Audit Matter was addressed in the [removed: Audit*][added: Audit_]
| [added: |] • | We tested the effectiveness of controls over management’s goodwill impairment evaluation, including those over the determination of the fair value of the reporting unit within the Energy and Specialized Markets reportable segment such as controls related to management’s selection of the discount rate, forecasts of future revenue and Revenue and EBITDA multiples. |
| [added: |] • | We evaluated management’s ability to accurately forecast future revenues and EBITDA margins by comparing actual results to management’s historical forecasts. |
| [added: |] • | We evaluated the reasonableness of management’s revenue and EBITDA margin forecasts by comparing the forecasts to: |
| [added: |] ◦ | Historical revenues and EBITDA margins. |
| [added: |] ◦ | Internal communications to management and the Board of Directors. |
| [added: |] ◦ | Forecasted information included in Company press releases, as well as in analyst and industry reports for the Company and certain peer companies. |
| [added: |] • | With the assistance of our fair value specialists, we evaluated the reasonableness of the (1) valuation methodologies (2) Revenue and EBITDA multiples and (3) the discount rate by: |
| [added: |] ◦ | Testing the source information underlying the determination of the discount rate, the selection of the Revenue and EBITDA multiples and the mathematical accuracy of the calculations. |
| [added: |] ◦ | Developing a range of independent estimates and comparing those to the discount rate selected by management. |
[removed: VERISK] [added: [](# "cbs")VERISK] ANALYTICS, INC.
As [removed: of December] [added: of December] 31, [added: 2020 and] 2019 [removed: and 2018]
| | [removed: 2019] | [added: _2020_] | | | [removed: 2018] | [added: _2019_] | | [added: | | _2018_ | | |]
| | [added: |] (in millions, except par value and number of shares) | | | | | | |
| [removed: ASSETS:] [added: __ASSETS:__] | | | | | | | | [added: |]
| Current assets: | | | | | | | | [added: |]
| Cash and cash equivalents | [added: |] $ | [removed: 184.6] [added: 218.8] | | | $ | [removed: 139.5] [added: 184.6] | |
| Accounts receivable, net | | [removed: 441.6] | [added: 432.4] | | | [removed: 356.4] | [added: 441.6] | [added: |]
| Prepaid expenses | | [removed: 60.9] | [added: 81.2] | | | [removed: 63.9] | [added: 60.9] | [added: |]
| Income taxes receivable | | [removed: 25.9] | [added: 25.4] | | | [removed: 34.0] | [added: 25.9] | [added: |]
| Other current assets | | [removed: 17.8] | [added: 36.4] | | | [removed: 50.7] | [added: 17.8] | [added: |]
| Current assets held for sale | | [removed: 14.1] | [added: —] | | | [removed: —] | [added: 14.1] | [added: |]
| Total current assets | | [removed: 744.9] | [added: 794.2] | | | [removed: 644.5] | [added: 744.9] | [added: |]
| Noncurrent assets: | | | | | | | | [added: |]
| Fixed assets, net | | [removed: 548.1] | [added: 632.3] | | | [removed: 555.9] | [added: 548.1] | [added: |]
| --- | --- | --- |
| --- | --- | --- |
| --- | --- | --- |
February 23, 2021
| --- | --- | --- | --- | --- | --- | --- | --- | --- | --- | --- | --- | --- |
| --- | --- | --- | --- | --- | --- | --- | --- | --- | --- | --- | --- | --- | --- | --- | --- | --- | --- | --- | --- |
| Adjustment to opening retained earnings related to Topic 326 | | _—_ | | — | | — | | | — | | | (2.4 | ) | | — | | | (2.4 | ) |
| Net income | | _—_ | | — | | — | | | — | | | 712.7 | | | — | | | 712.7 | |
| Common stock dividend (1) | | _—_ | | — | | — | | | — | | | (176.5 | ) | | — | | | (176.5 | ) |
| Balance as of December 31, 2020 | | 544,003,038 | $ | 0.1 | $ | 2,490.9 | | $ | (4,179.3 | ) | $ | 4,762.2 | | $ | (375.7 | ) | $ | 2,698.2 | |
| --- | --- | --- | --- | --- | --- | --- | --- | --- | --- | --- | --- | --- |
| Proceeds from sale of assets | | | 23.1 | | | | — | | | | — | |
| Investments in non-public companies | | | (94.8 | ) | | | — | | | | — | |
| --- | --- | --- | --- | --- | --- | --- | --- | --- | --- | --- | --- | --- |
| Repayment of short-term debt with original maturities greater than three months | | | (20.0 | ) | | | — | | | | — | |
| Payment of contingent liability related to acquisition | | | (34.2 | ) | | | — | | | | — | |
| Gain on sale of assets included in other current and long-term assets | | $ | 3.5 | | | $ | — | | | $ | — | |
| Non-cash contribution of assets for a non-public company | | $ | 65.9 | | | $ | — | | | $ | — | |
Since _January 2020,_ an outbreak of the _2019_ novel coronavirus ("COVID-_19"_) has evolved into a worldwide pandemic.
We have modified our operations in line with our business continuity plans due to COVID-_19._ While our facilities generally remain open, we are making extensive use of the work-from-home model at this moment.
On a daily basis, management is reviewing our operations and there have been to date minimal interruptions in our customer facing operations.
Given the digital nature of our business and the move toward cloud enablement, we expect to remain operationally stable and fully available to our customers.
We are in compliance with all financial and non-financial covenants and have _not_ observed a loss of any significant customers, a significant deterioration in the collectability of receivables, a significant reduction in our liquidity nor a significant decline in subscription renewal rates.
_54_
[](#toc)
Unbilled receivables are short-term in nature and expected to be billed within one year.
_55_
[](#toc)
_56_
[](#toc)
_57_
[](#toc)
_58_
[](#toc)
[](# "Note 2(s) - Recent Accounting Pronouncements")
| --- | --- | --- | --- | --- | --- | --- |
| _Financial Instruments—Credit Losses (Topic _326_)_ In _June 2016,_ Financial Accounting Standards Board ("FASB") issued Accounting Standards Update ("ASU") _No._ _2016_\-_13,_ "Measurement of Credit Losses on Financial Instruments" ("Topic _326"_) | | Topic _326_ replaces the current “incurred loss” model for recognizing credit losses with an “expected loss” model referred to as the Current Expected Credit Loss ("CECL") model. Under the CECL model, an entity is required to present certain financial assets carried at amortized cost, such as trade receivables, at the net amount expected to be collected. The measurement of expected credit losses is to be based on information about past events, including historical experience, current conditions, and reasonable and supportable forecasts that affect the collectability of the reported amount. This measurement takes place at the time the financial asset is _first_ added to the balance sheet and periodically thereafter. This differs significantly from the “incurred loss” model required under U.S. GAAP, which delays recognition until it is probable a loss has been incurred. | | We adopted these amendments on _January 1, 2020._ | | Refer to our accompanying consolidated statements of changes in stockholders' equity for the adjustment of the opening retained earnings and [Note _7_](#FN_7_-_Fair_Value_Measurements). Fair Value Measurements for further discussions. |
| _Reference Rate Reform_ (Topic _848_) In _March 2020,_ the FASB issued ASU _No._ _2020_\-_04,_ "Facilitation of the Effects of Reference Rate Reform on Financial Reporting" ("ASU _No._ _2020_\-_04"_) | | The amendment in this update provides optional expedients and exceptions for applying U.S. GAAP to contracts, hedging relationships, and other transactions affected by reference rate reform if certain criteria are met. The amendment in this update applies only to contracts, hedging relationships, and other transactions that reference LIBOR or another reference rate expected to be discontinued because of reference rate reform. The expedients and exceptions provided by the amendment does _not_ apply to contract modifications made and hedging relationships entered into or evaluated after _December 31, 2022,_ except for hedging relationships existing as _December 31, 2022,_ that an entity has elected certain optional expedients for and that are retained through the end of the hedging relationship. | | The amendment in this update is effective for all entities as of _March 12, 2020_ through _December 31, 2022._ | | We adopted this amendment on _March 12, 2020._ There was _no_ impact to our consolidated financial statements as of and for the year ended _December 31, 2020._ We continue to monitor the transition of LIBOR to alternative reference rate measures that will likely become effective post _December 2021._ |
_59_
[](#toc)
| | |
| --- | --- |
| | |
| | |
| | |
| | |
| | |
| | |
| | |
| | |
| | |
Change in Accounting Principle
As discussed in Note 8 to the financial statements, effective January 1, 2019, the Company adopted FASB Accounting Standards Codification (“ASC”) Topic 842, *Leases*, using the modified retrospective approach.
The goodwill balance was $3,864 million as of
| | |
| --- | --- |
| | |
| --- | --- |
| | |
| --- | --- |
| | |
| --- | --- |
| | |
| --- | --- |
| | |
| --- | --- |
| | |
| --- | --- |
| | |
| --- | --- |
| | |
| --- | --- |
February 18, 2020
| | | | | | | | |
| --- | --- | --- | --- | --- | --- | --- | --- |
| | | | | | | | |
| | | | | | | | |
| | | | | | | | |
| | | | | | | | |
| | | | | | | | |
An excerpt. Shown here: 40 of 1,097 rewritten, 40 of 349 added and 40 of 630 removed. The counts are complete. For every sentence, read Item 8. Consolidated Financial Statements and Supplementary Data in the FY2020 filing and the FY2019 filing.