 filings.tools
Verisign 10-K 2017-12-31
Filed 2018-02-16. 22 sections, 306K characters. Original on sec.gov · Markdown · JSON
Cover and table of contents
10-K 1 vrsn-20171231x10k.htm 10-K
UNITED STATES
SECURITIES AND EXCHANGE COMMISSION
Washington, D.C. 20549
————————
FORM 10-K
(Mark One)
| þ | ANNUAL REPORT PURSUANT TO SECTION 13 OR 15(d) OF THE SECURITIES EXCHANGE ACT OF 1934 |
For the fiscal year ended December 31, 2017
OR
| o | TRANSITION REPORT PURSUANT TO SECTION 13 OR 15(d) OF THE SECURITIES EXCHANGE ACT OF 1934 |
For the transition period from to
Commission File Number: 000-23593
————————
VERISIGN, INC.
(Exact name of registrant as specified in its charter)
| Delaware | 94-3221585 | |
| (State or other jurisdiction of incorporation or organization) | (I.R.S. Employer Identification No.) | |
| 12061 Bluemont Way, Reston, Virginia | 20190 | |
| (Address of principal executive offices) | (Zip Code) |
Registrant’s telephone number, including area code: (703) 948-3200
Securities registered pursuant to Section 12(b) of the Act:
| Title of each class | Name of each exchange on which registered |
| Common Stock $0.001 Par Value Per Share | NASDAQ Global Select Market |
Securities registered pursuant to Section 12(g) of the Act: None
———————
Indicate by check mark if the registrant is a well-known seasoned issuer, as defined in Rule 405 of the Securities Act. YES þ NO o
Indicate by check mark if the registrant is not required to file reports pursuant to Section 13 or Section 15(d) of the Act. YES o NO þ
Indicate by check mark whether the registrant (1) has filed all reports required to be filed by Section 13 or 15(d) of the Securities Exchange Act of 1934 during the preceding 12 months (or for such shorter period that the registrant was required to file such reports), and (2) has been subject to such filing requirements for the past 90 days. YES þ NO o
Indicate by check mark whether the registrant has submitted electronically and posted on its corporate Web site, if any, every Interactive Data File required to be submitted and posted pursuant to Rule 405 of Regulation S-T (§232.405 of this chapter) during the preceding 12 months (or for such shorter period that the registrant was required to submit and post such files). YES þ NO o
Indicate by check mark if disclosure of delinquent filers pursuant to Item 405 of Regulation S-K is not contained herein, and will not be contained, to the best of the registrant’s knowledge, in definitive proxy or information statements incorporated by reference in Part III of this Form 10-K or any amendment to this Form 10-K. o
Indicate by check mark whether the registrant is a large accelerated filer, an accelerated filer, a non-accelerated filer, or a smaller reporting company. See the definitions of “large accelerated filer,” “accelerated filer” and “smaller reporting company” in Rule 12b-2 of the Exchange Act.
| Large accelerated filer | þ | Accelerated filer | o | ||||
| Non-accelerated filer | o | Smaller reporting company | o | ||||
| Emerging growth company | o |
If an emerging growth company, indicate by check mark if the registrant has elected not to use the extended transition period for complying with any new or revised financial accounting standards provided pursuant to Section 13(a) of the Exchange Act. o
Indicate by check mark whether the registrant is a shell company (as defined in Rule 12b-2 of the Exchange Act.): YES o NO þ
The aggregate market value of the voting and non-voting common equity stock held by non-affiliates of the Registrant as of June 30, 2017, was $3.3 billion based upon the last sale price reported for such date on the NASDAQ Global Select Market. For purposes of this disclosure, shares of Common Stock held by persons known to the Registrant (based on information provided by such persons and/or the most recent schedule 13Gs filed by such persons) to beneficially own more than 5% of the Registrant’s Common Stock and shares held by officers and directors of the Registrant have been excluded because such persons may be deemed to be affiliates. This determination is not necessarily a conclusive determination for other purposes.
Number of shares of Common Stock, $0.001 par value, outstanding as of the close of business on February 9, 2018: 97,120,531 shares.
DOCUMENTS INCORPORATED BY REFERENCE
Portions of the definitive Proxy Statement to be delivered to stockholders in connection with the 2018 Annual Meeting of Stockholders are incorporated by reference into Part III
TABLE OF CONTENTS
For purposes of this Annual Report, the terms “Verisign”, “the Company”, “we”, “us”, and “our” refer to VeriSign, Inc. and its consolidated subsidiaries.
PART I
Item 1. BUSINESS
Overview
We are a global provider of domain name registry services and internet security, enabling internet navigation for many of the world’s most recognized domain names and providing protection for websites and enterprises around the world (“Registry Services”). Our Registry Services ensure the security, stability, and resiliency of key internet infrastructure and services, including the .com and .net domains, two of the internet’s root servers, and operation of the root zone maintainer function for the core of the internet’s Domain Name System (“DNS”). Our product suite also includes Security Services, consisting of Distributed Denial of Service (“DDoS”) Protection Services and Managed DNS Services. On April 1, 2017, we completed the sale of our iDefense Security Intelligence Services (“iDefense”) business.
We have one reportable segment, which consists of Registry Services and Security Services. We have operations inside as well as outside the United States (“U.S.”). For certain additional information about our segment, including a geographic breakdown of revenues and changes in revenues, see “Management’s Discussion and Analysis of Financial Condition and Results of Operations” in Item 7 and Note 7, “Geographic and Customer Information” of our Notes to Consolidated Financial Statements in Item 15 of this Form 10-K.
We were incorporated in Delaware on April 12, 1995. Our principal executive offices are located at 12061 Bluemont Way, Reston, Virginia 20190. Our telephone number at that address is (703) 948-3200. Our common stock is traded on the NASDAQ Global Select Market under the ticker symbol VRSN. VERISIGN, the VERISIGN logo, and certain other product or service names are registered or unregistered trademarks in the U.S. and other countries. Other names used in this Form 10-K may be trademarks of their respective owners. Our primary website is https://www.Verisign.com. The information available on, or accessible through, this website is not incorporated in this Form 10-K by reference.
Our Annual Report on Form 10-K, Quarterly Reports on Form 10-Q, Current Reports on Form 8-K, and amendments to those reports filed or furnished pursuant to Section 13(a) or 15(d) of the Securities Exchange Act of 1934, as amended (the “Exchange Act”), are available, free of charge, on the Investor Relations section of our website as soon as is reasonably practicable after filing such reports with the Securities and Exchange Commission (the “SEC”). The public may read and copy any materials we file with the SEC at the SEC’s Public Reference Room at 100 F Street, NE, Washington, DC 20549. The public may obtain information on the operation of the Public Reference Room by calling the SEC at 1-800-SEC-0330. The SEC maintains an internet site that contains reports, proxy and information statements, and other information regarding issuers that file electronically with the SEC at https://www.sec.gov.
Pursuant to our agreements with the Internet Corporation for Assigned Names and Numbers (“ICANN”), we make available on our website (at https://www.Verisign.com/zone) files containing all active domain names registered in the .com and .net registries. At the same website address, we make available a summary of the active zone count registered in the .com and .net registries and the number of .com and .net domain names in the domain name base. The domain name base is the active zone plus the number of domain names that are registered but not configured for use in the respective top level domain zone file plus the number of domain names that are in a client or server hold status. These files and the related summary data are updated at least once per day. The update times may vary each day. The number of domain names provided in this Form 10-K are as of midnight of the date reported.
We announce material financial information to our investors using our investor relations website https://investor.Verisign.com, SEC filings, investor events, news and earnings releases, public conference calls and webcasts. We use these channels as well as social media to communicate with our investors and the public about our company, our products and services, and other issues. It is possible that the information we post on social media could be deemed to be material information. Therefore, we encourage investors, the media, and others interested in our Company to review the information we post on the social media channels listed below. This list may be updated from time to time on our investor relations website.
https://www.Facebook.com/Verisign
https://www.Twitter.com/Verisign
https://www.LinkedIn.com/company/Verisign
https://www.YouTube.com/user/Verisign
The contents of these websites are not intended to be incorporated by reference into this Annual Report on Form 10-K or in any other report or document we file.
Registry Services
Registry Services operates the authoritative directory of and/or the back-end systems for all .com, .net, .cc, .tv, .gov, .jobs,
.edu and .name domain names, among others. Registry Services allows individuals and organizations to establish their online identities, while providing the secure, always-on access they need to communicate and transact reliably with large-scale online audiences.
We are the exclusive registry of domain names within the .com, .net, and .name generic top-level domains (“gTLDs”), among others, under agreements with ICANN and also, with respect to the .com agreement, the U.S. Department of Commerce (“DOC”). We are also the exclusive registry of domain names within certain transliterations of .com and .net in a number of different native languages and scripts (“IDN gTLDs”). As a registry, we maintain the master directory of all second-level domain names in these gTLDs and IDN gTLDs (e.g., johndoe.com and janedoe.net). Our global constellation of domain name servers provides internet protocol (“IP”) address information in response to queries, enabling the use of browsers, email systems, and other systems on the internet. In addition, we own and maintain the shared registration system that allows all registrars to enter new second-level domain names into the master directory and to submit modifications, transfers, re-registrations and deletions for existing second-level domain names (“Shared Registration System”).
Separate from our agreements with ICANN, we have agreements to be the exclusive registry for the .tv and .cc country code top-level domains (“ccTLDs”) for Tuvalu and Cocos (Keeling) Islands, respectively, and to operate the back-end registry systems for the .gov, .jobs, and .edu sponsored TLDs. These TLDs are also supported by our global constellation of domain name servers and Shared Registration System.
We also provide internationalized domain name (“IDN”) services that enable internet users to access websites in characters representing their local language. Our gTLDs and ccTLDs can support standards compliant registrations in over 100 different native languages and scripts.
Domain names can be registered for between one and 10 years. The fees charged for .com, .net and .name may only be increased according to adjustments prescribed in our agreements with ICANN over the applicable term. With respect to .com, price increases require prior approval by the DOC according to the terms of Amendment 32 of the Cooperative Agreement, as amended, between the DOC and Verisign (“Cooperative Agreement”). Revenues for .cc and .tv domain names and our IDN gTLDs are based on a similar fee system and registration system, although the fees charged are not subject to the same pricing restrictions as those imposed by ICANN on .com, .net and .name. The fees received from operating the .gov registry are based on the terms of Verisign’s agreement with the U.S. General Services Administration. The fees received from operating the .jobs registry infrastructure, and that of others for which Verisign provides such services, are based on the terms of Verisign’s agreements with those respective registry operators.
Historically, we have experienced higher domain name growth in the first quarter of the year compared to other quarters. Our quarterly revenue does not reflect these seasonal patterns because the preponderance of our revenue for each quarterly period is provided by the ratable recognition of our deferred revenue balance. The effect of this seasonality has historically resulted in the largest amount of growth in our deferred revenue balance occurring during the first quarter of the year compared to the other quarters.
Security Services
Security Services provides infrastructure assurance to organizations and is comprised of DDoS Protection Services and Managed DNS Services.
DDoS Protection Services supports online business continuity by providing monitoring and mitigation services against DDoS attacks. We help companies stay online without needing to make significant investments in infrastructure or establish internal DDoS expertise. As a cloud-based service, DDoS Protection Services can be deployed quickly and easily, with no customer premise equipment required. This saves time and money through operational efficiencies, support costs, and economies of scale to provide detection and protection against the largest DDoS attacks. Customers include financial institutions, software-as-a-service providers, e-commerce providers, and media companies. Customers pay a subscription fee that varies depending on the customer’s network requirements.
Managed DNS Services is a hosting service that delivers DNS resolution, improving the availability of web-based systems. It provides DNS availability through a globally distributed, securely managed, cloud-based DNS infrastructure, allowing enterprises to save on capital expenses associated with DNS infrastructure deployment and reduce operational costs and complexity associated with DNS management. Managed DNS service provides full support for DNS Security Extensions (“DNSSEC”) compliance features and Geo Location traffic routing capabilities. DNSSEC is designed to protect the DNS infrastructure from man-in-the-middle attacks that corrupt, or poison, DNS data. Geo Location allows website owners to customize responses for end-users based on their physical location or IP address, giving them the ability to deliver location-specific content. Customers include financial institutions, e-commerce, and software-as-a-service providers. Customers pay a subscription fee that varies based on the amount of DNS traffic they receive.
Operations Infrastructure
Our operations infrastructure consists of three secure data centers in Dulles, Virginia; New Castle, Delaware; and Fribourg, Switzerland as well as more than 100 resolution sites around the world. These secure data centers operate 24 hours a day, supporting our business units and services. The performance and scale of our infrastructure are critical for our business, and give us the platform to maintain our leadership position. Key features of our operations infrastructure include:
| • | Distributed Servers: We operate a large number of high-speed servers globally to support localized capacity and availability demands. In conjunction with our proprietary software, processes and procedures, this platform offers rapid failover, global and local load balancing, and threshold monitoring on critical servers. |
| • | Networking: We deploy and maintain a redundant and diverse global network, maintain high-speed, redundant connections to numerous internet service providers, and maintain peering relationships globally to ensure that our critical services are readily accessible to customers at all times. |
| • | Security: We incorporate architectural concepts such as protected domains, restricted nodes and distributed access control in our system architecture. In addition, we employ firewalls and intrusion detection software, as well as proprietary security mechanisms at many points across our infrastructure. We perform recurring internal vulnerability testing and controls audits, and also contract with third-party security consultants who perform periodic penetration tests and security risk assessments on our systems. Verisign has engineered resiliency and diversity into how it hosts classes of products throughout its set of interconnected sites to mitigate unknown vendor defects and zero-hour security vulnerabilities. This includes different physical security silos, which themselves are separated into bulkheads, and in which servers are located. Corporate networks are in their own physical silo. Thus, the corporate networks to which personnel directly connect are separated from the silos that house production services; administration of production gear from corporate systems must go through an internal, fortified intermediary; and account credentials used within the corporate networks are not used within the production silos, nor on the fortified systems. |
| • | Data Integrity: Verisign employs both phased and systemic integrity validation operations via a number of proprietary mechanisms on all internal DNS publication operations. |
As part of our operations infrastructure for our Registry Services business, we operate all authoritative domain name servers that answer domain name queries for the .com and .net zones, as well as for the other TLDs for which we are the registry operator. We also perform the root zone maintainer function for the core of the internet’s Domain Name System (“DNS”) and administer and operate two of the 13 root zone servers that contain authoritative data for the very top of the DNS hierarchy. Our domain name servers provide the associated authoritative name servers and IP addresses for every .com and .net domain name on the internet and a large number of other TLD queries, resulting in an average of approximately 132 billion transactions per day. These name servers are located in resolution facilities which are in a controlled and monitored environment, incorporating security and system maintenance features. This network of name servers is one of the cornerstones of the internet’s DNS infrastructure.
We have continuously expanded our infrastructure to meet demands to support normal and peak system load and attack volumes based on what we have experienced historically, as well as to address projected internet attack trends.
Call Centers and Help Desk: We provide customer support services through our phone-based call centers, email help desks and web-based self-help systems. Our Virginia call center is staffed 24 hours a day, every day of the year to support our businesses. All call centers have a staff of trained customer support agents and also provide web-based support services utilizing customized automatic response systems to provide self-help recommendations.
Operations Support and Monitoring: Through our network operations centers, we have an extensive monitoring capability that enables us to track the status and performance of our critical database systems and our global resolution systems. Our network operations center is staffed 24 hours a day, every day of the year.
Disaster Recovery Plans: We have disaster recovery and business continuity capabilities that are designed to deal with the loss of entire data centers and other facilities. Our Registry Services business maintains dual mirrored data centers that allow rapid failover with no data loss and no loss of function or capacity, as well as off-continent tertiary Registry Services capabilities. Our critical data services (including domain name registration and global resolution) use advanced storage systems that provide data protection through techniques such as synchronous mirroring and remote replication.
Marketing, Sales and Distribution
We seek to expand our business through focused marketing campaigns and programs that target growth in the .com and .net domain name base, both domestically and in foreign markets. We offer promotional marketing programs for our registrars based upon market conditions and the business environment in which the registrars operate. We provide tools to be used by both registrars and end users to allow them to find relevant domain names. We market our Security Services worldwide through multiple distribution channels, including direct sales and indirect channels. We have marketing and sales offices in several countries around the world.
Research and Development
We believe that timely development of new and enhanced services, including monitoring and visualization, registry provisioning platforms, navigation and resolution services, data services, value added services, and Security Services, as well as new and enhanced ways to ensure the security, stability, and resiliency of our services, is necessary to remain competitive in the marketplace. During 2017, 2016, and 2015 our research and development expenses were $52.3 million, $59.1 million and $63.7 million, respectively.
Our future success will depend, in large part, on our ability to continue to maintain and enhance our current technologies and services and to develop new ones. We actively investigate and incubate new concepts and evaluate new business ideas through our innovation pipeline. We expect that most of the future enhancements to our existing services and our new services will be the result of internal development efforts in collaboration with suppliers, other vendors, customers, and the technology community. Under certain circumstances, we may also acquire or license technology from third parties.
The markets for our services are dynamic, characterized by rapid technological developments, frequent new product introductions, and evolving industry standards. The constantly changing nature of these markets and their rapid evolution will require us to continually improve the performance, features, and reliability of our services, particularly in response to competitive offerings, and to introduce both new and enhanced services as quickly as possible and prior to our competitors.
Competition
We compete with numerous companies in both the Registry Services and Security Services businesses. The overall number of our competitors may increase and the identity and composition of competitors may change over time.
New technologies and the expansion of existing technologies may increase competitive pressure. In addition, our markets are characterized by announcements of collaborative relationships involving our competitors. The existence or announcement of any such relationships could adversely affect our ability to attract and retain customers.
Competition in Registry Services: We face competition in the domain name registry space from other gTLD and ccTLD registries that are competing for the business of entities and individuals that are seeking to obtain a domain name registration, establish a web presence, as well as other uses of domain names, such as branded email. In addition to the gTLDs and ccTLDs we operate or for which we provide back-end registry services, there are over 1,000 other operational gTLD registries, over 250 Latin script ccTLD registries, more than 50 IDN ccTLD registries, and over 80 IDN gTLD registries. Under our agreements with ICANN, we are subject to certain restrictions in the operation of .com, .net and .name on pricing, bundling, marketing, methods of distribution, the introduction of new registry services, and use of registrars, that do not apply to ccTLDs and other gTLDs and therefore may create a competitive disadvantage.
To the extent end-users navigate using search engines or social media, as opposed to direct navigation, we may face competition from search engine operators such as Google, Microsoft, and Verizon, operators of social media networks such as Facebook, operators of ecommerce platforms such as Amazon, eBay and Taobao, and operators of microblogging tools such as Twitter. In addition, we may face competition from these social media businesses and ecommerce platforms if they are used to
establish an online presence by end-users rather than through the use of a domain name. Furthermore, to the extent end-users increase the use of web and mobile applications to locate and access content, we may face competition from providers of such web and mobile applications.
We also face competition from service providers that offer outsourced domain name registration, resolution and other DNS services to organizations that require a reliable and scalable infrastructure. Among our competitors are Neustar, Inc., Afilias plc, and CentralNic Ltd.
Competition in Security Services: Several of our current and potential competitors have longer operating histories and/or significantly greater financial, technical, marketing, sales, and other resources than we do and therefore may be able to respond more quickly than we can to new or changing opportunities, technologies, standards, and customer requirements. Many of these competitors also have broader and more established distribution channels that may be used to deliver competing products or services directly to customers through bundling or other means. If such competitors were to bundle competing products or services for their customers, we may experience difficulty establishing or increasing demand for our products and services or distributing our products successfully. In addition, it may be difficult to compete against consolidation and partnerships among our competitors which create integrated product suites.
Our Security Services business faces competition from companies such as Akamai Technologies, Inc., Cisco, Neustar, Inc., and Oracle, among others.
Industry Regulation
The internet is governed under a multi-stakeholder model comprising civil society, the private sector including for-profit and not-for-profit organizations such as ICANN, governments including the U.S. government, academia, non-governmental organizations, and international organizations. ICANN plays a central coordination role in the multi-stakeholder system. ICANN is mandated through its bylaws to uphold a private sector-led multi-stakeholder approach to internet governance for the public benefit. The multi-stakeholder process has and will continue to create policies, programs, and standards that directly or indirectly impact or affect our business. In addition, country-level regulations, such as those implemented by China, impose additional costs on our Registry Services, can affect the growth or renewal rates of domain name registrations, and may also affect our ability to do business. Similarly, in the European Union, legislative and regulatory bodies responsible for data privacy continue to enhance and modify data privacy protections, which impacts our collection and delivery of personal data as we provide our domain name registry services, and could affect costs of operation.
As the exclusive registry of domain names within the .com and .net gTLDs, we have entered into certain agreements with ICANN and, in the case of .com, the DOC under a Cooperative Agreement.
.com Registry Agreement
Following the extension of the .com Registry Agreement on October 20, 2016, the .com Registry Agreement provides that we will continue to be the sole registry operator for domain names in the .com gTLD through November 30, 2024. As part of the extension of the .com Registry Agreement, the Company and ICANN agreed to cooperate and negotiate in good faith to amend the terms of the .com Registry Agreement: (i) by October 20, 2018, to preserve and enhance the security and stability of the internet or the .com TLD, and (ii) as may be necessary for consistency with changes to, or the termination or expiration of, the Cooperative Agreement. The .com Registry Agreement includes pricing restrictions for .com domain name registrations, which sets a maximum price of $7.85 for a .com domain name registration and is consistent with the terms of the Cooperative Agreement as set forth below. In addition, on a quarterly basis, we pay $0.25 to ICANN for each annual increment of a domain name registered or renewed during such quarter. We are required to comply with and implement temporary specifications or policies and consensus policies, as well as other provisions pursuant to the .com Registry Agreement relating to handling of data and other registry operations. The .com Registry Agreement also provides a procedure for Verisign to propose, and ICANN to review and approve, additional registry services.
The .com and .net Registry Agreements with ICANN contain a “presumptive” right of renewal upon the expiration of their current terms. In addition to ICANN’s approval, a renewal of the .com Registry Agreement must be approved by the DOC, which, under certain circumstances, could refuse to grant its approval to the renewal of the .com Registry Agreement on similar terms, or at all. ICANN could terminate or refuse to renew our .com and/or .net Registry Agreements if, upon proper notice, (i) we fail to cure a fundamental and material breach of certain specified obligations, and (ii) we fail to timely comply with a final decision of an arbitrator or court. See “Risk Factors - Risks arising from our agreements governing our Registry Services business could limit our ability to maintain or grow our business” in Part I, Item 1A of this Annual Report on Form 10-K for further information. Our .com and .net Registry Agreements contain obligations to provide access to our systems, restrictions on our ability to market and bundle our products and services, and restrictions on our ability to control our registrar channel or own a registrar.
See the risk factor “Risks arising from our agreements governing our Registry Services business could limit our ability to maintain or grow our business” in Part 1A for further information.
Cooperative Agreement
The Cooperative Agreement will expire on November 30, 2018, unless the DOC, in its sole discretion, extends the term. The DOC has the right to conduct a public interest review for the sole purpose of determining whether the DOC will exercise its right to extend the term of the Cooperative Agreement. In connection with the aforementioned review, we agreed to cooperate fully and to work in good faith to reach a mutual agreement with the DOC to resolve issues identified in such review and to work in good faith to implement any agreed upon changes as of the expiration of the current term of the Cooperative Agreement.
The Cooperative Agreement provides that the Maximum Price (as defined in the .com Registry Agreement) of a .com domain name shall not exceed $7.85 for the term of the .com Registry Agreement, except that we are entitled to increase the Maximum Price of a .com domain name due to the imposition of any new Consensus Policy or documented extraordinary expense resulting from an attack or threat of attack on the Security or Stability of the DNS as described in the .com Registry Agreement, provided that we may not exercise such right unless the DOC provides prior written approval that the exercise of such right will serve the public interest, such approval not to be unreasonably withheld. The Cooperative Agreement further provides that we shall be entitled at any time during the term of the .com Registry Agreement to seek to remove the pricing restrictions contained in the .com Registry Agreement if we demonstrate to the DOC that market conditions no longer warrant pricing restrictions in the .com Registry Agreement, as determined by the DOC.
The Cooperative Agreement also provides that the DOC’s approval of the .com Registry Agreement is not intended to confer federal antitrust immunity on us with respect to the .com Registry Agreement. The Cooperative Agreement also provides that any renewal or extension of the .com Registry Agreement is subject to prior written approval by the DOC. The DOC shall approve such renewal if it concludes that approval will serve the public interest in (a) the continued security and stability of the internet DNS and the operation of the .com registry including, in addition to other relevant factors, consideration of Verisign’s compliance with consensus policies and technical specifications, its service level agreements as set forth in the .com Registry Agreement, and the investment associated with improving the security and stability of the DNS, and (b) the provision of Registry Services as defined in the .com Registry Agreement at reasonable prices, terms and conditions. The parties have an expectancy of renewal of the .com Registry Agreement so long as the foregoing public interest standard is met and Verisign is not in breach of the .com Registry Agreement.
.net Registry Agreement
We entered into a renewal of our .net Registry Agreement with ICANN that was effective on July 1, 2017. The .net Registry Agreement provides that we will continue to be the sole registry operator for domain names in the .net TLD through June 30, 2023.
Root Zone Maintainer Service Agreement
In the fourth quarter of 2016, we entered into a new agreement with ICANN, the Root Zone Maintainer Service Agreement (“RZMA”) under which we perform the Root Zone Maintainer functions on behalf of ICANN. The RZMA will expire on October 19, 2024, with an automatic renewal unless earlier terminated.
The descriptions of the .com Registry Agreement, the Cooperative Agreement, and the .net Registry Agreement are qualified in their entirety by the text of the complete agreements that are incorporated by reference as exhibits in this Form 10-K.
Intellectual Property
We rely on a combination of copyrighted software, trademarks, service marks, patents, trade secrets, know-how, restrictions on disclosure, and other methods to protect our proprietary assets. We also enter into confidentiality and/or invention assignment agreements with our employees, consultants and current and potential affiliates, customers and business partners. We also control access to and distribution of proprietary documentation and other confidential information.
We have been issued numerous patents in the U.S. and abroad, covering a wide range of our technologies. Additionally, we continue to file numerous patent applications with respect to certain of our technologies in the U.S. Patent and Trademark Office and internationally. Patents may not be awarded with respect to these applications and even if such patents are awarded, such patents may not provide sufficient protection of our intellectual property. We continue to focus on growing our patent portfolio and consider opportunities for its strategic use.
We have obtained trademark registrations for the VERISIGN mark and VERISIGN logo in the U.S. and certain countries, and have pending trademark applications for the VERISIGN logo in a number of other countries. We have common law rights in other proprietary names. We take steps to enforce and police Verisign’s trademarks. We rely on the strength of our Verisign brand to help differentiate ourselves in the marketing of our products and services.
Our principal intellectual property consists of, and our success is dependent upon, proprietary software used in our Registry Services business and certain methodologies (many of which are patented or for which patent applications are pending) and technical expertise and proprietary know-how we use in both the design and implementation of our current and future registry services. We own our proprietary Shared Registration System through which registrars submit second-level domain name registrations for each of the registries we operate, as well as the ATLAS distributed lookup system which processes billions of queries per day. Our Security Services business also depends on proprietary intellectual property. Some of the software and protocols used in our business are in the public domain or are otherwise available to our competitors, and some are based on open standards set by organizations such as the Internet Engineering Task Force. To the extent any of our patents are considered “standard essential patents,” we may be required to license such patents to our competitors on reasonable and non-discriminatory terms or otherwise be limited in our ability to assert such patents.
Employees
The following table shows a comparison of our consolidated employee headcount, by function:
| As of December 31, | ||||||||
| 2017 | 2016 | 2015 | ||||||
| Employee headcount by function: | ||||||||
| Cost of revenues | 288 | 324 | 314 | |||||
| Sales and marketing | 133 | 143 | 183 | |||||
| Research and development | 226 | 228 | 253 | |||||
| General and administrative | 305 | 295 | 269 | |||||
| Total | 952 | 990 | 1,019 |
We have never had a work stoppage, and no U.S.-based employees are represented under collective bargaining agreements. Our ability to achieve our financial and operational objectives depends in large part upon our continued ability to attract, integrate, train, retain, and motivate highly qualified sales, technical and managerial personnel, and upon the continued service of our senior management and key sales and technical personnel. Competition for qualified personnel in our industry and in some of our geographical locations is intense, particularly for software development personnel.
Item 1A. RISK FACTORS
In addition to other information in this Form 10-K, the following risk factors should be carefully considered in evaluating us and our business because these factors currently have a significant impact or may have a significant impact on our business, operating results or financial condition. Actual results could differ materially from those projected in the forward-looking statements contained in this Form 10-K as a result of the risk factors discussed below and elsewhere in this Form 10-K and in other filings we make with the SEC.
Risks arising from our agreements governing our Registry Services business could limit our ability to maintain or grow our business.
We are parties to (i) a Cooperative Agreement (as amended) with the DOC with respect to the .com gTLD and (ii) Registry Agreements with ICANN for .com, .net, .name, and other gTLDs including our IDN gTLDs. As substantially all of our revenues are derived from our Registry Services business, limitations and obligations in, or changes or challenges to, these agreements, particularly the agreements that involve .com and .net, could have a material adverse impact on our business. Certain competing registries, such as the ccTLDs, do not face the same limitations or obligations that we face in our agreements.
Modifications or Amendments. In October 2016, the Company and ICANN entered into an amendment to extend the term of the .com Registry Agreement to November 30, 2024 (the “.com Amendment”). As part of the .com Amendment, the Company and ICANN agreed to negotiate in good faith to amend the terms of the .com Registry Agreement: (i) by October 20, 2018, to preserve and enhance the security and stability of the internet or the .com TLD, and (ii) as may be necessary for consistency with changes to, or the termination or expiration of, the Cooperative Agreement. We can provide no assurance that any new terms for the .com Registry Agreement that we agree to as a result of the above obligations will not have a material adverse impact on our business, operating results, financial condition, and cash flows.
The DOC approved the .com Amendment under amendment 34 to the Cooperative Agreement. The DOC did not extend the term of the Cooperative Agreement, which will expire on November 30, 2018, unless the DOC, in its sole discretion, extends the term. Under amendment 34, the DOC has the right to conduct a public interest review for the sole purpose of determining whether the DOC will exercise its right to extend the term of the Cooperative Agreement. In connection with the aforementioned review, we agreed to cooperate fully and to work in good faith to reach a mutual agreement with the DOC to resolve issues identified in such review and to work in good faith to implement any agreed upon changes as of the expiration of the current term of the Cooperative Agreement. We can provide no assurance that any changes that we agree to as a result of the above obligations will not have a material adverse impact on our business, operating results, financial condition, and cash flows.
In addition, our Registry Agreements for new gTLDs, including the Registry Agreements for our IDN gTLDs, include ICANN’s right to amend the agreements without our consent, which could impose unfavorable contract obligations on us that could impact our plans and competitive positions with respect to new gTLDs. At the time of renewal of our .com or .net Registry Agreements, ICANN might also attempt to impose this same unilateral right to amend these registry agreements under certain conditions. ICANN has also included new mandatory obligations on new gTLD registry operators, including us, that may increase the risks and potential liabilities associated with operating new gTLDs. ICANN might seek to impose these new mandatory obligations in our other Registry Agreements under certain conditions. We can provide no assurance that any changes to our Registry Agreements as a result of the above obligations will not have a material adverse impact on our business, operating results, financial condition, and cash flows.
Pricing. Under the terms of the Cooperative Agreement with the DOC and the .com Registry Agreement with ICANN, we are restricted during the term of the Registry Agreement from increasing the price of registrations or renewals of .com domain names above $7.85, except that we are entitled to increase the price up to 7%, with the prior approval of the DOC, due to the imposition of any new ICANN consensus policies, as established and defined under ICANN’s bylaws and due process, and covering certain items listed in the .com Registry Agreement, or documented extraordinary expense resulting from an attack or threat of attack on the security and stability of the DNS. However, it is uncertain that such circumstances will arise, or if they do, whether we would seek, or the DOC would approve, any request to increase the price for .com domain name registrations. We also have the right under the Cooperative Agreement to seek the removal of these pricing restrictions if we demonstrate to the DOC that market conditions no longer warrant such restrictions. However, it is uncertain whether we will seek the removal of such restrictions, or whether the DOC would approve the removal of such restrictions. In comparison, under the terms of the .net and .name Registry Agreements with ICANN, we are permitted to increase the price of domain name registrations and renewals in these TLDs up to 10% per year. Additionally, ICANN’s registry agreements for new gTLDs do not contain such pricing restrictions.
Vertical integration. Under the .com, .net, and .name Registry Agreements with ICANN, as well as the Cooperative Agreement with the DOC, we are not permitted to acquire, directly or indirectly, control of, or a greater than 15% ownership
interest in, any ICANN-accredited registrar. Historically, all gTLD registry operators were subject to this vertical integration prohibition; however, ICANN has established a process whereby registry operators may seek ICANN’s approval to remove this restriction, and ICANN has approved such removal in several instances. If we were to seek removal of the vertical integration restrictions contained in our agreements, it is uncertain whether ICANN and/or DOC approval would be obtained. Additionally, ICANN’s registry agreement for new gTLDs generally permits such vertical integration, with certain limitations including ICANN’s right, but not the obligation, to refer such vertical integration activities to competition authorities. Furthermore, such vertical integration restrictions do not generally apply to ccTLD registry operators. If registry operators of other TLDs, or ccTLDs, are able to obtain competitive advantages through such vertical integration, it could materially harm our business.
Renewal and Termination. Our .com, .net, and .name Registry Agreements with ICANN contain “presumptive” rights of renewal upon the expiration of their current terms on November 30, 2024, June 30, 2023 and August 15, 2018, respectively. The Registry Agreements for our new gTLDs including our IDN gTLDs are subject to a 10-year term and contain similar “presumptive” renewal rights. If certain terms in our .com and .net Registry Agreements are not similar to such terms generally in effect in the registry agreements of the five largest gTLDs, then a renewal of these agreements shall be upon terms reasonably necessary to render such terms similar to the registry agreements for those other gTLDs. There can be no assurance that such terms, if they apply, will not have a material adverse impact on our business. A renewal of the .com Registry Agreement must be approved by the DOC, which, under certain circumstances, could refuse to grant its approval to the renewal of the .com Registry Agreement on similar terms, or at all. A failure (i) by ICANN or the DOC to approve the renewal of the .com Registry Agreement prior to the expiration of its c
Showing the first 8K of 69K characters. Open the full section
Item 1B. UNRESOLVED STAFF COMMENTS
None.
Item 2. PROPERTIES
Our corporate headquarters are located in Reston, Virginia. We have administrative, sales, marketing, research and development and operations facilities located in the U.S., Europe, Asia, and Australia. As of December 31, 2017, we owned approximately 454,000 square feet of space, which includes facilities in Reston and Dulles, Virginia and New Castle, Delaware. As of December 31, 2017, we leased approximately 17,000 square feet of space in Europe, Australia and Asia. These facilities are under lease agreements that expire at various dates through 2022.
We believe that our existing facilities are well maintained and in good operating condition, and are sufficient for our needs for the foreseeable future. The following table lists our major locations and primary use as of December 31, 2017:
| Approximate | |||||
| Major Locations | Square Footage | Use | |||
| United States: | |||||
| Reston, Virginia | 221,000 | Corporate Headquarters | |||
| New Castle, Delaware | 105,000 | Data Center | |||
| Dulles, Virginia | 60,000 | Data Center | |||
| Europe: | |||||
| Fribourg, Switzerland | 10,000 | Data Center and Corporate Services |
The table above does not include approximately 68,000 square feet of space owned by us and leased to third parties.
Item 3. LEGAL PROCEEDINGS
On January 18, 2017, the Company received a Civil Investigative Demand from the Antitrust Division of the United States Department of Justice (“DOJ”) requesting certain material related to the Company becoming the registry operator for the .web gTLD. On January 9, 2018, the DOJ notified the Company that this investigation was closed.
Item 4. MINE SAFETY DISCLOSURES
Not applicable.
EXECUTIVE OFFICERS OF THE REGISTRANT
The following table sets forth information regarding our executive officers as of February 16, 2018:
| Name | Age | Position | |||
| D. James Bidzos | 62 | Executive Chairman, President and Chief Executive Officer | |||
| Todd B. Strubbe | 54 | Executive Vice President, Chief Operating Officer | |||
| George E. Kilguss, III | 57 | Executive Vice President, Chief Financial Officer | |||
| Thomas C. Indelicarto | 54 | Executive Vice President, General Counsel and Secretary |
D. James Bidzos has served as Executive Chairman since August 2009 and President and Chief Executive Officer since August 2011. He served as Executive Chairman and Chief Executive Officer on an interim basis from June 2008 to August 2009 and served as President from June 2008 to January 2009. He served as Chairman of the Board since August 2007 and from April 1995 to December 2001. He served as Vice Chairman of the Board from December 2001 to August 2007. Mr. Bidzos served as a director of VeriSign Japan from March 2008 to August 2010 and served as Representative Director of VeriSign Japan from March 2008 to September 2008. Mr. Bidzos served as Vice Chairman of RSA Security Inc., an Internet identity and access management solution provider, from March 1999 to May 2002, and Executive Vice President from July 1996 to February 1999. Prior thereto, he served as President and Chief Executive Officer of RSA Data Security, Inc. from 1986 to February 1999.
Todd B. Strubbe has served as Chief Operating Officer since April 2015. From September 2009 to April 2015, he served as the President of the Unified Communications Business Segment for West Corporation, a provider of technology-driven communications services. Prior to this, he was a co-founder and Managing Partner of Arbor Capital, LLC. He has also served in executive leadership positions at First Data Corporation and CompuBank, N.A. and as an associate and then as an engagement manager with McKinsey & Company, Inc. He also served for five years as an infantry officer with the United States Army. Mr. Strubbe holds an M.B.A. degree from Harvard Business School and a B.S. degree from the United States Military Academy at West Point.
George E. Kilguss, III has served as Chief Financial Officer since May 2012. From April 2008 to May 2012, he was the Chief Financial Officer of Internap Network Services Corporation, an IT infrastructure solutions company. From December 2003 to December 2007, he served as the Chief Financial Officer of Towerstream Corporation, a company that delivers high speed wireless Internet access to businesses. Mr. Kilguss holds an M.B.A. degree from the University of Chicago’s Graduate School of Business and a B.S. degree in Economics and Finance from the University of Hartford.
Thomas C. Indelicarto has served as General Counsel and Secretary since November 2014. From September 2008 to November 2014, he served as Vice President and Associate General Counsel. From January 2006 to September 2008, he served as Litigation Counsel. Prior to joining the Company, Mr. Indelicarto was in private practice as an associate at Arnold & Porter LLP and Buchanan Ingersoll (now, Buchanan Ingersoll & Rooney, PC). Mr. Indelicarto also served as a U.S. Army officer for nine years. Mr. Indelicarto holds a J.D. degree from the University of Pittsburgh School of Law and a B.S. degree from Indiana University of Pennsylvania.
PART II
Item 5. MARKET FOR REGISTRANT’S COMMON EQUITY, RELATED STOCKHOLDER MATTERS AND ISSUER PURCHASES OF EQUITY SECURITIES
Price Range of Common Stock
Our common stock is traded on the NASDAQ Global Select Market under the symbol “VRSN.” The following table sets forth, for the periods indicated, the high and low sales prices per share for our common stock as reported by the NASDAQ Global Select Market:
| Price Range | ||||||||
| High | Low | |||||||
| Year ended December 31, 2017: | ||||||||
| Fourth Quarter | $ | 118.28 | $ | 106.17 | ||||
| Third Quarter | $ | 106.81 | $ | 92.91 | ||||
| Second Quarter | $ | 94.93 | $ | 87.01 | ||||
| First Quarter | $ | 88.08 | $ | 76.45 | ||||
| Year ended December 31, 2016: | ||||||||
| Fourth Quarter | $ | 86.98 | $ | 74.46 | ||||
| Third Quarter | $ | 87.19 | $ | 74.01 | ||||
| Second Quarter | $ | 91.99 | $ | 80.47 | ||||
| First Quarter | $ | 90.61 | $ | 70.26 |
On February 9, 2018, there were 426 holders of record of our common stock. We cannot estimate the number of beneficial owners since many brokers and other institutions hold our stock on behalf of stockholders. On February 9, 2018, the reported last sale price of our common stock was $109.09 per share as reported by the NASDAQ Global Select Market.
We have not declared or paid any cash dividends on our common stock or any other securities in the last six years. We continually evaluate the overall cash and investing needs of the business and consider the best uses for our cash, including investments in the strengthening of our infrastructure and growth opportunities for our business, as well as potential share repurchases.
For information regarding securities authorized for issuance under our equity compensation plans, see Note 8, “Employee Benefits and Stock-based Compensation,” of our Notes to Consolidated Financial Statements in Item 15 of this Form 10-K.
Share Repurchases
The following table presents the share repurchase activity during the three months ended December 31, 2017:
| Total Number of Shares Purchased | Average Price Paid per Share | Total Number of Shares Purchased as Part of Publicly Announced Plans or Programs | Approximate Dollar Value of Shares That May Yet Be Purchased Under the Plans or Programs (1)(2) | ||||||||||
| (Shares in thousands) | |||||||||||||
| October 1 – 31, 2017 | 468 | $108.28 | 468 | $ | 571.8 | million | |||||||
| November 1 – 30, 2017 | 433 | $111.64 | 433 | $ | 523.5 | million | |||||||
| December 1 – 31, 2017 | 403 | $114.32 | 403 | $ | 477.4 | million | |||||||
| 1,304 | 1,304 |
| (1) | Effective February 9, 2017, our Board authorized the repurchase of approximately $640.9 million of our common stock, in addition to the $359.1 million of our common stock remaining available for repurchase under the previous share repurchase program, for a total repurchase authorization of up to $1.0 billion of our common stock. |
| (2) | Effective February 8, 2018, our Board authorized the repurchase of approximately $585.8 million of our common stock, in addition to the $414.2 million of our common stock remaining available for repurchase under the previous share repurchase program, for a total repurchase authorization of up to $1.0 billion of our common stock. The share repurchase program has no expiration date. Purchases made under the program could be effected through open market transactions, block purchases, accelerated share repurchase agreements or other negotiated transactions. |
Performance Graph
The information contained in the Performance Graph shall not be deemed to be “soliciting material” or “filed” with the SEC or subject to the liabilities of Section 18 of the Exchange Act, except to the extent that we specifically incorporate it by reference into a document filed under the Securities Act of 1933, as amended (the “Securities Act”), or the Exchange Act.
The following graph compares the cumulative total stockholder return on our common stock, the Standard and Poor’s (“S&P”) 500 Index, and the S&P 500 Information Technology Index. The graph assumes that $100 (and the reinvestment of any dividends thereafter) was invested in our common stock, the S&P 500 Index and the S&P 500 Information Technology Index on December 31, 2012, and calculates the return annually through December 31, 2017. The stock price performance on the following graph is not necessarily indicative of future stock price performance.
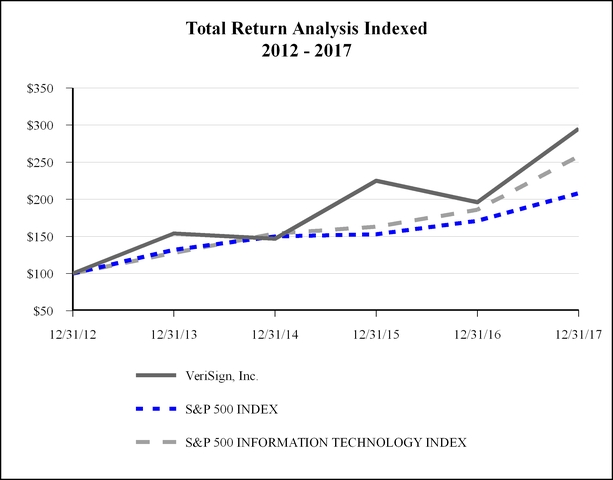
| 12/31/12 | 12/31/13 | 12/31/14 | 12/31/15 | 12/31/16 | 12/31/17 | |||||||||||||
| VeriSign, Inc | $ | 100 | $ | 154 | $ | 147 | $ | 225 | $ | 196 | $ | 295 | ||||||
| S&P 500 Index | $ | 100 | $ | 132 | $ | 150 | $ | 153 | $ | 171 | $ | 208 | ||||||
| S&P 500 Information Technology Index | $ | 100 | $ | 128 | $ | 154 | $ | 163 | $ | 186 | $ | 258 |
Item 6. SELECTED FINANCIAL DATA
The following table sets forth selected financial data as of and for the last five fiscal years. The information set forth below is not necessarily indicative of results of future operations, and should be read in conjunction with Item 7, “Management’s Discussion and Analysis of Financial Condition and Results of Operations,” and our Notes to Consolidated Financial Statements in Item 15 of this Form 10-K, to fully understand factors that may affect the comparability of the information presented below.
Selected Consolidated Statements of Comprehensive Income Data: (in millions, except per share data)
| Year Ended December 31, | |||||||||||||||||||
| 2017 | 2016 | 2015 | 2014 | 2013 (1) | |||||||||||||||
| Revenues | $ | 1,165 | $ | 1,142 | $ | 1,059 | $ | 1,010 | $ | 965 | |||||||||
| Operating income | $ | 708 | $ | 687 | $ | 606 | $ | 564 | $ | 528 | |||||||||
| Income from continuing operations | $ | 457 | $ | 441 | $ | 375 | $ | 355 | $ | 544 | |||||||||
| Income from continuing operations per share: | |||||||||||||||||||
| Basic | $ | 4.56 | $ | 4.12 | $ | 3.29 | $ | 2.80 | $ | 3.77 | |||||||||
| Diluted | $ | 3.68 | $ | 3.42 | $ | 2.82 | $ | 2.52 | $ | 3.49 |
———————
| (1) | Income from continuing operations for 2013 includes a $375.3 million income tax benefit related to a worthless stock deduction, net of valuation allowances, and accrual for uncertain tax positions, partially offset by $167.1 million of income tax expense related to the repatriation of cash held by foreign subsidiaries. |
Consolidated Balance Sheet Data: (in millions)
| As of December 31, | |||||||||||||||||||
| 2017 | 2016 | 2015 | 2014 | 2013 | |||||||||||||||
| Cash, cash equivalents and marketable securities (1) | $ | 2,415 | $ | 1,798 | $ | 1,915 | $ | 1,425 | $ | 1,723 | |||||||||
| Total assets (1) | $ | 2,941 | $ | 2,335 | $ | 2,358 | $ | 1,901 | $ | 2,249 | |||||||||
| Deferred revenues | $ | 999 | $ | 976 | $ | 961 | $ | 890 | $ | 856 | |||||||||
| Subordinated Convertible Debentures, including contingent interest derivative | $ | 628 | $ | 630 | $ | 634 | $ | 621 | $ | 613 | |||||||||
| Long-term debt (1) | $ | 1,783 | $ | 1,237 | $ | 1,235 | $ | 740 | $ | 739 |
——————
| (1) | The increase in Long-term debt from 2016 to 2017 was due to the issuance of $550.0 million aggregate principal amount of 4.75% senior unsecured notes due 2027. The increase in Long-term debt from 2014 to 2015 was due to the issuance of $500.0 million aggregate principal amount of 5.25% senior unsecured notes due 2025. The proceeds from these senior notes issuances resulted in the increase in cash, cash equivalents and marketable securities as well as total assets in the same periods. |
Item 7. MANAGEMENT’S DISCUSSION AND ANALYSIS OF FINANCIAL CONDITION AND RESULTS OF OPERATIONS
FORWARD-LOOKING STATEMENTS
This Report on Form 10-K contains forward-looking statements within the meaning of Section 27A of the Securities Act and Section 21E of the Exchange Act. These forward-looking statements involve risks and uncertainties, including, among other things, statements regarding our anticipated costs and expenses and revenue mix. Forward-looking statements include, among others, those statements including the words “expects,” “anticipates,” “intends,” “believes” and similar language. Our actual results may differ significantly from those projected in the forward-looking statements. Factors that might cause or contribute to such differences include, but are not limited to, those discussed in the section titled “Risk Factors” in Part I, Item 1A of this Form 10-K. You are cautioned not to place undue reliance on the forward-looking statements, which speak only as of the date of this Form 10-K. We undertake no obligation to publicly release any revisions to the forward-looking statements or reflect events or circumstances after the date of this document.
Overview
We are a global provider of domain name registry services and internet security, enabling internet navigation for many of the world’s most recognized domain names and providing protection for websites and enterprises around the world. Our Registry Services ensure the security, stability and resiliency of key internet infrastructure and services, including the .com and .net domains, two of the internet’s root servers, and the operation of the root zone maintainer function for the core of the internet’s DNS. Our product suite also includes Security Services, consisting of DDoS Protection Services, and Managed DNS Services. Revenues from Security Services are not significant in relation to our consolidated revenues. On April 1, 2017, we completed the sale of our iDefense business.
As of December 31, 2017, we had approximately 146.4 million .com and .net registrations in the domain name base. The number of domain names registered is largely driven by continued growth in online advertising, e-commerce, and the number of internet users, which is partially driven by greater availability of internet access, as well as marketing activities carried out by us and third-party registrars. Growth in the number of domain name registrations under our management may be hindered by certain factors, including overall economic conditions, competition from ccTLDs, the introduction of new gTLDs, and ongoing changes in the internet practices and behaviors of consumers and businesses. Factors such as the evolving practices and preferences of internet users, and how they navigate the internet, as well as the motivation of domain name registrants and how they will manage their investment in domain names, can negatively impact our business and the demand for new domain name registrations and renewals.
2017 Business Highlights and Trends
| • | We recorded revenues of $1,165.1 million in 2017, which represents an increase of 2% compared to 2016. |
| • | We recorded operating income of $707.7 million during 2017, which represents an increase of 3% as compared to 2016. |
| • | We finished 2017 with 146.4 million .com and .net registrations in the domain name base, which represents a 3% increase from December 31, 2016. |
| • | The final .com and .net renewal rate for the third quarter of 2017 was 74.4% compared with 73.0% for the same quarter in 2016. Renewal rates are not fully measurable until 45 days after the end of the quarter. |
| • | We repurchased 6.3 million shares of our common stock for an aggregate cost of $592.7 million in 2017. As of December 31, 2017, there was $477.4 million remaining for future share repurchases under the share repurchase program. |
| • | Through February 8, 2018, we repurchased an additional 0.6 million shares for $63.2 million under our share repurchase program. Effective February 8, 2018, our Board authorized the repurchase of approximately $585.8 million of our common stock, in addition to the $414.2 million of our common stock remaining available for repurchase under the previous share repurchase program, for a total repurchase authorization of up to $1.0 billion of our common stock. |
| • | We generated cash flows from operating activities of $702.8 million in 2017, which represents an increase of 1% as compared to 2016. |
| • | On April 1, 2017, we completed the sale of our iDefense business, which resulted in a pre-tax gain of approximately $10.4 million. |
| • | On June 28, 2017, we entered into a renewal of the .net Registry Agreement with ICANN, pursuant to which we will remain the sole registry operator of the .net TLD through June 30, 2023. |
| • | On July 5, 2017, we issued $550.0 million of 4.75% Senior Notes due July 15, 2027. The proceeds are being used for general corporate purposes, including, but not limited to, the repurchase of shares under our share repurchase program. |
| • | We increased the annual fee for a .net domain name registration from $8.20 to $9.02, effective February 1, 2018. |
Critical Accounting Policies and Significant Management Estimates
The discussion and analysis of our financial condition and results of operations are based upon our Consolidated Financial Statements, which have been prepared in accordance with U.S. generally accepted accounting principles. The preparation of these financial statements requires management to make estimates and judgments that affect the reported amounts of assets, liabilities, revenues and expenses, and related disclosures of contingent assets and liabilities. On an ongoing basis, management evaluates those estimates. Management bases its estimates on historical experience and on various assumptions that are believed to be reasonable under the circumstances, the results of which form the basis for making judgments about the carrying values of assets and liabilities that are not readily available from other sources. Actual results may differ from these estimates under different assumptions or conditions.
An accounting estimate is considered critical if the nature of the estimates or assumptions is material due to the levels of subjectivity and judgment involved, and the impact of changes in the estimates and assumptions would have a material effect on the consolidated financial statements. We believe the following critical accounting estimates and policies have the most significant impact on our consolidated financial statements:
Revenue recognition
We generate revenues by providing services over a period of time. Fees for these services are deferred and recognized as performance occurs. The majority of our revenue transactions contain standard business terms and conditions. However, at times, we enter into non-standard arrangements including multiple-element arrangements. As a result, we must evaluate (1) whether an arrangement exists; (2) how the arrangement consideration should be allocated among the deliverables; (3) when to recognize revenue on the deliverables; and (4) whether all elements of the arrangement have been delivered. Our revenue recognition policy also requires an assessment as to whether collection is reasonably assured, which requires us to evaluate the creditworthiness of our customers. As discussed in Note 1, “Description of Business and Summary of Significant Accounting Policies” of our Notes to Consolidated Financial Statements in Item 15 of this Form 10-K, the adoption of the new revenue guidance in Accounting Standards Codification 606 Revenue from Contracts with Customers, is not expected to have a material impact on our revenue recognition when it becomes effective in 2018.
Income taxes
Accounting for income taxes requires significant judgments in the development of estimates used in income tax calculations. Such judgments include, but are not limited to, the likelihood we would realize the benefits of carryforwards from net operating losses (“NOLs”), capital losses, domestic and/or foreign tax credits, the adequacy of valuation allowances, and the rates used to measure transactions with foreign subsidiaries. To the extent recovery of deferred tax assets is not likely, we record a valuation allowance to reduce our deferred tax assets to the amount that is more likely than not to be realized.
Our operations involve dealing with uncertainties and judgments in the application of complex tax regulations in multiple jurisdictions. The final taxes payable are dependent upon many factors, including negotiations with taxing authorities in various jurisdictions and resolution of disputes arising from U.S. federal, state, and international tax audits. We only recognize or continue to only recognize tax positions that are more likely than not to be sustained upon examination. We adjust these amounts in light of changing facts and circumstances; however, due to the complexity of some of these uncertainties, the ultimate resolution may result in a payment that is materially different from our current estimate of the tax liabilities.
Due to the enactment of the Tax Act, we no longer intend to indefinitely reinvest the earnings of our foreign subsidiaries. For further discussion of this change, see Note 10, “Income taxes” of our Notes to Consolidated Financial Statements in Item 15 of this Form 10-K.
Earnings per Share
We use the treasury stock method to calculate the impact of our Subordinated Convertible Debentures on diluted earnings per share. Under this method, only a positive conversion spread related to the Subordinated Convertible Debentures is included in the diluted earnings per share calculations. This is based on our intent and ability to settle the principal amount of the Subordinated Convertible Debentures in cash. A change in our intent and ability would require us to use the if-converted method, which could have a material impact on our diluted earnings per share.
Results of Operations
The following table presents information regarding our results of operations as a percentage of revenues:
| Year Ended December 31, | ||||||||
| 2017 | 2016 | 2015 | ||||||
| Revenues | 100.0 | % | 100.0 | % | 100.0 | % | ||
| Costs and expenses: | ||||||||
| Cost of revenues | 16.6 | 17.4 | 18.2 | |||||
| Sales and marketing | 7.0 | 7.0 | 8.5 | |||||
| Research and development | 4.5 | 5.2 | 6.0 | |||||
| General and administrative | 11.2 | 10.3 | 10.1 | |||||
| Total costs and expenses | 39.3 | 39.9 | 42.8 | |||||
| Operating income | 60.7 | 60.1 | 57.2 | |||||
| Interest expense | (11.7 | ) | (10.1 | ) | (10.2 | ) | ||
| Non-operating income (loss), net | 2.4 | 0.9 | (1.0 | ) | ||||
| Income before income taxes | 51.4 | 50.9 | 46.0 | |||||
| Income tax expense | (12.2 | ) | (12.3 | ) | (10.6 | ) | ||
| Net income | 39.2 | % | 38.6 | % | 35.4 | % |
Revenues
Revenues related to our Registry Services are primarily derived from registrations for domain names in the .com and .net domain name registries. We also derive revenues from operating domain name registries for several other TLDs and from providing back-end registry services to a number of TLD registry operators, all of which are not significant in relation to our consolidated revenues. For domain names registered with the .com and .net registries we receive a fee from registrars per annual registration that is fixed pursuant to our agreements with ICANN. Individual customers, called registrants, contract directly with registrars or their resellers, and the registrars in turn register the domain names with Verisign. Changes in revenues are driven largely by changes in the number of new domain name registrations and the renewal rate for existing registrations as well as the impact of new and prior price increases, to the extent permitted by ICANN and the DOC. New registrations and the renewal rate for existing registrations are impacted by continued growth in online advertising, e-commerce, and the number of internet users, as well as marketing activities carried out by us and our registrar customers. We increased the annual fee for a .net domain name registration from $6.79 to $7.46 on February 1, 2016, from $7.46 to $8.20 on February 1, 2017, and from $8.20 to $9.02 on February 1, 2018. We have the contractual right to increase the fees for .net domain name registrations by up to 10% each year during the term of our agreement with ICANN, through June 30, 2023. The annual fee for a .com domain name registration is $7.85 for the duration of the current .com Registry Agreement through November 30, 2024, except that prices may be raised by up to 7% each year due to the imposition of any new Consensus Policy or documented extraordinary expense resulting from an attack or threat of attack on the Security and Stability (each as defined in the .com Registry Agreement) of the DNS, subject to approval of the DOC. We offer promotional marketing programs for our registrars based upon market conditions and the business environment in which the registrars operate. All fees paid to us for .com and .net registrations are in U.S. dollars. Revenues from Security Services are not significant in relation to our total consolidated revenues.
A comparison of revenues is presented below:
| Year Ended December 31, | ||||||||||||||||||
| 2017 | % Change | 2016 | % Change | 2015 | ||||||||||||||
| (Dollars in thousands) | ||||||||||||||||||
| Revenues | $ | 1,165,095 | 2 | % | $ | 1,142,167 | 8 | % | $ | 1,059,366 |
The following table compares the domain name base for .com and .net managed by our Registry Services business:
| As of December 31, | ||||||||||||
| 2017 | % Change | 2016 | % Change | 2015 | ||||||||
| Domain name base for .com and .net | 146.4 million | 3 | % | 142.2 million | 2 | % | 139.8 million |
2017 compared to 2016: Revenues increased by $22.9 million, primarily due to a 4% increase in the domain name base for .com and increases in the .net domain name registration fees in February 2016 and 2017, partially offset by a 5% decline in the domain name base for .net. Additionally, 2016 revenue was elevated due to an increased volume of new domain name registrations primarily from our registrars in China during the second half of 2015 and the first quarter of 2016. The volume of these new registrations was inconsistent and episodic compared to prior periods, and by the end of the first quarter of 2016, reverted back to a more normalized registration pace. A significant portion of these registrations did not renew upon expiration.
2016 compared to 2015: Revenues increased by $82.8 million, primarily due to an increase in the average number of domain names ending in .com and .net and increases in the .net domain name registration fees in February 2015 and 2016. The increase in the average number of domain names ending in .com and .net was significantly impacted by the elevated volume of registrations from our registrars in China discussed above.
Growth in the domain name base has been primarily driven by continued internet growth and marketing activities carried out by us and our registrars. Competitive pressure from ccTLDs, the introduction of new gTLDs, ongoing changes in internet practices and behaviors of consumers and business, as well as the motivation of existing domain name registrants and how they will manage their investment in domain names, and historical global economic uncertainty, have limited the rate of growth of the domain name base in recent years and may continue to do so in 2018 and beyond. We expect revenues will continue to grow in 2018, as a result of the increased volume of domain registrations in 2017, continued growth in the domain name base in 2018, and increases in the .net domain name registration fees in February 2017 and 2018.
Geographic revenues
We generate revenue in the U.S.; Europe, the Middle East and Africa (“EMEA”); China; and certain other countries, including Canada, Australia and Japan.
The following table presents a comparison of the Company’s geographic revenues:
| Year Ended December 31, | |||||||||||||||||
| 2017 | % Change | 2016 | % Change | 2015 | |||||||||||||
| (Dollars in thousands) | |||||||||||||||||
| U.S | $ | 694,759 | 4 | % | $ | 667,301 | 4 | % | $ | 639,170 | |||||||
| EMEA | 211,349 | 2 | % | 207,474 | 7 | % | 193,623 | ||||||||||
| China | 106,526 | (16 | )% | 127,298 | 53 | % | 83,456 | ||||||||||
| Other | 152,461 | 9 | % | 140,094 | (2 | )% | 143,117 | ||||||||||
| Total revenues | $ | 1,165,095 | 2 | % | $ | 1,142,167 | 8 | % | $ | 1,059,366 |
Revenues for our Registry Services business are attributed to the country of domicile and the respective regions in which our registrars are located, however, this may differ from the regions where the registrars operate or where registrants are located. Revenue growth for each region may be impacted by registrars reincorporating, relocating, or from acquisitions or changes in affiliations of resellers. Revenue growth for each region may also be impacted by registrars domiciled in one region, registering domain names in another region. These factors impacted revenues in China and the Other region during 2017. Additionally, while revenues grew in the U.S., EMEA and Other regions during 2017, revenues from China decreased. Revenues from China in 2016 benefited from the increased volume of registrations in the second half of 2015 and the first quarter of 2016, as discussed earlier. However, a significant portion of those registrations did not renew, resulting in the decline in revenues from China in 2017.
Cost of revenues
Cost of revenues consist primarily of salaries and employee benefits expenses for our personnel who manage the operational systems, depreciation expenses, operational costs associated with the delivery of our services, fees paid to ICANN, customer support and training, consulting and development services, costs of facilities and computer equipment used in these activities, telecommunications expense and allocations of indirect costs such as corporate overhead.
A comparison of cost of revenues is presented below:
| Year Ended December 31, | |||||||||||||||||
| 2017 | % Change | 2016 | % Change | 2015 | |||||||||||||
| (Dollars in thousands) | |||||||||||||||||
| Cost of revenues | $ | 193,326 | (2 | )% | $ | 198,242 | 3 | % | $ | 192,788 |
2017 compared to 2016: Cost of revenues decreased by $4.9 million, primarily due to decreases in depreciation expenses and salary and employee benefits expenses, partially offset by an increase in telecommunications expenses. Depreciation expenses decreased by $5.3 million as a result of lower average hardware purchases over the last several years. Salary and employee benefits expenses decreased by $3.1 million, primarily due to a reduction in average headcount related to the sale of the iDefense business in April 2017, partially offset by increases in salary and employee benefits expenses for the remaining employee base. Telecommunications expenses increased by $3.2 million as a result of an increase in network costs supporting our operations.
2016 compared to 2015: Cost of revenues increased by $5.5 million, primarily due to increases in salary and employee benefits expenses, and allocated overhead expenses, partially offset by a decrease in telecommunications expenses. Salary and employee benefits expenses increased by $6.0 million, primarily due to an increase in average headcount and an increase in bonus expenses. Allocated overhead expenses increased by $1.5 million as a result of an increase in average headcount compared to other cost types. Telecommunications expenses decreased by $1.9 million, primarily due to savings on renewals of colocation agreements.
We expect cost of revenues as a percentage of revenues to decrease slightly in 2018 as compared to 2017 as revenue is expected to grow faster than direct costs.
Sales and marketing
Sales and marketing expenses consist primarily of salaries, sales commissions, sales operations and other personnel-related expenses, travel and related expenses, trade shows, costs of lead generation, costs of computer and communications equipment and support services, facilities costs, consulting fees, costs of marketing programs, such as online, television, radio, print and direct mail advertising costs, and allocations of indirect costs such as corporate overhead.
A comparison of sales and marketing expenses is presented below:
| Year Ended December 31, | |||||||||||||||||
| 2017 | % Change | 2016 | % Change | 2015 | |||||||||||||
| (Dollars in thousands) | |||||||||||||||||
| Sales and marketing | $ | 81,951 | 2 | % | $ | 80,250 | (11 | )% | $ | 90,184 |
2017 compared to 2016: Sales and marketing expenses increased by $1.7 million, primarily due to an increase in advertising and marketing expenses, partially offset by a decrease in salary and employee benefits expenses. Advertising and marketing expenses increased by $7.0 million, primarily due to increases in costs related to certain marketing campaigns supporting our Registry Services business. Salary and employee benefits expenses decreased by $4.2 million due to a reduction in average headcount.
2016 compared to 2015: Sales and marketing expenses decreased by $9.9 million, primarily due to decreases in advertising and consulting expenses, salary and employee benefits expenses, stock-based compensation expenses, and allocated overhead expenses. Advertising and consulting expenses decreased by $3.7 million, primarily due to a decrease in marketing activities and advertising agency costs. Salary and employee benefits expenses, including stock-based compensation expenses, decreased by $2.9 million due to a reduction in average headcount. Allocated overhead expenses decreased by $1.4 million due to the decrease in average headcount relative to other cost types.
We expect sales and marketing expenses as a percentage of revenues to remain consistent in 2018 as compared to 2017.
Research and development
Research and development expenses consist primarily of costs related to research and development personnel, including salaries and other personnel-related expenses, consulting fees, facilities costs, computer and communications equipment, support services used in our service and technology development, and allocations of indirect costs such as corporate overhead.
A comparison of research and development expenses is presented below:
| Year Ended December 31, | |||||||||||||||||
| 2017 | % Change | 2016 | % Change | 2015 | |||||||||||||
| (Dollars in thousands) | |||||||||||||||||
| Research and development | $ | 52,342 | (11 | )% | $ | 59,100 | (7 | )% | $ | 63,718 |
2017 compared to 2016: Research and development expenses decreased by $6.8 million, primarily due to a decrease in salary and employee benefits expenses as a result of a reduction in average headcount.
2016 compared to 2015: Research and development expenses decreased by $4.6 million, primarily due to decreases in salary and employee benefits expenses, and allocated overhead costs, partially offset by a decrease in capitalized labor. Salary and employee benefits expenses, allocated overhead expenses, and capitalized labor decreased by $2.4 million, $1.7 million, and $1.5 million, respectively, due to a reduction in average headcount.
We expect research and development expenses as a percentage of revenues to remain consistent in 2018 as compared to 2017.
General and administrative
General and administrative expenses consist primarily of salaries and other personnel-related expenses for our executive, administrative, legal, finance, information technology and human resources personnel, costs of facilities, computer and communications equipment, management information systems, support services, professional services fees, certain tax and license fees, and bad debt expense, offset by allocations of indirect costs such as facilities and shared services expenses to other cost types.
A comparison of general and administrative expenses is presented below:
| Year Ended December 31, | |||||||||||||||||
| 2017 | % Change | 2016 | % Change | 2015 | |||||||||||||
| (Dollars in thousands) | |||||||||||||||||
| General and administrative | $ | 129,754 | 10 | % | $ | 118,003 | 11 | % | $ | 106,730 |
2017 compared to 2016: General and administrative expenses increased by $11.8 million, primarily due to increases in salary and employee benefits expenses, including stock-based compensation expenses, legal expenses, and a decrease in overhead expenses allocated to other cost types, partially offset by a decrease in depreciation expenses. Salary and employee benefits expenses, including stock-based compensation expenses, increased by $4.9 million due to an increase in average headcount and higher projected achievement levels on certain performance-based restricted stock units (“RSU”) grants. Legal expenses increased by $4.5 million primarily due to higher external legal fees. Overhead expenses allocated to other cost types decreased by $2.5 million due to an increase in the average headcount relative other cost types. Depreciation expenses decreased by $2.8 million as a result of a decrease in capital expenditures in recent years.
2016 compared to 2015: General and administrative expenses increased by $11.3 million, primarily due to increases in salary and employee benefits expenses, stock-based compensation expenses, legal expenses, and a decrease in overhead expenses allocated to other cost types, partially offset by a decrease in depreciation expenses and certain non-income related taxes. Salary and employee benefits expenses increased by $8.0 million due to increases in bonus expenses and average headcount. Stock based compensation expenses increased by $4.5 million due to increases in the total value of RSUs granted in 2015 and 2016 and higher projected achievement levels on certain performance-based RSU grants. Legal expenses increased by $2.6 million primarily due to an increase in services performed by external legal counsel. Overhead expenses allocated to other cost types decreased by $1.6 million due to lower average headcount for other cost types. Depreciation expenses decreased by $2.6 million as a result of a decrease in capital expenditures in recent years. We incurred $2.1 million of certain non-income taxes in 2015, which did not recur in 2016.
We expect general and administrative expenses as a percentage of revenues to remain consistent in 2018 as compared to 2017.
Interest expense
See Note 4, “Debt and interest expense” of our Notes to Consolidated Financial Statements in Item 15 of this Form 10-K. We expect interest expense to decrease in 2018 as compared to 2017 due to a decrease in interest expense related to the Subordinated Convertible Debentures as we notified holders that the Subordinated Convertible Debentures will be redeemed on May 1, 2018, partially offset by an increase related to the senior notes issued in July 2017.
Non-operating income (loss), net
See Note 9, “Non-operating income (loss), net” of our Notes to Consolidated Financial Statements in Item 15 of this Form 10-K.
Income tax expense
| Year Ended December 31, | |||||||||||
| 2017 | 2016 | 2015 | |||||||||
| (Dollars in thousands) | |||||||||||
| Income tax expense | $ | 141,764 | $ | 140,528 | $ | 112,414 | |||||
| Effective tax rate | 24 | % | 24 | % | 23 | % |
Our effective tax rate for each year presented was lower than the statutory federal rate of 35% primarily due to benefits from foreign income taxed at lower rates, partially offset by state income taxes. Our effective tax rate for 2017 was also impacted by the changes arising out of the enactment of the Tax Act in December 2017.
Due to the change in tax law, we will owe U.S. federal taxes on our accumulated and future foreign earnings and as a result we no longer intend to indefinitely reinvest our foreign earnings. Our 2017 income tax expense includes a provisional $162.4 million of expense related to the U.S. tax on accumulated foreign earnings and a provisional $33.6 million deferred tax expense for foreign withholding tax on unremitted foreign earnings, both net of related, previously unrecognized foreign tax credits. These tax expenses are offset by a tax benefit of $186.8 million related to the remeasurement of our net deferred tax liabilities at the new U.S. federal corporate tax rate of 21% which became effective on January 1, 2018. We expect our effective tax rate to decrease slightly in 2018 as a result of the impact of the Tax Act. For further discussion of the Tax Act, see Note 10, “Income taxes” of our Notes to Consolidated Financial Statements in Item 15 of this Form 10-K.
As of December 31, 2017, we had deferred tax assets arising from deductible temporary differences, tax losses, and tax credits of $202.6 million, net of valuation allowances, but before the offset of certain deferred tax liabilities. With the exception of deferred tax assets related to capital loss and certain state NOL carryforwards, we believe it is more likely than not that the tax effects of the deferred tax liabilities, together with future taxable income, will be sufficient to fully recover the remaining deferred tax assets. Our deferred tax assets related to NOL carryforwards increased in 2017 due to the adoption of ASU No. 2016-09, Improvements to Employee Share-Based Payment Accounting, and the resulting recognition of $35.4 million of previously unrecognized excess tax benefits from stock-based compensation. Total deferred tax assets decreased in 2017 due to the usage of tax credit carryforwards to offset 2017 taxable income and the remeasurement of deferred tax assets due to the reduction in the U.S. corporate tax rate.
We qualify for a tax holiday in Switzerland which does not expire, unless the required non-Swiss income and expense thresholds are no longer met, or there is a law change which eliminates the holiday. The tax holiday provides reduced rates of taxation on certain types of income and also requires certain thresholds of foreign source income. The tax holiday increased the Company’s earnings per share by $0.10, $0.16, and $0.14 in 2017, 2016, and 2015, respectively.
Liquidity and Capital Resources
| As of December 31, | |||||||
| 2017 | 2016 | ||||||
| (In thousands) | |||||||
| Cash and cash equivalents | $ | 465,851 | $ | 231,945 | |||
| Marketable securities | 1,948,900 | 1,565,962 | |||||
| Total | $ | 2,414,751 | $ | 1,797,907 |
As of December 31, 2017, our principal source of liquidity was $465.9 million of cash and cash equivalents and $1.9 billion of marketable securities. The marketable securities consist primarily of debt securities issued by the U.S. Treasury meeting the criteria of our investment policy, which is focused on the preservation of our capital through investment in investment grade securities. The cash equivalents consist mainly of amounts invested in money market funds and U.S. Treasury bills purchased with original maturities of less than 90 days. As of December 31, 2017, all of our debt securities have contractual maturities of less than one year. Our cash and cash equivalents are readily accessible. For additional information on our investment portfolio, see Note 2, “Fair Value of Financial Instruments,” of our Notes to Consolidated Financial Statements in Item 15 of this Form 10-K.
As of December 31, 2017, the amount of cash and cash equivalents and marketable securities held by foreign subsidiaries was $1.7 billion. As a result of the recent changes in U.S. tax laws, we no longer intend to indefinitely reinvest these funds outside of the U.S. and accordingly, we recognized a provisional income tax expense of $162.4 million related to the U.S. tax on our accumulated foreign earnings and a provisional $33.6 million related to withholding taxes on unremitted foreign earnings. By early second quarter of 2018, we intend to repatriate approximately $1.1 billion of cash held by foreign subsidiaries, net of withholding taxes, based on current exchange rates.
In 2017, we repurchased 6.3 million shares of our common stock at an average stock price of $94.59 for an aggregate cost of $592.7 million under our share repurchase program. In 2016, we repurchased 7.8 million shares of our common stock at an average stock price of $81.73 for an aggregate cost of $636.5 million. In 2015, we repurchased 9.3 million shares of our common stock at an average stock price of $66.59 for an aggregate cost of $621.9 million. On February 8, 2018, our Board authorized the repurchase of approximately $585.8 million of our common stock, in addition to the $414.2 million of our common stock remaining available for repurchase under the previous share repurchase program, for a total repurchase authorization of up to $1.0 billion of our common stock.
On July 5, 2017, we issued $550.0 million of 4.75% senior unsecured notes due July 15, 2027. The proceeds are being used for general corporate purposes, including, but not limited to, the repurchase of shares under our share repurchase program. As of December 31, 2017, we also had $500.0 million principal amount outstanding of the 5.25% senior unsecured notes due 2025 and $750.0 million principal amount outstanding of the 4.625% senior unsecured notes due 2023.
As of December 31, 2017, we have a $200.0 million unsecured revolving credit facility with no borrowings outstanding. This facility will expire in 2020.
As of December 31, 2017, we had $1.25 billion principal amount outstanding of our Subordinated Convertible Debentures. The price of our common stock exceeded the conversion price threshold trigger during the fourth quarter of 2017. Accordingly, the Subordinated Convertible Debentures are convertible at the option of each holder through March 31, 2018.
We have historically derived significant tax savings from the Subordinated Convertible Debentures as the interest deduction for tax purposes has exceeded the cash interest paid due to the structure of the debentures and the related tax laws. During 2017 and 2016, the interest deduction, for income tax purposes, related to our Subordinated Convertible Debentures, was $191.5 million and $183.7 million, respectively, compared to cash interest paid, including contingent interest, of $55.9 million and $54.0 million in 2017 and 2016, respectively. The size of the interest deduction for tax purposes resulted in a tax benefit that exceeded the cash interest paid for the debentures in each of these years. However, as a result of the enactment of the Tax Act, which includes limits on interest deductibility and a lower U.S. federal income tax rate, these tax savings are expected to diminish in the future. Due to the diminished tax savings and several other factors, on February 15, 2018 we called for the redemption of all the outstanding Subordinated Convertible Debentures, with a redemption date of May 1, 2018. If holders elect to convert their debentures, we will settle the $1.25 billion principal amount in cash and settle the remaining value through the issuance of shares of Verisign’s common stock. Based on the if-converted value of the Subordinated Convertible Debentures as of December 31, 2017, the conversion spread would have required us to issue up to 25.4 million shares of common stock.
We believe existing cash, cash equivalents and marketable securities, and funds generated from operations, together with our ability to arrange for additional financing should be sufficient to meet our working capital, capital expenditure requirements, and to service our debt for the next 12 months. We regularly assess our cash management approach and activities in view of our current and potential future needs.
In summary, our cash flows for 2017, 2016, and 2015 were as follows:
| Year Ended December 31, | |||||||||||
| 2017 | 2016 | 2015 | |||||||||
| (In thousands) | |||||||||||
| Net cash provided by operating activities | $ | 702,761 | $ | 693,007 | $ | 669,946 | |||||
| Net cash used in investing activities | (405,076 | ) | (40,399 | ) | (496,899 | ) | |||||
| Net cash used in financing activities | (65,073 | ) | (648,821 | ) | (136,242 | ) | |||||
| Effect of exchange rate changes on cash and cash equivalents | 1,294 | (501 | ) | 246 | |||||||
| Net increase in cash and cash equivalents | $ | 233,906 | $ | 3,286 | $ | 37,051 |
Net cash provided by operating activities
Our largest source of operating cash flows is cash collections from our customers. Our primary uses of cash from operating activities are for personnel related expenditures, and other general operating expenses, as well as payments related to taxes, interest and facilities.
2017 compared to 2016: Cash provided by operating activities increased primarily due to increases in cash received from customers and an increase in interest income, partially offset by increases in cash paid to suppliers and employees, cash paid for income taxes, and cash paid for interest on our debt obligations. Cash received from customers increased primarily due to higher .com domain name registrations and renewals and the increase in .net domain name registration fees in February 2017. Cash received from interest income increased due to increases in interest rates and our investments in debt securities. Cash paid to suppliers and employees increased primarily due to timing of certain vendor payments. Cash paid for income taxes increased due to higher non-U.S. income tax payments. Cash paid for interest increased due to higher contingent interest related to the Subordinated Convertible Debentures.
2016 compared to 2015: Cash provided by operating activities increased primarily due to an increase in cash received from customers and a decrease in cash paid for income taxes, partially offset by an increase in cash paid for interest. Cash received from customers increased primarily due to an increase in the number of domain name registration renewals and the increase in .net domain name registration fees in February 2016. Cash paid for income taxes decreased primarily due to income tax payments in 2015 related to the reorganization of certain international operations. Cash paid for interest increased due to the interest paid on the $500.0 million senior notes issued on March 2015, and higher contingent interest related to the Subordinated Convertible Debentures.
Net cash used in investing activities
The changes in cash flows from investing activities primarily relate to purchases, maturities and sales of marketable securities, and purchases of property and equipment and rights to intangible assets.
2017 compared to 2016: The increase in cash used in investing activities was primarily due to an increase in purchases of marketable securities, net of sales and maturities, and an increase in purchases of property and equipment, partially offset by the payments made in 2016 for the future assignment of the rights to the .web gTLD, and an increase in other investing activities including the proceeds received from the sale of our iDefense business.
2016 compared to 2015: The decrease in cash used in investing activities was primarily due to an increase in sales and maturities of marketable securities, net of purchases, and a decrease in purchases of property and equipment and other investing activities, partially offset by the payments made for the future assignment of the rights to the .web gTLD.
Net cash used in financing activities
The changes in cash flows from financing activities primarily relate to share repurchases, proceeds from and repayment of borrowings, and our employee stock purchase plan (“ESPP”).
2017 compared to 2016: The decrease in net cash used in financing activities was primarily due to the proceeds received from the issuance of the 4.75% senior notes due 2027 in the third quarter of 2017, net of issuance costs, and a decrease in share repurchases.
2016 compared to 2015: The increase in net cash used in financing activities was primarily due to an increase in share repurchases, and proceeds from the issuance of senior notes in March 2015.
Impact of Inflation
We do not believe that inflation has had a significant impact on our operations in any of the periods presented.
Income taxes
As a result of the enactment of the Tax Act in December 2017, we will owe U.S. income tax on our foreign earnings and as a result, we no longer intend to indefinitely reinvest our foreign earnings. We expect the amount of cash paid for income taxes in 2018 to increase due to the foreign withholding taxes that will be paid related to funds repatriated to the U.S. and other impacts of the Tax Act.
Property and Equipment Expenditures
Our planned property and equipment expenditures for 2018 are anticipated to be between $45.0 million and $55.0 million and will primarily be focused on infrastructure upgrades and enhancements to our product portfolio.
Contractual Obligations
See Note 11, “Commitments and Contingencies,” Purchase Obligations and Contractual Agreements, of our Notes to Consolidated Financial Statements in Item 15 of this Form 10-K.
Off-Balance Sheet Arrangements
It is not our business practice to enter into off-balance sheet arrangements. As of December 31, 2017, we did not have any significant off-balance sheet arrangements. See Note 11, “Commitments and Contingencies,” Off-Balance Sheet Arrangements, of our Notes to Consolidated Financial Statements in Item 15 of this Form 10-K for further information regarding off-balance sheet arrangements.
Dilution from RSUs
Grants of stock-based awards are key components of the compensation packages we provide to attract and retain certain of our talented employees and align their interests with the interests of existing stockholders. We recognize that these stock-based awards dilute existing stockholders and have sought to control the number granted while providing competitive compensation packages. As of December 31, 2017, there are a total of 1.6 million unvested RSUs which represent potential dilution of 1.6%. This maximum potential dilution will only result if all outstanding RSUs vest and are settled. In recent years, our stock repurchase program has more than offset the dilutive effect of RSU grants to employees; however, we may reduce the level of our stock repurchases in the future as we may use our available cash for other purposes.
Item 7A. QUANTITATIVE AND QUALITATIVE DISCLOSURES ABOUT MARKET RISK
We are exposed to financial market risks, including changes in interest rates, foreign exchange rates and market risks. We have not entered into any market risk sensitive instruments for trading purposes.
Interest rate sensitivity
The fixed income securities in our investment portfolio are subject to interest rate risk. As of December 31, 2017, we had $2.2 billion of fixed income securities, which consisted of U.S. Treasury bills with maturities of less than one year. A hypothetical change in interest rates by 100 basis points would not have a significant impact on the fair value of our investments.
Foreign exchange risk management
We conduct business in several countries and transact in multiple foreign currencies. The functional currency for all of our international subsidiaries is the U.S. Dollar. Our foreign currency risk management program is designed to mitigate foreign exchange risks associated with monetary assets and liabilities of our operations that are denominated in currencies other than the U.S. dollar. The primary objective of this program is to minimize the gains and losses to income resulting from fluctuations in exchange rates. We may choose not to hedge certain foreign exchange exposures due to immateriality, prohibitive economic cost of hedging particular exposures, and limited availability of appropriate hedging instruments. We do not enter into foreign currency transactions for trading or speculative purposes, nor do we hedge foreign currency exposures in a manner that entirely offsets the effects of changes in exchange rates. The program may entail the use of forward or option contracts, which are usually placed and adjusted monthly. These foreign currency forward contracts are derivatives and are recorded at fair market value. We attempt to limit our exposure to credit risk by executing foreign exchange contracts with financial institutions that have investment grade ratings.
As of December 31, 2017, we held foreign currency forward contracts in notional amounts totaling $29.7 million to mitigate the impact of exchange rate fluctuations associated with certain foreign currencies. Gains or losses on the foreign currency forward contracts would be largely offset by the remeasurement of our foreign currency denominated assets and liabilities, resulting in an insignificant net impact to income.
A hypothetical uniform 10% strengthening or weakening in the value of the U.S. dollar relative to the foreign currencies in which our revenues and expenses are denominated would not result in a significant impact to our financial statements.
Market risk management
The fair market values of our Subordinated Convertible Debentures and the senior notes are subject to interest rate risk. Generally, the fair market value of fixed interest rate debt will increase as interest rates fall and decrease as interest rates rise. The Subordinated Convertible Debentures are subject to market risk due to the convertible feature of the debentures. The fair market value will increase as the market price of our common stock increases, and decrease as the market price of our common stock falls. As of December 31, 2017, the fair value of the Subordinated Convertible Debentures was approximately $4.2 billion and the fair values of the senior notes issued in 2013, the senior notes issued in 2015, and the senior notes issued in 2017 were $772.9 million, $544.4 million, and $563.7 million, respectively, based on available market information from public data sources.
Item 8. FINANCIAL STATEMENTS AND SUPPLEMENTARY DATA
Financial Statements
Verisign’s financial statements required by this Item are set forth as a separate section of this Form 10-K. See Item 15 for a listing of financial statements provided in the section titled “Financial Statements.”
Supplementary Data (Unaudited)
The following tables set forth unaudited supplementary quarterly financial data for the two year period ended December 31, 2017. In management’s opinion, the unaudited data has been prepared on the same basis as the audited information and includes all adjustments (consisting only of normal recurring adjustments) necessary for a fair presentation of the data for the periods presented.
| 2017 | |||||||||||||||||||
| Quarter Ended | Year Ended | ||||||||||||||||||
| March 31 | June 30 (2) | September 30 | December 31 | December 31, | |||||||||||||||
| (In thousands, except per share data) | |||||||||||||||||||
| Revenues | $ | 288,614 | $ | 288,552 | $ | 292,428 | $ | 295,501 | $ | 1,165,095 | |||||||||
| Gross Profit | $ | 237,945 | $ | 240,908 | $ | 245,095 | $ | 247,821 | $ | 971,769 | |||||||||
| Operating Income | $ | 175,271 | $ | 174,960 | $ | 181,059 | $ | 176,432 | $ | 707,722 | |||||||||
| Net income | $ | 116,412 | $ | 123,100 | $ | 114,899 | $ | 102,837 | $ | 457,248 | |||||||||
| Earnings per share: | |||||||||||||||||||
| Basic | $ | 1.14 | $ | 1.22 | $ | 1.15 | $ | 1.05 | $ | 4.56 | |||||||||
| Diluted (1) | $ | 0.94 | $ | 0.99 | $ | 0.93 | $ | 0.83 | $ | 3.68 |
——————
| (1) | Earnings per share for the year is computed independently and may not equal the sum of the quarterly earnings per share. |
| (2) | Results for the quarter ended June 30, 2017 include a $10.6 million pre-tax gain recognized on the sale of the iDefense business. |
| 2016 | |||||||||||||||||||
| Quarter Ended | Year Ended | ||||||||||||||||||
| March 31 | June 30 | September 30 | December 31 | December 31, | |||||||||||||||
| (In thousands, except per share data) | |||||||||||||||||||
| Revenues | $ | 281,876 | $ | 286,466 | $ | 287,554 | $ | 286,271 | $ | 1,142,167 | |||||||||
| Gross Profit | $ | 231,294 | $ | 237,713 | $ | 237,747 | $ | 237,171 | $ | 943,925 | |||||||||
| Operating Income | $ | 166,767 | $ | 176,267 | $ | 174,776 | $ | 168,762 | $ | 686,572 | |||||||||
| Net income | $ | 107,456 | $ | 113,210 | $ | 114,427 | $ | 105,552 | $ | 440,645 | |||||||||
| Earnings per share: | |||||||||||||||||||
| Basic | $ | 0.98 | $ | 1.05 | $ | 1.08 | $ | 1.01 | $ | 4.12 | |||||||||
| Diluted (1) | $ | 0.82 | $ | 0.87 | $ | 0.90 | $ | 0.84 | $ | 3.42 |
——————
| (1) | Earnings per share for the year is computed independently and may not equal the sum of the quarterly earnings per share. |
Our quarterly revenues and operating results are difficult to forecast. Therefore, we believe that period-to-period comparisons of our operating results will not necessarily be meaningful, and should not be relied upon as an indication of future performance. Also, operating results may fall below our expectations and the expectations of securities analysts or investors in one or more future quarters. If this were to occur, the market price of our common stock would likely decline.
Item 9. CHANGES IN AND DISAGREEMENTS WITH ACCOUNTANTS ON ACCOUNTING AND FINANCIAL DISCLOSURE
Not applicable.
Item 9A. CONTROLS AND PROCEDURES
a. Evaluation of Disclosure Controls and Procedures
Based on our management’s evaluation, with the participation of our Chief Executive Officer (our principal executive officer) and our Chief Financial Officer (our principal financial officer), as of December 31, 2017, our principal executive officer and principal financial officer have concluded that our disclosure controls and procedures (as defined in Rules 13a-15(e) and 15d-15(e) under the Securities Exchange Act of 1934, as amended, (the “Exchange Act”)) are effective to ensure that information required to be disclosed by us in reports that we file or submit under the Exchange Act is recorded, processed, summarized and reported within the time periods specified in SEC rules and forms and is accumulated and communicated to our management, including our principal executive officer and principal financial officer, as appropriate to allow timely decisions regarding required disclosure.
b. Management’s Report on Internal Control over Financial Reporting
Our management is responsible for establishing and maintaining adequate internal control over financial reporting as defined in Rules 13a-15(f) and 15d-15(f) under the Exchange Act. Under the supervision and with the participation of our management, including our Chief Executive Officer and Chief Financial Officer, we conducted an evaluation of the effectiveness of our internal control over financial reporting as of December 31, 2017 using the criteria established in Internal Control-Integrated Framework (2013 Framework) issued by the Committee of Sponsoring Organizations of the Treadway Commission (“COSO”).
Based on our evaluation under the COSO framework, management has concluded that our internal control over financial reporting is effective to provide reasonable assurance regarding the reliability of financial reporting and the preparation of financial statements for external purposes in accordance with generally accepted accounting principles.
KPMG LLP, an independent registered public accounting firm, has issued a report concerning the effectiveness of our internal control over financial reporting as of December 31, 2017. See “Report of Independent Registered Public Accounting Firm” in Item 15 of this Form 10-K.
c. Changes in Internal Control over Financial Reporting
There was no change in our internal control over financial reporting (as such term is defined in Rules 13a-15(f) and 15d-15(f) under the Exchange Act) during the three months ended December 31, 2017 that has materially affected, or is reasonably likely to materially affect, the Company’s internal control over financial reporting.
d. Inherent Limitations of Disclosure Controls and Internal Control over Financial Reporting
Because of their inherent limitations, our disclosure controls and procedures and our internal control over financial reporting may not prevent material errors or fraud. A control system, no matter how well conceived and operated, can provide only reasonable, not absolute, assurance that the objectives of the control system are met. The effectiveness of our disclosure controls and procedures and our internal control over financial reporting is subject to risks, including that the controls may become inadequate because of changes in conditions or that the degree of compliance with our policies or procedures may deteriorate.
Item 9B. OTHER INFORMATION
On February 14, 2018, our Board of Directors amended our Bylaws to decrease the aggregate ownership percentage of stockholders needed to call a special meeting from 35% to 25% as described in Article I, Section 2 of the Bylaw. The amended Bylaws, which were effective upon approval by the Board of Directors, contain certain notice and other requirements relevant to the ability of stockholders to call a special meeting.
This description of the amendment to the Bylaws is qualified in its entirety by reference to the text of the Bylaws, filed as Exhibit 3.02 to this Form 10-K.
PART III
Item 10. DIRECTORS, EXECUTIVE OFFICERS AND CORPORATE GOVERNANCE
The information required by this item relating to our directors and nominees, regarding compliance with Section 16(a) of the Exchange Act, and regarding our Audit Committee, Corporate Governance and Nominating Committee and Compensation Committee will be included under the captions “Proposal No. 1: Election of Directors,” “Security Ownership of Certain Beneficial Owners and Management-Section 16(a) Beneficial Ownership Reporting Compliance,” and “Corporate Governance” in our Proxy Statement related to the 2018 Annual Meeting of Stockholders and is incorporated herein by reference (“2018 Proxy Statement”).
Pursuant to General Instruction G(3) of Form 10-K, the information required by this item relating to our executive officers is included under the caption “Executive Officers of the Registrant” in Part I of this Annual Report on Form 10-K.
We have adopted a “Verisign Code of Conduct”, which is posted on our website under “Ethics and Business Conduct” at https://investor.verisign.com/corporate-governance.cfm. The code of conduct applies to all directors, officers and employees, including the principal executive officer, principal financial officer and other senior accounting officers. We have also adopted the “Corporate Governance Principles for the Board of Directors,” which provide guidance to our directors on corporate practices that serve the best interests of the Company and its shareholders.
We intend to satisfy any disclosure requirement under Item 5.05 of Form 8-K regarding an amendment to, or waiver from, a provision of the “Verisign Code of Conduct,” to the extent applicable to the principal executive officer, principal financial officer, or other senior accounting officers, by posting such information on our website, on the web page found by clicking through to “Ethics and Business Conduct” as specified above.
Item 11. EXECUTIVE COMPENSATION
Information required by this item is incorporated herein by reference to our 2018 Proxy Statement from the discussions under the captions “Compensation of Directors,” “Non-Employee Director Retainer Fees and Equity Compensation Information” and “Non-Employee Director Compensation Table for Fiscal 2017,” and “Executive Compensation.”
Item 12. SECURITY OWNERSHIP OF CERTAIN BENEFICIAL OWNERS AND MANAGEMENT AND RELATED STOCKHOLDER MATTERS
Information required by this item is incorporated herein by reference from the discussions under the captions “Security Ownership of Certain Beneficial Owners and Management” and “Equity Compensation Plan Information” in our 2018 Proxy Statement.
Item 13. CERTAIN RELATIONSHIPS AND RELATED TRANSACTIONS, AND DIRECTOR INDEPENDENCE
Information required by this item is incorporated herein by reference to our 2018 Proxy Statement from the discussions under the captions “Policies and Procedures with Respect to Transactions with Related Persons,” “Certain Relationships and Related Transactions” and “Independence of Directors.”
Item 14. PRINCIPAL ACCOUNTANT FEES AND SERVICES
Information required by this item is incorporated herein by reference to our 2018 Proxy Statement from the discussions under the captions “Principal Accountant Fees and Services” and “Policy on Audit Committee Pre-Approval of Audit and Permissible Non-Audit Services of Independent Auditors.”
PART IV
Item 15. EXHIBITS, FINANCIAL STATEMENT SCHEDULES
(a) Documents filed as part of this report
- Financial statements
| • | Reports of Independent Registered Public Accounting Firm |
| • | Consolidated Balance Sheets as of December 31, 2017 and 2016 |
| • | Consolidated Statements of Comprehensive Income for the Years Ended December 31, 2017, 2016, and 2015 |
| • | Consolidated Statements of Stockholders’ Deficit for the Years Ended December 31, 2017, 2016, and 2015 |
| • | Consolidated Statements of Cash Flows for the Years Ended December 31, 2017, 2016, and 2015 |
| • | Notes to Consolidated Financial Statements |
- Financial statement schedules
| Financial statement schedules are omitted because the information called for is not material or is shown either in the consolidated financial statements or the notes thereto. |
- Exhibits
(a) Index to Exhibits
Pursuant to the rules and regulations of the Securities and Exchange Commission (the “SEC”), the Company has filed certain agreements as exhibits to this Form 10-K. These agreements may contain representations and warranties by the parties thereto. These representations and warranties have been made solely for the benefit of the other party or parties to such agreements and (1) may be intended not as statements of fact, but rather as a way of allocating the risk to one of the parties to such agreements if those statements prove to be inaccurate, (2) may have been qualified by disclosures that were made to such other party or parties and that either have been reflected in the Company’s filings or are not required to be disclosed in those filings, (3) may apply materiality standards different from what may be viewed as material to investors and (4) were made only as of the date of such agreements or such other date(s) as may be specified in such agreements and are subject to more recent developments. Accordingly, these representations and warranties may not describe the Company’s actual state of affairs at the date hereof or at any other time.
| Incorporated by Reference | |||||||||||
| Exhibit Number | Exhibit Description | Form | Date | Number | Filed Herewith | ||||||
| 24.01 | Powers of Attorney (Included as part of the signature pages hereto). | X | |||||||||
| 31.01 | Certification of Principal Executive Officer pursuant to Exchange Act Rule 13a-14(a). | X | |||||||||
| 31.02 | Certification of Principal Financial Officer pursuant to Exchange Act Rule 13a-14(a). | X | |||||||||
| 32.01 | Certification of Principal Executive Officer pursuant to Exchange Act Rule 13a-14(b) and Section 1350 of Chapter 63 of Title 18 of the U.S. Code (18 U.S.C. 1350). * | X | |||||||||
| 32.02 | Certification of Principal Financial Officer pursuant to Exchange Act Rule 13a-14(b) and Section 1350 of Chapter 63 of Title 18 of the U.S. Code (18 U.S.C. 1350). * | X | |||||||||
| 101.INS | XBRL Instance Document. | X | |||||||||
| 101.SCH | XBRL Taxonomy Extension Schema. | X | |||||||||
| 101.CAL | XBRL Taxonomy Extension Calculation Linkbase. | X | |||||||||
| 101.DEF | XBRL Taxonomy Extension Definition Linkbase. | X | |||||||||
| 101.LAB | XBRL Taxonomy Extension Label Linkbase. | X | |||||||||
| 101.PRE | XBRL Taxonomy Extension Presentation Linkbase. | X |
| * | As contemplated by SEC Release No. 33-8212, these exhibits are furnished with this Annual Report on Form 10-K and are not deemed filed with the Securities and Exchange Commission and are not incorporated by reference in any filing of VeriSign, Inc. under the Securities Act of 1933 or the Securities Exchange Act of 1934, whether made before or after the date hereof and irrespective of any general incorporation language in such filings. |
| + | Indicates a management contract or compensatory plan or arrangement. |
Item 16. 10-K SUMMARY
None.
FINANCIAL STATEMENTS
As required under Item 8—Financial Statements and Supplementary Data, the consolidated financial statements of Verisign, Inc. are provided in this separate section. The consolidated financial statements included in this section are as follows:
Report of Independent Registered Public Accounting Firm
To the stockholders and board of directors
VeriSign, Inc.:
Opinion on the Consolidated Financial Statements
We have audited the accompanying consolidated balance sheets of VeriSign, Inc. and subsidiaries (the “Company”) as of December 31, 2017 and 2016, the related consolidated statements of comprehensive income, stockholders’ deficit, and cash flows for each of the years in the three‑year period ended December 31, 2017, and the related notes (collectively, the “consolidated financial statements”). In our opinion, the consolidated financial statements present fairly, in all material respects, the financial position of the Company as of December 31, 2017 and 2016, and the results of their operations and their cash flows for each of the years in the three‑year period ended December 31, 2017, in conformity with U.S. generally accepted accounting principles.
We also have audited, in accordance with the standards of the Public Company Accounting Oversight Board (United States) (“PCAOB”), the Company’s internal control over financial reporting as of December 31, 2017, based on criteria established in Internal Control - Integrated Framework (2013) issued by the Committee of Sponsoring Organizations of the Treadway Commission, and our report dated February 16, 2018 expressed an unqualified opinion on the effectiveness of the Company’s internal control over financial reporting.
Basis for Opinion
These consolidated financial statements are the responsibility of the Company’s management. Our responsibility is to express an opinion on these consolidated financial statements based on our audits. We are a public accounting firm registered with the PCAOB and are required to be independent with respect to the Company in accordance with the U.S. federal securities laws and the applicable rules and regulations of the Securities and Exchange Commission and the PCAOB.
We conducted our audits in accordance with the standards of the PCAOB. Those standards require that we plan and perform the audit to obtain reasonable assurance about whether the consolidated financial statements are free of material misstatement, whether due to error or fraud. Our audits included performing procedures to assess the risks of material misstatement of the consolidated financial statements, whether due to error or fraud, and performing procedures that respond to those risks. Such procedures included examining, on a test basis, evidence regarding the amounts and disclosures in the consolidated financial statements. Our audits also included evaluating the accounting principles used and significant estimates made by management, as well as evaluating the overall presentation of the consolidated financial statements. We believe that our audits provide a reasonable basis for our opinion.
/s/ KPMG LLP
We have served as the Company’s auditor since 1995.
McLean, Virginia
February 16, 2018
Report of Independent Registered Public Accounting Firm
To the stockholders and board of directors
VeriSign, Inc.:
Opinion on Internal Control Over Financial Reporting
We have audited VeriSign, Inc.’s and subsidiaries’ (the “Company”) internal control over financial reporting as of December 31, 2017, based on criteria established in Internal Control - Integrated Framework (2013) issued by the Committee of Sponsoring Organizations of the Treadway Commission. In our opinion, the Company maintained, in all material respects, effective internal control over financial reporting as of December 31, 2017, based on criteria established in Internal Control - Integrated Framework (2013) issued by the Committee of Sponsoring Organizations of the Treadway Commission.
We also have audited, in accordance with the standards of the Public Company Accounting Oversight Board (United States) (“PCAOB”), the consolidated balance sheets of the Company as of December 31, 2017 and 2016, the related consolidated statements of comprehensive income, stockholders’ deficit, and cash flows for each of the years in the three-year period ended December 31, 2017, and the related notes (collectively, the consolidated financial statements), and our report dated February 16, 2018 expressed an unqualified opinion on those consolidated financial statements.
Basis for Opinion
The Company’s management is responsible for maintaining effective internal control over financial reporting and for its assessment of the effectiveness of internal control over financial reporting, included in the accompanying Management’s Report on Internal Control over Financial Reporting. Our responsibility is to express an opinion on the Company’s internal control over financial reporting based on our audit. We are a public accounting firm registered with the PCAOB and are required to be independent with respect to the Company in accordance with the U.S. federal securities laws and the applicable rules and regulations of the Securities and Exchange Commission and the PCAOB.
We conducted our audit in accordance with the standards of the PCAOB. Those standards require that we plan and perform the audit to obtain reasonable assurance about whether effective internal control over financial reporting was maintained in all material respects. Our audit of internal control over financial reporting included obtaining an understanding of internal control over financial reporting, assessing the risk that a material weakness exists, and testing and evaluating the design and operating effectiveness of internal control based on the assessed risk. Our audit also included performing such other procedures as we considered necessary in the circumstances. We believe that our audit provides a reasonable basis for our opinion.
Definition and Limitations of Internal Control Over Financial Reporting
A company’s internal control over financial reporting is a process designed to provide reasonable assurance regarding the reliability of financial reporting and the preparation of financial statements for external purposes in accordance with generally accepted accounting principles. A company’s internal control over financial reporting includes those policies and procedures that (1) pertain to the maintenance of records that, in reasonable detail, accurately and fairly reflect the transactions and dispositions of the assets of the company; (2) provide reasonable assurance that transactions are recorded as necessary to permit preparation of financial statements in accordance wi
Showing the first 8K of 101K characters. Open the full section