 filings.tools
Item 2. Management’s Discussion and Analysis of Financial Condition and Results of Operations
61K characters. Original on sec.gov · Markdown
Item 2. Management’s Discussion and Analysis of Financial Condition and Results of Operations
OVERVIEW
We are a global biotechnology company that invests in scientific innovation to create transformative medicines for people with serious diseases, with a focus on specialty markets. We have four approved medicines that treat the underlying cause of cystic fibrosis (“CF”), a life-threatening genetic disease, and we continue to focus on developing additional treatments for CF. Beyond CF, we have a pipeline that includes mid- and late-stage clinical programs in sickle cell disease, beta thalassemia, acute and neuropathic pain, APOL1-mediated kidney disease, type 1 diabetes, and alpha-1 antitrypsin deficiency, and earlier-stage programs in diseases such as muscular dystrophies.
Our triple combination regimen, TRIKAFTA/KAFTRIO (elexacaftor/tezacaftor/ivacaftor and ivacaftor), was approved in 2019 in the United States (“U.S.”) and in 2020 in the European Union (“E.U.”). Collectively, our four medicines are being used to treat more than two-thirds of the approximately 88,000 people with CF in North America, Europe, and Australia. We are evaluating our medicines in additional patient populations, including younger children, with the goal of having small molecule treatments for all people who have at least one mutation in their cystic fibrosis transmembrane conductance regulator (“CFTR”) gene that is responsive to our CFTR modulators. We also are pursuing messenger ribonucleic acid (“mRNA”) and genetic therapies for people with CF who do not make CFTR protein and, as a result, cannot benefit from our current CF medicines.
In addition, we are preparing for near-term launches of potential new products in sickle cell disease (“SCD”), beta thalassemia, CF and acute pain. We completed regulatory submissions in the U.S., E.U. and the United Kingdom (“U.K.”) for exagamglogene autotemcel (“exa-cel”) for the treatment of SCD and transfusion-dependent beta thalassemia (“TDT”). The exa-cel regulatory submissions for SCD and TDT are under review by the U.S. Food and Drug Administration (“FDA”), the European Medicines Agency (“EMA”) and the Medicines and Healthcare products Regulatory Agency (“MHRA”).
Financial Highlights
| Revenues | In the third quarter of 2023, our net product revenues increased to $2.5 billion as compared to $2.3 billion in the third quarter of 2022. The increase was primarily due to the continued performance of TRIKAFTA in the U.S., following the launch of TRIKAFTA in children with CF 2 to 5 years of age and strong uptake of TRIKAFTA/KAFTRIO in ex-U.S. markets with recently achieved reimbursements and label extensions in younger age groups. | ||||
| Expenses | Our total research and development (“R&D”), acquired in-process research and development (“AIPR&D”), and selling, general and administrative (“SG&A”) expenses increased to $1.1 billion in the third quarter of 2023 as compared to $920.8 million in the third quarter of 2022. The increase was primarily due to the progression of several product candidates in mid- to late-stage clinical development, increased AIPR&D and costs to support global launches. Cost of sales was 13% and 12% of our net product revenues in the third quarter of 2023 and 2022, respectively. | ||||
| Cash | Our total cash, cash equivalents and marketable securities increased to $13.6 billion as of September 30, 2023 as compared to $10.9 billion as of December 31, 2022 primarily due to our net product revenues and operating cash flows partially offset by our upfront payments to Entrada Therapeutics, Inc. (“Entrada”) and CRISPR Therapeutics AG (“CRISPR”), repurchases of our common stock, and income tax payments. |
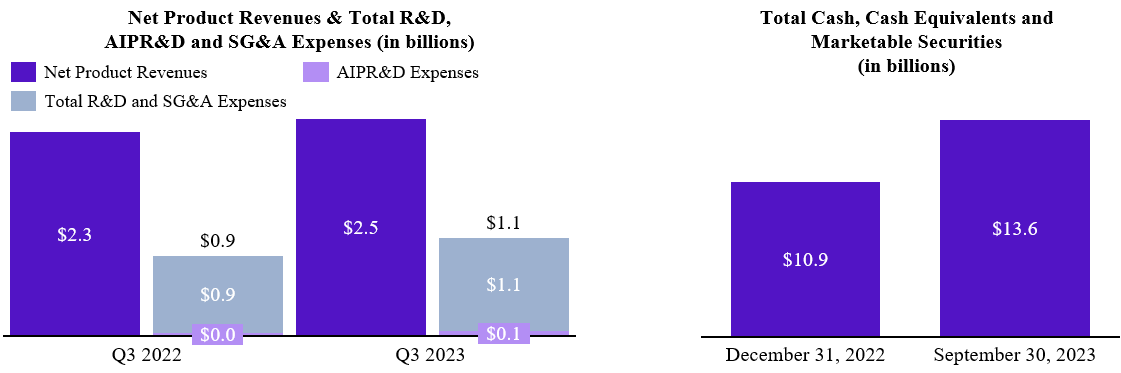
Note: Charts above may not add due to rounding.
Business Updates
Marketed Products
We expect to grow our CF business with (i) continued uptake by patients in countries where we are early in our launch, such as those with recently achieved reimbursement agreements, (ii) label expansions, including into younger patient groups, (iii) the development of mRNA therapies for people with CF who are not eligible for our approved CFTR modulators, and (iv) growth in the number of people living with CF. Recent progress in activities supporting continued uptake and label expansions is included below.
-
Health Canada granted market authorization for the use of TRIKAFTA in children with CF 2 to 5 years of age who have at least one F508del mutation in the CFTR gene.
-
The EMA’s Committee for Medicinal Products for Human Use adopted a positive opinion for the use of KAFTRIO in children with CF 2 to 5 years of age who have at least one F508del mutation in the CFTR gene.
-
The European Commission approved ORKAMBI in children with CF 1 year to less than 2 years of age with two copies of the F508del mutation in the CFTR gene.
Potential Near-Term Launch Opportunities
We are preparing for the following near-term launches of potential new products:
Exa-cel in SCD and TDT
-
In the U.S., the FDA’s Cellular, Tissue and Gene Therapies Advisory Committee meeting to discuss exa-cel in people with SCD has completed. The FDA has assigned exa-cel Prescription Drug User Fee Act action dates of December 8, 2023 for SCD and March 30, 2024 for TDT. The FDA granted Priority Review for the BLA for exa-cel in SCD. Exa-cel has been granted Fast Track, Regenerative Medicine Advanced Therapy, Orphan Drug and Rare Pediatric Disease designations in the U.S.
-
The EMA and MHRA are reviewing the marketing authorization applications (each, an “MAA”) for exa-cel in SCD and TDT in the E.U. and U.K, and we expect regulatory decisions in the coming months. In the E.U., exa-cel has been granted Priority Medicines (“PRIME”) and Orphan Drug designations. In the U.K., exa-cel has been granted an Innovation Passport under the Innovative Licensing and Access Pathway from the MHRA.
-
We submitted a MAA for exa-cel in SCD and TDT to the Saudi Food and Drug Authority (the “SFDA”). Exa-cel has been granted Breakthrough designation by the SFDA in the Kingdom of Saudi Arabia.
Vanzacaftor/tezacaftor/deutivacaftor in CF
-
We expect to complete the pivotal SKYLINE 102 and SKYLINE 103 clinical trials, which evaluate the efficacy and safety of our new once-daily investigational triple combination vanzacaftor/tezacaftor/deutivacaftor relative to TRIKAFTA in people with CF 12 years of age and older, and the RIDGELINE clinical trial of vanzacaftor/tezacaftor/deutivacaftor in children with CF 6 to 11 years of age, by the end of 2023.
-
We expect to share the results of all three clinical trials in early 2024.
VX-548 in Acute Pain
*•*We have completed the randomized controlled Phase 3 pivotal trial in abdominoplasty and we continue to enroll the randomized, controlled Phase 3 clinical trial in bunionectomy and a single-arm safety and effectiveness clinical trial, evaluating our lead compound, VX-548, for the treatment of moderate to severe acute pain. We expect to complete the pivotal program for acute pain in late 2023. We expect to share results from the three clinical trials in early 2024.
- In the U.S., VX-548 has been granted Breakthrough Therapy and Fast Track designations for moderate to severe acute pain.
Pipeline
We continue to advance a diversified pipeline of potentially transformative medicines for serious diseases utilizing a range of modalities. Recent and anticipated progress in activities supporting these efforts is included below.
Cystic Fibrosis
-
In collaboration with Moderna, we are developing VX-522, a CFTR mRNA therapeutic for the treatment of people with CF who do not produce any CFTR protein. We are enrolling people with CF in a single-ascending dose clinical trial for VX-522. We expect to complete this single-ascending dose clinical trial and initiate a multiple-ascending dose clinical trial by the end of 2023. In the U.S., the FDA has granted Fast Track designation for VX-522.
-
In addition, we are advancing additional CFTR potentiators and correctors through clinical development with the goal of bringing more patients to carrier levels of CFTR function. We are also advancing additional research-stage CFTR modulators and genetic therapies for CF.
Sickle Cell Disease and Beta Thalassemia
-
We continue to enroll and dose patients in two global Phase 3 clinical trials evaluating exa-cel in children with SCD or TDT 5 to 11 years of age.
-
We continue to work on preclinical assets for gentler conditioning for exa-cel, which could broaden the eligible patient population.
Acute and Neuropathic Pain
-
We have discovered multiple selective small molecule inhibitors of NaV1.8, with the objective of creating a new class of pain medicines that provide effective pain relief without the limitations of other pain medicines, such as the abuse potential of opioids.
-
We have completed the Phase 2 dose-ranging clinical trial evaluating VX-548 in patients with diabetic peripheral neuropathy, a common form of chronic peripheral neuropathic pain. We expect to share results from this clinical trial in late 2023.
-
We expect to initiate another Phase 2 clinical trial evaluating VX-548 in patients with peripheral neuropathic pain in late 2023. This clinical trial will evaluate VX-548 in patients with lumbosacral radiculopathy, a second type of peripheral neuropathic pain.
-
We are advancing multiple NaV1.8 inhibitors and NaV1.7 inhibitors through research and earlier stages of development for pain.
APOL1-Mediated Kidney Disease
-
Inaxaplin is our small molecule for the treatment of APOL1-mediated kidney disease (“AMKD”), including APOL1-mediated focal segmental glomerulosclerosis (“FSGS”). We continue to enroll and dose patients in the pivotal program for inaxaplin, a single Phase 2/3 clinical trial in patients with AMKD, and we expect to complete enrollment in the Phase 2B dose-ranging portion of the trial in 2023.
-
The FDA granted Breakthrough Therapy designation to inaxaplin for APOL1-mediated FSGS and the EMA granted Orphan Drug and PRIME designations to inaxaplin for AMKD.
Type 1 Diabetes
-
VX-880 is a stem cell-derived, fully differentiated, insulin-producing islet cell replacement therapy, using standard immunosuppression to protect the implanted cells. Proof-of-concept for VX-880 was achieved in 2022. We are evaluating VX-880 as a potential treatment for type 1 diabetes (“T1D”) in a sequential, three-part Phase 1/2 clinical trial. We have completed enrollment in Part C of the clinical trial.
-
We continue to advance additional programs in T1D, in which these same stem cell-derived, fully differentiated, insulin-producing islet cells are encapsulated and implanted in an immunoprotective device or are modified to produce hypoimmune cells with the goal of eliminating the need for immunosuppression. We are evaluating VX-264, the cells and device program, in a sequential, multi-part Phase 1/2 clinical trial.
-
Our hypoimmune cell program uses CRISPR/Cas9 technology to gene-edit the same stem cell-derived, fully differentiated islets used in the VX-880 and VX-264 programs. The goal is to cloak the cells from the immune system to explore another possible path to eliminate the need for immunosuppressive therapy. This program continues to progress through the research stage.
Alpha-1 Antitrypsin Deficiency
-
We are working to address the underlying genetic cause of alpha-1 antitrypsin (“AAT”) deficiency (“AATD”). We are developing novel small molecule correctors of Z-AAT protein folding, with the goal of enabling the secretion of functional AAT into the blood and addressing both the lung and the liver aspects of AATD. We continue to enroll and dose healthy volunteers in Phase 1 clinical trials evaluating VX-634 and VX-668, our next-wave investigational molecule AAT correctors with significantly improved potency and drug-like properties as compared to the first-generation AATD correctors.
-
We have discontinued development of VX-864, a first generation AATD corrector, due to non-serious rash events in some patients.
Duchenne Muscular Dystrophy
-
We are pursuing preclinical research in Duchenne muscular dystrophy (“DMD”) using innovative approaches to target the underlying cause of disease, with the goal of restoring near-full-length dystrophin and muscle function.
-
Based on pre-clinical data generated to date, we have determined that additional in vitro and animal studies of the delivery system for our gene editing components will be required prior to advancing the program into clinical development.
-
We are using the learnings from our first-generation vectors to design next-generation delivery systems for in vivo gene editing in DMD.
Our Business Environment
Our net product revenues come from the sale of our medicines for the treatment of CF. Our CF strategy involves continuing to develop and obtain approval and reimbursement for treatment regimens that will provide benefits to all people with CF and increasing the number of people with CF eligible and able to receive our medicines, including through label expansions, expanded reimbursement, and the development of new medicines. We are advancing our pipeline of product candidates for the treatment of serious diseases outside of CF. Our strategy is to combine transformative advances in the understanding of causal human biology and the science of therapeutics to discover and develop innovative medicines. This
approach includes advancing multiple compounds from each program, spanning multiple modalities, into early clinical trials to obtain patient data that can inform selection of the most promising compounds for later-stage development, and to inform discovery and development of additional compounds. We aim to rapidly follow our first-in-class therapies that achieve proof-of-concept with potential best-in-class candidates to provide durable clinical and commercial success.
In pursuit of new product candidates and therapies in specialty markets, we invest in research and development. We believe that pursuing research in diverse areas allows us to balance the risks inherent in product development and may provide product candidates that will form our pipeline in future years. To supplement our internal research programs, we acquire technologies and programs and collaborate with biopharmaceutical and technology companies, leading academic research institutions, government laboratories, foundations and other organizations, as needed, to advance research in our areas of therapeutic interest and to access technologies needed to execute on our strategy.
Discovery and development of a new pharmaceutical or biological product is a difficult and lengthy process that requires significant financial resources along with extensive technical and regulatory expertise. Across the industry, most potential drug or biological products never progress into development, and most products that do advance into development never receive marketing approval. Our investments in product candidates are subject to considerable risks. We closely monitor the results of our discovery, research, clinical trials and nonclinical studies and frequently evaluate our product development programs in light of new data and scientific, business and commercial insights, with the objective of balancing risk and potential. This process can result in rapid changes in focus and priorities as new information becomes available and as we gain additional understanding of our ongoing programs and potential new programs, as well as those of our competitors.
Our business also requires ensuring appropriate manufacturing and reimbursement of our products. As we advance our product candidates through clinical development toward commercialization and market and sell our approved products, we build and maintain our supply chain and quality assurance resources. We rely on a global network of third parties and our internal capabilities to manufacture and distribute our products for commercial sale and post-approval clinical trials and to manufacture and distribute our product candidates for clinical trials. In addition to establishing supply chains for each new approved product, we adapt our supply chain for existing products to include additional formulations or to increase scale of production for existing products as needed. The processes for cell and genetic therapies can be more complex than those required for small molecule drugs and require additional investments in different systems, equipment, facilities and expertise. We are focused on ensuring the stability of the supply chains for our current products, as well as for our pipeline programs.
Sales of our products depend, to a large degree, on the extent to which our products are reimbursed by third-party payors, such as government health programs, commercial insurance and managed health care organizations. Reimbursement for our products, including our potential pipeline therapies, cannot be assured and may take significant periods of time to obtain. We dedicate substantial management and other resources to obtain and maintain appropriate levels of reimbursement for our products from third-party payors, including governmental organizations in the U.S. and ex-U.S. markets.
In the U.S., we have worked successfully with third-party payors to promptly obtain appropriate levels of reimbursement for our CF medicines. We plan to continue to engage in discussions with numerous commercial insurers and managed health care organizations, along with government health programs that are typically managed by authorities in the individual states, to ensure that payors recognize the significant benefits that our medicines provide and provide patients with appropriate levels of access to our medicines now and in the future. We cannot, however, predict how recent changes in the law, including through the Inflation Reduction Act of 2022 and passage of state laws (e.g., transparency laws and prescription drug affordability boards), will affect our ability to negotiate successfully with third-party payors and distribute our products. In ex-U.S. markets, we seek government reimbursement for our medicines on a country-by-country or region-by-region basis, as required. This is necessary for each new medicine, as well as for label expansions for our current medicines. We expect to continue to focus significant resources to obtain expanded reimbursement for our CF medicines and, ultimately, pipeline therapies, in U.S. and ex-U.S. markets.
Strategic Transactions
Acquisitions
As part of our business strategy, we seek to acquire technologies, products, product candidates and other businesses that are aligned with our corporate and research and development strategies and complement and advance our ongoing research and development efforts. During 2022 and 2023, we have completed several acquisitions, including:
-
In the second quarter of 2022, we acquired Catalyst Biosciences, Inc.’s (“Catalyst”), portfolio of protease medicines that target the complement system and related intellectual property for $60.0 million.
-
In the third quarter of 2022, we acquired ViaCyte, a privately held biotechnology company with intellectual property, tools, technologies and assets with potential to accelerate development of our T1D programs, for $315.0 million.
-
In the third quarter of 2023, we acquired a novel G protein-coupled receptor (“GPCR”) program from Septerna, Inc. for $47.5 million.
We expect to continue to identify and evaluate potential acquisitions and may include larger transactions or later-stage assets.
Collaboration and In-Licensing Arrangements
We enter into arrangements with third parties, including collaboration and licensing arrangements, for the development, manufacture and commercialization of products, product candidates and other technologies that have the potential to complement our ongoing research and development efforts. Over the last several years, we entered into collaboration agreements with a number of companies, including Arbor Biotechnologies, Inc., CRISPR, Entrada, ImmunoGen, Inc., Mammoth Biosciences, Inc., Moderna, Inc., Obsidian Therapeutics, Inc., and Verve Therapeutics, Inc. Generally, when we in-license a technology or product candidate, we make upfront payments to the collaborator, assume the costs of the program and/or agree to make contingent payments, which could consist of milestone, royalty and option payments. Most of these collaboration payments are expensed as AIPR&D; however, depending on many factors, including the structure of the collaboration, the stage of development of the acquired technology, the significance of the in-licensed product candidate to the collaborator’s operations and the other activities in which our collaborators are engaged, the accounting for these transactions can vary significantly. We expect to continue to identify and evaluate collaboration and licensing opportunities that may be similar to or different from the collaborations and licenses that we have engaged in previously.
In February 2023, we closed our strategic collaboration and licensing agreement with Entrada. Upon closing, we made an upfront payment of $225.1 million to Entrada, and purchased $24.9 million of Entrada’s common stock.
In March 2023, we entered into a non-exclusive license agreement for the use of CRISPR’s CRISPR-Cas9 gene-editing technology to accelerate the development of our hypoimmune cell therapies for T1D and made a $100.0 million upfront payment to CRISPR. In the second quarter of 2023, we achieved a research milestone that resulted in a $70.0 million payment to CRISPR in the third quarter of 2023.
Acquired In-Process Research and Development Expenses
In the nine months ended September 30, 2023 and 2022, our AIPR&D included $509.3 million and $92.9 million, respectively, related to upfront, contingent milestone, or other payments pursuant to our business development transactions, including the collaborations, licenses of third-party technologies, and asset acquisitions described above.
Out-License Agreements
We also have out-licensed internally developed programs to collaborators who are leading the development of these programs. Pursuant to these out-licensing arrangements, our collaborators are responsible for the research, development, and commercialization costs associated with these programs, and we are entitled to receive contingent milestone and/or royalty payments. As a result, we do not expect to incur significant expenses in connection with these programs and have the potential for future collaborative and royalty revenues resulting from these programs. None of our out-license agreements had a significant impact on our condensed consolidated statement of income during the nine months ended September 30, 2023 and 2022.
Strategic Equity Investments
In connection with our business development activities, we have periodically made equity investments in our collaborators. As of September 30, 2023, we held strategic equity investments in certain public and private companies, and we expect to make additional strategic equity investments in the future. We invest the majority of our cash, cash equivalents and marketable securities in instruments that meet specific credit quality standards and limit our exposure to any one issue or
type of instrument. Our strategic equity investments are maintained and managed separately from our other cash, cash equivalents and marketable securities. As discussed below in “Other Income (Expense), Net” in our Results of Operations, any changes in the fair value of equity investments with readily determinable fair values (including publicly traded securities) are recorded to other income (expense), net in our condensed consolidated statements of income.
RESULTS OF OPERATIONS
| Three Months Ended September 30, | Nine Months Ended September 30, | ||||||||||||||||||||||||||||||||||
| 2023 | 2022 | Change | 2023 | 2022 | Change | ||||||||||||||||||||||||||||||
| (in millions, except percentages and per share amounts) | |||||||||||||||||||||||||||||||||||
| Product revenues, net | $ | 2,483.5 | $ | 2,334.3 | 6% | $ | 7,351.5 | $ | 6,628.0 | 11% | |||||||||||||||||||||||||
| Operating costs and expenses | 1,445.4 | 1,207.6 | 20% | 4,508.0 | 3,354.1 | 34% | |||||||||||||||||||||||||||||
| Income from operations | 1,038.1 | 1,126.7 | (8)% | 2,843.5 | 3,273.9 | (13)% | |||||||||||||||||||||||||||||
| Other non-operating income (expense), net | 141.1 | 49.7 | 184% | 388.7 | (118.3) | ** | |||||||||||||||||||||||||||||
| Provision for income taxes | 143.9 | 245.9 | (41)% | 581.4 | 652.5 | (11)% | |||||||||||||||||||||||||||||
| Net income | $ | 1,035.3 | $ | 930.5 | 11% | $ | 2,650.8 | $ | 2,503.1 | 6% | |||||||||||||||||||||||||
| Net income per diluted common share | $ | 3.97 | $ | 3.59 | $ | 10.18 | $ | 9.68 | |||||||||||||||||||||||||||
| Diluted shares used in per share calculations | 260.6 | 259.5 | 260.4 | 258.7 | |||||||||||||||||||||||||||||||
| ** Not meaningful |
Product Revenues, net
| Three Months Ended September 30, | Nine Months Ended September 30, | ||||||||||||||||||||||||||||||||||
| 2023 | 2022 | Change | 2023 | 2022 | Change | ||||||||||||||||||||||||||||||
| (in millions, except percentages) | |||||||||||||||||||||||||||||||||||
| TRIKAFTA/KAFTRIO | $ | 2,274.3 | $ | 2,010.5 | 13% | $ | 6,611.4 | $ | 5,665.3 | 17% | |||||||||||||||||||||||||
| KALYDECO | 112.8 | 139.4 | (19)% | 363.1 | 417.1 | (13)% | |||||||||||||||||||||||||||||
| ORKAMBI | 63.0 | 146.2 | (57)% | 281.8 | 399.9 | (30)% | |||||||||||||||||||||||||||||
| SYMDEKO/SYMKEVI | 33.4 | 38.2 | (13)% | 95.2 | 145.7 | (35)% | |||||||||||||||||||||||||||||
| Product revenues, net | $ | 2,483.5 | $ | 2,334.3 | 6% | $ | 7,351.5 | $ | 6,628.0 | 11% | |||||||||||||||||||||||||
In the third quarter and nine months ended September 30, 2023, our net product revenues increased by $149.2 million and $723.5 million, or 6% and 11%, as compared to the third quarter and nine months ended September 30, 2022, respectively. These increases were primarily due to the continued strong uptake of TRIKAFTA/KAFTRIO in ex-U.S. markets with recently achieved reimbursements and label extensions in younger age groups and the performance of TRIKAFTA in the U.S., following the launch of TRIKAFTA in children with CF 2 to 5 years of age. Decreases in revenues for our products other than TRIKAFTA/KAFTRIO were primarily the result of patients switching from these medicines to TRIKAFTA/KAFTRIO.
Our net product revenues from the U.S. and from ex-U.S. markets were as follows:
| Three Months Ended September 30, | Nine Months Ended September 30, | ||||||||||||||||||||||||||||||||||
| 2023 | 2022 | Change | 2023 | 2022 | Change | ||||||||||||||||||||||||||||||
| (in millions, except percentages) | |||||||||||||||||||||||||||||||||||
| United States | $ | 1,554.2 | $ | 1,455.6 | 7% | $ | 4,465.8 | $ | 4,238.9 | 5% | |||||||||||||||||||||||||
| ex-U.S. | 929.3 | 878.7 | 6% | 2,885.7 | 2,389.1 | 21% | |||||||||||||||||||||||||||||
| Product revenues, net | $ | 2,483.5 | $ | 2,334.3 | 6% | $ | 7,351.5 | $ | 6,628.0 | 11% |
Operating Costs and Expenses
| Three Months Ended September 30, | Nine Months Ended September 30, | ||||||||||||||||||||||||||||||||||
| 2023 | 2022 | Change | 2023 | 2022 | Change | ||||||||||||||||||||||||||||||
| (in millions, except percentages) | |||||||||||||||||||||||||||||||||||
| Cost of sales | $ | 318.7 | $ | 289.4 | 10% | $ | 894.2 | $ | 797.0 | 12% | |||||||||||||||||||||||||
| Research and development expenses | 810.0 | 645.0 | 26% | 2,338.3 | 1,846.2 | 27% | |||||||||||||||||||||||||||||
| Acquired in-process research and development expenses | 51.7 | 29.0 | 78% | 509.3 | 92.9 | 448% | |||||||||||||||||||||||||||||
| Selling, general and administrative expenses | 263.8 | 246.8 | 7% | 767.5 | 677.3 | 13% | |||||||||||||||||||||||||||||
| Change in fair value of contingent consideration | 1.2 | (2.6) | ** | (1.3) | (59.3) | ** | |||||||||||||||||||||||||||||
| Total costs and expenses | $ | 1,445.4 | $ | 1,207.6 | 20% | $ | 4,508.0 | $ | 3,354.1 | 34% | |||||||||||||||||||||||||
| ** Not meaningful |
Cost of Sales
Our cost of sales primarily consists of third-party royalties payable on net sales of our products as well as the cost of producing inventories. Pursuant to our agreement with the Cystic Fibrosis Foundation our tiered third-party royalties on sales of TRIKAFTA/KAFTRIO, SYMDEKO/SYMKEVI, KALYDECO, and ORKAMBI, calculated as a percentage of net sales, range from the single digits to the sub-teens, with lower royalties on sales of TRIKAFTA/KAFTRIO than for our other products. Over the last several years, our cost of sales has been increasing due to increased net product revenues. Our cost of sales as a percentage of our net product revenues was 13% and 12% in the third quarter of 2023 and 2022, respectively, and 12% in each of the nine months ended September 30, 2023 and 2022.
Research and Development Expenses
| Three Months Ended September 30, | Nine Months Ended September 30, | ||||||||||||||||||||||||||||||||||
| 2023 | 2022 | Change | 2023 | 2022 | Change | ||||||||||||||||||||||||||||||
| (in millions, except percentages) | |||||||||||||||||||||||||||||||||||
| Research expenses | $ | 173.9 | $ | 160.2 | 9% | $ | 511.4 | $ | 464.9 | 10% | |||||||||||||||||||||||||
| Development expenses | 636.1 | 484.8 | 31% | 1,826.9 | 1,381.3 | 32% | |||||||||||||||||||||||||||||
| Total research and development expenses | $ | 810.0 | $ | 645.0 | 26% | $ | 2,338.3 | $ | 1,846.2 | 27% |
Our research and development expenses include internal and external costs incurred for research and development of our products and product candidates. We do not assign our internal costs, such as salary and benefits, stock-based compensation expense, laboratory supplies and other direct expenses and infrastructure costs, to individual products or product candidates, because the employees within our research and development groups typically are deployed across multiple research and development programs. We assign external costs of services provided to us by clinical research organizations and other outsourced research by individual program. Our internal costs are greater than our external costs. All research and development costs for our products and product candidates are expensed as incurred.
Since January 2021, we have incurred approximately $8.6 billion in total research and development and AIPR&D expenses associated with product discovery and development. The successful development of our product candidates is highly uncertain and subject to a number of risks. In addition, the duration of clinical trials may vary substantially according to the type, complexity and novelty of the product candidate and the disease indication being targeted. The FDA and comparable agencies in foreign countries impose substantial requirements on the introduction of therapeutic pharmaceutical products, typically requiring lengthy and detailed laboratory and clinical testing procedures, sampling activities and other costly and time-consuming procedures. Data obtained from nonclinical and clinical activities at any step in the testing process may be adverse and lead to discontinuation or redirection of development activities. Data obtained from these activities also are susceptible to varying interpretations, which could delay, limit or prevent regulatory approval. The duration and cost of discovery, nonclinical studies and clinical trials may vary significantly over the life of a project and are difficult to predict.
Therefore, accurate and meaningful estimates of the ultimate costs to bring our product candidates to market are not available.
Any estimates regarding development and regulatory timelines for our product candidates are highly subjective and subject to change. Therefore, we cannot make a meaningful estimate regarding when, or if, a clinical development program will generate revenues and cash flows.
Research Expenses
| Three Months Ended September 30, | Nine Months Ended September 30, | ||||||||||||||||||||||||||||||||||
| 2023 | 2022 | Change | 2023 | 2022 | Change | ||||||||||||||||||||||||||||||
| (in millions, except percentages) | |||||||||||||||||||||||||||||||||||
| Research Expenses: | |||||||||||||||||||||||||||||||||||
| Salary and benefits | $ | 46.3 | $ | 40.7 | 14% | $ | 137.5 | $ | 119.0 | 16% | |||||||||||||||||||||||||
| Stock-based compensation expense | 20.5 | 23.3 | (12)% | 59.2 | 65.7 | (10)% | |||||||||||||||||||||||||||||
| Outsourced services and other direct expenses | 61.8 | 49.2 | 26% | 176.0 | 132.7 | 33% | |||||||||||||||||||||||||||||
| Intangible asset impairment charge | — | — | ** | — | 13.0 | ** | |||||||||||||||||||||||||||||
| Infrastructure costs | 45.3 | 47.0 | (4)% | 138.7 | 134.5 | 3% | |||||||||||||||||||||||||||||
| Total research expenses | $ | 173.9 | $ | 160.2 | 9% | $ | 511.4 | $ | 464.9 | 10% | |||||||||||||||||||||||||
| ** Not meaningful |
Our research expenses have been increasing over the last several years as we have invested in our pipeline and expanded our cell and genetic therapy capabilities, resulting in increased headcount, outside services and other direct expenses and infrastructure costs associated with our research facilities. We expect to continue to invest in our research programs with a focus on creating transformative medicines for serious diseases.
Development Expenses
| Three Months Ended September 30, | Nine Months Ended September 30, | ||||||||||||||||||||||||||||||||||
| 2023 | 2022 | Change | 2023 | 2022 | Change | ||||||||||||||||||||||||||||||
| (in millions, except percentages) | |||||||||||||||||||||||||||||||||||
| Development Expenses: | |||||||||||||||||||||||||||||||||||
| Salary and benefits | $ | 152.3 | $ | 133.5 | 14% | $ | 438.8 | $ | 344.4 | 27% | |||||||||||||||||||||||||
| Stock-based compensation expense | 60.6 | 56.7 | 7% | 172.7 | 164.2 | 5% | |||||||||||||||||||||||||||||
| Outsourced services and other direct expenses | 332.6 | 215.9 | 54% | 957.0 | 639.2 | 50% | |||||||||||||||||||||||||||||
| Infrastructure costs | 90.6 | 78.7 | 15% | 258.4 | 233.5 | 11% | |||||||||||||||||||||||||||||
| Total development expenses | $ | 636.1 | $ | 484.8 | 31% | $ | 1,826.9 | $ | 1,381.3 | 32% | |||||||||||||||||||||||||
Our development expenses increased by $151.3 million and $445.6 million, or 31% and 32%, in the three and nine months ended September 30, 2023 as compared to the three and nine months ended September 30, 2022, respectively, primarily due to increased costs to support clinical trials and drug supply associated with our advancing pipeline programs, including in pain, exa-cel and T1D. We are investing significantly in internal headcount, leveraging outsourced services, and in infrastructure to support these programs.
Acquired In-process Research and Development Expenses
| Three Months Ended September 30, | Nine Months Ended September 30, | ||||||||||||||||||||||||||||||||||
| 2023 | 2022 | Change | 2023 | 2022 | Change | ||||||||||||||||||||||||||||||
| (in millions, except percentages) | |||||||||||||||||||||||||||||||||||
| Acquired in-process research and development expenses | $ | 51.7 | $ | 29.0 | 78% | $ | 509.3 | $ | 92.9 | 448% | |||||||||||||||||||||||||
AIPR&D in the third quarter of 2023 was primarily related to our $47.5 million acquisition of a novel GPCR program from Septerna. AIPR&D in the nine months ended September 30, 2023 also included our $225.1 million upfront payment to Entrada, and our $100.0 million upfront payment and $70.0 million T1D research milestone to CRISPR. AIPR&D in the third quarter of 2022 was primarily related to a $25.0 million upfront payment pursuant to our license agreement with Verve. AIPR&D in the nine months ended September 30, 2022 was primarily related to our payment to Verve and a $60.0 million payment to Catalyst to acquire their complement portfolio and related intellectual property. Our AIPR&D has historically fluctuated, and is expected to continue to fluctuate, from one period to another due to upfront, contingent milestone, and other payments pursuant to our existing and future business development transactions, including collaborations, licenses of third-party technologies, and asset acquisitions.
Selling, General and Administrative Expenses
| Three Months Ended September 30, | Nine Months Ended September 30, | ||||||||||||||||||||||||||||||||||
| 2023 | 2022 | Change | 2023 | 2022 | Change | ||||||||||||||||||||||||||||||
| (in millions, except percentages) | |||||||||||||||||||||||||||||||||||
| Selling, general and administrative expenses | $ | 263.8 | $ | 246.8 | 7% | $ | 767.5 | $ | 677.3 | 13% |
Selling, general and administrative expenses increased by 7% and 13% in the third quarter and nine months ended September 30, 2023 as compared to the third quarter and nine months ended September 30, 2022, respectively, primarily due to the continued investment to support the commercialization of our medicines and increased support for our pipeline product candidates.
Contingent Consideration
The fair value of our contingent consideration increased by $1.2 million and decreased by $1.3 million in the third quarter and nine months ended September 30, 2023, respectively. The fair value of our contingent consideration decreased by $2.6 million and $59.3 million in the third quarter and nine months ended September 30, 2022, respectively. The fair value of contingent consideration decreased in the nine months ended September 30, 2022 primarily as a result of a revision to the scope of certain gene-editing programs in the second quarter of 2022.
As of September 30, 2023, the fair value of our contingent consideration liabilities of $127.7 million related to development and regulatory milestones associated with our genetic therapy program for DMD. In November 2023, we determined that additional pre-clinical studies of the delivery system for our gene-editing components for DMD will be required. Any potential impact on the fair value of our contingent consideration liabilities will be recognized as of December 31, 2023.
Other Non-Operating Income (Expense), Net
Interest Income
Interest income increased to $167.9 million and $435.2 million in the third quarter and nine months ended September 30, 2023, respectively, as compared to $46.2 million and $58.6 million in the third quarter and nine months ended September 30, 2022, respectively, primarily due to increased market interest rates and increased cash equivalents and available-for-sale debt securities. Our future interest income is dependent on the amount of, and prevailing market interest rates on, our outstanding cash equivalents and available-for-sale debt securities.
Interest Expense
Interest expense was $10.9 million and $13.7 million in the third quarter of 2023 and 2022, respectively, and $33.5 million and $43.2 million in the nine months ended September 30, 2023 and 2022, respectively. The majority of our interest expense in these periods was related to imputed interest expense associated with our leased corporate headquarters in Boston.
Other Income (Expense), Net
Other income (expense), net was expense of $15.9 million and income of $17.2 million in the third quarter of 2023 and 2022, respectively, and expense of $13.0 million and $133.7 million in the nine months ended September 30, 2023 and 2022, respectively. These amounts related primarily to net unrealized gains or losses resulting from changes in the fair value of our strategic equity investments. As of September 30, 2023, the fair value of our investments in publicly traded companies was $46.4 million. To the extent that we continue to hold strategic equity investments in publicly traded companies, we will record other income (expense) related to these investments on a quarterly basis. We expect that due to the volatility of the stock price of biotechnology companies, our other income (expense), net will fluctuate in future periods based on increases or decreases in the fair value of our strategic equity investments.
Income Taxes
Our effective tax rate fluctuates from period to period due to the global nature of our operations. The factors that most significantly impact our effective tax rate include changes in tax laws, variability in the allocation of our taxable earnings among multiple jurisdictions, the amount and characterization of our research and development expenses, the levels of certain deductions and credits, adjustments to the value of our uncertain tax positions, acquisitions and third-party collaboration and licensing transactions.
We recorded provisions for income taxes of $143.9 million and $245.9 million in the third quarter of 2023 and 2022, respectively, and $581.4 million and $652.5 million in the nine months ended September 30, 2023 and 2022, respectively. Our effective tax rate of 18.0% in the nine months ended September 30, 2023 was lower than the U.S. statutory rate primarily due to a benefit from a research and development tax credit study that was completed during the third quarter of 2023 and excess tax benefits related to stock-based compensation, partially offset by changes in uncertain tax positions. Our effective tax rate of 20.7% in the nine months ended September 30, 2022 was similar to the U.S. statutory rate.
LIQUIDITY AND CAPITAL RESOURCES
The following table summarizes the components of our financial condition as of September 30, 2023 and December 31, 2022:
| As of September 30, 2023 | As of December 31, 2022 | Change | |||||||||||||||
| (in millions, except percentages) | |||||||||||||||||
| Cash, cash equivalents and marketable securities: | |||||||||||||||||
| Cash and cash equivalents | $ | 11,110.2 | $ | 10,504.0 | 6% | ||||||||||||
| Marketable securities | 818.0 | 274.5 | 198% | ||||||||||||||
| Long-term marketable securities | 1,700.0 | 112.2 | 1,415% | ||||||||||||||
| Total cash, cash equivalents and marketable securities | $ | 13,628.2 | $ | 10,890.7 | 25% | ||||||||||||
| Working Capital: | |||||||||||||||||
| Total current assets | $ | 14,695.8 | $ | 13,234.8 | 11% | ||||||||||||
| Total current liabilities | (3,599.4) | (2,742.1) | 31% | ||||||||||||||
| Total working capital | $ | 11,096.4 | $ | 10,492.7 | 6% |
Working Capital
As of September 30, 2023, total working capital was $11.1 billion, which represented an increase of $603.7 million from $10.5 billion as of December 31, 2022. The increase in total working capital during the nine months ended September 30, 2023 was primarily due to $3.3 billion of cash provided by operations partially offset by increased investment in long-term marketable securities and repurchases of our common stock.
Cash Flows
| Nine Months Ended September 30, | |||||||||||
| 2023 | 2022 | ||||||||||
| (in millions) | |||||||||||
| Net cash provided by (used in): | |||||||||||
| Operating activities | $ | 3,302.7 | $ | 3,051.5 | |||||||
| Investing activities | $ | (2,255.2) | $ | (496.7) | |||||||
| Financing activities | $ | (442.4) | $ | (107.9) |
Operating Activities
Cash provided by operating activities were $3.3 billion in the nine months ended September 30, 2023 as compared to $3.1 billion in the nine months ended September 30, 2022. The increase in cash provided by operating activities was primarily due to increased net income in the nine months ended September 30, 2023 as compared to the nine months ended September 30, 2022.
Investing Activities
Cash used in investing activities were $2.3 billion and $496.7 million in the nine months ended September 30, 2023 and 2022, respectively. In the nine months ended September 30, 2023, our investing activities primarily related to net purchases of marketable securities. In the nine months ended September 30, 2022, our investing activities primarily related to a net payment of $295.9 million to acquire ViaCyte, Inc. and purchases of property and equipment.
Financing Activities
Cash used in financing activities were $442.4 million and $107.9 million in the nine months ended September 30, 2023 and 2022, respectively. In the nine months ended September 30, 2023, our financing activities primarily related to
repurchases of our common stock pursuant to our Share Repurchase Program and payments related to our employee stock benefit plans. In the nine months ended September 30, 2022, the largest portion of our financing activities were payments related to our employee stock benefit plans.
Sources and Uses of Liquidity
As of September 30, 2023, we had total cash, cash equivalents and marketable securities of $13.6 billion, which represented an increase of $2.7 billion from $10.9 billion as of December 31, 2022. We intend to rely on our existing cash, cash equivalents and marketable securities together with cash flows from product sales as our primary source of liquidity.
We expect that cash flows from our product sales together with our current cash, cash equivalents and marketable securities will be sufficient to fund our operations for at least the next twelve months. The adequacy of our available funds to meet our future operating and capital requirements will depend on many factors, including our future product sales, and the potential introduction of one or more of our other product candidates to the market, our business development activities, and the number, breadth, cost and prospects of our research and development programs.
Credit Facilities & Financing Strategy
We may borrow up to a total of $500.0 million pursuant to a revolving credit facility that we entered into in July 2022 and could repay and reborrow amounts under this revolving credit agreement without penalty. Subject to certain conditions, we could request that the borrowing capacity be increased by an additional $500.0 million, for a total of $1.0 billion. Negative covenants in our credit agreement could prohibit or limit our ability to access this source of liquidity. As of September 30, 2023, the facility was undrawn, and we were in compliance with these covenants.
We may also raise additional capital by borrowing under credit agreements, through public offerings or private placements of our securities or securing new collaborative agreements or other methods of financing. We will continue to manage our capital structure and will consider all financing opportunities, whenever they may occur, that could strengthen our long-term liquidity profile. There can be no assurance that any such financing opportunities will be available on acceptable terms, if at all.
Future Capital Requirements
We have significant future capital requirements, including:
-
Expected operating expenses to conduct research and development activities, manufacture and commercialize our existing and future products, and to operate our organization.
-
Facility, operating and finance lease obligations.
-
Royalties we pay related to sales of our CF products.
-
Cash paid for income taxes.
In addition, we have significant potential future capital requirements including:
-
We have entered into certain business development-related and strategic agreements with third parties that include the funding of certain research, development, manufacturing and commercialization efforts. Certain of our transactions, including collaborations, licensing arrangements, and asset acquisitions, include the potential for future milestone and royalty payments by us upon the achievement of pre-established developmental and regulatory targets and/or commercial targets. Other transactions include the potential for future lease-related expenses and other costs. Our obligation to fund these research and development and commercialization efforts and to pay these potential milestones, expenses and royalties is contingent upon continued involvement in the programs and/or the lack of any adverse events that could cause their discontinuance. We may enter into additional business development transactions and strategic agreements, including acquisitions, collaborations, licensing arrangements and equity investments, that require additional capital.
-
To the extent we borrow amounts under our existing credit agreement, we would be required to repay any outstanding principal amounts in 2027.
-
As of September 30, 2023, we had $2.7 billion remaining authorization available under our Share Repurchase Program.
There have not been any material changes to our future capital requirements disclosed in our Annual Report on Form 10-K for the year ended December 31, 2022, which was filed with the Securities and Exchange Commission, or SEC, on February 10, 2023.
CRITICAL ACCOUNTING POLICIES AND ESTIMATES
Our discussion and analysis of our financial condition and results of operations are based upon our condensed consolidated financial statements prepared in accordance with generally accepted accounting principles in the U.S. The preparation of these financial statements requires us to make certain estimates and assumptions that affect the reported amounts of assets and liabilities, the disclosure of contingent assets and liabilities at the date of the condensed consolidated financial statements and the reported amounts of revenues and expenses during the reported periods. These items are monitored and analyzed by management for changes in facts and circumstances, and material changes in these estimates could occur in the future. Changes in estimates are reflected in reported results for the period in which the change occurs. We base our estimates on historical experience and various other assumptions that we believe to be reasonable under the circumstances. Actual results may differ from our estimates if past experience or other assumptions do not turn out to be substantially accurate. During the nine months ended September 30, 2023, there were no material changes to our critical accounting policies as reported in our Annual Report on Form 10-K for the year ended December 31, 2022, which was filed with the SEC on February 10, 2023.
RECENT ACCOUNTING PRONOUNCEMENTS
For a discussion of recent accounting pronouncements, please refer to Note A, “Basis of Presentation and Accounting Policies.”
Previous: Item 1. Financial Statements · Next: Item 3. Quantitative and Qualitative Disclosures About Market Risk