 filings.tools
Item 7. MANAGEMENT'S DISCUSSION AND ANALYSIS OF FINANCIAL CONDITION AND RESULTS OF OPERATIONS
145K characters. Original on sec.gov · Markdown
Item 7. MANAGEMENT'S DISCUSSION AND ANALYSIS OF FINANCIAL CONDITION AND RESULTS OF OPERATIONS
As described in Note 1 to the Financial Statements, Vistra Energy is considered a new reporting entity for accounting purposes as of the Effective Date, and its financial statements reflect the application of fresh start reporting. The financial statements of Vistra Energy (the Successor) for periods subsequent to the Effective Date are not comparable to the financial statements of TCEH (the Predecessor) for periods prior to the Effective Date, as those previous periods do not give effect to any adjustments to the carrying values of assets or amounts of liabilities that resulted from the Plan of Reorganization, and the related application of fresh start reporting, which includes accounting policies implemented by Vistra Energy that may differ from the Predecessor. See Note 6 to the Financial Statements for further discussion of fresh start reporting.
The following discussion and analysis of our financial condition and results of operations for the Successor period for the years ended December 31, 2018 and 2017 and the period from October 3, 2016 through December 31, 2016 and the Predecessor period from January 1, 2016 through October 2, 2016 should be read in conjunction with our consolidated financial statements and the notes to those statements. Results are impacted by the effects of the Merger, fresh start reporting, the Bankruptcy Filing and the application of Financial Accounting Standards Board Accounting Standards Codification (ASC) 852, Reorganizations.
All dollar amounts in the tables in the following discussion and analysis are stated in millions of U.S. dollars unless otherwise indicated.
Business
Vistra Energy is a holding company operating an integrated power business in markets thorough the U.S. Through our subsidiaries, we are engaged in competitive electricity market activities including power generation, wholesale energy sales and purchases, commodity risk management and retail sales of electricity and related services to end users. Prior to the Effective Date, TCEH was a holding company for our subsidiaries, which were principally engaged in the same activities as they are today.
Operating Segments
Vistra Energy has six reportable segments: (i) Retail, (ii) ERCOT, (iii) PJM, (iv) NY/NE (comprising NYISO and ISO-NE), (v) MISO and (vi) Asset Closure. The PJM, NY/NE and MISO segments were established on the Merger Date to reflect markets served by businesses acquired in the Merger. Prior to the Effective Date, there were no reportable business segments for TCEH. See Note 22 to the Financial Statements for further information concerning reportable business segments.
Significant Activities and Events and Items Influencing Future Performance
Entry into Purchase Agreement to Acquire Crius Energy Trust
On February 7, 2019, Vistra Energy and Crius Energy Trust (Crius) entered into a definitive agreement, which was subsequently amended on February 19, 2019 (as amended, the Crius Purchase Agreement), as a result of an unsolicited acquisition proposal, pursuant to which Vistra Energy will acquire the equity interest of two wholly owned subsidiaries of Crius that indirectly own the operating business of Crius (Crius Transaction). Crius is an energy retailer selling both electricity and natural gas products to residential and small business customers in 19 states and the District of Columbia.
The acquisition provides a high degree of overlap with Vistra Energy's generation fleet with approximately 11.6 TWh of annual load, improving Vistra Energy's match of its generation to load profile to approximately 45 percent, reducing risk. The acquisition also establishes a platform for future growth by leveraging Vistra Energy's existing retail marketing capabilities and Crius's experienced team. The acquisition enhances the integrated value proposition through collateral and transaction efficiencies, particularly via Crius's largely retail portfolio.
Vistra Energy intends to fund the purchase price of approximately $378 million using cash on hand and assumption of Crius's net debt of approximately $108 million. Completion of the Crius Transaction is subject to various customary conditions, including, among others, (i) approval by at least two-thirds of the Crius unitholders and (ii) receipt of all requisite regulatory approvals, which include approvals of the FERC and the expiration and termination of the applicable waiting period under the Hart-Scott-Rodino Antitrust Improvements Act of 1976. Pending the receipt of all necessary approvals and the fulfillment of all other customary closing conditions, the parties expect the transaction to close in the second quarter of 2019.
Merger Transaction
On the Merger Date, Vistra Energy and Dynegy completed the transactions contemplated by the Merger Agreement. Pursuant to the Merger Agreement, Dynegy merged with and into Vistra Energy, with Vistra Energy continuing as the surviving corporation.
At the closing of the Merger, each issued and outstanding share of Dynegy common stock, par value $0.01 per share, other than shares owned by Vistra Energy or its subsidiaries, held in treasury by Dynegy or held by a subsidiary of Dynegy, was automatically converted into 0.652 shares of common stock, par value $0.01 per share, of Vistra Energy, except that cash was paid in lieu of fractional shares.
Based on the opening price of Vistra Energy common stock on the Merger Date, the purchase price was approximately $2.3 billion. The purchase price allocation is substantially complete, but is dependent upon final valuation determinations, which may materially change from our current estimates. The preliminary values for property plant and equipment, identifiable intangible assets and liabilities, goodwill, inventories, asset retirement obligations, contingent liabilities and deferred taxes represent our current best estimates of the fair value at the Merger Date. We currently expect the final purchase price allocation will be completed no later than the first quarter of 2019 and goodwill will be allocated to the related reporting units at that time.
See Note 2 to the Financial Statements for a summary of the Merger transaction and business combination accounting.
Acquisition, Development and Disposition of Generation Facilities
Battery Energy Storage Projects — We have completed the construction of our first battery energy storage system. In October 2018, we were awarded a $1 million grant from the TCEQ for our battery energy storage system at Upton 2 solar facility. The grant is part of the Texas Emissions Reduction Plan. The 10 MW lithium-ion energy storage system captures excess solar energy produced during the day and releases the energy in late afternoon and early evening, when demand is highest. The project became operational on December 31, 2018.
In June 2018, we announced that we would enter into a 20-year resource adequacy contract with Pacific Gas and Electric Company (PG&E) to develop a 300 MW battery energy storage project at our Moss Landing Power Plant site in California. PG&E filed its application with the California Public Utilities Commission (CPUC) in June 2018 and the CPUC approved the contract in November 2018. We anticipate the battery storage project will enter commercial operations by the fourth quarter of 2020.
Upton 2 Solar Development — In May 2017, we acquired the rights to develop, construct and operate a utility scale solar photovoltaic power generation facility in Upton County, Texas. As part of this project, we entered a turnkey engineering, procurement and construction agreement to construct the approximately 180 MW facility. The facility began test operations in March 2018 and commercial operations began in June 2018.
CCGT Plant Acquisition — In July 2017, La Frontera Holdings, LLC (La Frontera), an indirect wholly owned subsidiary of Vistra Energy, entered into an asset purchase agreement with Odessa-Ector Power Partners, L.P., an indirect wholly owned subsidiary of Koch Ag & Energy Solutions, LLC (the Odessa Acquisition), to acquire a 1,054 MW CCGT natural gas-fueled generation plant (and other related assets and liabilities) located in Odessa, Texas (the Odessa Facility). On August 1, 2017, the Odessa Acquisition closed and La Frontera acquired the Odessa Facility. La Frontera paid an aggregate purchase price of approximately $355 million, plus a five-year earn-out provision, to acquire the Odessa Facility. The purchase price was funded by cash on hand. Subsequent to the acquisition, the earn-out provision has been accounted for as a derivative in our consolidated financial statements, and partial buybacks of the earn-out provision were settled in February and May 2018.
Retirement of Generation Plants — In August 2018, we filed a notice of suspension of operation with PJM and other mandatory regulatory notifications related to the retirement of our 51 MW Northeastern waste coal facility in McAddo, Pennsylvania. We decided to retire the facility due to its uneconomic operations and financial outlook. Following the receipt of regulatory approvals, the facility was retired in October 2018.
Two of our non-operated, jointly held power plants acquired in the Merger for which our proportional generation capacity was 883 MW, were retired in May 2018. These units were retired as previously scheduled.
In October 2017, Luminant announced plans to retire three power plants with a total installed nameplate generation capacity of approximately 4,167 MW and two lignite mines. These power plants include the Monticello, Sandow 4, Sandow 5 and Big Brown generation units. Luminant decided to retire these units because they were projected to be uneconomic based on then current market conditions and would have faced significant environmental costs associated with operating such units. In the case of the Sandow units, the decision also reflected the execution of a contract termination agreement pursuant to which the Company and Alcoa agreed to an early settlement of a long-standing power and mining agreement.
As part of the retirement process, Luminant filed notices with ERCOT, which triggered a reliability review regarding such proposed retirements. In October and November 2017, ERCOT determined the units were not needed for reliability. The Sandow and Monticello units were retired in January 2018, and the Big Brown units were retired in February 2018.
During the year ended December 31, 2017, we recorded charges of approximately $206 million related to the retirements, including employee related severance costs, noncash charges for writing off materials inventory and a contract intangible asset associated with the Big Brown plant and the acceleration of Luminant's mining reclamation obligations (see Note 23 to the Financial Statements). In addition, we will continue the ongoing reclamation work at the plants' mines.
Termination and Settlement of Alcoa Contract — In October 2017, subsidiaries of Vistra Energy (Vistra Parties) entered into a separation and settlement agreement (Settlement Agreement) with Alcoa Corporation and Alcoa USA Corp. (collectively, the Alcoa Parties). Pursuant to the Settlement Agreement, the Vistra Parties and the Alcoa Parties agreed to early termination of a series of agreements related to industrial operations near Rockdale, Texas, thereby ending their contractual relationship with respect to the power generation unit known as Sandow Unit 4 and the mine known as Three Oaks Mine. The terminated agreements were scheduled to terminate in 2038 absent the Settlement Agreement. Among other things, the Alcoa Parties made a cash payment to the Vistra Parties in the amount of approximately $238 million and transferred certain real property and related assets to the Vistra Parties, the Vistra Parties agreed to assume and be responsible for certain liabilities and asset retirement obligations related to Sandow Unit 4 (including certain related common facilities), the related mine and other property transferred from the Alcoa Parties to the Vistra Parties, and both parties released one another from any obligations and claims under the terminated agreements. The transactions under the Settlement Agreement were effective as of October 1, 2017. See Note 8 to the Financial Statements.
Dividend Program
In November 2018, we announced that the Board had adopted a dividend program pursuant to which we expect to initiate an annual dividend of approximately $0.50 per share, payable quarterly, beginning in the first quarter of 2019. Each dividend under the program will be subject to declaration by the Board and, thus, may be subject to numerous factors in existence at the time of any such declaration including, but not limited to, prevailing market conditions, our results of operations, financial condition and liquidity and Delaware law.
On February 26, 2019, Vistra Energy announced that the Board had declared a dividend pursuant to which Vistra Energy would pay, to each holder of record as of March 15, 2019, a dividend of $0.125 per share, to be paid March 29, 2019.
Share Repurchase Program
In June 2018, we announced that the Board had authorized a share repurchase program under which up to $500 million of our outstanding common stock may be repurchased. Repurchases under this program were completed on October 19, 2018. On a cumulative basis, 21,421,925 shares of our common stock were repurchased for $500 million (including related fees and expenses) at an average price per share of common stock of $23.36.
In November 2018, we announced that the Board had authorized an incremental share repurchase program under which up to $1.25 billion of our outstanding stock may be purchased. Through December 31, 2018, 12,073,091 shares of our common stock had been repurchased for $278 million (including related fees and expenses) at an average price per share of common stock of $22.99, and at December 31, 2018, $972 million was available for additional repurchases under the program. On a cumulative basis through February 25, 2019, 19,167,147 shares of our common stock had been repurchased for $451 million (including related fees and expenses) at an average price per share of common stock of $23.52, and at February 25, 2019, $799 million was available for additional repurchases under the program. We intend to implement the program opportunistically from time to time over the next 12 months.
Shares of the Company's common stock may be repurchased in open market transactions at prevailing market prices, in privately negotiated transactions or by other means in accordance with the Securities Exchange Act of 1934, as amended, or by other means in accordance with federal securities laws. The actual timing, number and value of shares repurchased under the share repurchase program will be determined at our discretion and will depend on a number of factors, including the market price of our stock, general market and economic conditions, applicable legal requirements and compliance with the terms of our debt agreements and the Tax Matters Agreement.
Debt Activity
We have a target to reduce leverage to approximately 2.5x net debt/EBITDA. The following transactions reflect our intention to simplify our capital structure and reduce interest expense. We will continue to pursue opportunities to refinance our long-term debt and reduce interest expense.
Issuance of Vistra Operations 5.625% Senior Notes Due 2027 — In February 2019, Vistra Operations issued and sold $1.3 billion aggregate principal amount of 5.625% senior notes due 2027 in an offering to eligible purchasers under Rule 144A and Regulation S under the Securities Act of 1933, as amended. The senior notes were sold pursuant to a purchase agreement by and among Vistra Operations, certain direct and indirect subsidiaries of Vistra Operations and J.P. Morgan Securities, LLC, as representative of the several initial purchasers. Net proceeds from the sale of the senior notes totaling approximately $1.287 billion, together with cash on hand, were used to pay the purchase price and accrued interest (together with fees and expenses) required in connection with (i) the 2019 cash tender offer described below, (ii) the redemption of approximately $35 million aggregate principal amount of our 7.375% senior notes due 2022 and (iii) the redemption of the remaining approximately $25 million aggregate principal amount of our outstanding 8.034% senior notes due 2024.
2019 Tender Offer and Consent Solicitation — In February 2019, Vistra Energy used the net proceeds from the issuance of the Vistra Operations 5.625% senior notes due 2027 to fund a cash tender offer (the 2019 Tender Offer) to purchase for cash approximately $1.193 billion aggregate principal amount of 7.375% senior notes due 2022 assumed in the Merger.
In connection with the 2019 Tender Offer, Vistra Energy also commenced solicitation of consents from holders of the 7.375% senior notes due 2022. Vistra Energy received the requisite consents from the holders of the 7.375% senior notes due 2022 and amended the indenture governing these senior notes to, among other things, eliminate substantially all of the restrictive covenants and certain events of default.
Bond Repurchase Program — In November 2018, the Board authorized a bond repurchase program under which up to $200 million principal amount of outstanding Vistra Energy senior notes could be repurchased. Through December 31, 2018, $119 million aggregate principal amount of senior notes had been repurchased.
Accounts Receivable Securitization Program — In August 2018, TXU Energy Receivables Company LLC (RecCo), a wholly owned subsidiary of TXU Energy, and Vistra Energy entered into a $350 million accounts receivable financing facility (Receivables Facility), currently scheduled to terminate in August 2019, with issuers of asset-backed commercial paper and commercial banks. Vistra Energy expects to have the opportunity to renew and/or extend the Receivables Facility upon its expiration subject to such terms and conditions as may be agreed upon by the parties thereto. The Receivables Facility provides Vistra Energy with the ability to borrow up to $350 million. See Note 13 to the Financial Statements for details of the accounts receivable securitization program.
Issuance of Vistra Operations 5.500% Senior Notes Due 2026 — In August 2018, Vistra Operations issued and sold $1 billion aggregate principal amount of the 5.500% senior notes due 2026 in an offering to eligible purchasers under Rule 144A and Regulation S under the Securities Act of 1933, as amended. The senior notes were sold pursuant to a purchase agreement by and among Vistra Operations, certain direct and indirect subsidiaries of Vistra Operations and Citigroup Global Markets Inc., as representative of the several initial purchasers. Net proceeds from the sale of the senior notes totaling approximately $990 million, together with cash on hand and cash received from the funding of the accounts receivable securitization program described above, were used to pay the purchase price and accrued interest (together with fees and expenses) required in connection with the tender offers described below.
2018 Tender Offers and Consent Solicitations — In August 2018, Vistra Energy used the net proceeds from the issuance of the Vistra Operations 5.500% senior notes due 2026, proceeds from the accounts receivable securitization program and cash on hand to fund cash tender offers to purchase for cash $1.542 billion of senior notes assumed in the Merger. In connection with the tender offers, Vistra Energy also commenced solicitations of consents from holders of the 7.375% senior notes due 2022, the 7.625% senior notes due 2024, the 8.034% senior notes due 2024, the 8.000% senior notes due 2025 and the 8.125% senior notes due 2026 to amend certain provisions of the applicable indentures governing each series of senior notes and the registration rights agreement with respect to the 8.125% senior notes due 2026. Vistra Energy received the requisite consents from the holders of the 8.034% senior notes due 2024, the 8.000% senior notes due 2025 and the 8.125% senior notes due 2026 and amended the indentures governing each series of the applicable senior notes to, among other things, eliminate substantially all of the restrictive covenants and certain events of default. In addition, Vistra Energy received the requisite consents from the holders of the 8.125% senior notes due 2026 and amended the registration rights agreement with respect to the 8.125% senior notes due 2026 to remove, among other things, the requirement that Vistra Energy commence an exchange offer to issue registered securities in exchange for the notes.
Amendment to Vistra Operations Credit Facilities — In June 2018, the Credit Facilities Agreement was amended. Among other things, the amendment included the following updated terms:
| • | Aggregate commitments under the Revolving Credit Facility were increased from $860 million to $2.5 billion. The letter of credit sub-facility was also increased from $715 million to $2.3 billion. The maturity date of the Revolving Credit Facility was extended from August 4, 2021 to June 14, 2023. Pricing terms for the Revolving Credit Facility were reduced from LIBOR plus an applicable margin of 2.25% to LIBOR plus an applicable margin of 1.75%. Pricing terms for letters of credit issued under the Revolving Credit Facility were reduced from 2.25% to 1.75%. |
| • | Pricing terms for the Term Loan B-1 Facility were reduced from LIBOR plus an applicable margin of 2.50% to LIBOR plus an applicable margin of 2.00%. |
| • | Borrowings under the new Term Loan B-3 Facility of $2.040 billion principal amount were used to repay borrowings under the credit agreement that Vistra Energy assumed from Dynegy in connection with the Merger. Amounts borrowed under the Term Loan B-3 Facility bear interest based on applicable LIBOR rates plus a fixed spread of 2.00%, and the maturity date of the facility is December 31, 2025. |
| • | Borrowings under the Term Loan C Facility of $500 million were repaid using $500 million of cash from collateral accounts used to backstop letters of credit. |
See Note 14 to the Financial Statements for details of the Vistra Operations Credit Facilities.
Redemption of Debt — In May 2018, $850 million aggregate principal amount of outstanding 6.75% Senior Notes due 2019 was redeemed at a redemption price of 101.688% of the aggregate principal amount, plus accrued and unpaid interest to but not including the date of redemption (see Note 14).
Environmental Matters
See Note 15 to Financial Statements for a discussion of greenhouse gas emissions, the Cross-State Air Pollution Rule, regional haze, state implementation plan and other recent EPA actions as well as related litigation.
Capacity Markets
PJM — Reliability Pricing Model (RPM) auction results, for the zones in which our assets are located, are as follows for each planning year:
| 2018-2019 | 2019-2020 | 2020-2021 | 2021-2022 | ||||||||||||||||||||
| Base | CP | Base | CP | CP | CP | ||||||||||||||||||
| (price per MW-day) | |||||||||||||||||||||||
| RTO zone (a) | $ | 149.98 | $ | 164.77 | $ | 80.00 | $ | 100.00 | $ | 88.32 | $ | 140.00 | |||||||||||
| ComEd zone | 200.21 | 215.00 | 182.77 | 202.77 | 188.12 | 195.55 | |||||||||||||||||
| MAAC zone | 149.98 | 164.77 | 80.00 | 100.00 | 86.04 | 140.00 | |||||||||||||||||
| EMAAC zone | 210.63 | 225.42 | 99.77 | 119.77 | 187.87 | 165.73 | |||||||||||||||||
| ATSI zone | 149.88 | 164.77 | 80.00 | 100.00 | 76.53 | 171.33 | |||||||||||||||||
| PPL zone | 75.00 | 164.77 | 80.00 | 100.00 | 86.04 | 140.00 |
| (a) | Planning Year 2020-2021 includes Duke Energy Ohio Kentucky (DEOK) zone which cleared at $130.00 per MW-day. RTO Zone excluding DEOK Zone was $76.53 per MW-day. |
Our capacity sales, net of purchases, aggregated by planning year and capacity type through planning year 2020-2021, are as follows:
| 2018-2019 | 2019-2020 | 2020-2021 | 2021-2022 | |||||||||||||
| Base auction capacity sold, net (MW) | 1,420 | 893 | — | — | ||||||||||||
| CP auction capacity sold, net (MW) | 7,771 | 8,144 | 8,642 | 9,053 | ||||||||||||
| Bilateral capacity sold, net (MW) | 285 | — | 200 | 200 | 200 | |||||||||||
| Total segment capacity sold, net (MW) | 9,476 | 9,237 | 8,842 | 9,253 | ||||||||||||
| Average price per MW-day | $ | 186.40 | $ | 135.56 | $ | 129.30 | $ | 159.22 |
NYISO — The most recent seasonal auction results for NYISO's Rest-of-State zones, in which the capacity for our Independence plant clears, are as follows for each planning period:
| Summer 2018 | Winter 2018 - 2019 | ||||||
| Price per kW-month | $ | 1.75 | $ | 0.35 |
Due to the short-term, seasonal nature of the NYISO capacity auctions, we monetize the majority of our capacity through bilateral trades. Our capacity sales, aggregated by season through summer 2021, are as follows:
| Winter 2018 - 2019 | Summer 2019 | Winter 2019 - 2020 | Summer 2020 | Winter 2020 - 2021 | Summer 2021 | ||||||||||||||||||
| Auction capacity sold (MW) | 88 | — | — | — | — | — | |||||||||||||||||
| Bilateral capacity sold (MW) | 989 | 540 | 210 | 75 | 38 | 20 | |||||||||||||||||
| Total capacity sold (MW) | 1,077 | 540 | 210 | 75 | 38 | 20 | |||||||||||||||||
| Average price per kW-month | $ | 1.37 | $ | 2.71 | $ | 2.57 | $ | 3.15 | $ | 3.13 | $ | 3.08 |
ISO-NE — The most recent FCA results for ISO-NE Rest-of-Pool, in which most of our assets are located, are as follows for each planning year:
| 2018-2019 | 2019-2020 | 2020-2021 | 2021-2022 | 2022-2023 | |||||||||||||||
| Price per kW-month | $ | 9.55 | $ | 7.03 | $ | 5.30 | $ | 4.63 | $ | 3.80 |
Performance incentive rules went into effect for planning year 2018-2019, increasing capacity payments for those resources that are providing excess energy or reserves during a shortage event, while penalizing those that produce less than the required level. We continue to market and pursue longer term multi-year capacity transactions that extend planning year 2021-2022.
| 2018-2018 | 2019-2020 | 2020-2021 | 2021-2022 | 2022-2023 | |||||||||||||||
| Auction capacity sold (MW) | 3,108 | 3,161 | 3,079 | 2,592 | 3,137 | ||||||||||||||
| Bilateral capacity sold (MW) | 239 | 75 | 150 | 170 | 95 | ||||||||||||||
| Total capacity sold (MW) | 3,347 | 3,236 | 3,229 | 2,762 | 3,232 | ||||||||||||||
| Average price per kW-month | $ | 9.80 | $ | 7.02 | $ | 5.40 | $ | 4.80 | $ | 3.92 |
MISO — The capacity auction results for MISO Local Resource Zone 4, in which our assets are located, are as follows for each planning year:
| 2018-2019 | |||
| Price per MW-day | $ | 10.00 |
MISO capacity sales through planning year 2020-2021 are as follows:
| 2018-2019 | 2019-2020 | 2020-2021 | 2021-2022 | ||||||||||||
| Bilateral capacity sold in MISO (MW) | 2,533 | 2,047 | 1,663 | 667 | |||||||||||
| Base auction capacity sold in PJM (MW) | 227 | 260 | — | — | |||||||||||
| CP auction capacity sold in PJM (MW) | 835 | 356 | 444 | 798 | |||||||||||
| Total MISO segment capacity sold (MW) | 3,595 | 2,663 | 2,107 | 1,465 | |||||||||||
| Average price per kW-month | $ | 3.70 | $ | 3.62 | $ | 3.81 | $ | 4.22 |
CAISO — Our capacity sales, aggregated by calendar year for 2019 through 2021 for Moss Landing, are as follows:
| 2019 | 2020 | 2021 | ||||||
| Bilateral capacity sold (Avg MW) | 890 | — | — |
Key Operational Risks and Challenges
Following is a discussion of key operational risks and challenges facing management and the initiatives currently underway to manage such challenges. These matters involve risks that could have a material effect on our results of operations, liquidity or financial condition.
Natural Gas Price and Market Heat Rate Exposure
The price of power is typically set by natural gas-fueled generation facilities, with wholesale prices generally tracking increases or decreases in the price of natural gas. In recent years, natural gas supply has outpaced demand primarily as a result of development and expansion of hydraulic fracturing in natural gas extraction; the supply/demand imbalance has resulted in historically low natural gas prices, and such prices have historically been volatile. The table below shows the general decline in forward natural gas prices over the last several years (amounts are per MMBtu.)
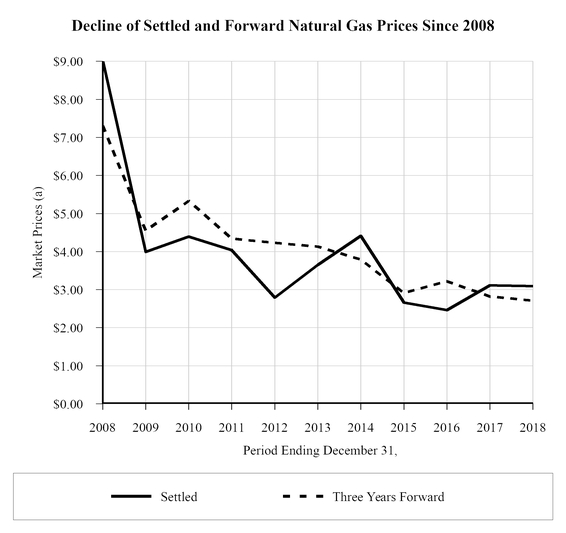
| (a) | Settled prices represent the average of NYMEX Henry Hub monthly settled prices of financial contracts for the year ending on the date presented. Forward prices represent the three-year average of NYMEX Henry Hub monthly forward prices at the date presented. Three-year forward prices are presented as such period is generally deemed to be a liquid period. |
In contrast to our natural gas-fueled generation facilities, changes in natural gas prices have no significant effect on the cost of generating power at our nuclear-, lignite- and coal-fueled facilities, which represent a substantial amount of our generation capacity. Consequently, all other factors being equal, these nuclear-, lignite- and coal-fueled generation assets increase or decrease in value as natural gas prices and market heat rates rise or fall, respectively, because of the effect on our operating margins from changes in wholesale electricity prices. A persistent decline in the price of natural gas, and the corresponding decline in the price of power, would likely have a material adverse effect on our results of operations, liquidity and financial condition, predominantly related to the production of power generation volumes in excess of the volumes utilized to service our retail customer load requirements.
The wholesale market price of electricity divided by the market price of natural gas represents the market heat rate. Market heat rate can be affected by a number of factors, including generation availability, mix of assets and the efficiency of the marginal supplier (generally natural gas-fueled generation facilities) in generating electricity. Our market heat rate exposure is impacted by changes in the availability of generation resources, such as additions and retirements of generation facilities, and mix of generation assets. For example, increasing renewable (wind and solar) generation capacity generally depresses market heat rates. Our heat rate exposure is also impacted by the potential economic backdown of our generation assets. Decreases in market heat rates decrease the value of our generation assets because lower market heat rates generally result in lower wholesale electricity prices, and vice versa. However, even though market heat rates have generally increased over the past several years, wholesale electricity prices have declined due to the greater effect of falling natural gas prices.
As a result of our exposure to the variability of natural gas prices and market heat rates, retail sales and hedging activities are critical to our operating results and maintaining consistent cash flow levels.
Our integrated power generation and retail electricity business provides us opportunities to hedge our generation position utilizing retail electricity markets as a sales channel. In addition, our approach to managing electricity price risk focuses on the following:
| • | employing disciplined, liquidity-efficient hedging and risk management strategies through physical and financial energy-related contracts intended to partially hedge gross margins; |
| • | continuing focus on cost management to better withstand gross margin volatility; |
| • | following a retail pricing strategy that appropriately reflects the value of our product offering to customers, the magnitude and costs of commodity price, liquidity risk and retail demand variability, and |
| • | improving retail customer service to attract and retain high-value customers. |
We have engaged in natural gas hedging activities to mitigate the risk of lower wholesale electricity prices that have corresponded to declines in natural gas prices. While current and forward natural gas prices are currently depressed, we continue to seek opportunities to manage our wholesale power price exposure through hedging activities, including forward wholesale and retail electricity sales.
Taking together forward wholesale, retail electricity sales and other retail customer considerations and all other hedging positions in ERCOT, at December 31, 2018, we had effectively hedged an estimated 99% and 91% of the natural gas price exposure related to our overall business for 2019 and 2020, respectively. These percentages assume conversion of generation positions based on market heat rates and an estimate of natural gas generally being on the margin 70% to 90% of the time in the ERCOT market. Additionally, taking into consideration our overall heat rate exposure and related hedging positions in ERCOT at December 31, 2018, we had effectively hedged 88% and 42% of the heat rate exposure to our overall business for 2019 and 2020, respectively. We make the distinction between natural gas price exposure and heat rate exposure for the ERCOT market because of the high percentage of time natural gas is on the margin and the availability of traded products in ERCOT to hedge heat rate directly. Generation volumes hedged in PJM, NYISO, ISO-NE, MISO and CAISO at December 31, 2018 were as follows:
| 2019 | 2020 | ||||
| PJM | 87 | % | 57 | % | |
| NYISO/ISO-NE | 81 | % | 29 | % | |
| MISO/CAISO | 65 | % | 35 | % |
The following sensitivity table provides approximate estimates of the potential impact of movements in natural gas prices and market heat rates on realized pretax earnings (in millions) taking into account the hedge positions noted in the paragraph above for the periods presented. The estimates related to price sensitivity are based on our expected generation and retail positions, related hedges and forward prices as of December 31, 2018.
| Balance 2019 (a) | 2020 | ||
| ERCOT: | |||
| $0.50/MMBtu increase in natural gas price (b) | $ ~50 | $ ~115 | |
| $0.50/MMBtu decrease in natural gas price (b) | $ ~(35) | $ ~(100) | |
| 1.0/MMBtu/MWh increase in market heat rate (c) | $ ~60 | $ ~165 | |
| 1.0/MMBtu/MWh decrease in market heat rate (c) | $ ~(45) | $ ~(150) | |
| PJM: | |||
| $0.50/MMBtu increase in natural gas price (d) | $ ~32 | $ ~93 | |
| $0.50/MMBtu decrease in natural gas price (d) | $ ~(22) | $ ~(72) | |
| 1.0/MMBtu/MWh increase in market heat rate (e) | $ ~33 | $ ~71 | |
| 1.0/MMBtu/MWh decrease in market heat rate (e) | $ ~(26) | $ ~(68) | |
| NYISO/ISO-NE: | |||
| $0.50/MMBtu increase in natural gas price (d) | $ ~11 | $ ~66 | |
| $0.50/MMBtu decrease in natural gas price (d) | $ ~(5) | $ ~(54) | |
| 1.0/MMBtu/MWh increase in market heat rate (f) | $ ~23 | $ ~62 | |
| 1.0/MMBtu/MWh decrease in market heat rate (f) | $ ~(11) | $ ~(50) | |
| MISO/CAISO: | |||
| $0.50/MMBtu increase in natural gas price (d) | $ ~85 | $ ~145 | |
| $0.50/MMBtu decrease in natural gas price (d) | $ ~(68) | $ ~(116) | |
| 1.0/MMBtu/MWh increase in market heat rate (g) | $ ~47 | $ ~73 | |
| 1.0/MMBtu/MWh decrease in market heat rate (g) | $ ~(42) | $ ~(65) |
| (a) | Balance of 2019 is from February 1, 2019 through December 31, 2019. |
| (b) | Based on Houston Ship Channel natural gas prices at December 31, 2018. |
| (c) | Based on ERCOT North Hub around-the-clock heat rates at December 31, 2018. |
| (d) | Based on NYMEX natural gas prices at December 31, 2018. |
| (e) | Based on AEP Dayton Hub, Northern Illinois Hub and PJM West Hub around-the-clock heat rates at December 31, 2018. |
| (f) | Based on Massachusetts Hub and NYISO Zone C around-the-clock heat rates at December 31, 2018. |
| (g) | Based on Indiana Hub and NP15 around-the-clock heat rates at December 31, 2018. |
Competitive Retail Markets and Customer Retention
Competitive retail activity in ERCOT has resulted in retail customer churn as customers switch retail electricity providers for various reasons. Based on numbers of meters, our total retail customer counts increased 2% in 2018, increased slightly in 2017 and declined approximately 1% in 2016. Based upon December 31, 2018 results discussed below in Results of Operations, a 1% decline in retail customers would result in a decline in annual revenues of approximately $55 million. In responding to the competitive landscape in the ERCOT market, we have attempted to reduce overall customer losses by focusing on the following key initiatives:
| • | Maintaining competitive pricing initiatives on residential service plans; |
| • | Actively competing for new customers in areas open to competition within ERCOT, while continuing to strive to enhance the experience of our existing customers; we are focused on continuing to implement initiatives that deliver world-class customer service and improve the overall customer experience; |
| • | Establishing and leveraging our TXU EnergyTM brand in the sale of electricity to residential and commercial customers, as the most innovative retailer in the ERCOT market by continuing to develop tailored product offerings to meet customer needs, and |
| • | Focusing market initiatives largely on programs targeted at retaining the existing highest-value customers and to recapturing customers who have switched REPs, including maintaining and continuously refining a disciplined contracting and pricing approach and economic segmentation of the business market to enhance targeted sales and marketing efforts and to more effectively deploy our direct-sales force; tactical programs we have initiated include improved customer service, aided by an enhanced customer management system, new product price/service offerings and a multichannel approach for the small business market. |
Exposures Related to Nuclear Asset Outages
Our nuclear assets are comprised of two generation units at the Comanche Peak facility, each with an installed nameplate generation capacity of 1,150 MW. As of December 31, 2018, these units represented approximately 6% of our total generation capacity. The nuclear generation units represent our lowest marginal cost source of electricity. Assuming both nuclear generation units experienced an outage at the same time, the unfavorable impact to pretax earnings is estimated (based upon forward electricity market prices for 2019 at December 31, 2018) to be approximately $1 million per day before consideration of any costs to repair the cause of such outages or receipt of any insurance proceeds. Also see discussion of nuclear facilities insurance in Note 15 to the Financial Statements.
The inherent complexities and related regulations associated with operating nuclear generation facilities result in environmental, regulatory and financial risks. The operation of nuclear generation facilities is subject to continuing review and regulation by the NRC, covering, among other things, operations, maintenance, emergency planning, security, and environmental and safety protection. The NRC may implement changes in regulations that result in increased capital or operating costs and may require extended outages, modify, suspend or revoke operating licenses and impose fines for failure to comply with its existing regulations and the provisions of the Atomic Energy Act. In addition, an unplanned outage at another nuclear generation facility could result in the NRC taking action to shut down our Comanche Peak units as a precautionary measure.
We participate in industry groups and with regulators to keep current on the latest developments in nuclear safety, operation and maintenance and on emerging threats and mitigating techniques. These groups include, but are not limited to, the NRC, the Institute of Nuclear Power Operations (INPO) and the Nuclear Energy Institute (NEI). We also apply the knowledge gained through our continuing investment in technology, processes and services to improve our operations and to detect, mitigate and protect our nuclear generation assets. Management continues to focus on the safe, reliable and efficient operations at the facility.
Cyber/Data Security and Infrastructure Protection Risk
A breach of cyber/data security measures that impairs our information technology infrastructure could disrupt normal business operations and affect our ability to control our generation assets, access retail customer information and limit communication with third parties. Any loss of confidential or proprietary data through a breach could materially affect our reputation, including our TXU EnergyTM, Dynegy Energy Services and Homefield Energy brands, expose the company to legal claims or impair our ability to execute on business strategies.
We participate in industry groups and with regulators to remain current on emerging threats and mitigating techniques. These groups include, but are not limited to, the U.S. Cyber Emergency Response Team, the National Electric Sector Cyber Security Organization, the NRC and NERC.
While the company has not experienced a cyber/data event causing any material operational, reputational or financial impact, we recognize the growing threat within the general market place and our industry, and are proactively making strategic investments in our perimeter and internal defenses, cyber/data security operations center and regulatory compliance activities. We also apply the knowledge gained through industry and government organizations to continuously improve our technology, processes and services to detect, mitigate and protect our cyber and data assets.
Seasonality
The demand for and market prices of electricity and natural gas are affected by weather. As a result, our operating results may fluctuate on a seasonal basis. Typically, demand for and the price of electricity is higher in the summer and winter seasons, when the temperatures are more extreme, and the demand for and price of natural gas is also generally higher in the winter. More severe weather conditions such as heat waves or extreme winter weather may make such fluctuations more pronounced. However, not all regions of the U.S. typically experience extreme weather conditions at the same time, so Vistra Energy is typically not exposed to the effects of extreme weather in all parts of its business at once. The pattern of this fluctuation may change depending on, among other things, the retail load served and the terms of contracts to purchase or sell electricity.
Application of Critical Accounting Policies
Our significant accounting policies are discussed in Note 1 to the Financial Statements. We follow accounting principles generally accepted in the U.S. Application of these accounting policies in the preparation of our consolidated financial statements requires management to make estimates and assumptions about future events that affect the reporting of assets and liabilities at the balance sheet dates and revenues and expenses during the periods covered. The following is a summary of certain critical accounting policies that are impacted by judgments and uncertainties and under which different amounts might be reported using different assumptions or estimation methodologies.
Purchase Accounting
On the Merger Date, Dynegy merged with and into Vistra Energy, with Vistra Energy continuing as the surviving corporation. The Merger is being accounted for in accordance with ASC 805, Business Combinations (ASC 805), with identifiable assets acquired and liabilities assumed recorded at their estimated fair values on the Merger Date. Vistra Energy is the acquirer for both federal tax and accounting purposes. The combined results of operations are reported in our consolidated financial statements beginning as of the Merger Date. See Note 2 to the Financial Statements.
During the measurement period, which is up to one year from the Merger date, we record adjustments to the initial estimates in the reporting period in which the adjustment amounts are determined based on facts and circumstances that existed as of the acquisition date. We expect to finalize our purchase price allocation in the quarter ended March 31, 2019. Upon the conclusion of the measurement period, any subsequent adjustments will be recorded to earnings. Transaction costs have been expensed as incurred.
The acquired assets and liabilities that involved the most subjectivity in determining fair value consisted of property, plant and equipment and executory contracts, primarily long-term service agreements for maintenance of power plants and a unit-specific power sales agreement. The fair value of each power plant was estimated using a combination of an income approach and a market approach. The income approach is the present value of future cash flows over the life of each power plant that are based on management’s estimates of revenues and operating expenses, and appropriate discount rates. The estimate of long term prices of electricity and natural gas at each plant location that was used in developing forecasted revenues for the income approach was especially subjective, because as of the Merger Date, limited market information about future prices beyond the year 2022 was available. The market valuation method uses prices paid for a reasonably similar asset by other purchasers in the relevant market, with adjustments relating to any differences between the assets and locations. The determination of deferred tax assets was complex as it required assessing income tax rules and regulations and proposed regulations that impose limitations on the future use of acquired net operating losses and other limitations on deductions.
Accounting in Reorganization and Fresh-Start Reporting
The consolidated financial statements of our Predecessor reflect the application of ASC 852. During the Chapter 11 Cases, the Debtors, including our Predecessor and its subsidiaries, operated their businesses as debtors-in-possession under the jurisdiction of the Bankruptcy Court and in accordance with the applicable provisions of the Bankruptcy Code. ASC 852 applies to entities that have filed a petition for bankruptcy under Chapter 11 of the Bankruptcy Code. The guidance requires that transactions and events directly associated with the reorganization be distinguished from the ongoing operations of the business. In addition, the guidance provides for changes in the accounting and presentation of liabilities. Expenses and income directly associated with the Chapter 11 Cases are reported separately in the statements of consolidated income (loss) as reorganization items. Reorganization items also include adjustments to reflect the carrying value of liabilities subject to compromise (LSTC) at their estimated allowed claim amounts, as such adjustments are determined. See Note 5 to the Financial Statements.
As of the Effective Date, Vistra Energy applied fresh-start reporting under the applicable provisions of ASC 852. Fresh-start reporting includes (1) distinguishing the consolidated financial statements of the entity that was previously in restructuring from the consolidated financial statements of the entity that emerges from restructuring, (2) assigning the reorganized value of the successor entity by measuring all assets and liabilities of the successor entity at fair value, and (3) selecting accounting policies for the successor entity. The effects from emerging from bankruptcy, including the extinguishment of liabilities, as well as the fresh start reporting adjustments are reported in the Predecessor's statement of consolidated income (loss). The consolidated financial statements of Vistra Energy for periods subsequent to the Effective Date are not comparable to the financial statements of our Predecessor for periods prior to the Effective Date, as those previous periods do not give effect to any adjustments to the carrying values of assets or amounts of liabilities, nor any differences in accounting policies that were a consequence of the Plan of Reorganization or the related application of fresh-start reporting. See Note 6 to the Financial Statements.
Derivative Instruments and Mark-to-Market Accounting
We enter into contracts for the purchase and sale of energy-related commodities, and also enter into other derivative instruments such as options, swaps, futures and forwards primarily to manage commodity price and interest rate risks. Under accounting standards related to derivative instruments and hedging activities, these instruments are subject to mark-to-market accounting, and the determination of market values for these instruments is based on numerous assumptions and estimation techniques.
Mark-to-market accounting recognizes changes in the fair value of derivative instruments in the financial statements as market prices change. Such changes in fair value are accounted for as unrealized mark-to-market gains and losses in net income with an offset to derivative assets and liabilities. The availability of quoted market prices in energy markets is dependent on the type of commodity (e.g., natural gas, electricity, etc.), time period specified and delivery point. In computing fair value for derivatives, each forward pricing curve is separated into liquid and illiquid periods. The liquid period varies by delivery point and commodity. Generally, the liquid period is supported by exchange markets, broker quotes and frequent trading activity. For illiquid periods, fair value is estimated based on forward price curves developed using modeling techniques that take into account available market information and other inputs that might not be readily observable in the market. We estimate fair value as described in Note 17 to the Financial Statements.
Accounting standards related to derivative instruments and hedging activities allow for normal purchase or sale elections and hedge accounting designations, which generally eliminate or defer the requirement for mark-to-market recognition in net income and thus reduce the volatility of net income that can result from fluctuations in fair values. Normal purchases and sales are contracts that provide for physical delivery of quantities expected to be used or sold over a reasonable period in the normal course of business and are not subject to mark-to-market accounting if the normal purchase or sale election is made. Accounting standards also permit an entity to designate certain qualifying derivative contracts in a hedge accounting relationship, whereby changes in fair value are not recognized immediately in earnings. Vistra Energy does not have derivative instruments with hedge accounting designations.
We report derivative assets and liabilities in the consolidated balance sheets without taking into consideration netting arrangements that we have with counterparties. Margin deposits that contractually offset these assets and liabilities are reported separately in the consolidated balance sheets, with the exception of certain margin amounts related to changes in fair value on CME transactions that, beginning in January 2017, are legally characterized as settlement of derivative contracts rather than collateral.
See Note 18 to the Financial Statements for further discussion regarding derivative instruments.
Accounting for Income Taxes
Subsequent to the Effective Date, Vistra Energy files a United States federal income tax return that includes the results of its consolidated subsidiaries. Vistra Energy is the corporate parent of the Vistra Energy consolidated group. Pursuant to applicable United States Treasury regulations and published guidance of the IRS, corporations that are members of a consolidated group have joint and several liability for the taxes of such group.
Our income tax expense and related consolidated balance sheet amounts involve significant management estimates and judgments. Amounts of deferred income tax assets and liabilities, as well as current and noncurrent accruals, involve estimates and judgments of the timing and probability of recognition of income and deductions by taxing authorities. In assessing the likelihood of realization of deferred tax assets, management considers estimates of the amount and character of future taxable income. Actual income taxes could vary from estimated amounts due to the future impacts of various items, including changes in income tax laws, our forecasted financial condition and results of operations in future periods, as well as final review of filed tax returns by taxing authorities. Income tax returns are regularly subject to examination by applicable tax authorities. In management's opinion, the liability recorded pursuant to income tax accounting guidance related to uncertain tax positions reflects future taxes that may be owed as a result of any examination.
Our deferred tax assets were significantly impacted by the TCJA, which reduced the overall federal corporate rate from 35% to 21%. This rate change decreased our overall deferred tax asset balance by approximately $451 million during the year ended December 31, 2017.
See Notes 1 and 9 to the Financial Statements for discussion of income tax matters.
Accounting for Tax Receivable Agreement
On the Effective Date, we entered into a tax receivable agreement (the TRA) with a transfer agent. Pursuant to the TRA, we issued beneficial interests in the rights to receive payments under the TRA (the TRA Rights) to the first lien creditors of our Predecessor to be held in escrow for the benefit of the first lien creditors of our Predecessor entitled to receive such TRA Rights under the Plan of Reorganization. Vistra Energy reflected the obligation associated with TRA Rights at fair value in the amount of $574 million as of the Emergence Date related to these future payment obligations. As of December 31, 2018, the TRA obligation has been adjusted to $420 million. During the year ended December 31, 2018, we recorded an increase to the carrying value of the TRA obligation totaling $14 million. The largest driver in the increase to the TRA obligation carrying value primarily resulted from in the timing of estimated payments and new multistate tax impacts resulting from the Merger, which increased the total expected undiscounted payments under the TRA from $1.2 billion to $1.4 billion. The TRA obligation value is the discounted amount of estimated payments to be made each year under the TRA, based on certain assumptions, including but not limited to:
| • | the amount of tax basis related to (i) the Lamar and Forney acquisition and (ii) step-up resulting from the PrefCo Preferred Stock Sale (which is estimated to be approximately $5.5 billion) and the allocation of such tax basis step-up among the assets subject thereto; |
| • | the depreciable lives of the assets subject to such tax basis step-up, which generally is expected to be 15 years for most of such assets; |
| • | a blended federal/state corporate income tax rate in all future years of 23%; |
| • | future taxable income by year for future years; |
| • | the Company generally expects to generate sufficient taxable income to be able to utilize the deductions arising out of (i) the tax basis step up attributable to the PrefCo Preferred Stock Sale, (ii) the entire tax basis of the assets acquired as a result of the Lamar and Forney Acquisition, and (iii) tax benefits related to imputed interest deemed to be paid by us as a result of payments under the TRA in the tax year in which such deductions arise; |
| • | a discount rate of 15%, which represented our view at the Emergence Date of the rate that a market participant would use based on the risk associated with the uncertainty in the amount and timing of the cash flows, at the time of Emergence, and |
| • | additional states that Vistra Energy now operates in, the relevant tax rates of those states and how income will be apportioned to those states. |
We recognize accretion expense over the life of the TRA Rights liability as the present value of the liability is accreted up over the life of the liability. This noncash accretion expense is reported in the statements of consolidated income (loss) as Impacts of Tax Receivable Agreement. Further, there may be significant changes, which may be material, to the estimate of the related liability due to various reasons including changes in corporate tax law, changes in estimates of the amount or timing of future taxable income of Vistra Energy and its subsidiaries and other items. Changes in those estimates are recognized as adjustments to the related TRA Rights liability, with offsetting impacts recorded in the statements of consolidated income (loss) as Impacts of Tax Receivable Agreement. See Note 10 to the Financial Statements.
Asset Retirement Obligations (ARO)
As part of fresh start reporting, new fair values were established for all AROs for the Successor. As part of business combination accounting, new fair values were established for all AROs assumed in the Merger. A liability is initially recorded at fair value for an asset retirement obligation associated with the legal obligation associated with law, regulatory, contractual or constructive retirement requirements of tangible long-lived assets in the period in which it is incurred if a fair value is reasonably estimable. Generally, changes in estimates related to ARO obligations are recorded as increases or decreases to the liability and related asset as information becomes available. Changes in estimates related to assets that have been retired or for which capitalized costs are not recoverable are reflected in the statement of consolidated income (loss).
During the year ended December 31, 2017, we recorded additional ARO obligations totaling $112 million primarily reflecting the acceleration of ARO obligations due to the retirements of our Monticello, Sandow and Big Brown plants. In addition, we recorded additional ARO obligations totaling $62 million as part of acquiring certain real property through the Alcoa contract settlement.
See Note 23 to the Financial Statements for additional discussion of ARO obligations.
Impairment of Goodwill and Other Long-Lived Assets
We evaluate long-lived assets (including intangible assets with finite lives) for impairment, in accordance with accounting standards related to impairment or disposal of long-lived assets, whenever events or changes in circumstances indicate that their carrying amount may not be recoverable. For our generation assets, possible indications include an expectation of continuing long-term declines in natural gas prices and/or market heat rates or an expectation that "more likely than not" a generation asset will be sold or otherwise disposed of significantly before the end of its estimated useful life. The determination of the existence of these and other indications of impairment involves judgments that are subjective in nature and may require the use of estimates in forecasting future results and cash flows related to an asset or group of assets. Further, the unique nature of our property, plant and equipment, which includes a fleet of generation assets with a diverse fuel mix and individual generation units that have varying production or output rates, requires the use of significant judgments in determining the existence of impairment indications and the grouping of assets for impairment testing. We generally utilize an income approach measurement to derive fair values for our long-lived generation assets. The income approach involves estimates of future performance that reflect assumptions regarding, among other things, forward natural gas and electricity prices, market heat rates, the effects of environmental rules, generation plant performance, forecasted capital expenditures and forecasted fuel prices. Any significant change to one or more of these factors can have a material impact on the fair value measurement of our long-lived assets. Additional material impairments related to our generation facilities may occur in the future if forward wholesale electricity prices decline in the markets in which we operate in or if additional environmental regulations increase the cost of producing electricity at our generation facilities.
Goodwill and intangible assets with indefinite useful lives, such as the intangible asset related to the TXU EnergyTM, 4Change EnergyTM, Homefield and Dynegy Energy Services brands, are required to be tested for impairment at least annually (as of the Effective Date, we have selected October 1 as our annual test date) or whenever events or changes in circumstances indicate an impairment may exist, such as the indicators used to evaluate impairments to long-lived assets discussed above or declines in values of comparable public companies in our industry. Accounting standards allow a company to qualitatively assess if the carrying value of a reporting unit with goodwill is more likely than not less than the fair value of that reporting unit. If the entity determines the carrying value, including goodwill, is not more likely greater than the fair value, no further testing of goodwill for impairment is required. On the most recent goodwill testing date, we applied qualitative factors and determined that it was more likely than not that the fair value of our ERCOT Retail reporting unit exceeded its carrying value at October 1, 2018. Significant qualitative factors evaluated included reporting unit financial performance and market multiples, cost factors, customer attrition, interest rates and changes in reporting unit book value.
Accounting guidance requires goodwill to be allocated to our reporting units, and at December 31, 2018, $1.907 billion of our goodwill was allocated to our ERCOT Retail reporting unit and $161 million arose in connection with the Merger and is recorded at the corporate and other level non-segment operations pending completion of the purchase price allocation in the first quarter of 2019, at which time goodwill will be allocated to reporting units. Goodwill impairment testing is performed at the reporting unit level. Under this goodwill impairment analysis, if at the assessment date, a reporting unit's carrying value exceeds its estimated fair value (enterprise value), the estimated enterprise value of the reporting unit is compared to the estimated fair values of the reporting unit's assets (including identifiable intangible assets) and liabilities at the assessment date, and the resultant implied goodwill amount is then compared to the recorded goodwill amount. Any excess of the recorded goodwill amount over the implied goodwill amount is written off as an impairment charge.
The determination of enterprise value involves a number of assumptions and estimates. We use a combination of fair value measurements to estimate enterprise values of our reporting units including: internal discounted cash flow analyses (income approach), and comparable publicly traded company values (market approach). The income approach involves estimates of future performance that reflect assumptions regarding, among other things, forward natural gas and electricity prices, market heat rates, the effects of environmental rules, generation plant performance, forecasted capital expenditures and retail sales volume trends, as well as determination of a terminal value. Another key variable in the income approach is the discount rate, or weighted average cost of capital, applied to the forecasted cash flows. The determination of the discount rate takes into consideration the capital structure, credit ratings and current debt yields of comparable publicly traded companies as well as an estimate of return on equity that reflects historical market returns and current market volatility for the industry. The market approach involves using trading multiples of EBITDA of those selected publicly traded companies to derive appropriate multiples to apply to the EBITDA of our reporting units. Critical judgments include the selection of publicly traded comparable companies and the weighting of the value metrics in developing the best estimate of enterprise value.
RESULTS OF OPERATIONS
Vistra Energy Consolidated Financial Results — Successor Years Ended December 31, 2018 and 2017 and the period from October 3, 2016 through December 31, 2016
| Successor | |||||||||||||||
| Year Ended December 31, | Favorable (Unfavorable) $ Change | Period from October 3, 2016 through December 31, 2016 | |||||||||||||
| 2018 | 2017 | ||||||||||||||
| Operating revenues | $ | 9,144 | $ | 5,430 | $ | 3,714 | $ | 1,191 | |||||||
| Fuel, purchased power costs and delivery fees | (5,036 | ) | (2,935 | ) | (2,101 | ) | (720 | ) | |||||||
| Operating costs | (1,297 | ) | (973 | ) | (324 | ) | (208 | ) | |||||||
| Depreciation and amortization | (1,394 | ) | (699 | ) | (695 | ) | (216 | ) | |||||||
| Selling, general and administrative expenses | (926 | ) | (600 | ) | (326 | ) | (208 | ) | |||||||
| Impairment of long-lived assets | — | (25 | ) | 25 | — | ||||||||||
| Operating income | 491 | 198 | 293 | (161 | ) | ||||||||||
| Other income | 47 | 37 | 10 | 10 | |||||||||||
| Other deductions | (5 | ) | (5 | ) | — | — | |||||||||
| Interest expense and related charges | (572 | ) | (193 | ) | (379 | ) | (60 | ) | |||||||
| Impacts of Tax Receivable Agreement | (79 | ) | 213 | (292 | ) | (22 | ) | ||||||||
| Equity in earnings of unconsolidated investment | 17 | — | 17 | — | |||||||||||
| Income before income taxes | (101 | ) | 250 | (351 | ) | (233 | ) | ||||||||
| Income tax (expense) benefit | 45 | (504 | ) | 549 | 70 | ||||||||||
| Net income (loss) | $ | (56 | ) | $ | (254 | ) | $ | 198 | $ | (163 | ) |
| Successor | |||||||||||||||||||||||||||||||
| Year Ended December 31, 2018 | |||||||||||||||||||||||||||||||
| Retail | ERCOT | PJM | NY/NE | MISO | Asset Closure | Eliminations / Corporate and Other | Vistra Energy Consolidated | ||||||||||||||||||||||||
| Operating revenues | $ | 5,597 | $ | 2,634 | $ | 1,725 | $ | 817 | $ | 720 | $ | 50 | $ | (2,399 | ) | $ | 9,144 | ||||||||||||||
| Fuel, purchased power costs and delivery fees | (4,126 | ) | (1,521 | ) | (917 | ) | (485 | ) | (420 | ) | (40 | ) | 2,473 | (5,036 | ) | ||||||||||||||||
| Operating costs | (39 | ) | (677 | ) | (243 | ) | (74 | ) | (202 | ) | (43 | ) | (19 | ) | (1,297 | ) | |||||||||||||||
| Depreciation and amortization | (318 | ) | (416 | ) | (413 | ) | (152 | ) | (9 | ) | — | (86 | ) | (1,394 | ) | ||||||||||||||||
| Selling, general and administrative expenses | (424 | ) | (90 | ) | (52 | ) | (36 | ) | (53 | ) | (17 | ) | (254 | ) | (926 | ) | |||||||||||||||
| Operating income (loss) | 690 | (70 | ) | 100 | 70 | 36 | (50 | ) | (285 | ) | 491 | ||||||||||||||||||||
| Other income | 29 | 34 | 1 | — | — | 2 | (19 | ) | 47 | ||||||||||||||||||||||
| Other deductions | — | (7 | ) | — | — | — | (1 | ) | 3 | (5 | ) | ||||||||||||||||||||
| Interest expense and related charges | (7 | ) | (12 | ) | (8 | ) | (2 | ) | (1 | ) | — | (542 | ) | (572 | ) | ||||||||||||||||
| Impacts of Tax Receivable Agreement | — | — | — | — | — | — | (79 | ) | (79 | ) | |||||||||||||||||||||
| Equity in earnings of unconsolidated investment | — | — | 7 | 11 | — | — | (1 | ) | 17 | ||||||||||||||||||||||
| Income (loss) before income taxes | 712 | (55 | ) | 100 | 79 | 35 | (49 | ) | (923 | ) | (101 | ) | |||||||||||||||||||
| Income tax benefit | — | — | — | — | — | — | 45 | 45 | |||||||||||||||||||||||
| Net income (loss) | $ | 712 | $ | (55 | ) | $ | 100 | $ | 79 | $ | 35 | $ | (49 | ) | $ | (878 | ) | $ | (56 | ) |
| Successor | |||||||||||||||||||
| Year Ended December 31, 2017 | |||||||||||||||||||
| Retail | ERCOT | Asset Closure | Eliminations / Corporate and Other | Vistra Energy Consolidated | |||||||||||||||
| Operating revenues | $ | 4,058 | $ | 1,794 | $ | 964 | $ | (1,386 | ) | $ | 5,430 | ||||||||
| Fuel, purchased power costs and delivery fees | (2,733 | ) | (981 | ) | (607 | ) | 1,386 | (2,935 | ) | ||||||||||
| Operating costs | (14 | ) | (578 | ) | (380 | ) | (1 | ) | (973 | ) | |||||||||
| Depreciation and amortization | (430 | ) | (229 | ) | (1 | ) | (39 | ) | (699 | ) | |||||||||
| Selling, general and administrative expenses | (420 | ) | (124 | ) | (19 | ) | (37 | ) | (600 | ) | |||||||||
| Impairment of long-lived assets | — | — | (25 | ) | — | (25 | ) | ||||||||||||
| Operating income (loss) | 461 | (118 | ) | (68 | ) | (77 | ) | 198 | |||||||||||
| Other income | 34 | 24 | 6 | (27 | ) | 37 | |||||||||||||
| Other deductions | — | (3 | ) | (1 | ) | (1 | ) | (5 | ) | ||||||||||
| Interest expense and related charges | — | (21 | ) | — | (172 | ) | (193 | ) | |||||||||||
| Impacts of Tax Receivable Agreement | — | — | — | 213 | 213 | ||||||||||||||
| Income (loss) before income taxes | 495 | (118 | ) | (63 | ) | (64 | ) | 250 | |||||||||||
| Income tax expense | — | — | — | (504 | ) | (504 | ) | ||||||||||||
| Net income (loss) | $ | 495 | $ | (118 | ) | $ | (63 | ) | $ | (568 | ) | $ | (254 | ) |
We believe 2018 was a very successful year for Vistra Energy. We completed the transformational Merger with Dynegy in April. We reduced post-acquisition consolidated debt by approximately $1.7 billion and refinanced an additional approximately $11 billion of debt and revolving credit commitments at lower interest rates and extended maturities. We completed construction of the Upton 2 solar project and our first battery storage facility located at the Upton 2 site. In addition, we were awarded a contract to develop the largest battery storage facility in North America. In 2018, we also executed a balanced capital allocation plan, returning approximately $762 million to stockholders via share repurchases. For the year ended December 31, 2018, net loss includes $380 million in unrealized mark-to-market losses on commodity risk management activity in 2018 resulting from higher forward power prices, principally driven by higher market heat rates. Our operating segments delivered strong operating performance with a disciplined focus on cost management, while generating and selling electricity in a safe and reliable manner.
Consolidated results increased $198 million to net loss of $56 million in the year ended December 31, 2018 compared to the year ended December 31, 2017. The change in results was driven by additional operations acquired in the Merger, increased prices and volumes in the ERCOT segment, favorable volumes in the Retail segment, and the impact of the Comanche Peak outage in 2017 and related insurance proceeds, partially offset by increased unrealized mark-to-market losses on commodity risk management activity, one-time Merger-related expenses including severance and transaction fees and the first quarter of 2018 plant retirements.
Interest expense and related charges increased $379 million to $572 million in the year ended December 31, 2018 compared to the year ended December 31, 2017 and reflected a $324 million increase in interest expense incurred reflecting long-term debt assumed in the Merger, $34 million change in unrealized mark-to-market gains/losses on interest rate swaps and a debt extinguishment loss of $27 million in 2018. See Note 11 to the Financial Statements.
For the year ended December 31, 2018, the Impacts of the Tax Receivable Agreement totaled expense of $79 million and reflected a loss due to changes in the estimated amount and timing of TRA payments totaling $14 million and accretion expense totaling $65 million. For the year ended December 31, 2017, the Impacts of the Tax Receivable Agreement totaled income of $213 million and reflected a gain due to changes in the estimated timing of TRA payments totaling $295 million, partially offset by accretion expense totaling $82 million. See Note 10 to the Financial Statements for discussion of the impacts of the Tax Receivable Agreement Obligation.
For the year ended December 31, 2018, income tax benefit totaled $45 million and the effective tax rate was 44.6%. For the year ended December 31, 2017, income tax expense totaled $504 million. The effective tax rate in 2017 of 201.6% was higher than the U.S. Federal Statutory rate of 35% primarily due to a $451 million reduction of deferred tax assets related to the decrease in the corporate rate in the TCJA, partially offset by $80 million of tax impacts related to nondeductible TRA accretion. See Note 9 to the Financial Statements for reconciliation of the effective rates to the U.S. federal statutory rate.
| Successor | |||||||||||||||||||
| Period from October 3, 2016 through December 31, 2016 | |||||||||||||||||||
| Retail | ERCOT | Asset Closure | Eliminations / Corporate and Other | Vistra Energy Consolidated | |||||||||||||||
| Operating revenues | $ | 912 | $ | 212 | $ | 238 | $ | (171 | ) | $ | 1,191 | ||||||||
| Fuel, purchased power costs and delivery fees | (515 | ) | (214 | ) | (162 | ) | 171 | (720 | ) | ||||||||||
| Operating costs | (3 | ) | (151 | ) | (54 | ) | — | (208 | ) | ||||||||||
| Depreciation and amortization | (153 | ) | (53 | ) | — | (10 | ) | (216 | ) | ||||||||||
| Selling, general and administrative expenses | (130 | ) | (65 | ) | (6 | ) | (7 | ) | (208 | ) | |||||||||
| Operating income (loss) | 111 | (271 | ) | 16 | (17 | ) | (161 | ) | |||||||||||
| Other income | 3 | 2 | 1 | 4 | 10 | ||||||||||||||
| Interest expense and related charges | — | 1 | — | (61 | ) | (60 | ) | ||||||||||||
| Impacts of Tax Receivable Agreement | — | — | — | (22 | ) | (22 | ) | ||||||||||||
| Income (loss) before income taxes | 114 | $ | (268 | ) | $ | 17 | (96 | ) | (233 | ) | |||||||||
| Income tax benefit | — | — | — | 70 | 70 | ||||||||||||||
| Net income (loss) | $ | 114 | $ | (268 | ) | $ | 17 | $ | (26 | ) | $ | (163 | ) |
Consolidated net loss totaled $163 million for the period from October 3, 2016 through December 31, 2016. Results were primarily driven by:
| • | Retail segment net income of $114 million for the period, which was primarily driven by favorable profit margins, including $113 million of unrealized gains in purchased power costs on positions with the ERCOT segment. |
| • | ERCOT segment net loss of $268 million for the period, which was primarily driven by unrealized mark-to-market losses on commodity risk management activities totaling $273 million for the period (including $113 million of unrealized losses on positions with the Retail segment and $22 million of unrealized gains on hedging activities for fuel and purchased power costs). The unrealized losses were driven by increases in forward natural gas prices during the period. |
Interest expense and related charges totaled $60 million and reflected $51 million of interest expense incurred and $11 million of unrealized mark-to-market losses on interest rate swaps (see Note 11 to the Financial Statements).
Impacts of the Tax Receivable Agreement were a loss of $22 million, which reflected accretion expense during the period. See Note 10 to the Financial Statements for discussion of the impacts of the Tax Receivable Agreement obligation.
Income tax benefit totaled $70 million. The effective tax rate was 30.0%. See Note 9 to the Financial Statements for reconciliation of this effective rate to the U.S. federal statutory rate.
Discussion of Adjusted EBITDA
Non-GAAP Measures — In analyzing and planning for our business, we supplement our use of GAAP financial measures with non-GAAP financial measures, including EBITDA and Adjusted EBITDA as performance measures. These non-GAAP financial measures reflect an additional way of viewing aspects of our business that, when viewed with our GAAP results and the accompanying reconciliations to corresponding GAAP financial measures included in the tables below, may provide a more complete understanding of factors and trends affecting our business. These non-GAAP financial measures should not be relied upon to the exclusion of GAAP financial measures and are by definition an incomplete understanding of Vistra Energy and must be considered in conjunction with GAAP measures. In addition, non-GAAP financial measures are not standardized; therefore, it may not be possible to compare these financial measures with other companies' non-GAAP financial measures having the same or similar names. We strongly encourage investors to review our consolidated financial statements and publicly filed reports in their entirety and not rely on any single financial measure.
EBITDA and Adjusted EBITDA — We believe EBITDA and Adjusted EBITDA provide meaningful representations of our operating performance. We consider EBITDA as another way to measure financial performance on an ongoing basis. Adjusted EBITDA is meant to reflect the operating performance of our segments for the period presented. We define EBITDA as earnings (loss) before interest expense, income tax expense (benefit) and depreciation and amortization expense. We define Adjusted EBITDA as EBITDA adjusted to exclude (i) gains or losses on the sale or retirement of certain assets, (ii) the impacts of mark-to-market changes on derivatives related to our portfolio, (iii) the impact of impairment charges, (iv) certain amounts associated with fresh-start reporting, acquisitions, dispositions, transition costs or restructurings, (v) non-cash compensation expense, (vi) impacts from the Tax Receivable Agreement and (vii) other material nonrecurring or unusual items.
Because EBITDA and Adjusted EBITDA are financial measures that management uses to allocate resources, determine our ability to fund capital expenditures, assess performance against our peers, and evaluate overall financial performance, we believe they provide useful information for our shareholders.
When EBITDA or Adjusted EBITDA is discussed in reference to performance on a consolidated basis, the most directly comparable GAAP financial measure to EBITDA and Adjusted EBITDA is Net income (loss).
Adjusted EBITDA — Successor Years Ended December 31, 2018 and 2017 and the period from October 3, 2016 through December 31, 2016
| Successor | |||||||||||||||
| Year Ended December 31, | Favorable (Unfavorable) $ Change | Period from October 3, 2016 through December 31, 2016 | |||||||||||||
| 2018 | 2017 | ||||||||||||||
| Net income (loss) | $ | (56 | ) | $ | (254 | ) | $ | 198 | $ | (163 | ) | ||||
| Income tax expense (benefit) | (45 | ) | 504 | (549 | ) | (70 | ) | ||||||||
| Interest expense and related charges | 572 | 193 | 379 | 60 | |||||||||||
| Depreciation and amortization (a) | 1,472 | 781 | 691 | 247 | |||||||||||
| EBITDA before Adjustments | 1,943 | 1,224 | 719 | 74 | |||||||||||
| Unrealized net loss resulting from hedging transactions | 380 | 146 | 234 | 165 | |||||||||||
| Generation plant retirement expenses | — | 206 | (206 | ) | — | ||||||||||
| Fresh start/purchase accounting impacts | 41 | 59 | (18 | ) | 35 | ||||||||||
| Impacts of Tax Receivable Agreement | 79 | (213 | ) | 292 | 22 | ||||||||||
| Reorganization items and restructuring expenses | — | 3 | (3 | ) | 18 | ||||||||||
| Non-cash compensation expenses | 73 | 19 | 54 | — | |||||||||||
| Transition and merger expenses | 233 | 27 | 206 | — | |||||||||||
| Severance | — | — | — | 44 | |||||||||||
| Other, net | (7 | ) | (16 | ) | 9 | 10 | |||||||||
| Adjusted EBITDA, including Odessa earnout buybacks | $ | 2,742 | $ | 1,455 | $ | 1,287 | $ | 368 | |||||||
| Odessa earnout buybacks | 18 | — | 18 | ||||||||||||
| Adjusted EBITDA | $ | 2,760 | $ | 1,455 | $ | 1,305 |
| (a) | Includes nuclear fuel amortization in the ERCOT segment of $78 million, $82 million and $31 million for the Successor period for the years ended December 31, 2018 and 2017 and the period from October 3, 2016 through December 31, 2016, respectively. |
| Successor | |||||||||||||||||||||||||||||||
| Year Ended December 31, 2018 | |||||||||||||||||||||||||||||||
| Retail | ERCOT | PJM | NY/NE | MISO | Asset Closure | Eliminations / Corporate and Other | Vistra Energy Consolidated | ||||||||||||||||||||||||
| Net income (loss) | $ | 712 | $ | (55 | ) | $ | 100 | $ | 79 | $ | 35 | $ | (49 | ) | $ | (878 | ) | $ | (56 | ) | |||||||||||
| Income tax benefit | — | — | — | — | — | — | (45 | ) | (45 | ) | |||||||||||||||||||||
| Interest expense and related charges | 7 | 12 | 8 | 2 | 1 | — | 542 | 572 | |||||||||||||||||||||||
| Depreciation and amortization (a) | 318 | 494 | 413 | 152 | 9 | — | 86 | 1,472 | |||||||||||||||||||||||
| EBITDA before Adjustments | 1,037 | 451 | 521 | 233 | 45 | (49 | ) | (295 | ) | 1,943 | |||||||||||||||||||||
| Unrealized net (gain) loss resulting from hedging transactions | (206 | ) | 498 | 42 | 40 | (9 | ) | — | 15 | 380 | |||||||||||||||||||||
| Fresh start/purchase accounting impacts | 26 | (6 | ) | (1 | ) | 9 | 12 | 1 | — | 41 | |||||||||||||||||||||
| Impacts of Tax Receivable Agreement | — | — | — | — | — | — | 79 | 79 | |||||||||||||||||||||||
| Non-cash compensation expenses | — | — | — | — | — | — | 73 | 73 | |||||||||||||||||||||||
| Transition and merger expenses | 1 | 9 | 14 | 2 | 9 | 2 | 196 | 233 | |||||||||||||||||||||||
| Other, net | (13 | ) | (2 | ) | 16 | 9 | 9 | (3 | ) | (23 | ) | (7 | ) | ||||||||||||||||||
| Adjusted EBITDA, including Odessa earnout buybacks | 845 | 950 | 592 | 293 | 66 | (49 | ) | $ | 45 | 2,742 | |||||||||||||||||||||
| Odessa earnout buybacks | 18 | 18 | |||||||||||||||||||||||||||||
| Adjusted EBITDA | $ | 845 | $ | 968 | $ | 592 | $ | 293 | $ | 66 | $ | (49 | ) | $ | 45 | $ | 2,760 |
| (a) | Includes nuclear fuel amortization of $78 million in ERCOT segment. |
| Successor | |||||||||||||||||||
| Year Ended December 31, 2017 | |||||||||||||||||||
| Retail | ERCOT | Asset Closure | Eliminations / Corporate and Other | Vistra Energy Consolidated | |||||||||||||||
| Net income (loss) | $ | 495 | $ | (118 | ) | $ | (63 | ) | $ | (568 | ) | $ | (254 | ) | |||||
| Income tax expense | — | — | — | 504 | 504 | ||||||||||||||
| Interest expense and related charges | — | 21 | — | 172 | 193 | ||||||||||||||
| Depreciation and amortization (a) | 430 | 311 | 1 | 39 | 781 | ||||||||||||||
| EBITDA before Adjustments | 925 | 214 | (62 | ) | 147 | 1,224 | |||||||||||||
| Unrealized net (gain) loss resulting from hedging transactions | (171 | ) | 317 | — | — | 146 | |||||||||||||
| Generation plant retirement expenses | — | — | 206 | — | 206 | ||||||||||||||
| Fresh start accounting impacts | 46 | (1 | ) | 14 | — | 59 | |||||||||||||
| Impacts of Tax Receivable Agreement | — | — | — | (213 | ) | (213 | ) | ||||||||||||
| Reorganization items and restructuring expenses | — | — | — | 3 | 3 | ||||||||||||||
| Non-cash compensation expenses | — | — | — | 19 | 19 | ||||||||||||||
| Transition and merger expenses | 1 | 8 | — | 18 | 27 | ||||||||||||||
| Other, net | (22 | ) | — | — | 6 | (16 | ) | ||||||||||||
| Adjusted EBITDA | $ | 779 | $ | 538 | $ | 158 | $ | (20 | ) | $ | 1,455 |
| (a) | Includes nuclear fuel amortization of $82 million in ERCOT segment. |
Adjusted EBITDA increased by $1,305 million to $2,760 million in the year ended December 31, 2018 compared to the year ended December 31, 2017, primarily due to the following:
| PJM, MISO and NY/NE segments acquired in the Merger | $ | 950 | |
| Increase in ERCOT segment driven by operations acquired in the Merger and Odessa, higher realized prices and the impact of the Comanche Peak outage in 2017 and related insurance proceeds in 2018 | 430 | ||
| Increase in Retail segment driven by favorable volumes in ERCOT and Midwest/Northeast retail businesses acquired in the Merger | 66 | ||
| Decrease in Asset Closure segment driven by retirement of facilities in first quarter of 2018, partially offset by the change in estimates for certain AROs in 2018 | (207 | ) | |
| Corporate and Other due in part to operations acquired in the Merger | 66 | ||
| Total | $ | 1,305 |
| Successor | |||||||||||||||||||
| Period from October 3, 2016 through December 31, 2016 | |||||||||||||||||||
| Retail | ERCOT | Asset Closure | Eliminations / Corporate and Other | Vistra Energy Consolidated | |||||||||||||||
| Net income (loss) | $ | 114 | $ | (268 | ) | $ | 17 | $ | (26 | ) | $ | (163 | ) | ||||||
| Income tax benefit | — | — | — | (70 | ) | (70 | ) | ||||||||||||
| Interest expense and related charges | — | (1 | ) | — | 61 | 60 | |||||||||||||
| Depreciation and amortization (a) | 153 | 84 | — | 10 | 247 | ||||||||||||||
| EBITDA before Adjustments | 267 | (185 | ) | 17 | (25 | ) | 74 | ||||||||||||
| Unrealized net (gain) loss resulting from hedging transactions | (107 | ) | 272 | — | — | 165 | |||||||||||||
| Fresh start accounting impacts | 36 | (4 | ) | 3 | — | 35 | |||||||||||||
| Impacts of Tax Receivable Agreement | — | — | — | 22 | 22 | ||||||||||||||
| Reorganization items and restructuring expenses | 7 | 7 | — | 4 | 18 | ||||||||||||||
| Severance | 9 | 33 | 2 | — | 44 | ||||||||||||||
| Other, net | 1 | 9 | — | — | 10 | ||||||||||||||
| Adjusted EBITDA | $ | 213 | $ | 132 | $ | 22 | $ | 1 | $ | 368 |
| (a) | Includes nuclear fuel amortization of $31 million in ERCOT segment. |
Retail Segment — Year Ended December 31, 2018 Compared to Year Ended December 31, 2018
| Year Ended December 31, | Favorable (Unfavorable) Change | ||||||||||
| 2018 | 2017 | ||||||||||
| Operating revenues: | |||||||||||
| Revenues in ERCOT | $ | 4,426 | $ | 4,002 | $ | 424 | |||||
| Revenues in Northeast/Midwest | 1,123 | — | 1,123 | ||||||||
| Amortization expense | (26 | ) | (46 | ) | 20 | ||||||
| Other revenues | 74 | 102 | (28 | ) | |||||||
| Total operating revenues | $ | 5,597 | $ | 4,058 | $ | 1,539 | |||||
| Fuel, purchased power costs and delivery fees: | |||||||||||
| Purchases from affiliates | (2,846 | ) | (1,539 | ) | (1,307 | ) | |||||
| Unrealized net gains on hedging activities with affiliates | 218 | 154 | 64 | ||||||||
| Delivery fees | (1,493 | ) | (1,345 | ) | (148 | ) | |||||
| Other costs | (5 | ) | (3 | ) | (2 | ) | |||||
| Total fuel, purchased power costs and delivery fees | $ | (4,126 | ) | $ | (2,733 | ) | $ | (1,393 | ) | ||
| Net income | $ | 712 | $ | 495 | $ | 217 | |||||
| Adjusted EBITDA | $ | 845 | $ | 779 | $ | 66 | |||||
| Sales volumes (GWh): | |||||||||||
| Retail electricity sales volumes: | |||||||||||
| Sales volumes in ERCOT | 42,992 | 39,032 | 3,960 | ||||||||
| Sales volumes in Northeast/Midwest | 20,739 | — | 20,739 | ||||||||
| Total retail electricity sales volumes | 63,731 | 39,032 | 24,699 | ||||||||
| Weather (North Texas average) - percent of normal (a): | |||||||||||
| Cooling degree days | 103.0 | % | 99.1 | % | |||||||
| Heating degree days | 112.0 | % | 72.0 | % |
| (a) | Weather data is obtained from Weatherbank, Inc. For the year ended December 31, 2018, normal is defined as the average over the 10-year period from 2008 to 2017. For the year ended December 31, 2017, normal is defined as the average over the 10-year period from 2007 to 2016. |
Net income increased by $217 million to net income of $712 million and Adjusted EBITDA increased by $66 million to $845 million and in the year ended December 31, 2018 compared to the year ended December 31, 2017, primarily due to the following:
| Favorable volumes primarily due to weather in ERCOT | $ | 53 | |
| Margins in Midwest/Northeast acquired in the Merger | 34 | ||
| Unfavorable margins in ERCOT primarily due to higher power costs | (21 | ) | |
| Change in Adjusted EBITDA | $ | 66 | |
| Lower depreciation and amortization expenses driven by reduced amortization of the retail customer relationship | 132 | ||
| Favorable impact of unrealized net gains on hedging activities | 34 | ||
| Higher other expenses | (15 | ) | |
| Change in Net income | $ | 217 |
ERCOT Segment — Year Ended December 31, 2018 Compared to Year Ended December 31, 2017
| Year Ended December 31, | Favorable (Unfavorable) Change | ||||||||||
| 2018 | 2017 | ||||||||||
| Operating revenues: | |||||||||||
| Wholesale electricity sales | $ | 1,289 | $ | 523 | $ | 766 | |||||
| Sales to affiliates | 1,829 | 1,539 | 290 | ||||||||
| Rolloff of unrealized net gains (losses) representing positions settled in the current period | 404 | (184 | ) | 588 | |||||||
| Unrealized net gains (losses) from changes in fair value | (689 | ) | 33 | (722 | ) | ||||||
| Unrealized net losses on hedging activities with affiliates | (198 | ) | (154 | ) | (44 | ) | |||||
| Other revenues | (1 | ) | 37 | (38 | ) | ||||||
| Operating revenues | $ | 2,634 | $ | 1,794 | $ | 840 | |||||
| Fuel, purchased power costs and delivery fees: | |||||||||||
| Fuel for generation facilities and purchased power costs | (1,367 | ) | (881 | ) | (486 | ) | |||||
| Unrealized losses from hedging activities | (15 | ) | (12 | ) | (3 | ) | |||||
| Ancillary and other costs | (139 | ) | (88 | ) | (51 | ) | |||||
| Fuel, purchased power costs and delivery fees | $ | (1,521 | ) | $ | (981 | ) | $ | (540 | ) | ||
| Net loss | $ | (55 | ) | $ | (118 | ) | $ | 63 | |||
| Adjusted EBITDA | $ | 968 | $ | 538 | $ | 430 | |||||
| Production volumes (GWh): | |||||||||||
| Nuclear facilities | 20,416 | 16,921 | 3,495 | ||||||||
| Lignite and coal facilities | 29,151 | 26,043 | 3,108 | ||||||||
| Natural gas facilities | 35,790 | 18,522 | 17,268 | ||||||||
| Solar facilities | 344 | — | 344 | ||||||||
| Capacity factors: | |||||||||||
| Nuclear facilities | 101.3 | % | 84.0 | % | |||||||
| Lignite and coal facilities | 76.9 | % | 77.2 | % | |||||||
| CCGT facilities | 58.8 | % | 52.3 | % | |||||||
| Market pricing: | |||||||||||
| Average ERCOT North power price ($/MWh) | $ | 29.96 | $ | 23.26 | $ | 6.70 |
Net loss increased by $63 million to $55 million net loss and Adjusted EBITDA increased by $430 million to $968 million in the year ended December 31, 2018 compared to the year ended December 31, 2017, primarily due to the following:
| Favorable margins driven by higher realized power prices and increased production from legacy gas and coal generation | $ | 180 | |
| Impact of operations acquired in the Merger | 73 | ||
| Impact related to Comanche Peak outage in 2017 | 74 | ||
| Impact of full year of operations from Odessa acquired in 2017 | 86 | ||
| Lower selling, general and administrative expenses | 34 | ||
| Insurance reimbursement for Comanche Peak | 21 | ||
| Other | (38 | ) | |
| Change in Adjusted EBITDA | $ | 430 | |
| Increased depreciation and amortization driven by facilities acquired in the Merger | (183 | ) | |
| Unfavorable impact of unrealized net losses on hedging activities | (182 | ) | |
| Partial buybacks of the Odessa earn-out provision in 2018 | (18 | ) | |
| Other | (2 | ) | |
| Change in Net loss | $ | 63 |
PJM, NY/NE and MISO Segments — Year Ended December 31, 2018
| Year Ended December 31, 2018 | |||||||||||
| PJM | NY/NE | MISO | |||||||||
| Operating revenues: | |||||||||||
| Energy | $ | 775 | $ | 582 | $ | 370 | |||||
| Capacity | 369 | 239 | 53 | ||||||||
| Unrealized net gains (losses) on hedging activities | (17 | ) | (37 | ) | (13 | ) | |||||
| Sales to affiliates | 628 | 44 | 302 | ||||||||
| Unrealized net gains (losses) on hedging activities with affiliates | (33 | ) | (3 | ) | 16 | ||||||
| Other revenues | 3 | (8 | ) | (8 | ) | ||||||
| Operating revenues | $ | 1,725 | $ | 817 | $ | 720 | |||||
| Fuel, purchased power costs and delivery fees: | |||||||||||
| Fuel for generation facilities and purchased power costs | (916 | ) | (479 | ) | (449 | ) | |||||
| Fuel for generation facilities and purchased power costs from affiliates | (8 | ) | — | 30 | |||||||
| Unrealized gains from hedging activities | 8 | — | 6 | ||||||||
| Other costs | (1 | ) | (6 | ) | (7 | ) | |||||
| Fuel, purchased power costs and delivery fees | $ | (917 | ) | $ | (485 | ) | $ | (420 | ) | ||
| Net income | $ | 100 | $ | 79 | $ | 35 | |||||
| Adjusted EBITDA | $ | 592 | $ | 293 | $ | 66 | |||||
| Production volumes (GWh) | 40,533 | 14,605 | 21,324 | ||||||||
| Capacity factors: | |||||||||||
| CCGT facilities | 67.8 | % | 48.2 | % | — | % | |||||
| Coal facilities | 63.2 | % | — | % | 63.3 | % | |||||
| Weather - percent of normal (a): | |||||||||||
| Cooling degree days | 121.0 | % | 118.0 | % | 134.0 | % | |||||
| Heating degree days | 101.0 | % | 102.0 | % | 95.0 | % | |||||
| Average Market On-Peak Power Prices ($/MWh) (b): | |||||||||||
| PJM West | $ | 41.79 | |||||||||
| AD Hub | $ | 40.47 | |||||||||
| New York - Zone C | $ | 37.03 | |||||||||
| Mass Hub | $ | 50.11 | |||||||||
| Average natural gas price - TetcoM3 ($/MMBtu) (c) | $ | 3.69 | |||||||||
| Average natural gas price - Algonquin Citygates ($/MMBtu) (c) | $ | 4.84 |
(a) Reflects cooling degree days or heating degree days for the region based on Weather Services International (WSI) data. For the year ended December 31, 2018, represents April 9, 2018 through December 31, 2018 only.
(b) Reflects the average of day-ahead quoted prices for the periods presented and does not necessarily reflect prices we realized. For the year ended December 31, 2018, represents April 9, 2018 through December 31, 2018 only.
(c) Reflects the average of daily quoted prices for the periods presented and does not reflect costs incurred by us. For the year ended December 31, 2018, represents April 9, 2018 through December 31, 2018 only.
Net income totaled $100 million, $79 million and $35 million and Adjusted EBITDA totaled $592 million, $293 million and $66 million in the year ended December 31, 2018, for PJM, NY/NE and MISO segments respectively.
| PJM | NY/NE | MISO | |||||||||
| Generation revenue net of fuel | $ | 481 | $ | 116 | $ | 229 | |||||
| Capacity revenue | 369 | 260 | 61 | ||||||||
| Operating costs | (243 | ) | (74 | ) | (202 | ) | |||||
| Selling, general and administrative expenses | (52 | ) | (37 | ) | (52 | ) | |||||
| Equity income from unconsolidated investment and other | 7 | 11 | — | ||||||||
| Other | 30 | 17 | 30 | ||||||||
| Adjusted EBITDA | $ | 592 | $ | 293 | $ | 66 | |||||
| Depreciation and amortization | (413 | ) | (152 | ) | (9 | ) | |||||
| Unrealized net gains (losses) on hedging activities | (42 | ) | (40 | ) | 9 | ||||||
| Purchase accounting impacts | 1 | (9 | ) | (12 | ) | ||||||
| Transition and merger expenses | (14 | ) | (2 | ) | (9 | ) | |||||
| Other | (24 | ) | (11 | ) | (10 | ) | |||||
| Net income | $ | 100 | $ | 79 | $ | 35 |
Asset Closure Segment — Year Ended December 31, 2018 Compared to Year Ended December 31, 2017
| Year Ended December 31, | Favorable (Unfavorable) Change | ||||||||||
| 2018 | 2017 | ||||||||||
| Operating revenues | $ | 50 | $ | 964 | $ | (914 | ) | ||||
| Fuel, purchased power costs and delivery fees | (40 | ) | (607 | ) | 567 | ||||||
| Operating costs | (43 | ) | (380 | ) | 337 | ||||||
| Depreciation and amortization | — | (1 | ) | 1 | |||||||
| Selling, general and administrative expenses | (17 | ) | (19 | ) | 2 | ||||||
| Impairment of long-lived assets | — | (25 | ) | 25 | |||||||
| Operating income (loss) | (50 | ) | (68 | ) | 18 | ||||||
| Other income | 2 | 6 | (4 | ) | |||||||
| Other deductions | (1 | ) | (1 | ) | — | ||||||
| Income (loss) before income taxes | (49 | ) | (63 | ) | 14 | ||||||
| Income tax expense | — | — | — | ||||||||
| Net income (loss) | $ | (49 | ) | $ | (63 | ) | $ | 14 | |||
| Depreciation and amortization | — | 1 | (1 | ) | |||||||
| EBITDA | (49 | ) | (62 | ) | 13 | ||||||
| Generation plant retirement expenses | — | 206 | (206 | ) | |||||||
| Fresh start accounting impacts | 1 | 14 | (13 | ) | |||||||
| Transition and merger expenses | 2 | — | 2 | ||||||||
| Other | (3 | ) | — | (3 | ) | ||||||
| Adjusted EBITDA | $ | (49 | ) | $ | 158 | $ | (207 | ) | |||
| Production volumes (GWh) | 1,159 | 25,392 | (24,233 | ) |
Results for the Asset Closure segment reflect the retirement of the Stuart and Killen plants in May 2018 (acquired in the Merger), retirement of the Northeastern waste coal plant in October 2018 and the retirement of the Monticello, Sandow and Big Brown plants in January and February 2018 (see Note 4 to the Financial Statements) and corresponding 95% decrease in volume in the year ended December 31, 2018. Operating costs for the year ended December 31, 2018 included ongoing costs associated with closing these plants as well as a favorable adjustment to the estimated asset retirement obligation of $56 million.
Predecessor Consolidated Financial Results — Period from January 1, 2016 through October 2, 2016
| Predecessor | |||
| Period from January 1, 2016 through October 2, 2016 | |||
| Operating revenues | $ | 3,973 | |
| Fuel, purchased power costs and delivery fees | (2,082 | ) | |
| Net gain from commodity hedging and trading activities | 282 | ||
| Operating costs | (664 | ) | |
| Depreciation and amortization | (459 | ) | |
| Selling, general and administrative expenses | (482 | ) | |
| Operating income (loss) | 568 | ||
| Other income | 19 | ||
| Other deductions | (75 | ) | |
| Interest expense and related charges | (1,049 | ) | |
| Reorganization items | 22,121 | ||
| Income (loss) before income taxes | 21,584 | ||
| Income tax benefit | 1,267 | ||
| Net income (loss) | $ | 22,851 |
Predecessor Operating Statistics — Period from January 1, 2016 through October 2, 2016
| Predecessor | |||
| Period from January 1, 2016 through October 2, 2016 | |||
| Operating revenues: | |||
| Retail electricity revenues | $ | 3,154 | |
| Wholesale electricity revenues and other operating revenues (a)(b) | 819 | ||
| Total operating revenues | $ | 3,973 | |
| Fuel, purchased power costs and delivery fees: | |||
| Fuel for generation facilities and purchased power costs (a) | $ | 950 | |
| Other costs | 108 | ||
| Delivery fees | 1,024 | ||
| Total | $ | 2,082 | |
| Sales volumes (GWh): | |||
| Retail electricity sales volumes | 30,973 | ||
| Wholesale electricity sales volumes (b) | 25,563 | ||
| Production volumes (GWh): | |||
| Nuclear facilities | 15,005 | ||
| Lignite and coal facilities (c) | 31,865 | ||
| Natural gas facilities | 8,539 | ||
| Capacity factors: | |||
| Nuclear facilities | 99.2 | % | |
| Lignite and coal facilities (c) | 60.5 | % | |
| CCGT facilities | 65.2 | % | |
| Market pricing: | |||
| Average ERCOT North power price ($/MWh) | $ | 20.78 | |
| Weather (North Texas average) - percent of normal (d): | |||
| Cooling degree days | 102.8 | % | |
| Heating degree days | 81.9 | % |
| (a) | Upon settlement, physical derivative commodity contracts that we mark-to-market in net income, such as certain electricity sales and purchase agreements and coal purchase contracts, wholesale electricity revenues and fuel and purchased power costs are reported at approximated market prices, as required by accounting rules, rather than contract price. The offsetting differences between contract and market prices are reported in net gain from commodity hedging and trading activities. |
| (b) | Includes net amounts related to sales and purchases of balancing energy in the ERCOT real-time market. |
| (c) | Includes the estimated effects of economic backdown (including seasonal operations) of lignite/coal-fueled units totaling 14,420 GWh for the period from January 1, 2016 through October 2, 2016. |
| (d) | Weather data is obtained from Weatherbank, Inc., an independent company that collects and archives weather data from reporting stations of the National Oceanic and Atmospheric Administration (a federal agency under the U.S. Department of Commerce). Normal is defined as the average over the 10-year period from 2000 to 2010. |
Predecessor Financial Results — Period from January 1, 2016 through October 2, 2016
For the period from January 1, 2016 through October 2, 2016, income before income taxes totaled $21.584 billion and included a $24.252 billion gain on reorganization adjustments and a $2.013 billion loss for the net impacts from the adoption of fresh start reporting (see Notes 5 and 7 to the Financial Statements). Results also reflected the effect of declining average electricity prices on operating revenues, $977 million in adequate protection interest expense paid/accrued on pre-petition debt and $116 million in reorganization items associated with the Chapter 11 Cases.
Operating revenues totaled $3.973 billion for the period from January 1, 2016 through October 2, 2016. Retail electricity revenues totaled $3.154 billion and were negatively impacted by declining average prices and reduced volumes reflecting milder than normal weather in 2016. Wholesale revenues totaled $649 million and were positively impacted by increases in generation volumes (approximately 8,048 GWh) driven by the Lamar and Forney generation assets acquired in April 2016 (see Note 3 to the Financial Statements), partially offset by lower average wholesale electricity prices.
Following is an analysis of amounts reported as net losses from commodity hedging and trading activities. Results are primarily related to natural gas and power hedging activity.
| Predecessor | |||
| Period from January 1, 2016 through October 2, 2016 | |||
| Realized net gains | $ | 320 | |
| Unrealized net gains (losses) | (38 | ) | |
| Total | $ | 282 |
The negative impacts of declining average prices on wholesale operating revenues were partially offset by realized net gains reflecting settled gains on derivatives due to declining market prices. These gains were primarily related to natural gas positions.
For the period from January 1, 2016 through October 2, 2016, net unrealized losses were primarily impacted by reversals of previously recorded unrealized net gains on settled positions.
Fuel, purchased power costs and delivery fees totaled $2.082 billion for the period from January 1, 2016 through October 2, 2016 reflecting the impact of declining electricity prices on purchased power costs during 2016, partially offset by incremental natural gas fuel costs associated with the Lamar and Forney Acquisition.
Operating costs totaled $664 million for the period from January 1, 2016 through October 2, 2016 and primarily reflect maintenance expense for generation assets, including the scope and timing of maintenance costs at lignite/coal-fueled generation facilities. Operating costs were also impacted by incremental operation and maintenance costs associated with the Lamar and Forney Acquisition.
Depreciation and amortization expenses totaled $459 million for the period from January 1, 2016 through October 2, 2016 and primarily reflected depreciation on power generation and mining property, plant and equipment and amortization of identifiable intangible assets. Depreciation and amortization expenses were also impacted by incremental depreciation expense associated with the Lamar and Forney Acquisition.
SG&A expenses totaled $482 million for the period from January 1, 2016 through October 2, 2016 and reflected administrative and general salaries, employee benefits, marketing costs related to retail electricity activity and other administrative costs.
Results also include $32 million of severance expense, primarily reported in fuel, purchased power costs and delivery fees and operating costs, associated with certain actions taken to reduce costs related to mining and lignite/coal generation operations.
For the period from January 1, 2016 through October 2, 2016, interest expense and related charges totaled $1.049 billion and included adequate protection payments approved by the Bankruptcy Court for the benefit of TCEH secured creditors totaling $977 million and interest expense on debtor-in-possession financing totaling $76 million.
Energy-Related Commodity Contracts and Mark-to-Market Activities
The table below summarizes the changes in commodity contract assets and liabilities for the periods presented. The net change in these assets and liabilities, excluding "other activity" as described below, reflects $380 million, $145 million, $166 million and $38 million in unrealized net losses for the Successor period for the year ended December 31, 2018 and 2017 and the period from October 3, 2016 through December 31, 2016, and the Predecessor period from January 1, 2016 through October 2, 2016, respectively, all arising from mark-to-market accounting for positions in the commodity contract portfolio.
| Successor | Predecessor | |||||||||||||||
| Year Ended December 31, 2018 | Year Ended December 31, 2017 | Period from October 3, 2016 through December 31, 2016 | Period from January 1, 2016 through October 2, 2016 | |||||||||||||
| Commodity contract net asset (liability) at beginning of period | $ | (96 | ) | $ | 64 | $ | 181 | $ | 271 | |||||||
| Settlements/termination of positions (a) | 457 | (207 | ) | (95 | ) | (232 | ) | |||||||||
| Changes in fair value of positions in the portfolio (b) | (837 | ) | 62 | (71 | ) | 194 | ||||||||||
| Acquired commodity contracts in Merger (c) | (454 | ) | — | — | — | |||||||||||
| Other activity (d) | 80 | (15 | ) | 49 | (35 | ) | ||||||||||
| Commodity contract net asset (liability) at end of period | $ | (850 | ) | $ | (96 | ) | $ | 64 | $ | 198 |
| (a) | Represents reversals of previously recognized unrealized gains and losses upon settlement/termination (offsets realized gains and losses recognized in the settlement period). The years ended December 31, 2018 and 2017 include reversals of $17 million and $63 million, respectively of previously recorded unrealized gains related to Vistra Energy beginning balances. The year ended December 31, 2018 also includes reversal of $320 million of previously recorded unrealized losses related to commodity contracts acquired in the Merger. Excludes changes in fair value in the month the position settled as well as amounts related to positions entered into, and settled, in the same month. |
| (b) | Represents unrealized net gains (losses) recognized, reflecting the effect of changes in fair value. Excludes changes in fair value in the month the position settled as well as amounts related to positions entered into, and settled, in the same month. |
| (c) | Includes fair value of commodity contracts acquired at the Merger Date (see Note 2 to the Financial Statements). |
| (d) | Represents changes in fair value of positions due to receipt or payment of cash not reflected in unrealized gains or losses. Amounts are generally related to premiums related to options purchased or sold as well as certain margin deposits classified as settlement for certain transactions executed on the CME. |
Maturity Table — The following table presents the net commodity contract liability arising from recognition of fair values at December 31, 2018, scheduled by the source of fair value and contractual settlement dates of the underlying positions.
| Successor | ||||||||||||||||||||
| Maturity dates of unrealized commodity contract net liability at December 31, 2018 | ||||||||||||||||||||
| Source of fair value | Less than 1 year | 1-3 years | 4-5 years | Excess of 5 years | Total | |||||||||||||||
| Prices actively quoted | $ | (106 | ) | $ | 5 | $ | — | $ | — | $ | (101 | ) | ||||||||
| Prices provided by other external sources | (507 | ) | (107 | ) | — | — | (614 | ) | ||||||||||||
| Prices based on models | (59 | ) | (64 | ) | (12 | ) | — | (135 | ) | |||||||||||
| Total | $ | (672 | ) | $ | (166 | ) | $ | (12 | ) | $ | — | $ | (850 | ) |
FINANCIAL CONDITION
Operating Cash Flows
Successor — Year Ended December 31, 2018 Compared to Year Ended December 31, 2017 — Cash provided by operating activities totaled $1.471 billion and $1.386 billion in the years ended December 31, 2018 and 2017, respectively. The favorable change of $85 million was primarily driven by increased cash from operations reflecting operations acquired in the Merger largely offset by increased interest paid of $406 million due to the assumption of long-term debt obligations in the Merger, an increase in cash used for margin deposits of $367 million related to derivative contracts and $238 million in proceeds received in 2017 from the Alcoa contract settlement.
Period from October 3, 2016 through December 31, 2016 — Cash provided by operating activities totaled $81 million and was primarily driven by cash earnings from our business of approximately $251 million after taking into consideration depreciation and amortization and unrealized mark-to-market losses on derivatives, offset by a net use of cash of approximately $170 million in working capital primarily driven by cash utilized in margin postings related to derivative contracts.
Depreciation and Amortization — Depreciation and amortization expense reported as a reconciling adjustment in the statements of consolidated cash flows exceeds the amount reported in the statements of consolidated income (loss) by $139 million, $136 million and $69 million for the year ended December 31, 2018 and 2017 and the period from October 3, 2016 through December 31, 2016, respectively. The difference represented amortization of nuclear fuel, which is reported as fuel costs in the statements of consolidated income (loss) consistent with industry practice, and amortization of intangible net assets and liabilities that are reported in various other statements of consolidated income (loss) line items including operating revenues and fuel and purchased power costs and delivery fees.
Predecessor — Period from January 1, 2016 through October 2, 2016 — Cash used in operating activities totaled $238 million and was primarily driven by cash used for margin deposit postings and other working capital utilization.
Financing Cash Flows
Successor — Year Ended December 31, 2018 — Cash used in financing activities totaled $2.723 billion and reflected:
| • | cash tender offers to purchase $1.542 billion of senior notes assumed in the Merger; |
| • | the amendment to the Vistra Operations Credit Facilities, including the repayment of $500 million in borrowings under the Term C Facility; |
| • | the redemption of $850 million principal amount of outstanding 6.75% Senior Notes in May 2018; |
| • | the repurchases of $119 million principal amount of outstanding Vistra Energy senior notes in November and December 2018; |
| • | premium amounts paid in connection with the debt tender offer and other debt financing fees totaling $236 million, and |
| • | $763 million of cash paid for share repurchases during 2018, |
partially offset by:
| • | the issuance of $1.0 billion principal amount of Vistra Operations 5.500% senior notes due 2026, and |
| • | proceeds of $339 million from the accounts receivable securitization program. |
Year Ended December 31, 2017 — Cash used in financing activities totaled $201 million and reflected the repayment of debt, including the repayment of $150 million in principal under the Term Loan C Facility (see Note 14 to the Financial Statements).
Period from October 3, 2016 through December 31, 2016 — Cash provided by financing activities totaled $6 million and related to the net impacts of the Incremental Term Loan B borrowings and the Special Dividend paid to shareholders.
Predecessor — Period from January 1, 2016 through October 2, 2016 — Cash provided by financing activities totaled $1.059 billion and primarily reflected $2.040 billion in net borrowings under the DIP Roll Facilities and the DIP Facility, including $870 million in net borrowings to fund the Lamar and Forney Acquisition (see Note 3 to the Financial Statements), and $69 million from the issuance of preferred stock, partially offset by $915 million in payments to extinguish claims under the Plan of Reorganization and $112 million in fees related to the issuance of the DIP Roll Facilities.
Investing Cash Flows
Successor — Year Ended December 31, 2018 — Cash used in investing activities totaled $101 million and reflected capital expenditures (including LTSA prepayments and nuclear fuel purchases) totaling $496 million and development and growth expenditures totaling $34 million, partially offset by $445 million of cash acquired in the Merger.
Capital expenditures, including nuclear fuel, in the year ended December 31, 2018 totaled $496 million and consisted of:
| • | $208 million primarily for our generation and mining operations; |
| • | $118 million for nuclear fuel purchases; |
| • | $70 million for information technology, other corporate investments and Comanche Peak repairs, and |
| • | $100 million for LTSA prepayments. |
Year Ended December 31, 2017 — Cash used in investing activities totaled $727 million and was primarily driven by payments of $355 million related to the Odessa Acquisition, Upton 2 solar development expenditures totaling $190 million and capital expenditures (including nuclear fuel purchases) totaling $176 million. The Odessa Acquisition and the Upton 2 solar development were funded using cash on hand.
Capital expenditures, including nuclear fuel, in the year ended December 31, 2017 totaled $176 million and consisted of:
| • | $88 million primarily for our generation and mining operations; |
| • | $62 million for nuclear fuel purchases, and |
| • | $26 million for information technology and other corporate investments. |
Period from October 3, 2016 through December 31, 2016 — Cash used in investing activities totaled $93 million and was primarily driven by capital expenditures (including nuclear fuel purchases) totaling $89 million.
Capital expenditures, including nuclear fuel, in the period from October 3, 2016 through December 31, 2016 totaled $89 million and consisted of:
| • | $40 million primarily for our generation and mining operations; |
| • | $41 million for nuclear fuel purchases, and |
| • | $8 million for information technology and other corporate investments. |
Predecessor — Period from January 1, 2016 through October 2, 2016 — Cash used in investing activities totaled $1.420 billion and was primarily driven by payments of $1.343 billion related to the Lamar and Forney Acquisition net of cash acquired (see Note 3 to the Financial Statements) and capital expenditures (including nuclear fuel purchases) totaling $263 million.
Capital expenditures, including nuclear fuel, in the period from January 1, 2016 through October 2, 2016 totaled $263 million and consisted of:
| • | $211 million primarily for our generation and mining operations; |
| • | $33 million for nuclear fuel purchases, and |
| • | $19 million for information technology and other corporate investments. |
Debt Activity
See Note 14 to the Financial Statements for details of the Vistra Operations Credit Facilities and other long-term debt.
Available Liquidity
The following table summarizes changes in available liquidity for the year ended December 31, 2018:
| December 31, 2018 | December 31, 2017 | Change | |||||||||
| Cash and cash equivalents (a) | $ | 636 | $ | 1,487 | $ | (851 | ) | ||||
| Vistra Operations Credit Facilities — Revolving Credit Facility | 1,135 | 834 | 301 | ||||||||
| Vistra Operations Credit Facilities — Term Loan C Facility (b) | — | 7 | (7 | ) | |||||||
| Total available liquidity | $ | 1,771 | $ | 2,328 | $ | (557 | ) |
| (a) | Cash and cash equivalents excludes $500 million of restricted cash held for letter of credit support at December 31, 2017 (see Note 23 to the Financial Statements). |
| (b) | The Term Loan C Facility was used for issuing letters of credit for general corporate purposes. Borrowings totaling $500 million were held in collateral accounts at December 31, 2017, and were reported as restricted cash in our consolidated balance sheets. In June 2018, the Vistra Operations Credit Facilities were amended, and the Term Loan C Facility was repaid using $500 million of cash from the collateral accounts used to backstop letters of credit. |
The decrease in available liquidity of $557 million in the year ended December 31, 2018 was primarily driven by cash tender offers to purchase $1.542 billion of senior notes assumed in the Merger, the redemption of $850 million principal amount of outstanding 6.75% senior notes, the amendment to the Vistra Operations Credit Facilities, the repurchases of $119 million principal amount of outstanding Vistra Energy senior notes and $763 million in cash paid for share repurchases, partially offset by the issuance of $1.0 billion principal amount of Vistra Operations 5.500% senior notes, $445 million of cash acquired in the Merger, increased available capacity under the Revolving Credit Facility and proceeds of $339 million from the accounts receivable securitization program.
Based upon our current internal financial forecasts, we believe that we will have sufficient liquidity to fund our anticipated cash requirements, including those related to our capital allocation initiatives, through at least the next 12 months. Our operational cash flows tend to be seasonal and weighted toward the second half of the year.
Capital Expenditures
Estimated capital expenditures and nuclear fuel purchases for 2019 are expected to total approximately $629 million and include:
| • | $432 million for investments in generation and mining facilities; |
| • | $74 million for nuclear fuel purchases; |
| • | $80 million for information technology and other corporate investments, and |
| • | $43 million for growth and development. |
Liquidity Effects of Commodity Hedging and Trading Activities
We have entered into commodity hedging and trading transactions that require us to post collateral if the forward price of the underlying commodity moves such that the hedging or trading instrument we hold has declined in value. We use cash, letters of credit and other forms of credit support to satisfy such collateral posting obligations. See Note 14 to the Financial Statements for discussion of the Vistra Operations Credit Facilities.
Exchange cleared transactions typically require initial margin (i.e., the upfront cash and/or letter of credit posted to take into account the size and maturity of the positions and credit quality) in addition to variation margin (i.e., the daily cash margin posted to take into account changes in the value of the underlying commodity). The amount of initial margin required is generally defined by exchange rules. Clearing agents, however, typically have the right to request additional initial margin based on various factors, including market depth, volatility and credit quality, which may be in the form of cash, letters of credit, a guaranty or other forms as negotiated with the clearing agent. Cash collateral received from counterparties is either used for working capital and other business purposes, including reducing borrowings under credit facilities, or is required to be deposited in a separate account and restricted from being used for working capital and other corporate purposes. With respect to over-the-counter transactions, counterparties generally have the right to substitute letters of credit for such cash collateral. In such event, the cash collateral previously posted would be returned to such counterparties, which would reduce liquidity in the event the cash was not restricted.
At December 31, 2018, we received or posted cash and letters of credit for commodity hedging and trading activities as follows:
| • | $361 million in cash has been posted with counterparties as compared to $30 million posted at December 31, 2017; |
| • | $4 million in cash has been received from counterparties as compared to $4 million received at December 31, 2017; |
| • | $1.185 billion in letters of credit have been posted with counterparties as compared to $390 million posted at December 31, 2017, and |
| • | $12 million in letters of credit have been received from counterparties as compared to $3 million received at December 31, 2017. |
Income Tax Payments
In the next 12 months, we do not expect to make federal income tax payments due to Vistra Energy's forecasted loss position. In February 2019, we received a refund of $21 million related to Vistra Energy's 2017 federal tax return. We expect to make state income tax payments of approximately $30 million in the next 12 months. For the year ended December 31, 2018, federal income tax payments totaled $45 million, state income tax payments totaled $22 million and TRA payments totaled $16 million.
Capitalization
Our capitalization ratios consisted of 58% and 41% long-term debt (less amounts due currently) and 42% and 59% shareholders' equity at December 31, 2018 and 2017, respectively. Total long-term debt (including amounts due currently) to capitalization was 58% and 41% at December 31, 2018 and 2017, respectively.
Financial Covenants
The Credit Facilities Agreement includes a covenant, solely with respect to the Revolving Credit Facility and solely during a compliance period (which, in general, is applicable when the aggregate revolving borrowings and issued revolving letters of credit (in excess of $300 million) exceed 30% of the revolving commitments), that requires the consolidated first lien net leverage ratio not exceed 4.25 to 1.00. As of December 31, 2018, we were in compliance with this financial covenant.
See Note 14 to the Financial Statements for discussion of other covenants related to the Vistra Operations Credit Facilities.
Collateral Support Obligations
The RCT has rules in place to assure that parties can meet their mining reclamation obligations. In September 2016, the RCT agreed to a collateral bond of up to $975 million to support Luminant's reclamation obligations. The collateral bond is effectively a first lien on all of Vistra Operations' assets (which ranks pari passu with the Vistra Operations Credit Facilities) that contractually enables the RCT to be paid (up to $975 million) before the other first lien lenders in the event of a liquidation of our assets. Collateral support relates to land mined or being mined and not yet reclaimed as well as land for which permits have been obtained but mining activities have not yet begun and land already reclaimed but not released from regulatory obligations by the RCT, and includes cost contingency amounts.
The PUCT has rules in place to assure adequate creditworthiness of each REP, including the ability to return customer deposits, if necessary. Under these rules, at December 31, 2018, Vistra Energy has posted letters of credit in the amount of $55 million with the PUCT, which is subject to adjustments.
The RTOs/ISOs we operate in have rules in place to assure adequate creditworthiness of parties that participate in the markets operated by those RTOs/ISOs. Under these rules, Vistra Energy has posted collateral support totaling $181 million in the form of letters of credit, $10 million in the form of a surety bond and $1 million in cash at December 31, 2018 (which is subject to daily adjustments based on settlement activity with the RTOs/ISOs).
Material Cross Default/Acceleration Provisions
Certain of our contractual arrangements contain provisions that could result in an event of default if there was a failure under financing arrangements to meet payment terms or to observe covenants that could result in an acceleration of payments due. Such provisions are referred to as "cross default" or "cross acceleration" provisions.
A default by Vistra Operations or any of its restricted subsidiaries in respect of certain specified indebtedness in an aggregate amount in excess of $300 million may result in a cross default under the Vistra Operations Credit Facilities. Such a default would allow the lenders to accelerate the maturity of outstanding balances (approximately $5.8 billion at December 31, 2018) under such facilities.
Each of Vistra Operations' (or its subsidiaries') commodity hedging agreements and interest rate swap agreements that are secured with a lien on its assets on a pari passu basis with the Vistra Operations Credit Facilities lenders contains a cross default provision. An event of a default by Vistra Operations or any of its subsidiaries relating to indebtedness in excess of $300 million that results in the acceleration of such debt, would give each counterparty under these hedging agreements the right to terminate its hedge or interest rate swap agreement with Vistra Operations (or its applicable subsidiary) and require all outstanding obligations under such agreement to be settled.
Under Vistra Operations' senior notes indenture, a default under any document evidencing indebtedness for borrowed money by Vistra Operations or any subsidiary guarantor for failure to pay principal when due at final maturity or that results in the acceleration of such indebtedness in an aggregate amount of $300 million or more, may result in a cross default under the senior notes.
Each of Vistra Energy's indentures for each series of senior notes (except with respect to the Consent Senior Notes) and the TEUs, respectively, contain a cross default provision. A default by Vistra Energy, as issuer of each series of senior notes and the TEUs, respectively, in respect of certain specified indebtedness in an aggregate amount in excess of $100 million may result in a cross default under the respective indentures of the senior notes and TEUs. Such a default would allow the trustee or noteholders holding at least 25% in principal amount of the respective series of senior notes or TEUs that are outstanding (each such series treated as a separate class) to accelerate the maturity of such portion of the principal amount of all securities of such series of senior notes or TEUs, respectively.
Additionally, we enter into energy-related physical and financial contracts, the master forms of which contain provisions whereby an event of default or acceleration of settlement would occur if we were to default under an obligation in respect of borrowings in excess of thresholds, which may vary by contract.
The Receivables Program contains a cross default provision. The cross default provision applies, among other instances, if Vistra Operations, the performance guarantor, fails to make a payment of principal or interest on any indebtedness that is outstanding in a principal amount of at least $300 million, or, in the case of TXU Energy, the originator and servicer, in a principal amount of at least $50 million, or if other events occur or circumstances exist under such indebtedness which give rise to a right of the debtholder to accelerate such indebtedness, or if such indebtedness becomes due before its stated maturity. If this cross default provision is triggered, a termination event under the Receivables Facility would occur and the Receivables Facility may be terminated.
Under the Vistra Operations' alternative letter of credit program, a default under any document evidencing indebtedness for borrowed money by Vistra Operations or any subsidiary guarantor for failure to pay principal when due at final maturity or that results in the acceleration of such indebtedness in an aggregate amount of $300 million or more, may result in a termination of the facility.
Contractual Obligations and Commitments
The following table summarizes the amounts and related maturities of our contractual cash obligations at December 31, 2018. See Notes 14 and 15 to the Financial Statements for additional disclosures regarding debts and noncancellable purchase obligations.
| Contractual Cash Obligations: | Less Than One Year | One to Three Years | Three to Five Years | More Than Five Years | Total | ||||||||||||||
| Debt – principal, including capital leases (a) | $ | 191 | $ | 334 | $ | 5,932 | $ | 4,453 | $ | 10,910 | |||||||||
| Debt – interest | 611 | 1,207 | 990 | 474 | 3,282 | ||||||||||||||
| Operating leases | 35 | 54 | 39 | 168 | 296 | ||||||||||||||
| Long-term service and maintenance contracts | 175 | 316 | 316 | 2,619 | 3,426 | ||||||||||||||
| Obligations under commodity purchase and services agreements (b) | 1,589 | 912 | 460 | 709 | 3,670 | ||||||||||||||
| Total contractual cash obligations | $ | 2,601 | $ | 2,823 | $ | 7,737 | $ | 8,423 | $ | 21,584 |
| (a) | Includes $5.813 billion of borrowings under the Vistra Operations Credit Facility, $3.626 billion principal amount of Vistra Energy senior notes, $1.0 billion principal amount of Vistra Operations senior notes and $471 million principal amount of long-term debt, including forward capacity agreements, equipment financing agreements and mandatorily redeemable preferred stock. Excludes unamortized premiums, discounts and debt costs. |
| (b) | Includes capacity payments, nuclear fuel and natural gas take-or-pay contracts, coal contracts, business services and nuclear related outsourcing and other purchase commitments. Amounts presented for variable priced contracts reflect the year-end 2018 price for all periods except where contractual price adjustment or index-based prices are specified. |
The following are not included in the table above:
| • | the TRA obligation (see Note 10 to the Financial Statements); |
| • | asset retirement obligations (see Note 23 to the Financial Statements); |
| • | arrangements between affiliated entities and intercompany debt (see Note 21 to the Financial Statements); |
| • | individual contracts that have an annual cash requirement of less than $1 million (however, multiple contracts with one counterparty that are more than $1 million on an aggregated basis have been included); |
| • | contracts that are cancellable without payment of a substantial cancellation penalty, and |
| • | employment contracts with management. |
Guarantees
See Note 15 to the Financial Statements for discussion of guarantees.
OFF–BALANCE SHEET ARRANGEMENTS
We do not have any off-balance sheet arrangements.
COMMITMENTS AND CONTINGENCIES
See Note 15 to the Financial Statements for discussion of commitments and contingencies.
CHANGES IN ACCOUNTING STANDARDS
See Note 1 to the Financial Statements for discussion of changes in accounting standards.
Previous: Item 6. SELECTED FINANCIAL DATA · Next: Item 7A. QUANTITATIVE AND QUALITATIVE DISCLOSURES ABOUT MARKET RISK