 filings.tools
Item 7. Management’s Discussion and Analysis of Financial Condition And Results of Operations
129K characters. Original on sec.gov · Markdown
Item 7. Management’s Discussion and Analysis of Financial Condition And Results of Operations
The following discussion and analysis addresses material changes in the financial condition and results of operations of Viatris Inc. and subsidiaries for the periods presented. Unless context requires otherwise, the “Company,” “Viatris,” “our” or “we” refer to Viatris Inc. and its subsidiaries.
This discussion and analysis should be read in conjunction with the consolidated financial statements and the related notes to consolidated financial statements included in Part II, Item 8 in this Form 10-K, and our other SEC filings and public disclosures.
This Form 10-K contains “forward-looking statements”. These statements are made pursuant to the safe harbor provisions of the Private Securities Litigation Reform Act of 1995. Such forward-looking statements may include, without limitation, statements about the Combination, the benefits and synergies of the Combination or our global restructuring program, future opportunities for the Company and its products and any other statements regarding the Company’s future operations, financial or operating results, capital allocation, dividend policy, debt ratio, anticipated business levels, future earnings, planned activities, anticipated growth, market opportunities, strategies, competitions, and other expectations and targets for future periods. Forward-looking statements may often be identified by the use of words such as “will”, “may”, “could”, “should”, “would”, “project”, “believe”, “anticipate”, “expect”, “plan”, “estimate”, “forecast”, “potential”, “pipeline”, “intend”, “continue”, “target”, “seek” and variations of these words or comparable words. Because forward-looking statements inherently involve risks and uncertainties, actual future results may differ materially from those expressed or implied by such forward-looking statements. Factors that could cause or contribute to such differences include, but are not limited to:
-
the integration of Mylan and the Upjohn Business or the implementation of the Company’s global restructuring program being more difficult, time consuming or costly than expected;
-
the possibility that the Company may be unable to achieve expected benefits, synergies and operating efficiencies in connection with the Combination or its global restructuring program within the expected timeframe or at all;
-
the possibility that the Company may be unable to successfully integrate Mylan and the Upjohn Business or implement its global restructuring program;
-
operational or financial difficulties or losses associated with the Company’s reliance on agreements with Pfizer in connection with the Combination, including with respect to transition services;
-
the possibility that the Company may be unable to achieve all intended benefits of its strategic initiatives;
-
the potential impact of public health outbreaks, epidemics and pandemics, including the ongoing challenges and uncertainties posed by the COVID-19 pandemic;
-
the Company’s failure to achieve expected or targeted future financial and operating performance and results;
-
actions and decisions of healthcare and pharmaceutical regulators;
-
changes in relevant laws and regulations, including but not limited to changes in tax, healthcare and pharmaceutical laws and regulations globally;
-
the ability to attract and retain key personnel;
-
the Company’s liquidity, capital resources and ability to obtain financing;
-
any regulatory, legal or other impediments to the Company’s ability to bring new products to market, including but not limited to “at-risk launches”;
-
success of clinical trials and the Company’s or its partners’ ability to execute on new product opportunities and develop, manufacture and commercialize products;
-
any changes in or difficulties with the Company’s manufacturing facilities, including with respect to inspections, remediation and restructuring activities, supply chain or inventory or the ability to meet anticipated demand;
-
the scope, timing and outcome of any ongoing legal proceedings, including government inquiries or investigations, and the impact of any such proceedings on the Company;
-
any significant breach of data security or data privacy or disruptions to our information technology systems;
-
risks associated with having significant operations globally;
-
the ability to protect intellectual property and preserve intellectual property rights;
-
changes in third-party relationships;
-
the effect of any changes in the Company’s or its partners’ customer and supplier relationships and customer purchasing patterns, including customer loss and business disruption being greater than expected following the Combination;
-
the impacts of competition, including decreases in sales or revenues as a result of the loss of market exclusivity for certain products;
-
changes in the economic and financial conditions of the Company or its partners;
-
uncertainties regarding future demand, pricing and reimbursement for the Company’s products;
-
uncertainties and matters beyond the control of management, including but not limited to general political and economic conditions and global exchange rates; and
-
inherent uncertainties involved in the estimates and judgments used in the preparation of financial statements, and the providing of estimates of financial measures, in accordance with U.S. GAAP and related standards or on an adjusted basis.
For more detailed information on the risks and uncertainties associated with Viatris, see the risks described in Part I, Item 1A in this Form 10-K, and our other filings with the SEC. You can access Viatris’ filings with the SEC through the SEC website at www.sec.gov or through our website and Viatris strongly encourages you to do so. Viatris routinely posts information that may be important to investors on our website at investor.viatris.com, and we use this website address as a means of disclosing material information to the public in a broad, non-exclusionary manner for purposes of the SEC’s Regulation Fair Disclosure (Reg FD). The contents of our website are not incorporated by reference in this Form 10-K and shall not be deemed “filed” under the Securities Exchange Act of 1934, as amended. Viatris undertakes no obligation to update any statements herein for revisions or changes after the filing date of this Form 10-K other than as required by law.
Explanatory Note
In accordance with ASC 805, Business Combinations, Mylan is considered the accounting acquirer of the Upjohn Business and all historical financial information of the Company prior to November 16, 2020 represents Mylan’s historical results and the Company’s thereafter.
Company Overview
Viatris is a global healthcare company formed in November 2020 through the combination of Mylan and Upjohn, whose mission is to empower people worldwide to live healthier at every stage of life. By integrating the strengths of these two businesses, including our global workforce of approximately 45,000 employees and contractors, Viatris aims to deliver increased access to affordable, quality medicines for patients worldwide regardless of geography or circumstance. Viatris brings together industry leading commercial, R&D, regulatory, manufacturing, legal and medical expertise complemented by a strong commitment to quality and unparalleled geographic footprint to deliver high-quality medicines to patients in more than 165 countries and territories. Viatris’ portfolio comprises more than 1,400 approved molecules across a wide range of key therapeutic areas, including globally recognized iconic and key brand, generic, complex generic, and biosimilar products. Viatris operates approximately 50 manufacturing sites worldwide that produce oral solid doses, injectables, complex dosage forms and APIs. Viatris is headquartered in the U.S., with global centers in Pittsburgh, Pennsylvania, Shanghai, China and Hyderabad, India.
Viatris reports segment information on the basis of markets and geography. In conjunction with the formation of Viatris, the Company has changed its reportable segments, from North America, Europe, and Rest of World, to Developed Markets, Greater China, JANZ, and Emerging Markets. This approach reflects the Company’s focus on bringing its broad and diversified portfolio of branded, complex generics and biosimilars, and generic products to people in markets everywhere. Our Developed Markets segment comprises our operations primarily in North America and Europe. Our Greater China segment includes our operations in China, Taiwan and Hong Kong. Our JANZ segment reflects our operations in Japan, Australia and New Zealand. Our Emerging Markets segment encompasses our operations in countries with developing markets and emerging economies including countries in Asia, the Middle East, South and Central America, Africa and Eastern Europe, and also includes the Company’s anti-retroviral franchise.
Certain Market and Industry Factors
The global pharmaceutical industry is a highly competitive and highly regulated industry. As a result, we face a number of industry-specific factors and challenges, which can significantly impact our results. The following discussion highlights some of these key factors and market conditions.
Generic products, particularly in the U.S., generally contribute most significantly to revenues and gross margins at the time of their launch, and even more so in periods of market exclusivity, or in periods of limited generic competition. As such, the timing of new product introductions can have a significant impact on the Company’s financial results. The entrance into the market of additional competition generally has a negative impact on the volume and pricing of the affected products. Additionally, pricing is often affected by factors outside of the Company’s control.Conversely, generic products generally experience less volatility over a longer period of time in Europe as compared to the U.S., primarily due to the role of government oversight of healthcare systems in the region.
For branded products, the majority of the product’s commercial value is usually realized during the period in which the product has market exclusivity. In the U.S. and some other countries, when market exclusivity expires and generic versions of a product are approved and marketed, there can often be very substantial and rapid declines in the branded product’s sales. For example, several companies launched a generic to Lyrica® in Japan in December 2020 despite pending patent infringement litigation. While the litigation remains ongoing, the rate of generic conversion is significant and, combined with market dynamics relating to the COVID-19 pandemic, the Company expects a significant reduction in the annual revenues of Lyrica®.
Certain markets in which we do business outside of the U.S. have undergone government-imposed price reductions, and further government-imposed price reductions are expected in the future. Such measures, along with the tender systems discussed below, are likely to have a negative impact on sales and gross profit in these markets. However, government initiatives in certain markets that appear to favor generic products could help to mitigate this unfavorable effect by increasing rates of generic substitution and penetration.
Additionally, a number of markets in which we operate outside of the U.S. have implemented, or may implement, tender systems for generic pharmaceuticals in an effort to lower prices. Generally speaking, tender systems can have an unfavorable impact on sales and profitability. Under such tender systems, manufacturers submit bids that establish prices for generic pharmaceutical products. Upon winning the tender, the winning company will receive priority placement for a period of time. The tender system often results in companies underbidding one another by proposing low pricing in order to win the tender. The loss of a tender by a third party to whom we supply API can also have a negative impact on our sales and profitability. Sales continue to be negatively affected by the impact of tender systems in certain countries.
Recent Developments
2020 Restructuring Program
During the fourth quarter of 2020, Viatris announced a significant global restructuring program in order to achieve synergies of $1 billion and ensure that the organization is optimally structured and efficiently resourced to deliver sustainable value to patients, shareholders, customers, and other stakeholders. Viatris’ restructuring initiative incorporates and expands on the restructuring program announced by Mylan N.V. earlier in 2020 as part of its business transformation efforts. The company expects to optimize its commercial capabilities and enabling functions, and close, downsize or divest up to 15 manufacturing facilities globally that are deemed to be no longer viable either due to surplus capacity, challenging market dynamics or a shift in its product portfolio toward more complex products. As a result, Viatris expects that up to 20% of its global workforce of approximately 45,000 may be impacted upon completion of the restructuring initiative.
For the committed restructuring actions, the Company expects to incur total pre-tax charges ranging between $1.1 billion and $1.4 billion. Such charges are expected to include between $350 million and $450 million of non-cash charges mainly related to accelerated depreciation and asset impairment charges, including inventory write-offs. The remaining estimated cash costs of between $750 million and $950 million are expected to be primarily related to severance and employee benefits expense, as well as other costs, including those related to contract terminations and decommissioning costs. In addition, management believes the potential annual savings related to these committed restructuring activities to be between $700 million and $900 million once fully implemented, with most of these savings expected to improve operating cash flow.
2016 Restructuring Program
Mylan previously announced a restructuring program representing a series of actions in certain locations that are anticipated to further streamline its operations globally. We have incurred total restructuring related costs of approximately $733.0 million through December 31, 2020. The 2016 Restructuring Program is substantially complete at December 31, 2020.
In April 2018, the FDA completed an inspection at Mylan’s plant in Morgantown, West Virginia and made observations through a Form 483. In the fourth quarter of 2018, Mylan received a warning letter related to the previously disclosed observations at the plant. The issues raised in the warning letter were addressed within the context of the Mylan’s comprehensive restructuring and remediation activities. On May 11, 2020 Mylan received the close-out of the warning letter. On December 11, 2020, the Company announced that it expects the Morgantown plant to be closed or divested as part of the 2020 Restructuring Program.
Impact of the Coronavirus Pandemic
As a leading global pharmaceutical company, Viatris is committed to continue doing its part in support of public health needs amid the evolving COVID-19 pandemic. The Company’s priorities remain protecting the health and safety of our workforce, continuing to produce critically needed medicines, deploying resources and expertise in the fight against COVID-19 through potential prevention and treatment efforts, supporting the communities in which we operate and maintaining the health of our overall business.
The following section discusses the important measures the Company is taking in light of the COVID-19 pandemic.
Employee Health and Safety
-
Viatris continues to align with government and health authority guidelines in an effort to safeguard our workforce and continues to make assessments on an ongoing basis.
-
While Viatris’ business operations are currently considered essential based on government guidelines throughout the world due to the important role pharmaceutical manufacturers play within the global healthcare system, many Viatris administrative offices continue operating under work from home protocols.
-
Because protecting the health and safety of our workforce remains paramount, Viatris has taken extra precautions at manufacturing facilities to aid in the protection of site personnel and operations, including the implementation of social distancing guidelines, daily health assessments and split shifts where feasible.
-
Many customer facing field personnel have moved to a remote engagement model to ensure continued support for healthcare professionals, patient care and access to needed products.
-
Global restrictions have been placed on travel and in-person meetings.
-
Viatris has taken steps to protect the safety of study participants, our employees and staff at clinical trial sites and ensure regulatory compliance and scientific integrity of trial data.
Continuing to Produce Critically Needed Medicines
Manufacturing and Supply
-
Viatris has activated worldwide business continuity plans to seek to ensure that our global supply chain platform continues to operate without significant disruption.
-
All of our manufacturing facilities, and those of our key global partners, are currently operational and, at this time, we are not experiencing any significant disruptions to our supply chain, including the availability of APIs. Also, we are currently not experiencing any negative impact on our customer service levels.
-
Viatris continues to engage with regulatory authorities around the world who are committed to maintaining ongoing regulatory processes while also continuing to make available our global R&D, regulatory and manufacturing expertise and capacity to partners who may be in need of additional resources.
Commercial Operations
-
We have and continue to experience certain negative fluctuations in demand trends due to COVID-19. We will continue to monitor trends closely as we work to ensure patients have access to needed medicine.
-
Inventory levels, both ours and those in our distribution channel, remain in-line with normal levels and are currently assessed to be sufficient for anticipated demand.
Deploying Resources and Expertise in the Fight Against COVID-19
Product Development
-
On May 12, 2020, Mylan announced a global collaboration with Gilead Sciences, Inc. to expand access to the investigational antiviral remdesivir for the potential treatment of COVID-19. Under the terms of the license agreement the Company has rights to manufacture and distribute remdesivir in 127 low-and middle-income countries, including India.
-
On July 6, 2020, Mylan announced that the DCGI approved its remdesivir 100 mg/vial for restricted emergency use in India as part of the DCGI’s accelerated approval process to address urgent, unmet needs amid the evolving COVID-19 pandemic.
-
On November 20, 2020, the WHO issued a conditional recommendation against the use of remdesivir in hospitalized patients, regardless of disease severity, as there was no evidence that remdesivir improved survival and other outcomes in these patients.
Maintaining the Health of Our Overall Business
Access to Capital Markets and Liquidity
While currently we are not experiencing any negative liquidity trends related to the COVID-19 pandemic, we continue to closely monitor developments and the potential negative impact on our operating performance and our ability to access the capital markets.
Due to the Company’s ability to generate significant cash flows from operations, as well as its revolving credit agreement, other short-term borrowing facilities and access to capital markets, we believe that we currently have, and will maintain, the ability to meet foreseeable liquidity needs.
Impact on Results of Operations
The global spread of COVID-19 has created significant volatility, uncertainty and economic disruption affecting the markets we serve, and has had a negative impact on our current year results of operations. The extent to which the COVID-19 pandemic will impact our business, operations and financial results in future periods will depend on numerous evolving factors that are beyond our control and that we may not be able to accurately predict. For additional information, see Results of Operations in Part II. Item 7.
Financial Summary
The table below is a summary of the Company’s financial results for the year ended December 31, 2020 compared to the prior year period:
| Year Ended December 31, | |||||||||||||||||||||||
| (In millions, except per share amounts) | 2020 | 2019 | Change | % Change | |||||||||||||||||||
| Total revenues | $ | 11,946.0 | $ | 11,500.5 | $ | 445.5 | 4 | % | |||||||||||||||
| Gross profit | 3,796.7 | 3,897.6 | (100.9) | (3) | % | ||||||||||||||||||
| (Loss) earnings from operations | (210.8) | 715.5 | (926.3) | (129) | % | ||||||||||||||||||
| Net (loss) earnings | (669.9) | 16.8 | (686.7) | nm | |||||||||||||||||||
| Diluted (loss) earnings per share | $ | (1.11) | $ | 0.03 | $ | (1.14) | nm |
A detailed discussion of the Company’s financial results can be found below in the section titled “Results of Operations.” As part of this discussion, we also report sales performance using the non-GAAP financial measures of “constant currency” net sales and total revenues. These measures provide information on the change in net sales and total revenues assuming that foreign currency exchange rates had not changed between the prior and current period. The comparisons presented at constant currency rates reflect comparative local currency sales at the prior year’s foreign exchange rates. We routinely evaluate our net sales and total revenues performance at constant currency so that sales results can be viewed without the impact of foreign currency exchange rates, thereby facilitating a period-to-period comparison of our operational activities, and believe that this presentation also provides useful information to investors for the same reason.
More information about non-GAAP measures used by the Company as part of this discussion, including adjusted cost of sales, adjusted gross margins, adjusted net earnings, and adjusted EBITDA (all of which are defined below) are discussed further in this Part II. Item 7 under Results of Operations and Results of Operations — Use of Non-GAAP Financial Measures.
Results of Operations
2020 Compared to 2019
| Year Ended December 31, | |||||||||||||||||||||||||||||||||||
| (In millions) | 2020 | 2019 | % Change | 2020 Currency Impact (1) | 2020 Constant Currency Revenues | Constant Currency % Change (2) | |||||||||||||||||||||||||||||
| Net sales | |||||||||||||||||||||||||||||||||||
| Developed Markets | $ | 8,510.9 | $ | 8,240.0 | 3 | % | $ | (72.4) | $ | 8,438.5 | 2 | % | |||||||||||||||||||||||
| Greater China | 259.9 | 214.6 | 21 | % | 1.5 | 261.4 | 22 | % | |||||||||||||||||||||||||||
| JANZ | 1,195.3 | 1,192.5 | — | % | (4.8) | 1,190.5 | — | % | |||||||||||||||||||||||||||
| Emerging Markets | 1,853.8 | 1,723.2 | 8 | % | 103.7 | 1,957.5 | 14 | % | |||||||||||||||||||||||||||
| Total net sales | 11,819.9 | 11,370.3 | 4 | % | 28.0 | 11,847.9 | 4 | % | |||||||||||||||||||||||||||
| Other revenues (3) | 126.1 | 130.2 | (3) | % | (1.0) | 125.1 | (4) | % | |||||||||||||||||||||||||||
| Consolidated total revenues (4) | $ | 11,946.0 | $ | 11,500.5 | 4 | % | $ | 27.0 | $ | 11,973.0 | 4 | % |
(1)Currency impact is shown as unfavorable (favorable).
(2)The constant currency percentage change is derived by translating net sales or revenues for the current period at prior year comparative period exchange rates, and in doing so shows the percentage change from 2020 constant currency net sales or revenues to the corresponding amount in the prior year.
(3)For the year ended December 31, 2020, other revenues in Developed Markets, Greater China, JANZ, and Emerging Markets were approximately $94.0 million, $0.3 million, $10.5 million, and $21.3 million, respectively.
(4)Amounts exclude intersegment revenue which eliminates on a consolidated basis.
Total Revenues
For the year ended December 31, 2020, the Company reported total revenues of $11.95 billion, compared to $11.50 billion for the comparable prior year period, representing an increase of $445.5 million, or 4%. Total revenues include both net sales and other revenues from third parties. Net sales for the year ended December 31, 2020 were $11.82 billion, compared to $11.37 billion for the comparable prior year period, representing an increase of $449.6 million, or 4%. Other revenues for the year ended December 31, 2020 were $126.1 million, compared to $130.2 million for the comparable prior year period, a decrease of $4.1 million.
The increase in net sales was primarily the result of increases in net sales in the Developed Markets segment of 3%, the Emerging Markets segment of 8%, and the Greater China segment of 21%. The Company’s net sales were unfavorably impacted by the effect of foreign currency translation, primarily reflecting changes in the U.S. Dollar as compared to the currencies of subsidiaries in India and other emerging markets, partially offset by the favorable effect of foreign currency translation in countries within the EU. The net unfavorable impact of foreign currency translation on current year net sales was approximately $28.0 million, or less than 1%. On a constant currency basis, the increase in net sales was approximately $477.6 million, or 4% for the year ended December 31, 2020. This increase was driven by net sales totaling $864.9 million from the Upjohn Business following the consummation of the Combination and new product sales, partially offset by a decrease in net sales from existing products as a result of lower pricing and volumes. We estimate that the COVID-19 pandemic negatively impacted our 2020 net sales by approximately 3%, primarily driven by lower retail pharmacy demand, lower non-COVID-19 related patient hospital visits and a lower number of in person meetings with prescribers and payors.
From time to time, a limited number of our products may represent a significant portion of our net sales, gross profit and net earnings. Generally, this is due to the timing of new product introductions and the amount, if any, of additional competition in the market. Our top ten products in terms of net sales, in the aggregate, represented approximately 23% for the years ended December 31, 2020 and 2019, respectively. This percentage may fluctuate based upon the timing of new product launches, seasonality and the timing of the discontinuation of products. As a result of the Combination, we estimate that the percentage of our top products could change in future periods.
Net sales are derived from our four reporting segments: Developed Markets, Greater China, JANZ and Emerging Markets.
Developed Markets Segment
Net sales from Developed Markets increased by $270.9 million or 3% during the year ended December 31, 2020 when compared to the prior year. Net sales within North America totaled approximately $4.2 billion and net sales within Europe totaled approximately $4.3 billion. This increase was due primarily to new product sales, and net sales from the Upjohn Business following the consummation of the Combination of $317.5 million. This increase was partially offset by lower volumes primarily driven by the EpiPen® Auto-Injector, and to a lesser extent, by lower pricing of existing products, driven by changes in the competitive environment, including for Levothyroxine Sodium. Lower volumes of existing products were partially offset by increased WixelaTM InhubTM volumes. The favorable impact of foreign currency translation on current period net sales was approximately $72.4 million, or 1%. Constant currency net sales increased by approximately $198.5 million, or 2% when compared to the prior year.
Greater China Segment
Net sales from Greater China increased by $45.3 million or 21% for the year ended December 31, 2020 when compared to the prior year. This increase was the result of net sales from the Upjohn Business following the consummation of the Combination of $226.5 million. This was partially offset by lower net sales of existing products, driven by lower volumes, and to a lesser extent, lower pricing. Lower volumes on net sales of existing products were negatively impacted by the competitive market conditions, including VBP, and COVID-19. The unfavorable impact of foreign currency translation was approximately $1.5 million, or 1%. Constant currency net sales increased by approximately $46.8 million, or 22% when compared to the prior year.
JANZ Segment
Net sales from JANZ increased by $2.8 million or less than 1% for the year ended December 31, 2020 when compared to the prior year. This increase was the result of net sales from the Upjohn Business following the consummation of the Combination of $171.8 million, and to a lesser extent, new product sales, primarily in Australia. These increases were partially offset by lower net sales of existing products, driven by lower volumes, and to a lesser extent, lower pricing. Lower volumes on net sales of existing products were effected by the estimated negative impact of COVID-19, and the impact of the termination of the collaboration agreement with Pfizer in Japan. As a result of the termination, and the repurchase of collaboration inventory, the Company reduced revenue by $86.5 million. Lower pricing on net sales of existing products were driven by government price reductions in Japan and Australia. Foreign currency translation had a favorable impact of approximately $4.8 million, or less than 1%. Constant currency net sales decreased by approximately $2.0 million, or less than 1% when compared to the prior year.
Emerging Markets Segment
Net sales from Emerging Markets increased by $130.6 million or 8% for the year ended December 31, 2020 when compared to the prior year. This increase was the result of net sales from the Upjohn Business following the consummation of the Combination of $149.1 million and new product sales, including Remdesivir in India and other emerging markets. These increases were partially offset by lower net sales of existing products, driven by lower pricing. Volumes on existing products increased primarily as a result of increases from the Company’s ARV franchise. The increase in net sales was partially offset by the unfavorable impact of foreign currency translation of $103.7 million, or 6%. Constant currency net sales increased by approximately $234.3 million, or 14%.
Cost of Sales and Gross Profit
Cost of sales increased from $7.60 billion from the year ended December 31, 2019 to $8.15 billion for the year ended December 31, 2020. Cost of sales was primarily impacted by purchase accounting related amortization of acquired intangible assets and other special items, which are described further in the section titled Use of Non-GAAP Financial Measures. Gross profit for the year ended December 31, 2020 was $3.80 billion and gross margins were 32%. For the year ended December 31, 2019, gross profit was $3.90 billion and gross margins were 34%. Gross margins were negatively impacted by the decline in gross profit from net sales of existing products, partially offset by net sales of new product sales, of approximately $380 million. This decline in gross profit was primarily the result of lower pricing in the Developed Markets and lower net sales in Greater China and JANZ and includes the impacts of unfavorable competitive market conditions, COVID-19 and the termination of a collaboration agreement with Pfizer in Japan. In addition, gross margins were negatively impacted by
approximately $182 million from higher restructuring and acquisition related costs, as well as additional costs due to COVID-19. These unfavorable items were partially offset by gross profit from the Combination of approximately $223 million, and lower legacy business amortization and impairment charges compared to the prior year of approximately $238 million. Adjusted gross margins were approximately 54% and 53% for the years ended December 31, 2020 and 2019, respectively.
A reconciliation between cost of sales, as reported under U.S. GAAP, and adjusted cost of sales and adjusted gross margin for the year ended December 31, 2020 compared to the year ended December 31, 2019 is as follows:
| Year Ended | |||||||||||
| December 31, | |||||||||||
| (In millions) | 2020 | 2019 | |||||||||
| U.S. GAAP cost of sales | $ | 8,149.3 | $ | 7,602.9 | |||||||
| Deduct: | |||||||||||
| Purchase accounting amortization and other related items | (1,933.6) | (1,767.1) | |||||||||
| Acquisition related items | (16.9) | (6.8) | |||||||||
| Restructuring and related costs | (207.7) | (100.9) | |||||||||
| Shared-based compensation expense | (1.5) | (1.1) | |||||||||
| Other special items | (438.1) | (366.0) | |||||||||
| Adjusted cost of sales | $ | 5,551.5 | $ | 5,361.0 | |||||||
| Adjusted gross profit (a) | $ | 6,394.5 | $ | 6,139.5 | |||||||
| Adjusted gross margin (a) | 54 | % | 53 | % |
(a)Adjusted gross profit is calculated as total revenues less adjusted cost of sales. Adjusted gross margin is calculated as adjusted gross profit divided by total revenues.
Operating Expenses
Research & Development Expense
R&D expense for the year ended December 31, 2020 was $555.1 million, compared to $639.9 million for the prior year, a decrease of $84.8 million. This decrease was primarily due to lower expenditures related to the reprioritization of global programs, and higher payments in the prior year related to licensing arrangements for products in development. Partially offsetting this decrease was R&D expense incurred from the Combination of $22.4 million.
Selling, General & Administrative Expense
SG&A expense for the year ended December 31, 2020 was $3.34 billion, compared to $2.56 billion for the prior year, an increase of $781.0 million. The increase was primarily due to an increase of approximately $587.5 million in Combination related costs. These costs include approximately $200.9 million for advisory and consulting fees, $303.5 million related to the Company’s obligation to reimburse Pfizer for certain financing and transaction related costs under the BCA and SDA and approximately $69.3 million of employee related change in control and retention amounts. Also contributing to the increase were costs related to the Upjohn Business incurred from the date of the Combination of $280.7 million, and approximately $111.2 million increase in restructuring costs due to the implementation of the 2020 restructuring program. Partially offsetting these increases were lower selling and promotional expenses, including through our active management and certain lower expenses as a result of COVID-19.
Litigation Settlements and Other Contingencies, Net
During the year ended December 31, 2020, the Company recorded a net charge of $107.8 million for litigation settlements and other contingencies, net, compared to a net gain of $21.4 million in the prior year.
The following table includes the losses / (gains) recognized in litigation settlements and other contingencies, net during the year ended December 31, 2020 and 2019, respectively:
| Year Ended | |||||||||||
| December 31, | |||||||||||
| (In millions) | 2020 | 2019 | |||||||||
| Respiratory delivery platform contingent consideration adjustment | $ | 73.1 | $ | (20.4) | |||||||
| Litigation settlements, net | 34.7 | (1.0) | |||||||||
| Total litigation settlements and other contingencies, net | $ | 107.8 | $ | (21.4) |
During the year ended December 31, 2020, the Company recorded a $73.1 million loss for fair value adjustments related to respiratory delivery platform contingent consideration. Additionally, the Company recorded a net charge of approximately $34.7 million related to a number of litigation matters.
During the year ended December 31, 2019, the Company recognized a net gain in litigation settlements of approximately $1.0 million. This net gain was primarily due to a favorable litigation settlement related to the Celgene Corporation matter of $62.0 million, which was partially offset by litigation related charges for settlements reached during the year. Charges for litigation related matters included $18.0 million for the modafinil antitrust matter and $30.0 million for Mylan’s settlement with the SEC. In addition, a $20.4 million gain was recognized for the reduction of contingent consideration related to the respiratory delivery platform.
Interest Expense
Interest expense for the year ended December 31, 2020 totaled $497.8 million, compared to $517.3 million for the year ended December 31, 2019, a decrease of $19.5 million. The decrease is primarily due to lower average long-term debt balances during the current year, partially offset by the interest expense related to the additional debt assumed in the Combination of approximately $26.8 million.
Other Expense, Net
Other expense, net was $12.6 million for the year ended December 31, 2020, compared to other expense, net of $43.8 million for the prior year. Other expense (income), net includes losses from equity affiliates, foreign exchange gains and losses, and interest and dividend income. Other expense (income), net was comprised of the following for the year ended December 31, 2020 and 2019, respectively:
| Year Ended December 31, | |||||||||||
| (In millions) | 2020 | 2019 | |||||||||
| Losses from equity affiliates, primarily clean energy investments | $ | 48.4 | $ | 62.1 | |||||||
| Foreign exchange losses/(gains), net | 2.2 | (9.4) | |||||||||
| Other gains, net | (38.1) | (8.9) | |||||||||
| Other expense, net | $ | 12.5 | 43.8 |
Income Tax (Benefit) Provision
For the year ended December 31, 2020, the Company recognized an income tax benefit of $51.3 million, compared to an income tax provision of $137.6 million for the comparable prior year, an increase in the benefit of $188.9 million. The current year benefit recognized was the result of tax impacts related to the Combination. These impacts include a benefit related to recording deferred tax assets for non-U.S. entities that will be taxed in the both their local jurisdictions and U.S., offset by the loss of certain attributes in non-U.S. jurisdictions and non-deductible transaction and employee related costs. During the year ended December 31, 2019, we reached an agreement in principle with the IRS to resolve all issues relating to our positions on the EPD Business Acquisition. As a result, the Company recorded a reserve of approximately $155.0 million as part of its
liability for uncertain tax positions, with a net impact to the income tax provision of approximately $144.9 million. Also impacting the current and prior year income tax provision and benefit, respectively, was the changing mix of income earned in jurisdictions with differing tax rates.
2019 Compared to 2018
| Year Ended December 31, | |||||||||||||||||||||||||||||||||||
| (In millions) | 2019 | 2018 | % Change | 2019 Currency Impact (1) | 2019 Constant Currency Revenues | Constant Currency % Change (2) | |||||||||||||||||||||||||||||
| Net sales | |||||||||||||||||||||||||||||||||||
| Developed Markets | $ | 8,240.0 | $ | 8,289.1 | (1) | % | $ | 231.0 | $ | 8,471.0 | 2 | % | |||||||||||||||||||||||
| Greater China | 214.6 | 168.1 | 28 | % | 8.6 | 223.2 | 33 | % | |||||||||||||||||||||||||||
| JANZ | 1,192.5 | 1,132.8 | 5 | % | 27.8 | 1,220.3 | 8 | % | |||||||||||||||||||||||||||
| Emerging Markets | 1,723.2 | 1,678.7 | 3 | % | 55.0 | 1,778.2 | 6 | % | |||||||||||||||||||||||||||
| Total net sales | 11,370.3 | 11,268.7 | 1 | % | 322.4 | 11,692.7 | 4 | % | |||||||||||||||||||||||||||
| Other revenues (3) | 130.2 | 165.2 | (21) | % | 2.1 | 132.3 | (20) | % | |||||||||||||||||||||||||||
| Consolidated total revenues (4) | $ | 11,500.5 | $ | 11,433.9 | 1 | % | $ | 324.5 | $ | 11,825.0 | 3 | % |
(1)Currency impact is shown as unfavorable (favorable).
(2)The constant currency percentage change is derived by translating net sales or revenues for the current period at prior year comparative period exchange rates, and in doing so shows the percentage change from 2019 constant currency net sales or revenues to the corresponding amount in the prior year.
(3)For the year ended December 31, 2019, other revenues in Developed Markets, Greater China, JANZ, and Emerging Markets were approximately $90.2 million, $0.5 million, $3.1 million, and $36.4 million, respectively.
(4)Amounts exclude intersegment revenue which eliminates on a consolidated basis.
Total Revenues
For the year ended December 31, 2019, the Company reported total revenues of $11.50 billion compared to $11.43 billion for the comparable prior year period, representing an increase of $66.6 million, or 1%. Total revenues include both net sales and other revenues from third parties. Net sales for the year ended December 31, 2019 were $11.37 billion, compared to $11.27 billion for the comparable prior year period, representing an increase of $101.6 million, or 1%. Other revenues for the year ended December 31, 2019 were $130.2 million, compared to $165.2 million for the comparable prior year period, a decrease of $35.0 million.
The increase in net sales was the result of increases in net sales in the JANZ segment of 5%, the Greater China segment of 28%, and the Emerging Markets segment of 3%, partially offset by a decrease in the Developed Markets segment of 1%. The Company’s net sales were unfavorably impacted by the effect of foreign currency translation, primarily reflecting changes in the U.S. Dollar as compared to the currencies of subsidiaries in the EU, Australia and India. The unfavorable impact of foreign currency translation on current year net sales was approximately $322.4 million, or 3%. On a constant currency basis, the increase in net sales was approximately $424.0 million, or 4% for the year ended December 31, 2019. This increase was driven by new product sales, partially offset by a decrease in net sales from existing products as a result of lower pricing and volumes.
From time to time, a limited number of our products may represent a significant portion of our net sales, gross profit and net earnings. Generally, this is due to the timing of new product introductions and the amount, if any, of additional competition in the market. Our top ten products in terms of net sales, in the aggregate, represented approximately 23% and 20% for the years ended December 31, 2019 and 2018, respectively. This percentage may fluctuate based upon the timing of new product launches, seasonality and the timing of the discontinuation of products.
Net sales are derived from our four reporting segments: Developed Markets, Greater China, JANZ and Emerging Markets.
Developed Markets Segment
Net sales from Developed Markets decreased by $49.1 million or 1% during the year ended December 31, 2019 when compared to the prior year. Net sales within North America totaled approximately $4.2 billion and net sales within Europe totaled approximately $4.1 billion. New product sales, including the WixelaTM InhubTM, Fulphila® (biosimilar to Neulasta®) and YUPELRITM, were partially offset by lower net sales from existing products due to lower volumes and pricing driven by changes in the competitive environment and portfolio rationalization. In addition, net sales were negatively impacted by the unfavorable impact of foreign currency translation of $231.0 million, or 3%. Constant currency net sales increased by approximately $181.9 million, or 2% when compared to the prior year.
Greater China Segment
Net sales from Greater China increased by $46.5 million or 28% for the year ended December 31, 2019 when compared to the prior year. This increase was primarily the result of higher net sales from existing products, primarily driven by higher volumes, and to a lesser extent, favorable pricing and new product sales. These increases were partially offset by the unfavorable impact of foreign currency translation of $8.6 million, or 5%. Constant currency net sales increased by approximately $55.1 million, or 33% when compared to the prior year.
JANZ Segment
Net sales from JANZ increased by $59.7 million or 5% for the year ended December 31, 2019 when compared to the prior year. This increase was primarily the result of higher net sales from existing products and new product sales. The increase to net sales from existing products was driven by higher volumes and was partially offset by unfavorable pricing. New products sales was primarily due to new product sales in Australia. These increases were partially offset by the unfavorable impact of foreign currency translation of $27.8 million, or 3%. Constant currency net sales increased by approximately $87.5 million, or 8% when compared to the prior year.
Emerging Markets Segment
Net sales from Emerging Markets increased by $44.5 million or 3% for the year ended December 31, 2019 when compared to the prior year. This increase was primarily the result of higher volumes of existing products and, to a lesser extent, new product sales. Volumes of existing products increased primarily due to increases in the Company’s ARV franchise and certain emerging markets. The increase in net sales as a result of new products was primarily due to new product sales in certain emerging markets and from the Company’s ARV franchise. These increases were partially offset by lower pricing on existing products and the unfavorable impact of foreign currency translation. Overall, net sales from Emerging Markets were unfavorably impacted by the effect of foreign currency translation of approximately $55.0 million, or 3%. Constant currency net sales increased by approximately $99.5 million, or 6%.
Cost of Sales and Gross Profit
Cost of sales increased from $7.43 billion for the year ended December 31, 2018 to $7.60 billion for the year ended December 31, 2019. Cost of sales was primarily impacted by purchase accounting related amortization of acquired intangible assets and other special items, which are described further in the section titled Use of Non-GAAP Financial Measures. Gross profit for the year ended December 31, 2019 was $3.90 billion and gross margins were 34%. For the year ended December 31, 2018, gross profit was $4.00 billion and gross margins were 35%. Gross margins were negatively impacted by the decline in sales of existing products by approximately 550 basis points. The decline in sales of existing products was primarily in North America and includes the impacts of product rationalization. Partially offsetting this impact, gross margins were positively impacted by approximately 500 basis points due to new product introductions primarily in North America. Adjusted gross margins were approximately 53% and 54% for the years ended December 31, 2019 and 2018, respectively. Adjusted gross margins were negatively impacted by lower gross profit from sales of existing products partially offset by gross margins on new product introductions primarily in North America.
A reconciliation between cost of sales, as reported under U.S. GAAP, and adjusted cost of sales and adjusted gross margin for the year ended December 31, 2019 compared to the year ended December 31, 2018 is as follows:
| Year Ended December 31, | |||||||||||
| (In millions) | 2019 | 2018 | |||||||||
| U.S. GAAP cost of sales | $ | 7,602.9 | $ | 7,432.3 | |||||||
| Deduct: | |||||||||||
| Purchase accounting amortization and other related items | (1,767.1) | (1,833.3) | |||||||||
| Acquisition related items | (6.8) | (2.9) | |||||||||
| Restructuring and related costs | (100.9) | (118.4) | |||||||||
| Shared-based compensation expense | (1.1) | — | |||||||||
| Other special items | (366.0) | (225.1) | |||||||||
| Adjusted cost of sales | $ | 5,361.0 | $ | 5,252.6 | |||||||
| Adjusted gross profit (a) | $ | 6,139.5 | $ | 6,181.3 | |||||||
| Adjusted gross margin (a) | 53 | % | 54 | % |
(a)Adjusted gross profit is calculated as total revenues less adjusted cost of sales. Adjusted gross margin is calculated as adjusted gross profit divided by total revenues.
Operating Expenses
Research & Development Expense
R&D expense for the year ended December 31, 2019 was $639.9 million, compared to $704.5 million for the prior year, a decrease of $64.6 million. This decrease was primarily due to lower expenditures related to the reprioritization of global programs and lower restructuring related costs.
Selling, General & Administrative Expense
SG&A expense for the year ended December 31, 2019 was $2.56 billion, compared to $2.44 billion for the prior year, an increase of $122.6 million. The increase was primarily due to an increase of approximately $82.5 million for consulting fees and other expenses primarily related to the Combination in addition to increased investment in selling and marketing activities. Also contributing to the increase was higher share-based compensation expense of approximately $60.7 million as a result of the reversal of all of the cumulative expense related to certain performance-based awards totaling $70.6 million in the prior year. Partially offsetting these increases was bad debt expense of approximately $26.5 million incurred in the prior year related to a special business interruption event for one customer and $20.0 million of compensation expense for an additional discretionary bonus for a certain group of employees in the prior year. None of the employees who received the 2018 discretionary bonus were named executive officers.
Litigation Settlements and Other Contingencies, Net
During the year ended December 31, 2019, the Company recorded a net gain of $21.4 million for litigation settlements and other contingencies, net, compared to $49.5 million in the prior year.
The following table includes the (gains) / losses recognized in litigation settlements and other contingencies, net during the year ended December 31, 2019 and 2018, respectively:
| Year Ended | |||||||||||
| December 31, | |||||||||||
| (In millions) | 2019 | 2018 | |||||||||
| Respiratory delivery platform contingent consideration adjustment | $ | (20.4) | $ | (44.0) | |||||||
| Jai Pharma Limited and other contingent consideration adjustments | — | 2.5 | |||||||||
| Litigation settlements, net | (1.0) | (8.0) | |||||||||
| Total litigation settlements and other contingencies, net | $ | (21.4) | $ | (49.5) |
During the year ended December 31, 2019, the Company recognized a net gain in litigation settlements of approximately $1.0 million. This net gain was primarily due to a favorable litigation settlement related to the Celgene Corporation matter of $62.0 million, which was partially offset by litigation related charges for settlements reached during the year. Charges for litigation related matters included $18.0 million for the modafinil antitrust matter and $30.0 million for Mylan’s settlement with the SEC. In addition, a $20.4 million gain was recognized for the reduction of contingent consideration related to the acquisition of the exclusive worldwide rights to develop, manufacture and commercialize a generic equivalent to GlaxoSmithKline’s Advair® Diskus incorporating Pfizer’s respiratory delivery platform.
Litigation settlements for the year ended December 31, 2018 consisted primarily of a gain of approximately $22.9 million related to a favorable litigation settlement, which was partially offset by litigation related charges of approximately $14.9 million related to an antitrust and a patent infringement matter. In addition, a $44.0 million gain was recognized for the change in value of contingent consideration related to the respiratory delivery platform, which was partially offset by losses incurred on other contingent consideration.
Interest Expense
Interest expense for the year ended December 31, 2019 totaled $517.3 million, compared to $542.3 million for the year ended December 31, 2018, a decrease of $25.0 million. The decrease is primarily due to lower average long-term debt balances during the current year.
Other Expense, Net
Other expense, net, was $43.8 million for the year ended December 31, 2019, compared to other expense, net of $64.9 million for the prior year. Other expense (income), net includes losses from equity affiliates, foreign exchange gains and losses, and interest and dividend income. Other expense (income), net was comprised of the following for the year ended December 31, 2019 and 2018, respectively:
| Year Ended December 31, | |||||||||||
| (In millions) | 2019 | 2018 | |||||||||
| Losses from equity affiliates, primarily clean energy investments | $ | 62.1 | $ | 78.7 | |||||||
| Foreign exchange gains, net | (9.4) | (20.0) | |||||||||
| Other (gains)/losses, net | (8.9) | 6.2 | |||||||||
| Other expense, net | $ | 43.8 | $ | 64.9 |
Income Tax Provision (Benefit)
For the year ended December 31, 2019, the Company recognized an income tax provision of $137.6 million, compared to an income tax benefit of $54.1 million for the comparable prior year, an increase of $191.7 million. During the year ended December 31, 2019, we reached an agreement in principle with the IRS to resolve all issues relating to our positions on the EPD Business Acquisition. As a result, the Company recorded a reserve of approximately $155.0 million as part of its liability for
uncertain tax positions, with a net impact to the income tax provision of approximately $144.9 million. The tax provision for the year ended December 31, 2018 included a net benefit to the income tax provision of approximately $53.0 million as a result of the federal and state audits and settlements and expirations of certain state, federal, and foreign statutes of limitations. Partially offsetting this benefit was an increase in the reserve for uncertain tax benefits of approximately $18.0 million for certain other matters. Also impacting the current and prior year income tax provision and benefit, respectively, was the changing mix of income earned in jurisdictions with differing tax rates.
Use of Non-GAAP Financial Measures
Whenever the Company uses non-GAAP financial measures, we provide a reconciliation of the non-GAAP financial measures to their most directly comparable U.S. GAAP financial measure. Investors and other readers are encouraged to review the related U.S. GAAP financial measures and the reconciliation of non-GAAP measures to their most directly comparable U.S. GAAP measure and should consider non-GAAP measures only as a supplement to, not as a substitute for or as a superior measure to, measures of financial performance prepared in accordance with U.S. GAAP. Additionally, since these are not measures determined in accordance with U.S. GAAP, non-GAAP financial measures have no standardized meaning across companies, or as prescribed by U.S. GAAP and, therefore, may not be comparable to the calculation of similar measures or measures with the same title used by other companies.
Management uses these measures internally for forecasting, budgeting, measuring its operating performance, and incentive-based awards. Primarily due to acquisitions and other significant events which may impact comparability of our periodic operating results, we believe that an evaluation of our ongoing operations (and comparisons of our current operations with historical and future operations) would be difficult if the disclosure of our financial results was limited to financial measures prepared only in accordance with U.S. GAAP. We believe that non-GAAP financial measures are useful supplemental information for our investors and when considered together with our U.S. GAAP financial measures and the reconciliation to the most directly comparable U.S. GAAP financial measure, provide a more complete understanding of the factors and trends affecting our operations. The financial performance of the Company is measured by senior management, in part, using adjusted metrics as described below, along with other performance metrics.
Adjusted Cost of Sales and Adjusted Gross Margin
We use the non-GAAP financial measure “adjusted cost of sales” and the corresponding non-GAAP financial measure “adjusted gross margin.” The principal items excluded from adjusted cost of sales include restructuring, acquisition related and other special items and purchase accounting amortization and other related items, which are described in greater detail below.
Adjusted Net Earnings
Adjusted net earnings is a non-GAAP financial measure and provides an alternative view of performance used by management. Management believes that, primarily due to acquisition activity and other significant events, an evaluation of the Company’s ongoing operations (and comparisons of its current operations with historical and future operations) would be difficult if the disclosure of its financial results were limited to financial measures prepared only in accordance with U.S. GAAP. Management believes that adjusted net earnings is an important internal financial metric related to the ongoing operating performance of the Company, and are therefore useful to investors and that their understanding of our performance is enhanced by this measure. Actual internal and forecasted operating results and annual budgets used by management include adjusted net earnings.
EBITDA and Adjusted EBITDA
EBITDA and adjusted EBITDA are non-GAAP financial measures that the Company believes are appropriate to provide additional information to investors to demonstrate the Company’s ability to comply with financial debt covenants and assess the Company’s ability to incur additional indebtedness. The Company also believes that adjusted EBITDA better focuses management on the Company’s underlying operational results and true business performance and, beginning in 2020, is used, in part, for management’s incentive compensation. We calculate “EBITDA” as U.S. GAAP net earnings (loss) adjusted for net contribution attributable to equity method investments, income tax provision (benefit), interest expense and depreciation and amortization. EBITDA is further adjusted for share-based compensation expense, litigation settlements and other contingencies, net, and restructuring and other special items to determine “adjusted EBITDA”. These adjustments are generally permitted under our credit agreement in calculating Adjusted EBITDA for determining compliance with our debt covenants.
The significant items excluded from adjusted cost of sales, adjusted net earnings, EBITDA and adjusted EBITDA include:
Purchase Accounting Amortization and Other Related Items
The ongoing impact of certain amounts recorded in connection with acquisitions of both businesses and assets is excluded from adjusted cost of sales, adjusted net earnings, EBITDA and adjusted EBITDA. These amounts include the amortization of intangible assets, inventory step-up, property, plant and equipment step-up, and intangible asset impairment charges, including for in-process research and development. For the acquisition of businesses accounted for under the provisions of the Financial Accounting Standards Board Accounting Standards Codification Topic 805, these purchase accounting impacts are excluded regardless of the financing method used for the acquisitions, including the use of cash, long-term debt, the issuance of common stock, contingent consideration or any combination thereof.
Upfront and Milestone-Related R&D Expenses
These expenses and payments are excluded from adjusted net earnings and adjusted EBITDA because they generally occur at irregular intervals and are not indicative of the Company’s ongoing operations.
Accretion of Contingent Consideration Liability and Other Fair Value Adjustments
The impact of changes to the fair value of contingent consideration and accretion expense are excluded from adjusted net earnings and adjusted EBITDA because they are not indicative of the Company’s ongoing operations due to the variability of the amounts and the lack of predictability as to the occurrence and/or timing and management believes their exclusion is helpful to understanding the underlying, ongoing operational performance of the business.
Share-based Compensation Expense
Share-based compensation expense is excluded from adjusted net earnings and adjusted EBITDA. Our share-based compensation programs have become increasingly weighted toward performance-based compensation, which leads to variability and to a lack of predictability as to the occurrence and/or timing of amounts incurred. As such, management believes the exclusion of such amounts on an ongoing basis is helpful to understanding the underlying operational performance of the business.
Restructuring, Acquisition Related and Other Special Items
Costs related to restructuring, acquisition and integration activities and other actions are excluded from adjusted cost of sales, adjusted net earnings and adjusted EBITDA, as applicable. These amounts include items such as:
-
Costs related to formal restructuring programs and actions, including costs associated with facilities to be closed or divested, employee separation costs, impairment charges, accelerated depreciation, incremental manufacturing variances, equipment relocation costs, decommissioning and other restructuring related costs;
-
Certain acquisition related remediation and integration and planning costs, as well as other costs associated with acquisitions such as advisory and legal fees, certain financing related costs, certain reimbursements related to the Company’s obligation to reimburse Pfizer for certain financing and transaction related costs under the BCA and SDA, certain other TSA related exit costs, and other business transformation and/or optimization initiatives, which are not part of a formal restructuring program, including employee separation and post-employment costs;
-
The pre-tax loss of the Company’s clean energy investments, whose activities qualify for income tax credits under the Code; only included in adjusted net earnings is the net tax effect of the entity’s activities;
-
Other costs, incurred from time to time, related to certain special events or activities that lead to gains or losses, including, but not limited to, incremental manufacturing variances, asset write-downs, or liability adjustments;
-
Certain costs to further develop and optimize our global enterprise resource planning systems, operations and supply chain; and
-
The impact of changes related to uncertain tax positions is excluded from adjusted net earnings. In addition, tax adjustments to adjusted earnings are recorded to present items on an after-tax basis consistent with the presentation of adjusted net earnings.
The Company has undertaken restructurings and other optimization initiatives of differing types, scope and amount during the covered periods and, therefore, these charges should not be considered non-recurring; however, management excludes these amounts from adjusted net earnings and adjusted EBITDA because it believes it is helpful to understanding the underlying, ongoing operational performance of the business.
Litigation Settlements, Net
Charges and gains related to legal matters, such as those discussed in Note 19 Litigation included in Part II. Item 8 of this Form 10-K are generally excluded from adjusted net earnings and adjusted EBITDA. Normal, ongoing defense costs incurred by the Company in the normal course of our business are not excluded.
Reconciliation of U.S. GAAP Net Earnings to Adjusted Net Earnings
A reconciliation between net (loss) earnings as reported under U.S. GAAP, and adjusted net earnings for the periods shown follows:
| Year Ended December 31, | |||||||||||||||||||||||||||||||||||
| (In millions, except per share amounts) | 2020 | 2019 | 2018 | ||||||||||||||||||||||||||||||||
| U.S. GAAP net (loss) earnings | $ | (669.9) | $ | 16.8 | $ | 352.5 | |||||||||||||||||||||||||||||
| Purchase accounting related amortization (primarily included in cost of sales) (a) | 1,933.6 | 1,767.0 | 1,833.9 | ||||||||||||||||||||||||||||||||
| Litigation settlements and other contingencies, net | 107.8 | (21.4) | (49.5) | ||||||||||||||||||||||||||||||||
| Interest expense (primarily clean energy investment financing and accretion of contingent consideration) | 12.6 | 27.2 | 39.7 | ||||||||||||||||||||||||||||||||
| Clean energy investments pre-tax loss | 48.4 | 62.1 | 78.7 | ||||||||||||||||||||||||||||||||
| Acquisition related costs (primarily included in SG&A) (b) | 613.6 | 89.5 | 21.4 | ||||||||||||||||||||||||||||||||
| Restructuring related costs (c) | 323.1 | 104.6 | 240.2 | ||||||||||||||||||||||||||||||||
| Share-based compensation expense (d) | 79.2 | 56.8 | — | ||||||||||||||||||||||||||||||||
| Other special items included in: | |||||||||||||||||||||||||||||||||||
| Cost of sales (e) | 438.1 | 366.0 | 225.1 | ||||||||||||||||||||||||||||||||
| Research and development expense (f) | 47.2 | 121.1 | 118.2 | ||||||||||||||||||||||||||||||||
| Selling, general and administrative expense | 44.6 | 60.2 | 43.7 | ||||||||||||||||||||||||||||||||
| Other expense, net | (16.8) | 10.7 | 25.4 | ||||||||||||||||||||||||||||||||
| Tax effect of the above items and other income tax related items | (589.7) | (380.1) | (564.5) | ||||||||||||||||||||||||||||||||
| Adjusted net earnings | $ | 2,371.8 | $ | 2,280.5 | $ | 2,364.8 | |||||||||||||||||||||||||||||
Significant items for the year ended December 31, 2020 include the following:
(a) Includes amortization of the purchase accounting inventory fair value adjustment related to the Combination totaling approximately $238.2 million.
(b) Acquisition related costs consist primarily of transaction costs including legal and consulting fees and integration activities. Refer to SG&A discussion within the section “2020 Compared to 2019”.
(c) For the year ended December 31, 2020, charges of approximately $207.7 million are included in cost of sales, approximately $0.4 million is included in R&D, and approximately $115.0 million is included in SG&A. Refer to Note 17 Restructuring included in Part II. Item 8 of this Form 10-K for additional information.
(d) Beginning in 2019, share-based compensation expense is excluded from adjusted net earnings. The full year impact for the year ended December 31, 2018 was insignificant. As such, the 2018 amount was not added back to U.S. GAAP net earnings.
(e) Costs incurred during the year ended December 31, 2020 includes incremental manufacturing variances and site remediation activities as a result of the activities at the Company’s Morgantown plant of approximately $238.4 million and incremental manufacturing variances and special bonus incurred as a result of the COVID-19 pandemic of $67.7 million.
(f) Adjustments primarily relate to non-refundable payments related to development collaboration agreements.
Reconciliation of U.S. GAAP Net Earnings to EBITDA and Adjusted EBITDA
Below is a reconciliation of U.S. GAAP net (loss) earnings to EBITDA and adjusted EBITDA for the twelve months ended December 31, 2020 compared to the prior year period:
| Year Ended December 31, | ||||||||||||||||||||
| (in millions) | 2020 | 2019 | 2018 | |||||||||||||||||
| U.S. GAAP net (loss) earnings | $ | (669.9) | $ | 16.8 | $ | 352.5 | ||||||||||||||
| Add / (deduct) adjustments: | ||||||||||||||||||||
| Net contribution attributable to equity method investments | 48.4 | 62.1 | 78.7 | |||||||||||||||||
| Income tax (benefit) provision | (51.3) | 137.6 | (54.1) | |||||||||||||||||
| Interest expense (a) | 497.8 | 517.3 | 542.3 | |||||||||||||||||
| Depreciation and amortization (b) | 2,216.1 | 2,019.3 | 2,109.9 | |||||||||||||||||
| EBITDA | $ | 2,041.1 | $ | 2,753.1 | $ | 3,029.3 | ||||||||||||||
| Add / (deduct) adjustments: | ||||||||||||||||||||
| Share-based compensation expense (income) | 79.2 | 56.8 | (3.3) | |||||||||||||||||
| Litigation settlements and other contingencies, net | 107.8 | (21.4) | (49.5) | |||||||||||||||||
| Restructuring, acquisition related and other special items (c) | 1,426.0 | 751.2 | 646.4 | |||||||||||||||||
| Adjusted EBITDA | $ | 3,654.1 | $ | 3,539.7 | $ | 3,622.9 |
(a) Includes clean energy investment financing and accretion of contingent consideration.
(b) Includes purchase accounting related amortization.
(c) See items detailed in the Reconciliation of U.S. GAAP Net (Loss) Earnings to Adjusted Net Earnings.
Liquidity and Capital Resources
Our primary source of liquidity is net cash provided by operating activities, which was $1.23 billion for the year ended December 31, 2020. We believe that net cash provided by operating activities and available liquidity will continue to allow us to meet our needs for working capital, capital expenditures and interest and principal payments on debt obligations. Nevertheless, our ability to satisfy our working capital requirements and debt service obligations, or fund planned capital expenditures, will substantially depend upon our future operating performance (which will be affected by prevailing economic conditions), and financial, business and other factors, some of which are beyond our control.
Operating Activities
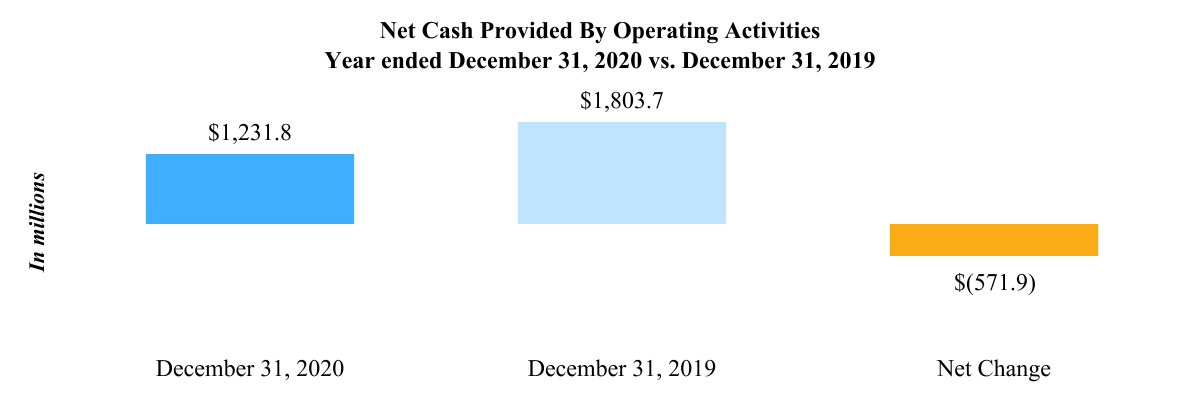
Net cash provided by operating activities decreased by $571.9 million to $1.23 billion for the year ended December 31, 2020, as compared to net cash provided by operating activities of $1.80 billion for the year ended December 31, 2019. Net cash provided by operating activities is derived from net (loss) earnings adjusted for non-cash operating items, gains and losses attributed to investing and financing activities and changes in operating assets and liabilities resulting from timing differences between the receipts and payments of cash, including changes in cash primarily reflecting the timing of cash collections from customers, payments to vendors and employees and tax payments in the ordinary course of business.
The net decrease in net cash provided by operating activities was principally due to the following:
-
a decrease in net earnings for the year ended December 31, 2020 of $686.7 million, principally as a result of a decrease in earnings from operations as a result of Combination and restructuring related expenses;
-
a net increase of $229.0 million in the amount of cash used through changes in inventory balances;
-
a net decrease in the amount of cash provided by changes in income taxes of $54.3 million as a result of the level and timing of estimated tax payments made during the current period.
These items were partially offset by the following:
-
a net increase in non-cash expenses of $303.3 million; and
-
a net increase in the amount of cash provided by changes in accounts receivable of $98.7 million, reflecting the timing of sales and cash collections including the impact of factoring arrangements.
Investing Activities
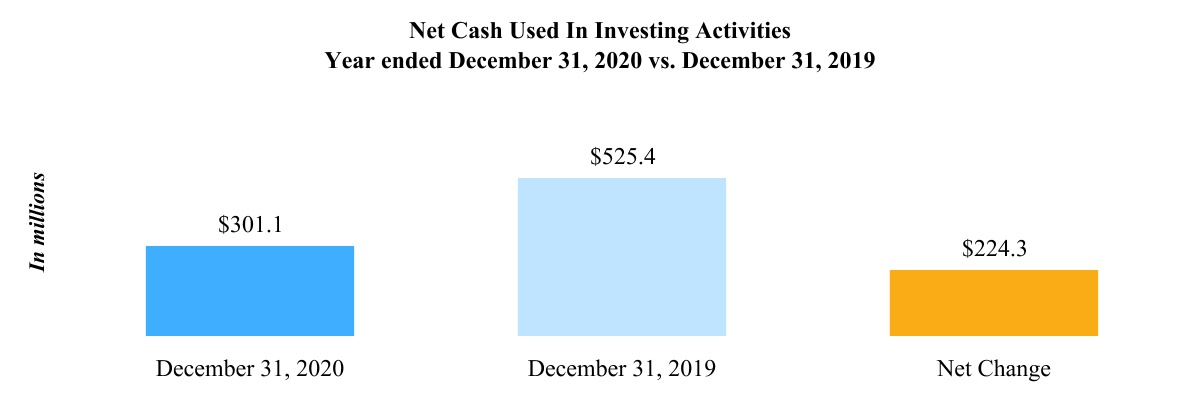
Net cash used in investing activities was $301.1 million for the year ended December 31, 2020, as compared to net cash used in investing activities of $525.4 million for the year ended December 31, 2019, a decrease of $224.3 million.
In 2020, significant items in investing activities included the following:
-
cash received from acquisitions, net totaling approximately $415.8 million primarily related to the cash received as part of the Combination;
-
payments for product rights and other, net totaling approximately $438.2 million, primarily related to the acquisition of Aspen’s thrombosis product portfolio in Europe along with other acquisitions of intellectual property rights and marketing authorizations;
-
proceeds from the sale of assets of $20.0 million; and
-
capital expenditures, primarily for equipment and facilities, totaling approximately $243.0 million. While there can be no assurance that current expectations will be realized, capital expenditures for the 2021 calendar year are expected to be approximately $500 million to $650 million.
In 2019, significant items in investing activities included the following:
-
cash paid for acquisitions, net totaling approximately $148.7 million, primarily related to payments to Novartis for the purchase of the worldwide rights to the TOBI Podhaler® and TOBI® solution global cystic fibrosis products;
-
payments for product rights and other, net totaling approximately $192.8 million, primarily related to the acquisitions of intellectual property rights and marketing authorizations;
-
proceeds from the sale of assets of $28.0 million; and
-
capital expenditures, primarily for equipment and facilities, totaling approximately $213.2 million.
Financing Activities
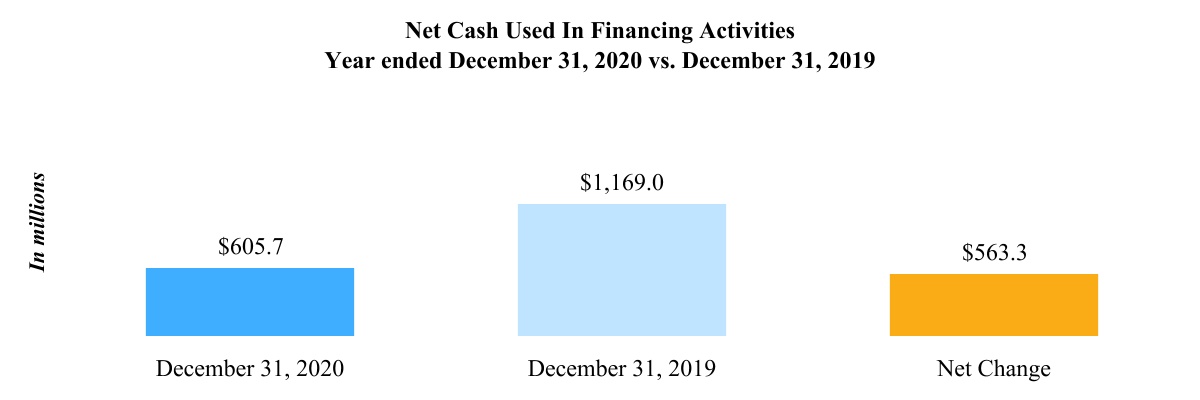
Net cash used in financing activities was $605.7 million for the year ended December 31, 2020, as compared to net cash used in financing activities of $1.17 billion for the year ended December 31, 2019, a decrease of $563.3 million.
In 2020, significant items in financing activities included the following:
-
net short-term borrowings of $1.10 billion;
-
long-term borrowings under the Revolving Facility of $983.0 million;
-
long-term debt payments of approximately $2.48 billion, consisting primarily of repayment at maturity of €500.0 million principal amount of Floating Rate Euro Notes due May 2020, repayment at maturity of €750.0 million principal amount of Euro Senior Notes due November 2020, repayment of $983.0 million of borrowings under the Revolving Facility and repayment at maturity of $50.0 million principal amount of Senior Notes due 2020;
-
non-contingent payments for product rights totaling approximately $143.3 million primarily related to the acquisitions of intellectual property rights and marketing authorizations in prior periods; and
-
payments totaling approximately $48.5 million (of the $111.8 million) in profit share and milestone payments related to the respiratory delivery platform contingent consideration. The remaining payments related to the respiratory delivery platform contingent consideration are included as a component of other operating assets and liabilities, net within net cash from operating activities.
In 2019, significant items in financing activities included the following:
-
long-term debt payments of approximately $1.11 billion consisting primarily of the repayment at maturity of $550.0 million principal amount of the 2.500% Senior Notes due 2019, the partial redemption of $450.0 million principal amount of the 3.750% Senior Notes due 2020 and the repayment of the remaining approximately $100.0 million balance of the 2016 Term Facility; and
-
payments totaling approximately $60.3 million (of the total $99.0 million) in milestone payments related to Pfizer’s respiratory delivery platform contingent consideration. The remaining payments related to the respiratory delivery platform contingent consideration are included as a component of other operating assets and liabilities, net within net cash from operating activities.
Capital Resources
Our cash and cash equivalents totaled $844.4 million at December 31, 2020, and the majority of these funds are held by our non-U.S. subsidiaries. The Company anticipates having sufficient liquidity, including existing borrowing capacity under the Revolving Facility, Commercial Paper Program and the Receivables Facility and the Note Securitization Facility combined with cash to be generated from operations, to fund foreseeable cash needs without requiring the repatriation of non-U.S. cash.
The Company has access to $4.00 billion under the Revolving Facility which matures in November 2023. Up to $1.65 billion of the Revolving Facility may be used to support borrowings under our Commercial Paper Program.
In addition to the Revolving Facility, Mylan Pharmaceuticals Inc., a wholly owned subsidiary of the Company, has access to $400 million under the Receivables Facility, which expires in April 2022. As of December 31, 2020, the Company had $248.4 million outstanding under the Receivables Facility.
In August 2020, the Company entered into the Note Securitization Facility for borrowings up to $200 million. Under the terms of each of the Receivables Facility and Note Securitization Facility, certain of our accounts receivable secure the amounts borrowed and cannot be used to pay our other debts or liabilities. The amount that we may borrow at a given point in time is determined based on the amount of qualifying accounts receivable that are present at such point in time. Borrowings outstanding under the Receivables Facility bear interest at a commercial paper rate plus 0.925% and under the Note Securitization Facility at a rate per annum quoted from time to time by MUFG Bank, Ltd. plus 1.00% and are included as a component of short-term borrowings, while the accounts receivable securing these obligations remain as a component of accounts receivable, net, in our consolidated balance sheets. In addition, the agreements governing the Receivables Facility and Note Securitization Facility contain various customary affirmative and negative covenants, and customary default and termination provisions.
We have entered into accounts receivable factoring agreements with financial institutions to sell certain of our non-U.S. accounts receivable. These transactions are accounted for as sales and result in a reduction in accounts receivable because the agreements transfer effective control over and risk related to the receivables to the buyers. Our factoring agreements do not allow for recourse in the event of uncollectibility, and we do not retain any interest in the underlying accounts receivable once sold. We derecognized $153.0 million and $90.1 million of accounts receivable as of December 31, 2020 and 2019 under these factoring arrangements, respectively.
At December 31, 2020, our long-term debt, including the current portion, totaled $24.69 billion, as compared to $12.67 billion at December 31, 2019. Total long-term debt is calculated net of deferred financing fees which were $49.2 million and $60.5 million at December 31, 2020 and December 31, 2019, respectively.
For additional information regarding our debt and debt agreements refer to Note 10 Debt in Part II. Item 8 of this Form 10-K.
Long-term Debt Maturity
Mandatory minimum repayments remaining on the outstanding notional amount of long-term debt at December 31, 2020 was as follows for each of the periods ending December 31:
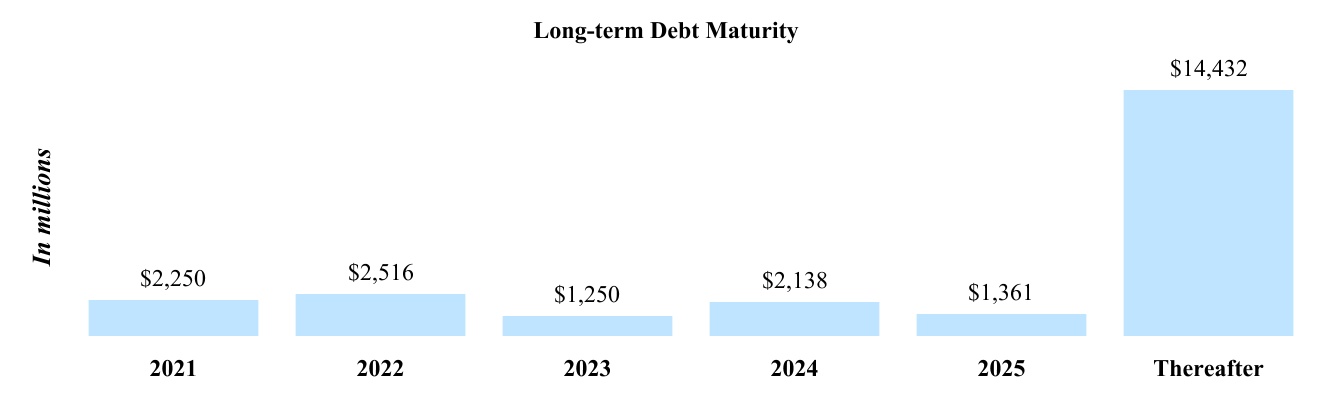
The Company’s Revolving Facility contains customary affirmative covenants for facilities of this type, including among others, covenants pertaining to the delivery of financial statements, notices of default and certain material events, maintenance of corporate existence and rights, property, and insurance and compliance with laws, as well as customary negative covenants for facilities of this type, including limitations on the incurrence of subsidiary indebtedness, liens, mergers and certain other fundamental changes, investments and loans, acquisitions, transactions with affiliates, payments of dividends and other restricted payments and changes in our lines of business.
The Revolving Facility contains a maximum consolidated leverage ratio financial covenant requiring maintenance of a maximum ratio of consolidated total indebtedness as of the end of any quarter to consolidated EBITDA for the trailing four quarters as defined in the related credit agreement (“maximum leverage ratio”).
The maximum leverage ratio is 4.25 to 1.00 for the first four full fiscal quarters following the close of the Combination and 3.75 to 1.00 thereafter, except in circumstances as defined in the related credit agreement. The Company is in compliance at December 31, 2020 and expects to remain in compliance for the next twelve months.
Supplemental Guarantor Financial Information
Subsequent to the Combination, Utah Acquisition Sub Inc. is the issuer of the 3.150% Senior Notes due 2021, 3.950% Senior Notes due 2026 and 5.250% Senior Notes due 2046 (collectively, the “Utah Senior Notes”), which are fully and unconditionally guaranteed on a senior unsecured basis by Mylan Inc., Viatris Inc. and Mylan II B.V.
Mylan Inc. is the issuer of the 4.200% Senior Notes due 2023, 4.550% Senior Notes due 2028, 5.400% Senior Notes due 2043 and 5.200% Senior Notes due 2048 (collectively, the “Mylan Inc. Senior Notes” and, together with the Utah Senior Notes, the “Senior Notes”), which are fully and unconditionally guaranteed on a senior unsecured basis by Mylan II B.V., Viatris Inc. and Utah Acquisition Sub Inc.
The respective obligations of Viatris Inc., Mylan Inc., Utah Acquisition Sub Inc., and Mylan II B.V. as guarantors of the Senior Notes, as applicable, are senior unsecured obligations of the applicable guarantor and rank pari passu in right of payment with all of such guarantor’s existing and future senior unsecured obligations that are not expressly subordinated to such guarantor’s guarantee of the applicable series of Senior Notes, rank senior in right of payment to any future obligations of such guarantor that are expressly subordinated to such guarantor’s guarantee of the applicable series of Senior Notes, and are effectively subordinated to such guarantor’s existing and future secured obligations to the extent of the value of the collateral securing such obligations. The respective obligations of Viatris Inc., Mylan Inc., Utah Acquisition Sub Inc., and Mylan II B.V. as guarantors of the Senior Notes, as applicable, are structurally subordinated to all of the existing and future liabilities, including trade payables, of the existing and future subsidiaries of such guarantor that do not guarantee the applicable series of Senior Notes.
The guarantees by Viatris Inc., Mylan Inc. and Mylan II B.V. of the Utah Senior Notes will terminate under the following customary circumstances: (1) a sale or disposition of Mylan Inc. in a transaction that complies with the applicable indenture such that Mylan Inc. ceases to be a subsidiary of Viatris Inc.; (2) legal defeasance or covenant defeasance, each as described in the applicable indenture, or if Utah Acquisition Sub Inc.’s obligations under the applicable indenture are discharged; or (3) the earlier to occur of (i) the release of their respective guarantees under all applicable Mylan Inc. debt and (ii) Mylan Inc. no longer having any obligations in respect of any Mylan Inc. debt.
The guarantee obligations of Viatris Inc., Mylan Inc., Utah Acquisition Sub Inc., and Mylan II B.V. under the Senior Notes are subject to certain limitations and terms similar to those applicable to other guarantees of similar instruments, including that (i) the guarantees are subject to fraudulent transfer and conveyance laws and (ii) each guarantee is limited in amount to an amount not to exceed the maximum amount that can be guaranteed by the applicable guarantor without rendering the guarantee, as it relates to such guarantor, voidable under applicable fraudulent transfer and conveyance laws or similar laws affecting the rights of creditors generally.
The following table presents unaudited summarized financial information of Viatris Inc., Mylan Inc., Utah Acquisition Sub Inc., and Mylan II B.V. on a combined basis as of and for the year ended December 31, 2020 and 2019. All intercompany balances have been eliminated in consolidation. This unaudited combined summarized financial information is presented utilizing the equity method of accounting.
| Combined Summarized Balance Sheet Information of Viatris Inc., Mylan Inc., Utah Acquisition Sub Inc. and Mylan II B.V. | |||||||||||
| (In millions) | December 31, 2020 | December 31, 2019 | |||||||||
| ASSETS | |||||||||||
| Current assets | $ | 477.7 | $ | 152.2 | |||||||
| Non-current assets | 61,272.4 | 41,602.4 | |||||||||
| LIABILITIES AND EQUITY | |||||||||||
| Current liabilities | 20,951.7 | 15,414.9 | |||||||||
| Non-current liabilities | 17,844.2 | 14,455.9 |
| Combined Summarized Balance Sheet Information of Viatris Inc., Mylan Inc., Utah Acquisition Sub Inc. and Mylan II B.V. | |||||||||||
| (In millions) | Year Ended December 31, 2020 | Year Ended December 31, 2019 | |||||||||
| Revenues | $ | — | $ | — | |||||||
| Gross Profit | — | — | |||||||||
| Loss from Operations | (929.6) | (790.3) | |||||||||
| Net (loss) earnings | (669.9) | 16.8 |
Other Commitments
The Company is involved in various disputes, governmental and/or regulatory inquiries, investigations and proceedings, tax proceedings and litigation matters, both in the U.S. and abroad, that arise from time to time, some of which could result in losses, including damages, fines and/or civil penalties, and/or criminal charges against the Company. These matters are often complex and have outcomes that are difficult to predict. We have approximately $343 million accrued for legal contingencies at December 31, 2020.
While the Company believes that it has meritorious defenses with respect to the claims asserted against it and the assumed legal matters referenced above, and intends to vigorously defend its position, the process of resolving these matters is inherently uncertain and may develop over a long period of time, and so it is not possible to predict the ultimate resolution of any such matter. It is possible that an unfavorable resolution of any of the ongoing matters could have a material effect on the Company’s business, financial condition, results of operations, cash flows, ability to pay dividends and/or stock price.
In conjunction with the Combination, Viatris entered into a TSA with Pfizer pursuant to which each party will provide certain limited transition services to the other party generally for an initial period of 24 months from closing date. In addition to the monthly service fees under the TSA, Viatris has agreed to reimburse Pfizer for fifty percent of the costs, up to the first $380 million incurred, to establish and wind down the TSA services. Viatris will be required to fully reimburse Pfizer for total costs in excess of $380 million. Through the year ended December 31, 2020, the Company has incurred $53.1 million related to this provision of the TSA.
We are continuously evaluating the potential acquisition of products, as well as companies, as a strategic part of our future growth. Consequently, we may utilize current cash reserves or incur additional indebtedness to finance any such acquisitions, which could impact future liquidity. In addition, on an ongoing basis, we review our operations including the evaluation of potential divestitures of products and businesses as part of our future strategy. Any divestitures could impact future liquidity.
Contractual Obligations
The following table summarizes our contractual obligations at December 31, 2020 and the effect that such obligations are expected to have on our liquidity and cash flows in future periods:
| (In millions) | Total | Less than One Year | One-Three Years | Three-Five Years | Thereafter | ||||||||||||||||||||||||
| Long-term debt | $ | 23,947.0 | $ | 2,250.0 | $ | 3,766.0 | $ | 3,499.0 | $ | 14,432.0 | |||||||||||||||||||
| Scheduled interest payments (1) | 4,341.1 | 393.7 | 698.3 | 593.7 | 2,655.4 | ||||||||||||||||||||||||
| Leases | 361.9 | 89.9 | 114.6 | 62.3 | 95.1 | ||||||||||||||||||||||||
| Other Commitments (2) | 2,595.7 | 1,328.1 | 360.0 | 291.9 | 615.7 | ||||||||||||||||||||||||
| $ | 31,245.7 | $ | 4,061.7 | $ | 4,938.9 | $ | 4,446.9 | $ | 17,798.2 |
(1)Scheduled interest payments represent the estimated interest payments related to our outstanding borrowings under senior notes and other long-term debt. Variable debt interest payments are estimated using current interest rates.
(2)Other commitments include funding commitments related to the Company’s clean energy investments, agreements to purchase third-party manufactured products, open purchase orders, transition tax and estimated post-employment payments at December 31, 2020.
Due to the uncertainty with respect to the timing of future payments, if any, the following contingent payments have not been included in the table above.
We are contractually obligated to make potential future development, regulatory and commercial milestone, royalty and/or profit sharing payments in conjunction with acquisitions we have entered into with third parties. The most significant of these relates to the potential future consideration related to the acquisition of the exclusive worldwide rights to develop, manufacture and commercialize a generic equivalent to GlaxoSmithKline’s Advair® Diskus incorporating Pfizer’s respiratory delivery platform. These payments are contingent upon the occurrence of certain future events and, given the nature of these events, it is unclear when we may be required to pay such amounts. The amount of the contingent consideration liabilities was $223.6 million at December 31, 2020. In addition, the Company expects to incur approximately $8 million to $10 million of non-cash accretion expense related to the increase in the net present value of the contingent consideration liabilities in 2021.
With respect to the timing of future cash flows associated with our unrecognized tax benefits at December 31, 2020, we are unable to make reasonably reliable estimates of the period of cash settlement with the respective taxing authority. As such, $391.1 million of unrecognized tax benefits have been excluded from the contractual obligations table above.
In the normal course of business, Viatris periodically enters into employment, legal settlement and other agreements which incorporate indemnification provisions. While the maximum amount to which Viatris may be exposed under such agreements cannot be reasonably estimated, the Company maintains insurance coverage, which management believes will effectively mitigate the Company’s obligations under these indemnification provisions. No amounts have been recorded in the consolidated financial statements with respect to the Company’s obligations under such agreements.
We have entered into employment and other agreements with certain executives and other employees that provide for compensation and certain other benefits. These agreements provide for severance payments under certain circumstances.
Collaboration and Licensing Agreements
We periodically enter into collaboration and licensing agreements with other pharmaceutical companies for the development, manufacture, marketing and/or sale of pharmaceutical products. Our significant collaboration agreements are primarily focused on the development, manufacturing, supply and commercialization of multiple, high-value generic biologic compounds, insulin analog products and respiratory products, among other complex products. Under these agreements, we have future potential milestone payments and co-development expenses payable to third parties as part of our licensing, development and co-development programs. Payments under these agreements generally become due and are payable upon the satisfaction or achievement of certain developmental, regulatory or commercial milestones or as development expenses are incurred on defined projects. Milestone payment obligations are uncertain, including the prediction of timing and the occurrence of events triggering a future obligation and are not reflected as liabilities in the consolidated balance sheets, except obligations reflected as acquisition related contingent consideration. Refer to Note 9 Financial Instruments and Risk Management included in Part II. Item 8 of this Form 10-K for further discussion of contingent consideration. Our potential maximum development milestones
not accrued for at December 31, 2020 totaled approximately $380 million. We estimate that the amounts that may be paid in the next twelve months to be approximately $40 million. These agreements may also include potential sales-based milestones and call for us to pay a percentage of amounts earned from the sale of the product as a royalty or a profit share. The amounts disclosed do not include sales-based milestones or royalty or profit share obligations on future sales of product as the timing and amount of future sales levels and costs to produce products subject to these obligations is not reasonably estimable. These sales-based milestones or royalty or profit share obligations may be significant depending upon the level of commercial sales for each product.
The Company’s significant collaboration and licensing agreements include those with Revance, Momenta, Theravance Biopharma, Biocon and FKB. Refer to Note 18 Collaboration and Licensing Agreements included in Part II. Item 8 of this Form 10-K for additional information related to our collaborations.
Application of Critical Accounting Policies
Our significant accounting policies are described in Note 2 Summary of Significant Accounting Policies included in Part II. Item 8 of this Form 10-K and are in accordance with U.S. GAAP.
Included within these policies are certain policies which contain critical accounting estimates and, therefore, have been deemed to be “critical accounting policies.” Critical accounting estimates are those which require management to make assumptions about matters that were uncertain at the time the estimate was made and for which the use of different estimates, which reasonably could have been used, or changes in the accounting estimates that are reasonably likely to occur from period to period could have a material impact on our financial condition or results of operations. We have identified the following to be our critical accounting policies: the determination of net revenue provisions, acquisitions, intangible assets, goodwill and contingent consideration, income taxes and the impact of existing legal matters.
Revenue Recognition
We recognize revenues in accordance with ASC 606. Under ASC 606, the Company recognizes net revenue for product sales when control of the promised goods or services is transferred to our customers in an amount that reflects the consideration we expect to be entitled to in exchange for those goods or services. Revenues are recorded net of provisions for variable consideration, including discounts, rebates, governmental rebate programs, price adjustments, returns, chargebacks, promotional programs and other sales allowances. Accruals for these provisions are presented in the consolidated financial statements as reductions in determining net sales and as a contra asset in accounts receivable, net (if settled via credit) and other current liabilities (if paid in cash). Amounts recorded for revenue deductions can result from a complex series of judgements about future events and uncertainties and can rely heavily on estimates and assumptions. As such, they have been identified as critical accounting estimates. The following section briefly describes the nature of our provisions for variable consideration and how such provisions are estimated:
-
Chargebacks: the Company has agreements with certain indirect customers, such as independent pharmacies, retail pharmacy chains, managed care organizations, hospitals, nursing homes, governmental agencies and pharmacy benefit managers, which establish contract prices for certain products. The indirect customers then independently select a wholesaler from which to purchase the products at these contracted prices. Alternatively, certain wholesalers may enter into agreements with indirect customers that establish contract pricing for certain products, which the wholesalers provide. Under either arrangement, Viatris will provide credit to the wholesaler for any difference between the contracted price with the indirect party and the wholesaler’s invoice price. Such credits are called chargebacks. The provision for chargebacks is based on expected sell-through levels by our wholesaler customers to indirect customers, as well as estimated wholesaler inventory levels. We continually monitor our provision for chargebacks and evaluate our reserve and estimates as additional information becomes available. A change of 5% would have an effect on our reserve balance of approximately $29.3 million.
-
Rebates, promotional programs and other sales allowances: this category includes rebate and other programs to assist in product sales. These programs generally provide that the customer receives credit directly related to the amount of purchases or credits upon the attainment of pre-established volumes. Also included in this category are prompt pay discounts, administrative fees and price adjustments to reflect decreases in the selling prices of products. A change of 5% would have an effect on our reserve balance of approximately $78.8 million.
-
Returns: consistent with industry practice, Viatris maintains a return policy that allows customers to return a product, which varies country by country in accordance with local practices, generally within a specified period prior (six months) and subsequent (twelve months) to the expiration date. The Company’s estimate of the provision for returns is generally based upon historical experience with actual returns. Generally, returned products are destroyed and
customers are refunded the sales price in the form of a credit. A change of 5% would have an effect on our reserve balance of approximately $27.0 million.
- Governmental rebate programs: government reimbursement programs in the U.S. include Medicare, Medicaid, and State Pharmacy Assistance Programs established according to statute, regulations and policy. Manufacturers of pharmaceutical products that are covered by the Medicaid program are required to pay rebates to each state based on a statutory formula set forth in the Social Security Act. Medicare beneficiaries are eligible to obtain discounted prescription drug coverage from private sector providers. In addition, certain states have also implemented supplemental rebate programs that obligate manufacturers to pay rebates in excess of those required under federal law. Our estimate of these rebates is based on the historical trends of rebates paid as well as on changes in wholesaler inventory levels and increases or decreases in the level of sales. We estimate discounts on branded prescription drug sales to Medicare Part D participants in the Medicare “coverage gap” based on historical experience of prescriptions and utilization expected to result in the discount of the “coverage gap”.
Outside the U.S. the majority of our pharmaceutical sales are contractually or legislatively governed. In certain European countries, certain rebates are calculated on the governments total pharmaceutical spending or on specific product sale thresholds. We utilize historical data and obtain third party information to determine the adequacy of these accruals. Also, this provision includes price reductions that are mandated by law outside of the U.S.
A change of 5% would have an effect on our reserve balance of approximately $15.7 million.
The following is a rollforward of the categories of variable consideration during 2020:
| (In millions) | Balance at December 31, 2019 | Current Provision Related to Sales Made in the Current Period | Balances Acquired Through Acquisition | Checks/ Credits Issued to Third Parties | Effects of Foreign Exchange | Balance at December 31, 2020 | |||||||||||||||||||||||||||||
| Chargebacks | $ | 518.6 | $ | 3,656.2 | $ | 92.2 | $ | (3,685.9) | $ | 4.1 | $ | 585.2 | |||||||||||||||||||||||
| Rebates, promotional programs and other sales allowances | 1,084.1 | 3,765.5 | 627.2 | (3,896.5) | (4.0) | 1,576.3 | |||||||||||||||||||||||||||||
| Returns | 393.0 | 329.7 | 128.0 | (314.8) | 4.0 | 539.9 | |||||||||||||||||||||||||||||
| Governmental rebate programs | $ | 312.8 | 327.8 | 39.4 | (358.8) | (7.9) | 313.3 | ||||||||||||||||||||||||||||
| Total | $ | 2,308.5 | $ | 8,079.2 | $ | 886.8 | $ | (8,256.0) | $ | (3.8) | $ | 3,014.7 |
Accruals for these provisions are presented in the consolidated financial statements as reductions in determining net revenues and in accounts receivable and other current liabilities. Accounts receivable are presented net of allowances relating to these provisions, which were comprised of the following at December 31, 2020 and 2019, respectively:
| (In millions) | December 31, 2020 | December 31, 2019 | |||||||||
| Accounts receivable | $ | 1,802.9 | $ | 1,512.0 | |||||||
| Other current liabilities | 1,211.8 | 796.5 | |||||||||
| Total | $ | 3,014.7 | $ | 2,308.5 |
We have not made and do not anticipate making any significant changes to the methodologies that we use to measure provisions for variable consideration; however, the balances within these reserves can fluctuate significantly through the consistent application of our methodologies. Historically, we have not recorded in any current period any material amounts related to adjustments made to prior period reserves.
Acquisitions, Intangible Assets, Goodwill and Contingent Consideration
The Company accounts for acquired businesses using the acquisition method of accounting in accordance with the provisions of ASC 805, which requires that the assets acquired and liabilities assumed be recorded at the date of acquisition at their respective estimated fair values. The cost to acquire businesses is allocated to the underlying net assets of the acquired business based on estimates of their respective fair values. Amounts allocated to acquired IPR&D are capitalized at the date of acquisition and, at that time, such IPR&D assets have indefinite lives. As products in development are approved for sale, amounts are allocated to product rights and licenses and will be amortized over their estimated useful lives. Finite-lived intangible assets are amortized over the expected life of the asset. Any excess of the purchase price over the estimated fair values of the net assets acquired is recorded as goodwill. Refer to Note 4 Acquisitions and Other Transactions included in Part II. Item 8 of this Form 10-K for further additional information regarding the Company’s acquisitions, including the acquisition accounting related to the Combination.
Purchases of developed products and licenses that are accounted for as asset acquisitions are capitalized as intangible assets and amortized over an estimated useful life. IPR&D assets acquired as part of an asset acquisition are expensed immediately if they have no alternative future uses.
The judgments made in determining the estimated fair value assigned to each class of assets acquired and liabilities assumed, as well as asset lives, can materially impact our results of operations. Fair values and useful lives are determined based on, among other factors, the expected future period of benefit of the asset, the various characteristics of the asset and projected cash flows. Because this process involves management making estimates with respect to future sales volumes, pricing, new product launches, government reform actions, anticipated cost environment and overall market conditions, and because these estimates form the basis for the determination of whether or not an impairment charge should be recorded, these estimates are considered to be critical accounting estimates.
The Company records contingent consideration resulting from business acquisitions at its estimated fair value on the acquisition date. Each reporting period thereafter, the Company revalues these obligations and records increases or decreases in their fair value as adjustments to litigation settlements and other contingencies, net within the consolidated statements of operations. Changes in the fair value of the contingent consideration obligations can result from adjustments to the discount rates, payment periods and adjustments in the probability of achieving future development steps, regulatory approvals, market launches, sales targets and profitability. These fair value measurements represent Level 3 measurements as they are based on significant inputs not observable in the market.
Significant judgment is employed in determining the assumptions utilized as of the acquisition date and for each subsequent measurement period. Accordingly, changes in the assumptions described above could have a material impact on the Company’s consolidated financial condition and results of operations.
The Company reviews goodwill for impairment at least annually or more frequently if events or changes in circumstances indicate that the carrying value of goodwill may not be recoverable based on management’s assessment of the fair value of the Company’s reporting units as compared to their related carrying value. Under the authoritative guidance issued by the FASB, we have the option to first assess the qualitative factors to determine whether it is more likely than not that the fair value of the reporting unit is less than its carrying amount as a basis for determining whether it is necessary to perform a quantitative goodwill impairment test. If we choose to use qualitative factors and determine that it is more likely than not that the fair value of a reporting unit is less than its carrying amount, then the goodwill impairment test would be required. The goodwill impairment test requires the Company to estimate the fair value of the reporting unit and to compare the fair value of the reporting unit with its carrying amount. If the carrying amount is less than its fair value, then no impairment is recognized. If the carrying amount recorded exceeds the fair value calculated, an impairment charge is recorded for the difference. The judgments made in determining the projected cash flows used to estimate the fair value can materially impact the Company’s financial condition and results of operations.
Mylan historically performed its annual goodwill impairment test on April 1st. As a result of the decline in the Mylan’s share price during the first quarter of 2020, and the general uncertainty and volatility in the economic environments in which the Company operates, including the impacts of the COVID-19 pandemic, the Company performed an interim goodwill impairment test as of March 31, 2020 and its annual goodwill impairment test as of April 1, 2020.
Mylan performed both the interim and annual goodwill impairment tests on a quantitative basis for its four reporting units, North America Generics, North America Brands, Europe and Rest of World. In estimating each reporting unit’s fair value, Mylan performed an extensive valuation analysis, utilizing both income and market-based approaches, except for the North America Brands reporting unit where the fair value was estimated utilizing the income approach. The determination of
the fair value of the reporting units requires management to make significant estimates and assumptions that affect the reporting unit’s expected future cash flows. These estimates and assumptions, utilizing Level 3 inputs, primarily include, but are not limited to, market multiples, control premiums, the discount rate, terminal growth rates, operating income before depreciation and amortization, and capital expenditures forecasts. The following describes the valuation methodologies used to derive the estimated fair value of the reporting units.
Income Approach: Under this approach, to determine fair value, we discounted the expected future cash flows of each reporting unit. We used a discount rate, which reflected the overall level of inherent risk and the rate of return an outside investor would have expected to earn. To estimate cash flows beyond the final year of our model, we used a terminal value approach. Under this approach, we used EBITDA in the final year of our model, adjusted to estimate a normalized cash flow, applied a perpetuity growth assumption, and discounted by a perpetuity discount factor to determine the terminal value. We incorporated the present value of the resulting terminal value into our estimate of fair value.
Market-Based Approach: The Company also utilizes a market-based approach to estimate fair value, principally utilizing the guideline company method which focuses on comparing our risk profile and growth prospects to a select group of publicly traded companies with reasonably similar guidelines.
As of March 31, 2020 and April 1, 2020, the allocation of goodwill among the reporting units was as follows: North America Generics $2.60 billion, North America Brands $0.65 billion, Europe $4.43 billion and Rest of World $1.65 billion.
As of March 31, 2020 and April 1, 2020, Mylan determined that the fair value of the North America Generics, North America Brands and Rest of World reporting units was substantially in excess of the respective unit’s carrying value. However, when compared to the April 1, 2019 test, the fair value of the overall business declined because of future forecasts and the decline in share price.
For the Europe reporting unit, the estimated fair value exceeded its carrying value by approximately $1.2 billion or 11.0% for both the interim and annual goodwill impairment test. As it relates to the income approach for the Europe reporting unit at March 31, 2020 and April 1, 2020, the Company forecasted cash flows for the next 5 years. During the forecast period, the revenue compound annual growth rate was approximately 7.5%. A terminal year value was calculated with a 2.0% revenue growth rate applied. The discount rate utilized was 11.0% and the estimated tax rate was 25.5%. Under the market-based approach, we utilized an estimated range of market multiples of 8.0 to 9.5 times EBITDA plus a control premium of 15.0%. If all other assumptions are held constant, a reduction in the terminal value growth rate by 3.5% or an increase in discount rate by 3.5% would result in an impairment charge for the Europe reporting unit.
Due to the inherent uncertainty involved in making these estimates, actual results could differ from those estimates. In addition, changes in underlying assumptions, especially as it relates to the key assumptions detailed, could have a significant impact on the fair value of the reporting units.
As a result of the Combination and the integration of our portfolio across our regions, the Company changed its reportable segments. The Company now has four reportable segments on a geographic basis, Developed Markets, Greater China, JANZ and Emerging Markets. Subsequent to the change in segments, our reporting units for allocating and evaluating Goodwill impairment will be North America, Europe, Greater China, JANZ and Emerging Markets.
The carrying values of long-lived assets, which include property, plant and equipment and intangible assets with finite lives, are evaluated periodically in relation to the expected future undiscounted cash flows of the underlying assets and monitored for other potential triggering events. We have assessed the recoverability of certain long-lived assets, principally finite-lived intangible assets, contained within the reporting units whenever certain impairment indicators are present. Any impairment of these assets must be considered prior to our impairment review of goodwill. The assessment for impairment is based on our ability to recover the carrying value of the long-lived assets or asset grouping by analyzing the expected future undiscounted pre-tax cash flows specific to the asset or asset grouping. If the carrying amount is greater than the undiscounted cash flows, the Company recognizes an impairment loss for the excess of the carrying amount over the estimated fair value based on discounted cash flows.
Significant management judgment is involved in estimating the recoverability of these assets and is dependent upon the accuracy of the assumptions used in making these estimates, as well as how the estimates compare to the eventual future operating performance of the specific asset or asset grouping. For the years ended December 31, 2020, 2019 and 2018, the Company recorded $45.0 million, $42.3 million, and $106.3 million, respectively, of impairment charges for finite-lived intangible assets, which were recorded as a component of amortization expense. At December 31, 2020 and 2019, the Company’s finite-lived intangible assets totaled $29.68 billion and $11.53 billion, respectively. Changes to any of the
Company’s assumptions related to the estimated fair value based on the discounted cash flows, including discount rates or the competitive environment related to the assets, could lead to future material impairment charges. Any future long-lived assets impairment charges could have a material impact on the Company’s consolidated financial condition and results of operations.
The Company’s indefinite-lived intangible assets, principally IPR&D, are tested at least annually for impairment or upon the occurrence of a triggering event. The impairment test for IPR&D consists of a comparison of the asset’s fair value with its carrying value. Impairment is determined to exist when the fair value of IPR&D assets, which is based upon updated forecasts and commercial development plans, is less than the carrying value of the assets being tested. For the years ended December 31, 2020, 2019 and 2018, the Company recorded $37.4 million, $138.3 million, and $117.7 million, respectively, of impairment charges, which were recorded as a component of amortization expense. At December 31, 2020 and 2019, the Company’s IPR&D assets totaled $80.7 million and $120.3 million, respectively.
The fair value of both IPR&D and finite-lived intangible assets was determined based upon detailed valuations employing the income approach which utilized Level 3 inputs, as defined in Note 9 Financial Instruments and Risk Management included in Part II. Item 8 of this Form 10-K. Changes to any of the Company’s assumptions including changes to or abandonment of development programs, regulatory timelines, discount rates or the competitive environment related to the assets could lead to future material impairment charges.
Income Taxes
We compute our income taxes based on the statutory tax rates and tax reliefs available to Viatris in the various jurisdictions in which we generate income. Significant judgment is required in determining our income taxes and in evaluating our tax positions. We establish reserves in accordance with Viatris’ policy regarding accounting for uncertainty in income taxes. Our policy provides that the tax effects from an uncertain tax position be recognized in Viatris’ financial statements, only if the position is more likely than not of being sustained upon audit, based on the technical merits of the position. We adjust these reserves in light of changing facts and circumstances, such as the settlement of a tax audit. Our provision for income taxes includes the impact of reserve provisions and changes to reserves. Favorable resolution would be recognized as a reduction to our provision for income taxes in the period of resolution or expiration of the underlying statutes of limitation. Based on this evaluation, as of December 31, 2020, our reserve for unrecognized tax benefits totaled $391.1 million, of which $264.0 million was recorded in connection with the Combination and is subject to Pfizer’s indemnification obligations to Viatris under the Tax Matters Agreement.
Management assesses the available positive and negative evidence to estimate if sufficient future taxable income will be generated to utilize the existing deferred tax assets. A significant piece of objective negative evidence evaluated was the cumulative loss incurred in certain taxing jurisdictions over the three-year period ended December 31, 2020. Such objective evidence limits the ability to consider other subjective evidence such as our projections for future growth.
Based on this evaluation and other factors, as of December 31, 2020, a valuation allowance of $443.6 million has been recorded in order to measure only the portion of the deferred tax asset that more likely than not will be realized. The amount of the deferred tax asset considered realizable, however, could be adjusted if estimates of future taxable income during the carryforward period are reduced or if objective negative evidence in the form of cumulative losses is no longer present and additional weight may be given to subjective evidence such as projections for growth. When assessing the realizability of deferred tax assets, management considers all available evidence, including historical information, long-term forecasts of future taxable income and possible tax planning strategies. Amounts recorded for valuation allowances can result from a complex series of estimates, assumptions and judgments about future events. Due to the inherent uncertainty involved in making these estimates, assumptions and judgments, actual results could differ materially. Any future increases to the Company’s valuation allowances could materially impact the Company’s consolidated financial condition and results of operations. At December 31, 2020 and 2019, the Company’s net deferred tax assets totaled $2.15 billion and $703.1 million, respectively.
A variance of 5% between estimated reserves and valuation allowances and actual resolution and realization of these tax items would have an effect on our reserve balance and valuation allowance of approximately $41.8 million.
Legal Matters
Viatris is involved in various legal proceedings, some of which involve claims for substantial amounts. An estimate is made to accrue for a loss contingency relating to any of these legal proceedings if it is probable that a liability was incurred as of the date of the financial statements and the amount of loss can be reasonably estimated. Because of the subjective nature inherent in assessing the outcome of litigation and because of the potential that an adverse outcome in a legal proceeding could
have a material adverse effect on our business, financial condition, results of operations, cash flows, and/or ordinary share price, such estimates are considered to be critical accounting estimates.
A variance of 5% between estimated and recorded litigation reserves and actual resolution of certain legal matters would have an effect on our litigation reserve balance of approximately $17.2 million. Refer to Note 19 Litigation included in Part II. Item 8 of this Form 10-K for further discussion of litigation matters.
Impact of Currency Fluctuations and Inflation
Because our results are reported in U.S. Dollars, changes in the rate of exchange between the U.S. Dollar and the local currencies in the markets in which we operate, mainly the Euro, Indian Rupee, Chinese Renminbi, Japanese Yen, Australian Dollar, Canadian Dollar, Pound Sterling and South Korean Won affect our results as previously noted. We do not believe that inflation has had a material impact on our revenues or operations in any of the past three years.
Recent Accounting Pronouncements
Refer to Note 2 Summary of Significant Accounting Policies in Part II. Item 8 of this Form 10-K for recently adopted accounting pronouncements and recently issued accounting pronouncements not yet adopted.
Previous: Item 6. Selected Financial Data · Next: Item 7A. Quantitative and Qualitative Disclosures About Market Risk