 filings.tools
Item 5. Market for Registrant’s Common Equity, Related Stockholder Matters and Issuer Purchases of Equity Securities
3K characters. Original on sec.gov · Markdown
Item 5. Market for Registrant’s Common Equity, Related Stockholder Matters and Issuer Purchases of Equity Securities
Our common stock is traded on the NASDAQ Stock Market under the symbol “VTRS”.
As of February 22, 2024, there were approximately 103,200 holders of record of shares of Viatris common stock.
The Company paid quarterly cash dividends of $0.12 per share on the Company’s issued and outstanding common stock on March 17, 2023, June 16, 2023, September 15, 2023 and December 15, 2023. On February 26, 2024, the Company’s Board of Directors declared a quarterly cash dividend of $0.12 per share on the Company’s issued and outstanding common stock, which will be payable on March 18, 2024 to shareholders of record as of the close of business on March 11, 2024. The declaration and payment of future dividends to holders of the Company’s common stock will be at the discretion of the Board of Directors, and will depend upon factors, including but not limited to, the Company’s financial condition, earnings, capital requirements of its businesses, legal requirements, regulatory constraints, industry practice, and other factors that the Board of Directors deems relevant. The Company paid quarterly cash dividends of $0.12 per share on the Company’s issued and outstanding common stock on March 16, 2022, June 16, 2022, September 16, 2022 and December 16, 2022. The Company paid quarterly cash dividends of $0.11 per share on the Company’s issued and outstanding common stock on June 16, 2021, September 16, 2021 and December 16, 2021.
STOCK PERFORMANCE GRAPH
Viatris common stock has been listed on the NASDAQ under the symbol “VTRS” since November 17, 2020. Prior to that time, there was no public market for our common stock. The graph below compares Viatris Inc.’s cumulative total shareholder return on common stock with the cumulative total returns of the S&P 500 index and the Dow Jones US Pharmaceuticals index. The graph tracks the performance of a $100 investment in our common stock and in each index (with the reinvestment of all dividends) from November 16, 2020 to December 31, 2023. The historical share price data has been revised to reflect updated source information. The revisions are not significant to previously reported amounts.
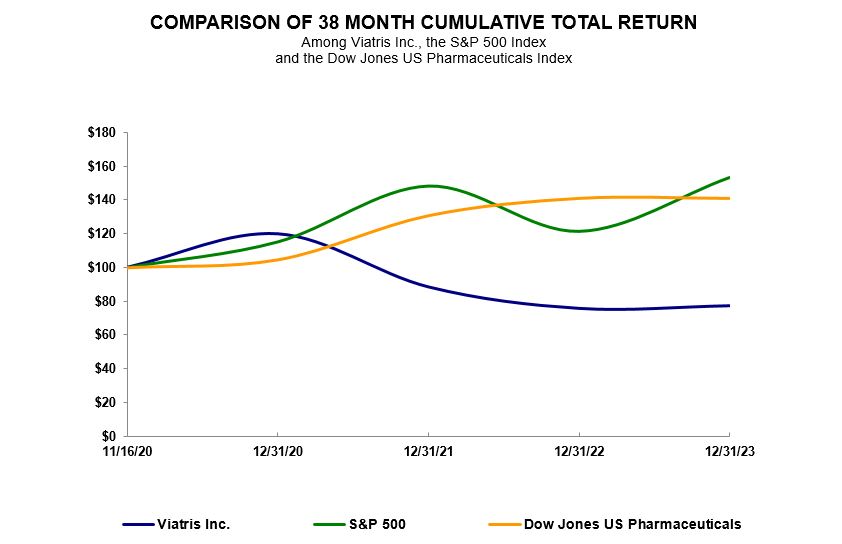
| November 16, 2020 | December 31, 2020 | December 31, 2021 | December 31, 2022 | December 31, 2023 | |||||||||||||||||||||||||
| Viatris Inc. | 100.00 | 119.67 | 88.40 | 75.78 | 77.34 | ||||||||||||||||||||||||
| S&P 500 | 100.00 | 115.21 | 148.28 | 121.43 | 153.35 | ||||||||||||||||||||||||
| Dow Jones U.S. Pharmaceuticals | 100.00 | 104.70 | 130.85 | 141.10 | 141.08 |
Previous: Item 4. Mine Safety Disclosures · Next: Item 6. [Reserved]