 filings.tools
Workday 10-K 2023-01-31
Filed 2023-02-27. 23 sections, 437K characters. Original on sec.gov · Markdown · JSON
Cover and table of contents
UNITED STATES
SECURITIES AND EXCHANGE COMMISSION
Washington, D.C. 20549
FORM 10-K
(Mark One)
| ☒ | ANNUAL REPORT PURSUANT TO SECTION 13 OR 15(d) OF THE SECURITIES EXCHANGE ACT OF 1934 |
For the fiscal year ended January 31, 2023
OR
| ☐ | TRANSITION REPORT PURSUANT TO SECTION 13 OR 15(d) OF THE SECURITIES EXCHANGE ACT OF 1934 |
For the transition period from to
Commission File Number 001-35680
WORKDAY, INC.
(Exact name of registrant as specified in its charter)
| Delaware | 20-2480422 | ||||
| (State or other jurisdiction of incorporation or organization) | (I.R.S. Employer Identification No.) |
6110 Stoneridge Mall Road
Pleasanton, California 94588
(Address of principal executive offices, including zip code)
(925) 951-9000
(Registrant’s telephone number, including area code)
Securities registered pursuant to Section 12(b) of the Act:
| Title of each class | Trading Symbol(s) | Name of each exchange on which registered | ||||||
| Class A Common Stock, par value $0.001 | WDAY | The Nasdaq Stock Market LLC | ||||||
| (Nasdaq Global Select Market) |
Securities registered pursuant to section 12(g) of the Act:
None
Indicate by check mark if the registrant is a well-known seasoned issuer, as defined in Rule 405 of the Securities Act of 1933 (“Securities Act”). Yes ý No ¨
Indicate by check mark if the registrant is not required to file reports pursuant to Section 13 or Section 15(d) of the Securities Exchange Act of 1934 (“Exchange Act”). Yes ¨ No ý
Indicate by check mark whether the registrant (1) has filed all reports required to be filed by Section 13 or 15(d) of the Exchange Act during the preceding 12 months (or for such shorter period that the registrant was required to file such reports), and (2) has been subject to such filing requirements for the past 90 days. Yes ý No ¨
Indicate by check mark whether the registrant has submitted electronically every Interactive Data File required to be submitted pursuant to Rule 405 of Regulation S-T (§ 232.405 of this chapter) during the preceding 12 months (or for such shorter period that the registrant was required to submit such files). Yes ý No ¨
Indicate by check mark whether the registrant is a large accelerated filer, an accelerated filer, a non-accelerated filer, a smaller reporting company, or an emerging growth company. See the definitions of “large accelerated filer,” “accelerated filer,” “smaller reporting company,” and “emerging growth company” in Rule 12b-2 of the Exchange Act.
| Large accelerated filer | ý | Accelerated filer | ☐ | ||||||||
| Non-accelerated filer | ☐ | Smaller reporting company | ☐ | ||||||||
| Emerging growth company | ☐ |
If an emerging growth company, indicate by check mark if the registrant has elected not to use the extended transition period for complying with any new or revised financial accounting standards provided pursuant to Section 13(a) of the Exchange Act. ☐
Indicate by check mark whether the registrant has filed a report on and attestation to its management’s assessment of the effectiveness of its internal control over financial reporting under Section 404(b) of the Sarbanes-Oxley Act (15 U.S.C. 7262(b)) by the registered public accounting firm that prepared or issued its audit report. ☒
If securities are registered pursuant to Section 12(b) of the Act, indicate by check mark whether the financial statements of the registrant included in the filing reflect the correction of an error to previously issued financial statements. ☐
Indicate by check mark whether any of those error corrections are restatements that required a recovery analysis of incentive-based compensation received by any of the registrant’s executive officers during the relevant recovery period pursuant to §240.10D-1(b). ☐
Indicate by check mark whether the registrant is a shell company (as defined in Rule 12b-2 of the Exchange Act). Yes ☐ No ý
The aggregate market value of the voting and non-voting stock of the registrant as of July 29, 2022 (based on a closing price of $155.10 per share) held by non-affiliates was approximately $31.0 billion. As of February 23, 2023, there were approximately 204 million shares of the registrant’s Class A common stock, net of treasury stock, and 55 million shares of the registrant’s Class B common stock outstanding.
DOCUMENTS INCORPORATED BY REFERENCE
Portions of the registrant’s definitive proxy statement for its 2023 Annual Meeting of Stockholders (“Proxy Statement”), to be filed within 120 days of the registrant’s fiscal year ended January 31, 2023, are incorporated by reference into Part III of this Annual Report on Form 10-K where indicated. Except with respect to information specifically incorporated by reference in this Form 10-K, the Proxy Statement is not deemed to be filed as part of this Form 10-K.
TABLE OF CONTENTS
PART I
As used in this report, the terms “Workday,” “registrant,” “we,” “us,” and “our” mean Workday, Inc. and its subsidiaries unless the context indicates otherwise.
Our fiscal year ends on January 31. References to fiscal 2023, for example, refer to the year ended January 31, 2023.
SPECIAL NOTE REGARDING FORWARD-LOOKING STATEMENTS
This report contains forward-looking statements, which are subject to safe harbor protection under the Private Securities Litigation Reform Act of 1995. All statements contained in this report other than statements of historical fact, including statements regarding our future financial condition and operating results, business strategy and plans, and objectives for future operations, are forward-looking statements. The words “believe,” “may,” “will,” “estimate,” “continue,” “anticipate,” “intend,” “expect,” “seek,” “plan,” and similar expressions are intended to identify forward-looking statements. We have based these forward-looking statements largely on our current expectations, beliefs, and projections about future events, conditions, and trends that we believe may affect our financial condition, operating results, business strategy, short-term and long-term business operations and objectives, and financial needs. These forward-looking statements are subject to a number of risks, uncertainties, assumptions, and changes in circumstances that are difficult to predict and many of which are outside of our control, including those arising from the impact of recent macroeconomic events, inflation, and the coronavirus (“COVID-19”) pandemic, as well as those described in the “Risk Factors” section, which we encourage you to read carefully. Moreover, we operate in a very competitive and rapidly changing environment. New risks emerge from time to time. It is not possible for our management to predict all risks, nor can we assess the impact of all factors on our business or the extent to which any factor, or combination of factors, may cause actual results to differ materially from those contained in any forward-looking statements we may make.
In light of these risks, uncertainties, assumptions, and potential changes in circumstances, the future events, conditions, and trends discussed in this report may not occur and actual results could differ materially and adversely from those anticipated or implied by the forward-looking statements. Accordingly, you should not rely upon any forward-looking statements. Although we believe that the expectations reflected in the forward-looking statements are reasonable, we cannot guarantee future results, levels of activities, performance, or achievements. We are under no duty to update any of these forward-looking statements after the date of this report or to conform these statements to actual results or revised expectations, except as required by applicable law. If we do update any forward-looking statements, no inference should be drawn that we will make additional updates with respect to those or other forward-looking statements.
Item 1. BUSINESS
Overview
Workday is a leading provider of enterprise cloud applications for finance and human resources, helping customers adapt and thrive in a changing world. Workday provides more than 10,000 organizations with software-as-a-service solutions to help solve some of today’s most complex business challenges, including supporting and empowering their workforce, managing their finances and spend in an ever-changing environment, and planning for the unexpected.
Our purpose is to inspire a brighter work day for all. We strive to make the world of work and business better, and hope to empower customers to do the same through an innovative suite of solutions adopted by thousands of organizations around the world and across industries – from medium-sized businesses to more than 50% of the Fortune 500. Central to our purpose is a set of core values – with our employees as number one – followed by customer service, innovation, integrity, fun, and profitability. We believe that having happy employees leads to happy customers, and we are committed to helping our customers drive their digital transformations in this increasingly dynamic business environment.
As organizations adapt to changing conditions, we believe the need for an intuitive, scalable, and secure platform that ties finance, people, suppliers, and plans together in one version of truth is more important than ever. Workday provides organizations with a unified system that can help them plan, execute, analyze, and extend to other applications and environments, thereby helping them continuously adapt how they manage their business and operations. Workday embeds artificial intelligence (“AI”) and machine learning (“ML”) into the very core of our platform, enabling our applications to natively leverage AI and ML as part of the workflow. As a result, our AI and ML technology helps deliver better employee experiences, improve operational efficiencies, and provide insights for faster, data-driven decision-making. To support this, Workday delivers weekly product updates in addition to major feature releases twice a year. Through this model, Workday customers are able to stay current as one Workday community all on the same version of software that features a unified data and security model and rich user experience. We sell our solutions worldwide primarily through direct sales. We also offer professional services, as do our Workday Services Partners, to help customers deploy our solutions and continually adopt new capabilities.
In fiscal 2023, we announced a new Industry Accelerator program that combines Workday partners, solutions, and services to help speed cloud transformation efforts initially targeted at banking, healthcare, insurance, and technology companies. With these initiatives, we expect that Workday customers will benefit from a robust ecosystem, helping deliver additional innovation and solutions.
To grow our unified suite of Workday applications, we primarily invest in research and development, but we also selectively acquire companies that are consistent with our design principles, existing product set, corporate strategy, and company culture. We engage in acquisitions to augment our suite of applications, such as Peakon ApS (“Peakon”), a continuous listening platform that captures real-time employee sentiment; Zimit, a configure, price, quote (“CPQ”) solution built for services industries; and VNDLY, a cloud-based external workforce and vendor management technology.
Our Capabilities
Workday’s suite of enterprise cloud applications addresses the evolving needs of the chief financial officer (“CFO”), chief human resources officer (“CHRO”), and chief information officer (“CIO”) across various industries. Workday applications for Financial Management, Spend Management, Human Capital Management (“HCM”), Planning, and Analytics and Benchmarking can also be extended to other applications and environments through the Workday Cloud Platform.
Financial Management: Solutions for the Office of the CFO
In the changing world of finance, Workday helps finance leaders accelerate their journeys towards becoming a truly digital finance operation by giving them the tools they need to manage the strategic direction of their organizations while also supporting growth, profitability, and compliance and regulatory requirements. Workday’s suite of financial management applications, built on a foundation with AI and ML at the core, helps enable CFOs to maintain accounting information in the general ledger; manage core financial processes such as payables and receivables; identify real-time financial, operational, and management insights; improve financial consolidation; reduce time-to-close; promote internal control and auditability; and achieve consistency across global finance operations.
Spend Management: Solutions for the Office of the CFO
As businesses adapt to changing conditions, Workday provides procurement professionals with tools to support them through the source-to-contract process, such as a user experience designed for ease and collaboration. Workday offers a set of cloud spend management solutions that help organizations streamline supplier selection and contracts, manage indirect spend, and build and execute sourcing events, such as requests for proposals.
Human Capital Management: Solutions for the Office of the CHRO
In the changing world of human resources (“HR”), Workday helps organizations identify and respond to rapidly changing conditions, whether they stem from shifting talent needs or a renewed focus on belonging and diversity. Workday’s suite of HCM applications allows organizations to manage the entire employee lifecycle – from recruitment to retirement – enabling HR teams to hire, onboard, pay, develop and reskill, and provide meaningful employee experiences that are personalized and helpful, based on listening to the diverse needs of today’s workforce. For example, our skills technology, built on an AI and ML foundation, helps organizations make the important shift to a skills-first approach, helping them prepare today for the jobs of tomorrow.
Planning: Solutions for the Offices of the CFO and CHRO
In today’s dynamic business environment, businesses are continuously planning to model various scenarios and preparing to quickly respond to change. Workday provides an active planning process that can model across finance, workforce, sales, and operational data, helping organizations make more informed decisions and respond quickly to changing situations. Workday leverages AI and ML to assist in creating forecasts that incorporate historical and third-party data, like economic data and labor statistics. When combined with Workday’s financial management and HCM solutions, organizations are able to leverage real-time transactional data to dynamically adjust and recalibrate their plans.
Analytics and Benchmarking and Workday Cloud Platform: Solutions for the Offices of the CIO, CFO, and CHRO
In the changing world of work, Workday helps leaders make sense of the vast amount of data they collect enterprise-wide. For example, information technology (“IT”) leaders are navigating the complexities of supporting employees in new environments, which requires them to deploy an adaptable, secure architecture to help ensure global continuity and productivity while remaining agile. Workday provides applications for analytics and reporting, including augmented analytics to surface insights to the line of business in simple-to-understand stories, machine learning to drive efficiency and automation, and benchmarks to compare performance against other organizations. In addition, Workday enables the development of extension applications and integration tooling that can accommodate our customers’ unique ways of doing business.
Industries: Solutions for the Offices of the CIO, CFO, and CHRO
Workday offers businesses flexible solutions to help them adapt to their industry-specific needs and respond to change. Workday’s applications serve industries such as healthcare, higher education, and professional services. For example, Workday provides supply chain and inventory solutions to healthcare organizations, allowing them to purchase, stock, track, and replenish their inventory to help support patient care. In addition, higher education institutions can deploy Workday’s solutions to manage the end-to-end student and faculty lifecycle. Moreover, with Workday’s solutions, professional services organizations can optimize and manage their client-facing projects.
Product Development
At Workday, innovation is a core value. Our culture encourages out-of-the-box thinking and creativity, which enables us to create applications designed to change the way people work. We invest a significant percentage of our resources in product development and are committed to rapidly building and/or acquiring new applications and solutions. Our product development organization is responsible for product design, development, testing, and certification. We focus our efforts on developing new applications and core technologies, as well as further enhancing the usability, functionality, reliability, security, performance, and flexibility of existing applications.
Human Capital
Workday was founded with the idea of putting people at the center of enterprise software, which is why employees are our number one core value. As of January 31, 2023, our global workforce consisted of approximately 17,700 employees in 32 countries. We consider our relations with our employees to be very good. Our Chief People Officer, in partnership with our Chief Diversity Officer, is responsible for developing and executing Workday’s human capital strategy, including programs focused on total rewards; belonging and diversity; and employee development, engagement, and wellbeing. Our Chief People Officer and Co-CEOs regularly update our Board of Directors and Compensation Committee on human capital matters and seek their input on subjects such as succession planning, executive compensation, and our company-wide equity programs.
Total Rewards
Our compensation philosophy is designed to establish and maintain a fair and flexible compensation program that attracts and rewards talented individuals who possess the skills necessary to support our near-term objectives, create long-term value for our stockholders, grow our business, and assist in the achievement of our strategic goals. We believe that providing employees with competitive pay, ownership in the company, and a wide range of benefits is fundamental to employees feeling valued, motivated, and recognized for their contributions. Equity ownership is a key element of our compensation program, allowing employees to share in Workday’s successes and aligning the interests of our employees with our stockholders. Additionally, our total rewards package includes a cash bonus program, an employee stock purchase plan, healthcare and retirement benefits, paid time off, family leave, and other wellness programs. We also offer specialized benefits such as a holistic global mental and emotional health program, onsite and virtual healthcare resources, and support for fertility options and new parents, as well as reimbursement of adoption costs.
Our Commitment to Pay Parity
We believe that all employees deserve to be paid fairly and equitably and be afforded an equal chance to succeed. We have a market-based pay structure that compares our roles to those of our peers in each region. This process helps ensure we pay according to the market value of the jobs we offer. We also have processes in place to make pay decisions based on internally consistent and fair criteria. Each year, we conduct a company-wide pay equity analysis to help ensure pay equity between men and women as well as a US-based analysis with respect to employees of different ethnicities. If we identify differences in pay, we research those differences and, if appropriate, take action (including making adjustments to employees’ pay, when appropriate).
Belonging and Diversity
We strive to be a workplace where all employees are valued for their unique perspectives and where we all collectively contribute to Workday’s success and innovation. Belonging and Diversity (“B&D”) helps us cultivate an equitable and inclusive environment for all. Whether it's through creating resources and initiatives that enable and strengthen our culture, building inclusive products and technology, or hiring and developing diverse talent, our vision is to Value Inclusion, Belonging, and Equity (“VIBE”) for all.
We have made significant progress towards our ongoing company commitments to B&D. To track progress and plan for the future, we use internally developed products to bring diversity- and inclusion-related data into one centralized location and set our B&D strategy. Through these products, we can assess, measure, benchmark, and manage diversity and inclusion as well as empower our leaders to create B&D plans and measure performance and outcomes across areas such as hiring, development, and employee experience. Looking at our diversity data, we continue to make strides in our representation. To continue to improve employee representation, in 2020, we declared a set of company commitments to increase our overall representation of Black and Latinx employees in the U.S. by 30% and to double the number of our Black and Latinx leaders in the U.S. by the end of calendar year 2023. We have successfully surpassed our overall representation goal and as of January 31, 2023, we are at 86% of our goal to double the number of Black and Latinx leaders in the U.S. As of January 31, 2023, women represented 42% of our global employees and 37% of our leadership positions globally, and underrepresented minorities (defined as those who identify as Alaskan native, American Indian, Black, Latinx, Native Hawaiian, Other Pacific Islander, and/or two or more races) represented 14% of our U.S. employees and 10% of our leadership positions in the U.S.
We believe that talent is everywhere, but opportunity is not. Skills, education, and experience are gained in a variety of ways that are often not recognized in the traditional recruiting process. Talent acquisition at Workday ensures there is intentionality about weaving VIBE throughout our hiring practices to ensure an inclusive and equitable experience for all. We also invest in leading workforce development organizations who provide direct training and employment opportunities for candidates facing barriers to employment through our Opportunity Onramps programs.
Learning and Development
Our employees tell us they are most engaged when they are continuously being exposed to new things, empowered to build new skills, and able to make an impact. Our employees have instant access to training via several industry-leading learning platforms, which provide our global workforce with convenient, timely access to content from subject matter experts. We offer a number of educational resources, development opportunities, and a support community to guide employees throughout their Workday careers. For example, we developed Career Hub which helps our employees share skills and interests and receive relevant connections, curated learning content, and recommended jobs to help them on their career journeys. Using machine learning, Career Hub provides workers with suggestions to grow their skills and capabilities and encourages them to build a plan as they explore opportunities for continued career development.
Additionally, to foster a strong culture of compliance and ethics, we conduct annual compliance and ethics training of our Code of Conduct for all employees. In fiscal 2023, we had a 100% completion rate for our annual Code of Conduct training.
Communication and Engagement
Our culture and how we treat people are paramount at Workday, and we believe that being transparent and facilitating information sharing are key to our success. Workday leverages multiple communication channels to engage and inform employees, including company meetings, town halls, internal websites, and social collaboration tools. We also use Workday Peakon Employee Voice to collect feedback in real time from our employees and turn that feedback into dialog and action. Since we introduced Workday Peakon Employee Voice in fiscal 2022, we have had an average weekly participation rate of approximately 70% across our global employees, which reflects strong continuous participation by our employees. We receive data points from these surveys that help us identify actions to take to improve our company and our culture.
Buoyed by the opportunities offered by our own technology, our talent philosophy puts employees at the center of their own career and performance journey. A fundamental tenet of this approach is the belief that we should provide employees with the tools and framework to enable their careers, putting them in the driver’s seat. Our talent philosophy is centered on five factors that fuel employee success: enable contribution, grow capabilities, empower career, deepen connections, and align compensation and recognition.
Our talent and performance dashboard includes a summary of an employee’s five factors and provides a snapshot view of performance-related tasks, with a visual summary of goals, feedback, and growth opportunities. Employees can take action to update their contributions, capabilities, career, and connections using the quick links provided in the dashboard.
Health, Safety, and Wellbeing
At Workday, we take a holistic approach to our employees’ wellbeing and have created wellbeing programs that focus on four core pillars: happiness, health, movement, and nutrition. These programs go beyond traditional medical benefits and wellness offerings and allow employees to focus on their chosen wellness goals as well as their mental health.
In fiscal 2023, we transitioned to a hybrid work model to provide flexibility for our employees to work from home, while still bringing people together to foster collaboration and innovation. We offer new remote-based employees a $300 equipment stipend to enable them to have a comfortable work-from-home environment. To help keep health and mental wellness top of mind, we offer a series of programs and communications focused on mental health. These included tools and resources related to sleep, healthy eating, and mindfulness, as well as enhancements to our Employee Assistance Program to, among other things, facilitate access to mental health services.
Our Global Workplace Safety team supports the traditional corporate areas of employee health and safety and physical security for Workday on a global scale. From the workplace to work-related travel, we strive to keep our employees safe with programs including safety awareness training, emergency response protocols, and our ergonomics and life safety team programs.
Giving and Doing
In support of our efforts to give back to the communities where we live and work, our employees donate time and expertise as mentors and volunteers to help close the skills gap. On top of our strategic, company-led social impact and employee volunteerism efforts, we also believe that giving back is even more rewarding when people get to make an impact through their favorite causes. We encourage and support employee giving and volunteering through programs such as our charitable donation matching gift program, our paid time off benefit for employees to volunteer and give back to their communities, and our team volunteer experience, where employee teams of five or more can volunteer with a charity partner of their choice and receive grants of up to $5,000.
Customers
We primarily sell to medium-sized and large, global organizations that span numerous industry categories, including professional and business services, financial services, healthcare, education, government, technology, media, retail, and hospitality.
We have built a company culture centered around customer success and satisfaction. As part of their subscription, customers are provided support services and tools to enhance their experience with Workday applications. This includes 24/7 support; training; a Customer Success Management group to assist customers in production; and Workday Community, an online portal where customers can collaborate and share knowledge and best practices. Additionally, we offer extensive customer training opportunities and a professional services ecosystem of experienced Workday consultants and system integrators to help customers not only achieve a timely adoption of Workday but continue to get value out of our applications over the life of their subscription.
Sales and Marketing
We sell our subscription contracts and related services globally, primarily through our direct sales organization, which consists of field sales and field sales support personnel. The Workday Field Sales team is aligned by geography, industry, and/or prospect size. We generate customer leads, accelerate sales opportunities, and build brand awareness through our marketing programs and strategic relationships. Our marketing programs largely target senior business leaders, including CFOs, CHROs, and CIOs. Our sales strategy also focuses on growing our relationships with our existing customers to expand the adoption of our suite of solutions over time.
As a core part of our sales and marketing strategy, we have developed a global ecosystem of partners to both broaden and complement our application offerings and to provide services that are outside of our area of focus. These relationships include software and technology partners, consulting and deployment service providers, business process outsourcing partners, and software partners of Workday Ventures, our strategic investment arm, who all help enable Workday to address the challenges our customers face while focusing on executing against our strategy.
Seasonality
We have experienced seasonality in terms of when we enter into customer agreements for our services. Historically, we have signed a significantly higher percentage of agreements with new customers, as well as renewal agreements with existing customers, in the fourth quarter of each fiscal year due to large enterprise account buying patterns. Although these seasonal factors are common in the technology industry, historical patterns should not be considered a reliable indicator of our future sales activity or performance.
Competition
The overall market for enterprise application software is rapidly evolving, highly competitive, and subject to changing technology, shifting customer needs, and frequent introductions of new products. We currently compete with large, well-established, enterprise application software vendors, such as Oracle Corporation (“Oracle”) and SAP SE (“SAP”). We also face competition from other enterprise software vendors, from regional competitors that only operate in certain geographic markets, and from vendors of specific applications that address only one or a portion of our applications, some of which offer cloud-based solutions. These vendors include UKG Inc.; Automatic Data Processing, Inc.; Infor, Inc.; Ceridian HCM Holding Inc.; Microsoft Corporation; Anaplan, Inc.; and Coupa Software Inc.
In addition, other cloud companies that provide services in different markets may develop applications or acquire companies that operate in our target markets, and some potential customers may elect to develop their own internal applications. However, the domain and industry expertise that is required for a successful solution in the areas of financial management, HCM, and analytics may inhibit new entrants that are unable to invest the necessary capital to accurately address global requirements and regulations. We expect continued consolidation in our industry that could lead to significantly increased competition.
We believe the principal competitive factors in our markets include:
-
level of customer satisfaction and quality of customer references;
-
speed to deploy and ease of use;
-
breadth and depth of application functionality;
-
total cost of ownership;
-
brand awareness and reputation;
-
adaptive technology platform;
-
capability for configuration, integration, security, scalability, and reliability of applications;
-
operational excellence to ensure system availability, scalability, and performance;
-
ability to innovate and rapidly respond to customer needs;
-
domain and industry expertise in applicable laws and regulations;
-
size of customer base and level of user adoption;
-
customer confidence in financial stability and future viability; and
-
ability to integrate with legacy enterprise infrastructure and third-party applications.
We believe that we compete favorably based on these factors. Our ability to remain competitive will largely depend on our ongoing performance in product development and customer support.
For more information regarding the competitive risks we face, see “Risk Factors” included in Part I, Item 1A of this report.
Intellectual Property
We rely on a combination of trade secrets, patents, copyrights, and trademarks, as well as contractual protections, to establish and protect our intellectual property rights. We require our employees, contractors, consultants, suppliers, and other third parties to enter into confidentiality and proprietary rights agreements, and we control access to software, documentation, and other proprietary information. Although we rely on intellectual property rights, including trade secrets, patents, copyrights, and trademarks, as well as contractual protections and controls to establish and protect our proprietary rights, we believe that factors such as the technological and creative skills of our personnel; creation of new products, features, and functionality; and frequent enhancements to our applications are more essential to establishing and maintaining our technology leadership position.
Governmental Regulation
As a public company with global operations, we are subject to various federal, state, local, and foreign laws and regulations. These laws and regulations, which may differ among jurisdictions, include, among others, those related to financial and other disclosures, accounting standards, privacy and data protection, intellectual property, AI ethics and machine learning, corporate governance, tax, government contracting, trade, antitrust, employment, immigration and travel, import/export, and anti-corruption. The costs to comply with these governmental regulations are not material to the understanding of our business. For a further discussion of the risks associated with government regulations that may materially impact us, see “Risk Factors” included in Part I, Item 1A of this report.
Corporate Information
We were incorporated in March 2005 in Nevada, and in June 2012, we reincorporated in Delaware. Our principal executive offices are located at 6110 Stoneridge Mall Road, Pleasanton, California 94588, and our telephone number is (877) WORKDAY. Our website address is www.workday.com. The information on, or that can be accessed through, our website is not part of this report. Workday, the Workday logo, VIBE, Peakon, Zimit, VNDLY, and Opportunity Onramps are trademarks of Workday, Inc., which may be registered in the United States and elsewhere. Other trademarks, service marks, or trade names appearing in this report are the property of their respective owners.
Available Information
Our Annual Report on Form 10-K, Quarterly Reports on Form 10-Q, Current Reports on Form 8-K, and other filings with the Securities and Exchange Commission (“SEC”), and all amendments to these filings, can be obtained free of charge from our website at www.workday.com/sec-filings. The SEC maintains an Internet site that contains reports, proxy and information statements, and other information regarding issuers that file electronically with the SEC at www.sec.gov. Workday also uses its blogs.workday.com website as a means of disclosing material non-public information and for complying with its disclosure obligations under Regulation FD. Information contained on or accessible through any website reference herein is not part of, or incorporated by reference in, this Form 10-K, and the inclusion of such website addresses is as inactive textual references only.
Item 1A. RISK FACTORS
Investing in our securities involves a high degree of risk. You should carefully consider the risks and uncertainties described below, together with all of the other information in this report, including the consolidated financial statements and the related notes included elsewhere in this Annual Report on Form 10-K, before making an investment decision. The risks and uncertainties described below are not the only ones we face. Additional risks and uncertainties that we are unaware of, or that we currently believe are not material, may also become important factors that materially and adversely affect our business. If any of the following risks actually occurs, our business operations, financial condition, operating results, and prospects could be materially and adversely affected. The market price of our securities could decline due to the materialization of these or any other risks, and you could lose part or all of your investment.
Summary of Risk Factors
The below summary risks provide an overview of the material risks we are exposed to in the normal course of our business activities. The below summary risks do not contain all of the information that may be important to you, and you should read these together with the more detailed discussion of risks set forth following this section, as well as elsewhere in this Annual Report on Form 10-K under the heading “Management’s Discussion and Analysis of Financial Condition and Results of Operations.” Additional risks beyond those summarized below, or discussed elsewhere in “Risk Factors” and “Management’s Discussion and Analysis of Financial Condition and Results of Operations,” may apply to our activities or operations as currently conducted or as we may conduct them in the future, or to the markets in which we currently operate or may in the future operate. Consistent with the foregoing, we are exposed to a variety of risks, including those associated with the following:
-
any compromise of our information technology systems or the security measures of our service partners, or the unauthorized access of customer or user data;
-
our ability to properly manage our technical operations infrastructure, including our data centers and computing infrastructure operated by third parties, or the impact of service outages or delays in the deployment of our applications, or the failure of our applications to perform properly;
-
privacy concerns and evolving domestic or foreign laws and regulations;
-
the impact of continuing global economic and geopolitical volatility, inflation, rising interest rates, and the measures we may take in response to such events;
-
any loss of key employees or the inability to attract, train, and retain highly skilled employees;
-
our ability to compete effectively in the intensely competitive markets in which we participate;
-
exposure to risks inherent to sales to customers outside the United States or with international operations;
-
any dissatisfaction of our users with the deployment, training, and support services provided by us and our partners;
-
the fluctuation of our quarterly results;
-
our ability to realize a return on our current development efforts or offer new features, enhancements, and modifications to our products and services, and our ability to realize a return on the investments we have made toward entering new markets and new lines of business;
-
delays in the reflection of downturns or upturns in new sales in our operating results associated with long sales cycles;
-
our ability to predict the rate of customer subscription renewals or adoptions;
-
our ability to establish or maintain our strategic relationships with third parties, or any failure to successfully integrate our applications with third-party technologies;
-
a failure to manage our growth effectively;
-
our ability to realize the expected business or financial benefits of company, employee, or technology acquisitions;
-
our history of cumulative losses;
-
any failure to protect our intellectual property rights domestically and internationally;
-
lawsuits against us by third parties for alleged infringement of their proprietary rights or in connection with our use of open source software;
-
risks related to government contracts and related procurement regulations;
-
any adverse litigation results;
-
the limited ability of non-affiliates to influence corporate matters due to the dual class structure of our common stock;
-
our substantial indebtedness;
-
the limited ability of third parties to seek a merger, tender offer, or proxy contest due to Delaware law and provisions in our organizational documents; and
-
the limited ability of a stockholder to bring a claim in a judicial forum that it finds favorable for disputes with us or any of our directors, officers, or other employees due to the exclusive forum provision in our organizational documents.
Risks Related to Our Business and Industry
If we fail to properly manage our technical operations infrastructure, experience service outages, undergo delays in the deployment of our applications, or our applications fail to perform properly, we may be subject to liabilities and our reputation and operating results may be adversely affected.
We have experienced significant growth in the number of users, transactions, and data that our operations infrastructure supports. We seek to maintain sufficient excess capacity in our operations infrastructure to meet the needs of all of our customers and users, as well as our own needs, and to ensure that our services and solutions are accessible within an acceptable load time. If we do not accurately predict our infrastructure requirements, we may experience service outages. Furthermore, if our operations infrastructure fails to scale, we may experience delays in providing service as we seek to obtain additional capacity, and no assurance can be made that we will be able to secure such additional capacity on the same or similar terms as we currently have, which could result in a significant increase in our operating costs. Moreover, any failure to scale and secure additional capacity could result in delays in new feature rollouts, reduce the demand for our applications, result in customer and end user dissatisfaction, and adversely affect our business and operating results.
We have experienced, and may in the future experience, defects, system disruptions, outages, and other performance problems, including the failure of our applications to perform properly. These problems may be caused by a variety of factors, including infrastructure and software or code changes, vendor issues, software and system defects, human error, viruses, worms, security attacks (internal and external), fraud, spikes in customer usage, and denial of service issues. In some instances, we may not be able to identify the cause or causes of these performance problems within an acceptable period of time. Because of the large amount of data that we collect and process in our systems, it is possible that these issues could result in significant disruption, data loss or corruption, or cause the data to be incomplete or contain inaccuracies that our customers and other users regard as significant. Additionally, such issues have, and may in the future, result in vulnerabilities that could inadvertently result in unauthorized access to data. Furthermore, the availability or performance of our applications could also be adversely affected by our customers’ and other users’ inability to access the internet. For example, our customers and other users access our applications through their internet service providers. If a service provider fails to provide sufficient capacity to support our applications or otherwise experiences service outages, such failure could interrupt our customers’ and other users’ access to o
Showing the first 8K of 137K characters. Open the full section
Item 1B. UNRESOLVED STAFF COMMENTS
None.
Item 2. PROPERTIES
Our corporate headquarters, which includes operations and product development facilities, is located in Pleasanton, California. It consists of approximately 1.2 million square feet of owned facilities and a 6.9 acre parcel of leased land. The land lease will expire in 2108. In addition, we lease office space in various locations, including North America, Europe, and Asia Pacific, and data center capacity throughout North America and Europe.
We believe that our facilities are suitable to meet our current needs. In the future, we may expand our facilities or add new facilities as we add employees and enter new geographic markets, and we believe that suitable additional or alternative space will be available on commercially reasonable terms to accommodate any such growth.
Item 3. LEGAL PROCEEDINGS
We are regularly involved with claims, suits, purported class or representative actions, and may be involved in regulatory and government investigations and other proceedings, involving competition, intellectual property, data security and privacy, bankruptcy, tax and related compliance, labor and employment, commercial disputes, and other matters. Such claims, suits, actions, regulatory and government investigations, and other proceedings can impose a significant burden on management and employees, could prevent us from offering one or more of our applications, services, or features to others, could require us to change our technology or business practices, or could result in monetary damages, fines, civil or criminal penalties, reputational harm, or other adverse consequences.
These claims, suits, actions, regulatory and government investigations, and other proceedings may include speculative, substantial, or indeterminate monetary amounts. We record a liability when we believe that it is probable that a liability has been incurred and the amount can be reasonably estimated. Significant judgment is required to determine both the likelihood of there being a liability and the estimated amount of a liability related to such matters. With respect to our outstanding matters, based on our current knowledge, we believe that the amount or range of reasonably possible liability will not, either individually or in aggregate, have a material adverse effect on our business, financial condition, operating results, or cash flows. However, the outcome of such matters is inherently unpredictable and subject to significant uncertainties.
Item 4. MINE SAFETY DISCLOSURES
Item 5. MARKET FOR REGISTRANT’S COMMON EQUITY, RELATED STOCKHOLDER MATTERS, AND ISSUER PURCHASES OF EQUITY SECURITIES
Market Information for Common Stock
Our Class A common stock is traded on the Nasdaq Global Select Market under the symbol “WDAY”. Our Class B common stock is not listed or traded on any stock exchange.
Dividend Policy
We have never declared or paid cash dividends on our capital stock. We currently intend to retain any future earnings to finance the operation and expansion of our business and do not expect to declare or pay any dividends in the foreseeable future. Any further determination to pay dividends on our capital stock will be at the discretion of our Board of Directors, subject to applicable laws, and will depend on our financial condition, operating results, capital requirements, general business conditions, and other factors that our Board of Directors considers relevant.
Stockholders
As of February 23, 2023, there were 23 stockholders of record of our Class A common stock, including The Depository Trust Company, which holds shares of our common stock on behalf of an indeterminate number of beneficial owners, as well as 68 stockholders of record of our Class B common stock.
Securities Authorized for Issuance under Equity Compensation Plans
See Part III, Item 12 “Security Ownership of Certain Beneficial Owners and Management and Related Stockholder Matters” for more information regarding securities authorized for issuance.
Stock Performance Graph
The following shall not be deemed “soliciting material” or deemed “filed” for purposes of Section 18 of the Exchange Act, or subject to Regulation 14A or 14C, other than as provided by this Item 5, or to the liabilities of Section 18 of the Exchange Act, or incorporated by reference into any of our other filings under the Exchange Act or the Securities Act, except to the extent we specifically incorporate it by reference into such filing.
This chart compares the cumulative total return on our common stock with that of the S&P 500 Index and the S&P 1500 Application Software Index. The chart assumes $100 was invested at the close of market on January 31, 2018, in our Class A common stock, the S&P 500 Index, and the S&P 1500 Application Software Index, and assumes the reinvestment of any dividends. The stock price performance on the following graph is not necessarily indicative of future stock price performance.
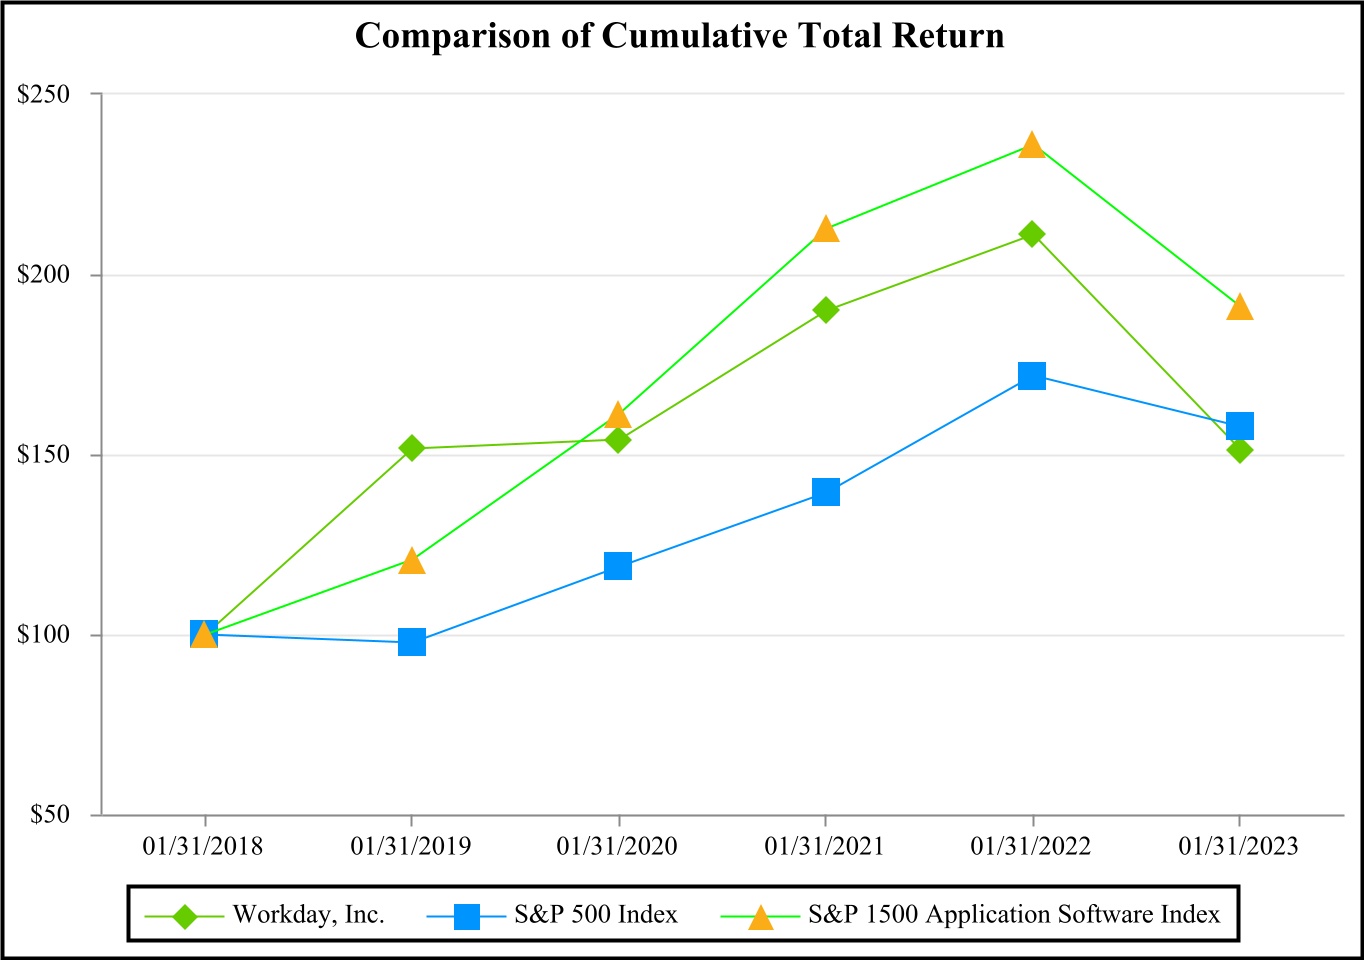
| Company/Index | 1/31/2018 | 1/31/2019 | 1/31/2020 | 1/31/2021 | 1/31/2022 | 1/31/2023 | ||||||||||||||||||||||||||||||||
| Workday, Inc. | $ | 100.00 | $ | 151.41 | $ | 154.00 | $ | 189.78 | $ | 211.04 | $ | 151.33 | ||||||||||||||||||||||||||
| S&P 500 Index | 100.00 | 97.68 | 118.84 | 139.32 | 171.75 | 157.60 | ||||||||||||||||||||||||||||||||
| S&P 1500 Application Software Index | 100.00 | 120.67 | 161.22 | 212.71 | 235.90 | 191.10 |
Recent Sales of Unregistered Securities
None.
Purchases of Equity Securities by the Issuer and Affiliated Purchases
The table below sets forth information regarding our purchases of our Class A common stock during the three months ended January 31, 2023 (in thousands, except per share data):
| Period | Total Number of Shares Purchased (1) | Average Price Paid per Share | Total Number of Shares Purchased as Part of Publicly Announced Plans or Programs (1) | Maximum Number (or Approximate Dollar Value) of Shares that May Yet Be Purchased Under the Plans or Programs (1) | ||||||||||||||||||||||
| November 1, 2022 - November 30, 2022 | — | $ | — | — | $ | — | ||||||||||||||||||||
| December 1, 2022 - December 31, 2022 | 181 | 165.72 | 181 | 470,001 | ||||||||||||||||||||||
| January 1, 2023 - January 31, 2023 | 269 | 165.76 | 269 | 425,334 | ||||||||||||||||||||||
| Total | 450 | 450 |
(1)In November 2022, our Board of Directors authorized the repurchase of up to $500 million of our outstanding shares of Class A common stock. We may repurchase shares of Class A common stock from time to time through open market purchases, in privately negotiated transactions, or by other means, including through the use of trading plans intended to qualify under Rule 10b5-1 under the Exchange Act, in accordance with applicable securities laws and other restrictions. The timing and total amount of shares repurchased will depend upon business, economic, and market conditions, corporate and regulatory requirements, prevailing stock prices, and other considerations. The Share Repurchase Program has a term of 18 months, may be suspended or discontinued at any time, and does not obligate us to acquire any amount of Class A common stock. All repurchases disclosed in this table were made pursuant to the publicly announced Share Repurchase Program. For further information, see Note 14, Stockholders’ Equity of the Notes to Consolidated Financial Statements included in Part II, Item 8 of this report.
Item 6. [Reserved]
Item 7. MANAGEMENT’S DISCUSSION AND ANALYSIS OF FINANCIAL CONDITION AND RESULTS OF OPERATIONS
The following discussion of our financial condition and results of operations should be read in conjunction with the consolidated financial statements and notes thereto included elsewhere in this report. The following discussion contains forward-looking statements that reflect our plans, estimates, and beliefs. Our actual results could differ materially from those discussed in the forward-looking statements. Factors that could cause or contribute to these differences include those discussed below and elsewhere in this report, particularly in “Risk Factors” included in Part I, Item 1A of this report.
The following discussion of our financial condition and results of operations covers fiscal 2023 and 2022 items and year-over-year comparisons between fiscal 2023 and 2022. Discussions of fiscal 2021 items and year-over-year comparisons between fiscal 2022 and 2021 that are not included in this Form 10-K can be found in “Management’s Discussion and Analysis of Financial Condition and Results of Operations” in Part II, Item 7 of our Annual Report on Form 10-K for the fiscal year ended January 31, 2022, that was filed with the SEC on February 28, 2022.
Overview
Workday delivers applications for financial management, spend management, human capital management, planning, and analytics. With Workday, our customers have a unified system that can help them plan, execute, analyze, and extend to other applications and environments, thereby helping them continuously adapt how they manage their business and operations. Our diverse customer base includes medium-sized and large, global organizations within numerous industry categories, including professional and business services, financial services, healthcare, education, government, technology, media, retail, and hospitality.
We have achieved significant growth since our inception in 2005, with a substantial amount of our growth coming from new customers. Our current financial focus is on growing our revenues and expanding both our customer base and our footprint within our existing customers. While we have a history of GAAP operating losses, we strive to invest in a disciplined manner across all of our functional areas to sustain continued near-term revenue growth and support our long-term initiatives. We expect our product development, sales and marketing, and general and administrative expenses as a percentage of total revenues will decrease over the longer term as we grow our revenues, and we anticipate that we will gain economies of scale by increasing our customer base without direct incremental development costs.
We plan to reinvest a significant portion of our incremental revenues in future periods to grow our business. We have invested and expect to continue to invest heavily in our product development efforts to deliver additional compelling applications, enhance existing applications, and to address customers’ evolving needs. In addition, we plan to continue to expand our ability to sell our applications globally, particularly in Europe and Asia-Pacific, by investing in product development and customer support to address the business needs of targeted local markets, increasing our sales organization and marketing programs, acquiring and leasing additional office space, and expanding our ecosystem of service partners to support local deployments. We expect to make further significant investments in our data center capacity and equipment and third-party hosted infrastructure platforms as we plan for future growth. We are also investing in personnel to support our growing customer base.
We regularly evaluate acquisition and investment opportunities in complementary businesses, employee teams, services, technologies, and intellectual property rights in an effort to expand our product and service offerings. For example, in fiscal 2022, we acquired Peakon, a continuous listening platform that captures real-time employee sentiment, Zimit, a configure, price, quote solution built for services industries, and VNDLY, a cloud-based external workforce and vendor management technology. We expect to continue making such acquisitions and investments in the future. While we remain focused on improving operating margin, these acquisitions and investments will increase our costs on an absolute basis in the near term. Many of these investments will occur in advance of experiencing any direct benefit from them and could make it difficult to determine if we are allocating our resources efficiently.
Since inception, we have also invested heavily in our professional services organization to help ensure that customers successfully deploy and adopt our applications. Additionally, we continue to expand our professional services partner ecosystem to further support our customers. We believe our investment in professional services, as well as partners building consulting practices around Workday and helping to deliver additional innovation and solutions, will drive additional customer subscriptions and continued growth in revenues. Due to our ability to leverage the expanding partner ecosystem, we expect the rate of professional services revenue growth to decline over time and continue to be lower than subscription revenue growth.
Impact of Current Economic Conditions
Recent macroeconomic events including higher inflation, the U.S. Federal Reserve raising interest rates, the COVID-19 pandemic, and the Russian invasion of Ukraine have negatively impacted the global economy, disrupted global supply chains, and created significant uncertainty, volatility, and disruption of financial markets. Despite the continuing uncertainty associated with these events, we are confident in the long-term overall health of our business, the strength of our product offerings, and our ability to continue to execute on our strategy and help our customers on their HR and finance digital transformation journeys. Demand for our products remains strong, and we continue to achieve solid new subscription bookings.
Our near-term revenues are relatively predictable as a result of our subscription-based business model. We have experienced, and may continue to experience, the lengthening of certain sales cycles, particularly within net new opportunities. If the economic uncertainty continues, we may also experience a negative impact on customer renewals, sales and marketing efforts, revenue growth rates, customer deployments, customer collections, product development, or other financial metrics. Any of these factors could harm our business, financial condition, and operating results. For further discussion of the potential impacts of recent macroeconomic events on our business, financial condition, and operating results, see “Risk Factors” included in Part I, Item 1A of this report.
Financial Results Overview
The following table provides an overview of our key metrics (in thousands, except percentages, basis points, and headcount data):
| As of and for the Years Ended January 31, | |||||||||||||||||
| 2023 | 2022 | Change | |||||||||||||||
| Total revenues | $ | 6,215,818 | $ | 5,138,798 | 21 | % | |||||||||||
| Subscription services revenues | $ | 5,567,206 | $ | 4,546,313 | 22 | % | |||||||||||
| GAAP operating income (loss) | $ | (222,200) | $ | (116,450) | 91 | % | |||||||||||
| Non-GAAP operating income (1) | $ | 1,209,636 | $ | 1,149,704 | 5 | % | |||||||||||
| GAAP operating margin | (3.6) | % | (2.3) | % | (130 bps) | ||||||||||||
| Non-GAAP operating margin (1) | 19.5 | % | 22.4 | % | (290 bps) | ||||||||||||
| Operating cash flows | $ | 1,657,195 | $ | 1,650,704 | 0 | % | |||||||||||
| Total subscription revenue backlog | $ | 16,448,155 | $ | 12,806,855 | 28 | % | |||||||||||
| 24-month subscription revenue backlog | $ | 9,677,373 | $ | 7,975,554 | 21 | % | |||||||||||
| Cash, cash equivalents, and marketable securities | $ | 6,121,394 | $ | 3,644,161 | 68 | % | |||||||||||
| Headcount | 17,744 | 15,204 | 17 | % |
(1)See “Non-GAAP Financial Measures” below for further information.
Components of Results of Operations
Revenues
We derive our revenues from subscription services and professional services. Subscription services revenues primarily consist of fees that give our customers access to our cloud applications, which include related customer support. Professional services revenues include fees for deployment services, optimization services, and training.
Subscription services revenues accounted for approximately 90% of our total revenues during fiscal 2023, and represented 96% of our total unearned revenue as of January 31, 2023. Subscription services revenues are driven primarily by the number of customers, the number of workers at each customer, the specific applications subscribed to by each customer, and the price of our applications.
The mix of applications to which each customer subscribes can affect our financial performance due to price differentials in our applications. Pricing for our applications varies based on many factors, including the complexity and maturity of the application and its acceptance in the marketplace. New products or services offerings by competitors in the future could also impact the mix and pricing of our offerings.
Subscription services revenues are recognized over time as services are delivered and consumed concurrently over the contractual term, beginning on the date our service is made available to the customer. Our subscription contracts typically have a term of three years or longer and are generally noncancelable. We generally invoice our customers annually in advance. Amounts that have been invoiced are initially recorded as unearned revenue.
Our consulting engagements are billed on a time and materials basis or a fixed price basis. For contracts billed on a time and materials basis, revenues are recognized over time as the professional services are performed. For contracts billed on a fixed price basis, revenues are recognized over time based on the proportion of the professional services performed. In some cases, we supplement our consulting teams by subcontracting resources from our service partners and deploying them on customer engagements. As the Workday-related consulting practices of our partner firms continues to develop, we expect these partners to increasingly contract directly with our subscription customers.
Subscription Revenue Backlog
Our subscription revenue backlog, which is also referred to as remaining performance obligations for subscription contracts, represents contracted subscription services revenues that have not yet been recognized and includes billed and unbilled amounts. Subscription revenue backlog may fluctuate from period to period due to a number of factors, including the timing of renewals and overall renewal rates, new business growth, average contract duration, and seasonality.
Costs and Expenses
Costs of subscription services revenues. Costs of subscription services revenues consist primarily of employee-related expenses associated with hosting our applications and providing customer support, expenses related to data centers and computing infrastructure operated by third parties, and depreciation of computer equipment and software.
Costs of professional services revenues. Costs of professional services revenues consist primarily of employee-related expenses associated with these services, subcontractor expenses, and travel expenses.
Product development expenses. Product development expenses consist primarily of employee-related expenses associated with our efforts to add new features and applications, increase functionality, and enhance the ease of use of our cloud applications.
Sales and marketing expenses. Sales and marketing expenses consist primarily of employee-related expenses, sales commissions, marketing programs, and travel expenses. Marketing programs consist of advertising, events, corporate communications, brand awareness, brand ambassador campaigns, and product marketing activities. Sales commissions are considered incremental costs of obtaining a contract with a customer. Sales commissions for new revenue contracts are capitalized and amortized on a straight-line basis over a period of benefit that we have determined to be five years.
General and administrative expenses. General and administrative expenses consist of employee-related expenses for finance and accounting, legal, HR, information systems personnel, professional fees, and other corporate expenses.
Results of Operations
Revenues
Our total revenues for fiscal 2023, 2022, and 2021, were as follows (in thousands):
| Year Ended January 31, | |||||||||||||||||
| 2023 | 2022 | 2021 | |||||||||||||||
| Subscription services | $ | 5,567,206 | $ | 4,546,313 | $ | 3,788,452 | |||||||||||
| Professional services | 648,612 | 592,485 | 529,544 | ||||||||||||||
| Total revenues | $ | 6,215,818 | $ | 5,138,798 | $ | 4,317,996 |
Total revenues were $6.2 billion for fiscal 2023, compared to $5.1 billion for fiscal 2022, an increase of $1.1 billion, or 21%. Subscription services revenues were $5.6 billion for fiscal 2023, compared to $4.5 billion for fiscal 2022, an increase of $1.0 billion, or 22%. The increase in subscription services revenues was primarily due to an increased number of customer contracts and strong customer renewals, with gross and net retention rates over 95% and over 100%, respectively. Professional services revenues were $649 million for fiscal 2023, compared to $592 million for fiscal 2022, an increase of $56 million, or 9%. The increase in professional services revenues was primarily due to Workday performing deployment and integration services for higher valued contracts.
Subscription Revenue Backlog
As of January 31, 2023, our total subscription revenue backlog was $16.4 billion, with $9.7 billion expected to be recognized in revenues over the next 24 months. As of January 31, 2022, our total subscription revenue backlog was $12.8 billion, with $8.0 billion expected to be recognized in revenues over the next 24 months. The increase in subscription revenue backlog during fiscal 2023 was primarily driven by the addition of new customers, expansion of our product offerings with existing customers, and the timing of renewals.
Operating Expenses
GAAP operating expenses were $6.4 billion for fiscal 2023, compared to $5.3 billion for fiscal 2022, an increase of $1.2 billion, or 23%. The increase in GAAP operating expenses was primarily due to an increase of $845 million in employee-related expenses, including share-based compensation. The main driver for the increase in employee-related expenses was higher headcount. We also recognized $40 million of expense from the workforce realignment announced in the fourth quarter of fiscal 2023. Additionally, we incurred costs related to our performance-based cash bonus program that we introduced in the fourth quarter of fiscal 2022 for all employees not covered under an existing cash incentive plan (“performance-based cash bonus program”). This program replaced our performance based restricted stock unit (“PRSU”) bonus program, resulting in a net increase of $36 million. Further, we changed the vesting dates of all unvested restricted stock units (“RSU”) from the 15th to the 5th of each month which resulted in an acceleration of share-based compensation expense of $28 million in the fourth quarter of fiscal 2023.
Additional increases within GAAP operating expenses included $94 million in facilities and IT-related expenses partly driven by our employees returning to our offices, $75 million in third-party expenses for hardware maintenance and data center capacity reflecting our continued investment in our technical operations infrastructure, and $54 million in travel expenses and $51 million related to marketing programs partly driven by a return to in-person events.
Non-GAAP operating expenses were $5.0 billion for fiscal 2023, compared to $4.0 billion for fiscal 2022, an increase of $1.0 billion, or 25%. The increase in non-GAAP operating expenses included $686 million in employee-related expenses primarily due to higher headcount, of which $102 million was related to the new performance-based cash bonus program, and $34 million was related to the workforce realignment. Additionally, there were increases of $94 million in facilities and IT-related expenses partly driven by our employees returning to our offices, $75 million in third-party expenses for hardware maintenance and data center capacity reflecting our continued investment in our technical operations infrastructure, and $54 million in travel expenses and $51 million related to marketing programs partly driven by a return to in-person events. Non-GAAP operating expenses were calculated by excluding share-based compensation expenses and certain other expenses, which consist of employer payroll tax-related items on employee stock transactions and amortization of acquisition-related intangible assets. See “Non-GAAP Financial Measures” below for further information.
Reconciliations of our GAAP to non-GAAP operating expenses were as follows (in thousands):
| Year Ended January 31, 2023 | |||||||||||||||||||||||
| GAAP Operating Expenses | Share-Based Compensation Expenses | Other Operating Expenses (1) | Non-GAAP Operating Expenses (2) | ||||||||||||||||||||
| Costs of subscription services | $ | 1,011,447 | $ | (106,119) | $ | (59,769) | $ | 845,559 | |||||||||||||||
| Costs of professional services | 703,731 | (110,216) | (6,678) | 586,837 | |||||||||||||||||||
| Product development | 2,270,660 | (618,973) | (23,162) | 1,628,525 | |||||||||||||||||||
| Sales and marketing | 1,848,093 | (249,248) | (42,490) | 1,556,355 | |||||||||||||||||||
| General and administrative | 604,087 | (210,066) | (5,115) | 388,906 | |||||||||||||||||||
| Total costs and expenses | $ | 6,438,018 | $ | (1,294,622) | $ | (137,214) | $ | 5,006,182 |
| Year Ended January 31, 2022 | |||||||||||||||||||||||
| GAAP Operating Expenses | Share-Based Compensation Expenses | Other Operating Expenses (1) | Non-GAAP Operating Expenses (2) | ||||||||||||||||||||
| Costs of subscription services | $ | 795,854 | $ | (85,713) | $ | (54,551) | $ | 655,590 | |||||||||||||||
| Costs of professional services | 632,241 | (113,443) | (11,181) | 507,617 | |||||||||||||||||||
| Product development | 1,879,220 | (543,135) | (32,935) | 1,303,150 | |||||||||||||||||||
| Sales and marketing | 1,461,921 | (215,692) | (47,457) | 1,198,772 | |||||||||||||||||||
| General and administrative | 486,012 | (154,422) | (7,625) | 323,965 | |||||||||||||||||||
| Total costs and expenses | $ | 5,255,248 | $ | (1,112,405) | $ | (153,749) | $ | 3,989,094 |
| Year Ended January 31, 2021 | |||||||||||||||||||||||
| GAAP Operating Expenses | Share-Based Compensation Expenses | Other Operating Expenses (1) | Non-GAAP Operating Expenses (2) | ||||||||||||||||||||
| Costs of subscription services | $ | 611,912 | $ | (63,253) | $ | (34,799) | $ | 513,860 | |||||||||||||||
| Costs of professional services | 586,220 | (101,869) | (6,486) | 477,865 | |||||||||||||||||||
| Product development | 1,721,222 | (505,376) | (27,567) | 1,188,279 | |||||||||||||||||||
| Sales and marketing | 1,233,173 | (202,819) | (35,797) | 994,557 | |||||||||||||||||||
| General and administrative | 414,068 | (131,537) | (6,337) | 276,194 | |||||||||||||||||||
| Total costs and expenses | $ | 4,566,595 | $ | (1,004,854) | $ | (110,986) | $ | 3,450,755 |
(1)Other operating expenses include amortization of acquisition-related intangible assets of $86 million, $78 million, and $60 million for fiscal 2023, 2022, and 2021, respectively. In addition, other operating expenses include employer payroll tax-related items on employee stock transactions of $52 million, $76 million, and $51 million for fiscal 2023, 2022, and 2021, respectively.
(2)See “Non-GAAP Financial Measures” below for further information.
Costs of Subscription Services
GAAP operating expenses in costs of subscription services were $1.0 billion for fiscal 2023, compared to $796 million for fiscal 2022, an increase of $216 million, or 27%. The increase in costs of subscription services included increases of $100 million in employee-related expenses, including share-based compensation, primarily due to higher headcount, $60 million in third-party expenses for hardware maintenance and data center capacity, and $23 million in facilities and IT-related expenses.
Non-GAAP operating expenses in costs of subscription services were $846 million for fiscal 2023, compared to $656 million for fiscal 2022, an increase of $190 million, or 29%. The increase in costs of subscription services included increases of $81 million in employee-related expenses primarily due to higher headcount, $60 million in third-party expenses for hardware maintenance and data center capacity, and $23 million in facilities and IT-related expenses.
We expect GAAP and non-GAAP operating expenses in costs of subscription services will continue to increase in absolute dollars as we improve and expand our technical operations infrastructure, including our data centers and computing infrastructure operated by third parties.
Costs of Professional Services
GAAP operating expenses in costs of professional services were $704 million for fiscal 2023, compared to $632 million for fiscal 2022, an increase of $71 million, or 11%. The increase in costs of professional services included an increase of $48 million in employee-related expenses, including share-based compensation, primarily due to higher headcount.
Non-GAAP operating expenses in costs of professional services were $587 million for fiscal 2023, compared to $508 million for fiscal 2022, an increase of $79 million, or 16%. The increase in costs of professional services included an increase of $56 million in employee-related expenses primarily due to higher headcount.
We expect GAAP and non-GAAP costs of professional services as a percentage of total revenues to continue to decline as we continue to rely on our service partners to deploy our applications and as the number of our customers continues to grow.
Product Development
GAAP operating expenses in product development were $2.3 billion for fiscal 2023, compared to $1.9 billion for fiscal 2022, an increase of $391 million, or 21%. The increase in product development expenses included increases of $346 million in employee-related expenses, including share-based compensation, primarily due to higher headcount and $32 million in facilities and IT-related expenses.
Non-GAAP operating expenses in product development were $1.6 billion for fiscal 2023, compared to $1.3 billion for fiscal 2022, an increase of $325 million, or 25%. The increase in product development expenses included increases of $279 million in employee-related expenses primarily due to higher headcount, of which $62 million was related to the new performance-based cash bonus program, and $32 million in facilities and IT-related expenses.
We expect GAAP and non-GAAP product development expenses will continue to increase in absolute dollars as we improve and extend our applications and develop new technologies.
Sales and Marketing
GAAP operating expenses in sales and marketing were $1.8 billion for fiscal 2023, compared to $1.5 billion for fiscal 2022, an increase of $386 million, or 26%. The increase in sales and marketing expenses included increases of $255 million in employee-related expenses, including share-based compensation, primarily due to higher headcount and $48 million related to marketing programs and $33 million in travel expenses partly driven by a return to in-person events.
Non-GAAP operating expenses in sales and marketing were $1.6 billion for fiscal 2023, compared to $1.2 billion for fiscal 2022, an increase of $358 million, or 30%. The increase in sales and marketing expenses included increases of $227 million in employee-related expenses primarily due to higher headcount and $48 million related to marketing programs and $33 million in travel expenses partly driven by a return to in-person events.
We expect GAAP and non-GAAP sales and marketing expenses to increase in absolute dollars as we continue to invest in our domestic and international selling and marketing activities to expand brand awareness and attract new customers.
General and Administrative
GAAP operating expenses in general and administrative were $604 million for fiscal 2023, compared to $486 million for fiscal 2022, an increase of $118 million, or 24%. The increase in general and administrative expenses included an increase of $96 million in employee-related expenses, including share-based compensation, primarily due to higher headcount.
Non-GAAP operating expenses in general and administrative were $389 million for fiscal 2023, compared to $324 million for fiscal 2022, an increase of $65 million, or 20%. The increase in general and administrative expenses included an increase of $43 million in employee-related expenses primarily due to higher headcount.
We expect GAAP and non-GAAP general and administrative expenses will continue to increase in absolute dollars as we further invest in our infrastructure and support our global expansion.
Operating Margin
GAAP operating margin declined from (2.3)% for fiscal 2022 to (3.6)% for fiscal 2023, primarily related to increases in expenses due to higher headcount, a return to travel and in-person events, the workforce realignment, the rollout of the performance-based cash bonus program, an acceleration of share-based compensation expense caused by modifying the vesting dates of all unvested RSUs from the 15th to the 5th of each month, and other growth investments made across the business. These increases were offset in part by higher revenues.
Non-GAAP operating margin declined from 22.4% for fiscal 2022 to 19.5% for fiscal 2023, primarily related to increases in expenses due to higher headcount, the rollout of the performance-based cash bonus program, a return to travel and in-person events, the workforce realignment, and other growth investments made across the business, offset in part by higher revenues. Non-GAAP operating margin was calculated using GAAP revenues and non-GAAP operating expenses. See “Non-GAAP Financial Measures” below for further information.
Reconciliations of our GAAP to non-GAAP operating income (loss) and operating margin were as follows (in thousands, except percentages):
| Year Ended January 31, 2023 | |||||||||||||||||||||||
| GAAP | Share-Based Compensation Expenses | Other Operating Expenses | Non-GAAP (1) | ||||||||||||||||||||
| Operating income (loss) | $ | (222,200) | $ | 1,294,622 | $ | 137,214 | $ | 1,209,636 | |||||||||||||||
| Operating margin | (3.6) | % | 20.8 | % | 2.3 | % | 19.5 | % |
| Year Ended January 31, 2022 | |||||||||||||||||||||||
| GAAP | Share-Based Compensation Expenses | Other Operating Expenses | Non-GAAP (1) | ||||||||||||||||||||
| Operating income (loss) | $ | (116,450) | $ | 1,112,405 | $ | 153,749 | $ | 1,149,704 | |||||||||||||||
| Operating margin | (2.3) | % | 21.6 | % | 3.1 | % | 22.4 | % |
| Year Ended January 31, 2021 | |||||||||||||||||||||||
| GAAP | Share-Based Compensation Expenses | Other Operating Expenses | Non-GAAP (1) | ||||||||||||||||||||
| Operating income (loss) | $ | (248,599) | $ | 1,004,854 | $ | 110,986 | $ | 867,241 | |||||||||||||||
| Operating margin | (5.8) | % | 23.3 | % | 2.6 | % | 20.1 | % |
(1)See “Non-GAAP Financial Measures” below for further information.
Other Income (Expense), Net
We had other income (expense), net of $(38) million, $133 million, and $(27) million during fiscal 2023, 2022, and 2021, respectively.
Other expense, net in fiscal 2023 was primarily due to interest expense of $102 million on our debt primarily related to the Senior Notes and losses of $27 million on our equity investments. Expenses were offset by interest income of $98 million on our marketable securities from higher investment balances and rising interest rates.
Other income, net in fiscal 2022 was primarily due to gains of $144 million on our equity investments, the majority of which related to an equity investment that completed its IPO during the period, offset by interest expense of $17 million on our debt.
Non-GAAP Financial Measures
Regulation S-K Item 10(e), “Use of non-GAAP financial measures in Commission filings,” defines and prescribes the conditions for use of non-GAAP financial information. Our measures of non-GAAP operating expenses, non-GAAP operating income (loss), and non-GAAP operating margin meet the definition of non-GAAP financial measures.
Non-GAAP Operating Expenses, Non-GAAP Operating Income (Loss), and Non-GAAP Operating Margin
We use the non-GAAP financial measures of non-GAAP operating expenses, non-GAAP operating income (loss), and non-GAAP operating margin to understand and compare operating results across accounting periods, for internal budgeting and forecasting purposes, for short- and long-term operating plans, and to evaluate our financial performance. We believe that these non-GAAP measures reflect our ongoing business in a manner that allows for meaningful period-to-period comparisons and analysis of trends in our business.
Our non-GAAP operating expenses, non-GAAP operating income (loss), and non-GAAP operating margin exclude the components listed below. For the reasons set forth below, we believe that excluding these components provides useful information to investors and others in understanding and evaluating our operating results and prospects in the same manner as management, in comparing financial results across accounting periods and to those of peer companies, and to better understand the long-term performance of our core business.
-
Share-Based Compensation Expenses. Although share-based compensation is an important aspect of the compensation of our employees and executives, we believe it is useful to exclude share-based compensation expenses to better understand the long-term performance of our core business and to facilitate comparison of our results to those of peer companies. Share-based compensation expenses are determined using a number of factors, including our stock price, volatility, and forfeiture rates that are beyond our control and generally unrelated to operational decisions and performance in any particular period. Further, share-based compensation expenses are not reflective of the value ultimately received by the grant recipients.
-
Other Operating Expenses. Other operating expenses includes employer payroll tax-related items on employee stock transactions and amortization of acquisition-related intangible assets. The amount of employer payroll tax-related items on employee stock transactions is dependent on our stock price and other factors that are beyond our control and do not correlate to the operation of the business. For business combinations, we generally allocate a portion of the purchase price to intangible assets. The amount of the allocation is based on estimates and assumptions made by management and is subject to amortization. The amount of purchase price allocated to intangible assets and the term of its related amortization can vary significantly and are unique to each acquisition and thus we do not believe it is reflective of ongoing operations. Although we exclude the amortization of acquisition-related intangible assets from these non-GAAP measures, we believe that it is important for investors to understand that such intangible assets were recorded as part of purchase accounting and contribute to revenue generation.
Limitations on the Use of Non-GAAP Financial Measures
A limitation of our non-GAAP financial measures of non-GAAP operating expenses, non-GAAP operating income (loss), and non-GAAP operating margin is that they do not have uniform definitions. Our definitions will likely differ from the definitions used by other companies, including peer companies, and therefore comparability may be limited. Further, the non-GAAP financial measure of non-GAAP operating expenses has certain limitations because it does not reflect all items of expense that affect our operations and are reflected in the GAAP financial measure of total operating expenses. In the case of share-based compensation, if we did not pay out a portion of compensation in the form of share-based compensation and related employer payroll tax-related items, the cash salary expense included in operating expenses would be higher, which would affect our cash position.
We compensate for these limitations by reconciling the non-GAAP financial measures to the most comparable GAAP financial measures. These non-GAAP financial measures should be considered in addition to, not as a substitute for or in isolation from, measures prepared in accordance with GAAP. We encourage investors and others to review our financial information in its entirety, not to rely on any single financial measure, and to view our non-GAAP financial measures in conjunction with the most comparable GAAP financial measures.
See “Results of Operations—Operating Expenses” and “Results of Operations—Operating Margin” for reconciliations from the most directly comparable GAAP financial measures of GAAP operating expenses, GAAP operating income (loss), and GAAP operating margin, to the non-GAAP financial measures of non-GAAP operating expenses, non-GAAP operating income (loss), and non-GAAP operating margin, for fiscal 2023, 2022, and 2021.
Liquidity and Capital Resources
As of January 31, 2023, our principal sources of liquidity were cash, cash equivalents, and marketable securities totaling $6.1 billion, which were primarily held for working capital purposes. Our cash equivalents and marketable securities are composed of, in order from largest to smallest, U.S. treasury securities, commercial paper, corporate bonds, U.S. agency obligations, money market funds, and marketable equity investments. We have financed our operations primarily through customer payments, issuance of debt, and sales of our common stock.
We believe our existing cash, cash equivalents, marketable securities, cash provided by operating activities, unbilled amounts related to the remaining term of contracted noncancelable subscription agreements, which are not reflected on the Consolidated Balance Sheets, and, if necessary, our borrowing capacity under our 2022 Credit Agreement that provides for $1.0 billion of unsecured financing, are sufficient to meet our working capital, capital expenditure, and debt repayment needs over the next 12 months.
Our long-term future capital requirements depend on many factors, including the effects of macroeconomic trends, customer growth rates, subscription renewal activity, headcount growth, the timing and extent of development efforts, the expansion of sales and marketing activities, the introduction of new and enhanced services offerings, the timing and costs associated with the construction or acquisition of additional facilities, and our investment and acquisition activities. As part of our strategy, we may choose to seek additional debt or equity financing.
Our cash flows fiscal 2023, 2022, and 2021 were as follows (in thousands):
| Year Ended January 31, | |||||||||||||||||
| 2023 | 2022 | 2021 | |||||||||||||||
| Net cash provided by (used in): | |||||||||||||||||
| Operating activities | $ | 1,657,195 | $ | 1,650,704 | $ | 1,268,441 | |||||||||||
| Investing activities | (2,505,926) | (1,607,426) | (1,241,624) | ||||||||||||||
| Financing activities | 1,203,821 | 110,251 | 625,049 | ||||||||||||||
| Effect of exchange rate changes | (595) | (705) | 1,334 | ||||||||||||||
| Net increase (decrease) in cash, cash equivalents, and restricted cash | $ | 354,495 | $ | 152,824 | $ | 653,200 |
Operating Activities
Cash provided by operating activities was $1.7 billion for both fiscal 2023 and 2022. In fiscal 2023, increased sales and related cash collections were offset by cash outlays related to higher headcount, return to travel and in-person events, a one-time intellectual property transfer tax payment, an interest payment on our Senior Notes, and other growth investments across the business.
We expect our business to continue to generate sufficient operating cash flows; however, if the economic uncertainty caused by recent macroeconomic events worsens or is prolonged, our customers may request payment timing concessions, which could materially impact the timing and predictability of our operating cash flows in any given period.
Investing Activities
Cash used in investing activities for fiscal 2023 was $2.5 billion, which primarily resulted from purchases of marketable securities, net of maturities, of $2.2 billion using the proceeds from the Senior Notes offering, capital expenditures for data center and office space projects of $360 million, and purchases of non-marketable equity and other investments of $23 million. These payments were partially offset by proceeds of $116 million from sales of marketable and non-marketable securities.
Cash used in investing activities for fiscal 2022 was $1.6 billion, which was primarily related to cash consideration for the acquisitions of VNDLY, Zimit, and Peakon, net of cash acquired, of $1.2 billion. Cash used in investing activities also included capital expenditures of $264 million mainly for data center projects, the purchase of leased office space within our corporate headquarters from an affiliate of our Co-Founder and CEO Emeritus, David Duffield, of $171 million, purchases of non-marketable equity and other investments of $123 million, and a cash outflow from the timing of purchases and maturities of marketable securities of $55 million. These payments were partially offset by proceeds of $199 million from sales of marketable securities.
We expect capital expenditures will be approximately $340 million in fiscal 2024. This includes investments in our office facilities, corporate IT infrastructure, and customer data centers to support our continued growth.
Financing Activities
For fiscal 2023, cash provided by financing activities was $1.2 billion, which was primarily due to proceeds of $3.0 billion from borrowings on the Senior Notes, net of debt discount of $22 million, and $152 million from the issuance of common stock from employee equity plans, offset by the principal payment of $1.15 billion in connection with the conversion of our 0.25% convertible senior notes (“2022 Notes”), repayment of the term loan under the credit agreement entered into in April 2020 (“2020 Credit Agreement”) of $694 million, and repurchases of common stock under the Share Repurchase Program of $75 million.
For fiscal 2022, cash provided by financing activities was $110 million, which was primarily due to proceeds of $148 million from the issuance of common stock from employee equity plans, offset by payments of $38 million on the term loan under the 2020 Credit Agreement.
Share Repurchase Program
In November 2022, our Board of Directors authorized the repurchase of up to $500 million of our outstanding shares of Class A common stock. The Share Repurchase Program will have a term of 18 months, may be suspended or discontinued at any time, and does not obligate us to acquire any amount of Class A common stock. During fiscal 2023, we repurchased approximately 0.5 million shares of Class A common stock for approximately $75 million at an average price per share of $165.75. All repurchases were made in open market transactions. As of January 31, 2023, we were authorized to purchase a remaining $425 million of our outstanding shares of Class A common stock under the Share Repurchase Program.
Contractual Obligations
Our contractual obligations primarily consist of borrowings under our Senior Notes, leases for office space and co-location facilities for data center capacity, agreements for third-party hosted infrastructure platforms for business operations, and other purchase obligations entered into in the ordinary course of business. The table below includes our material contractual obligations, excluding imputed interest, as of January 31, 2023 (in thousands). For further information, see the associated Notes to Consolidated Financial Statements included in Part II, Item 8 of this report referenced in the table below.
| Payments Due by Period | ||||||||||||||||||||||||||
| Total | Short-term | Long-term | Reference | |||||||||||||||||||||||
| Senior Notes (1) | $ | 3,752,375 | $ | 110,250 | $ | 3,642,125 | Note 11 | |||||||||||||||||||
| Operating leases | 300,821 | 97,387 | 203,434 | Note 12 | ||||||||||||||||||||||
| Third-party hosted infrastructure platform obligations | 547,626 | 40,000 | 507,626 | Note 13 | ||||||||||||||||||||||
| Other purchase obligations | 372,273 | 115,386 | 256,887 | Note 13 | ||||||||||||||||||||||
| $ | 4,973,095 | $ | 363,023 | $ | 4,610,072 |
(1)Consists of principal and interest payments on the Senior Notes.
Critical Accounting Policies and Estimates
Our consolidated financial statements are prepared in accordance with GAAP. The preparation of these consolidated financial statements requires us to make estimates, judgements, and assumptions that affect the reported amounts of assets, liabilities, revenues, costs and expenses, and related disclosures. On an ongoing basis, we evaluate our estimates, judgements, and assumptions. Our actual results may differ from these estimates under different assumptions or conditions.
We believe that of our significant accounting policies, which are described in Note 2, Accounting Standards and Significant Accounting Policies, of the Notes to Consolidated Financial Statements included in Part II, Item 8 of this report, the following accounting policies and specific estimates involve a greater degree of judgment and complexity. Accordingly, these are the policies we believe are the most critical to aid in fully understanding and evaluating our consolidated financial condition and operating results.
Revenue Recognition
We derive our revenues from subscription services and professional services. Revenues are recognized when control of these services is transferred to our customers, in an amount that reflects the consideration we expect to be entitled to receive in exchange for services rendered.
We determine revenue recognition through the following steps:
-
Identification of the contract, or contracts, with a customer;
-
Identification of the performance obligations in the contract;
-
Determination of the transaction price;
-
Allocation of the transaction price to the performance obligations in the contract; and
-
Recognition of revenues when, or as, we satisfy a performance obligation.
We believe the area we apply the most critical judgement when determining revenue recognition relates to the identification of distinct performance obligations.
Identification of Performance Obligations
A performance obligation is a promise in a contract with a customer to transfer products or services that are distinct. Our contracts with customers may include multiple promises to transfer services to a customer. Determining whether products and services are distinct performance obligations that should be accounted for separately or combined as a single performance obligation may require significant judgment that requires us to assess the nature of the promise and the value delivered to the customer.
Our primary performance obligations consist of subscription services and professional services. We satisfy these performance obligations over time as we transfer the promised services to our customers. Subscription services are made up of a daily requirement to deliver the service to the customer. Each day the delivery of the service provides value to the customer and each day represents a measure toward completion of the service. As such, subscription services meet the criteria to be a series of distinct services. In determining whether professional services are distinct, we consider the following factors for each professional services agreement: availability of the services from other vendors, the nature of the professional services, the timing of when the professional services contract was signed in comparison to the subscription start date, and the contractual dependence of the service on the customer’s satisfaction with the professional services work. To date, we have concluded that professional services included in contracts with multiple performance obligations are generally distinct as the professional services are not interrelated with subscription services nor do they result in significant customization of the subscription service. As such, we view professional services as a performance obligation to the customer.
At contract inception, we evaluate whether two or more contracts should be combined and accounted for as a single contract and whether the combined or single contract includes more than one performance obligation. We combine contracts entered into at or near the same time with the same customer if we determine that the contracts are negotiated as a package with a single commercial objective; the amount of consideration to be paid in one contract depends on the price or performance of the other contract; or the services promised in the contracts are a single performance obligation. For contracts that contain multiple performance obligations, we assess each promise separately and allocate the transaction price on a relative standalone selling price (“SSP”) basis. We apply significant judgment in identifying and evaluating any terms and conditions in contracts which may impact revenue recognition.
Deferred Commissions
Sales commissions earned by our sales force are considered incremental and recoverable costs of obtaining a contract with a customer. Sales commissions for new revenue contracts are capitalized and then amortized on a straight-line basis over a period of benefit that we have determined to be five years. We determined the period of benefit by taking into consideration our customer contracts, our technology, and other factors.
Periodically, we review whether events or changes in circumstances have occurred that could impact the period of benefit. Any future changes in circumstances around the terms of our initial and renewal contracts, customer attrition, underlying technology life, and certain other factors may materially change the period of benefit and therefore the amortization amounts recognized on the Consolidated Statements of Operations. There was no change to the period of benefit during the periods presented.
Business Combinations, Goodwill, and Acquisition-Related Intangible Assets
We allocate the purchase consideration of acquired companies to tangible and intangible assets acquired and liabilities assumed based on their estimated fair values at the acquisition date, with the excess recorded to goodwill. The purchase price allocation process requires us to make significant estimates and assumptions related to the fair value of identifiable intangible assets, deferred tax asset valuation allowances, liabilities related to uncertain tax positions, and contingencies. Critical estimates used in valuing certain intangible assets include, but are not limited to, future expected cash flows from acquired customer contracts, expected life cycle and innovation timelines for acquired technologies, forecasted customer attrition rates and revenue growth, the fair value of pre-existing relationships, royalty rates for comparable market technologies, and discount rates. The amounts and estimated useful lives assigned to acquisition-related intangible assets impact the amount and timing of future amortization expense.
We test goodwill and acquisition-related intangible assets for impairment on an annual basis, or more frequently if a significant event or circumstance indicates impairment, by considering qualitative and quantitative factors. Significant qualitative inputs used in our impairment tests include, but are not limited to, consideration of general macroeconomic conditions, industry market conditions, overall Workday financial performance, and growth or declines in Workday’s share price. The primary quantitative input for our impairment test is Workday’s market capitalization as of the date of the analysis. We also evaluate the estimated remaining useful lives of acquisition-related intangible assets for changes in circumstances that warrant a revision to the remaining periods of amortization at least annually, or more frequently if significant events or circumstances indicate a change in expected use.
Non-Marketable Equity Investments
Non-marketable equity investments include investments in privately held companies without readily determinable fair values in which we do not own a controlling interest or exercise significant influence. We adjust the carrying values of non-marketable equity investments based on both observable and unobservable inputs or data in an inactive market. Valuations of non-marketable equity investments are inherently complex due to the lack of readily available market data, and require our judgment due to the absence of market prices and an inherent lack of liquidity. In addition, the rights and preferences related to the particular non-marketable equity investments, as compared to the rights and preferences of other securities within the company’s capital structure, may impact the magnitude of change in the fair value of our investment as compared to the change in total enterprise value of the company.
We assess our non-marketable equity investments quarterly for impairment. Our impairment analysis encompasses a qualitative and quantitative analysis of key factors including the investee’s financial metrics, such as growth or decline in revenues and operating expenses, market acceptance of the investee’s product or technology, other competitive products or technology in the market, general market conditions, and the rate at which the investee is using its cash. These factors require significant judgment. If impairment indicators are identified, we will assess the severity and duration of the impairment.
Change in Accounting Estimate
In February 2023, we completed an assessment of the useful lives of our data center equipment, including servers, network equipment, and integrated complete server and network racks. Due to advances in technology, as well as investments in software that increased efficiencies in how we operate our data center equipment, we determined we should increase the estimated useful lives of data center equipment from 3 years to 5 years. This change in accounting estimate will be effective beginning fiscal 2024. Based on the carrying amount of data center equipment that were in-service as of January 31, 2023, it is estimated this change will decrease our fiscal 2024 depreciation expense by approximately $93 million. Inclusive of our forecasted capital expenditures in fiscal 2024, it is estimated the change will decrease fiscal 2024 depreciation expense by an additional $7 million, or approximately $100 million in total.
Recent Accounting Pronouncements
See Note 2, Accounting Standards and Significant Accounting Policies, of the Notes to Consolidated Financial Statements included in Part II, Item 8 of this report for a full description of recent accounting pronouncements.
Item 7A. QUANTITATIVE AND QUALITATIVE DISCLOSURES ABOUT MARKET RISK
Recent macroeconomic events have resulted in negative impacts on global economies and financial markets, which may increase our foreign currency exchange risk and interest rate risk. For further discussion of the potential impacts of these events on our business, financial condition, and operating results, see “Risk Factors” included in Part I, Item 1A of this report.
Foreign Currency Exchange Risk
We transact business globally in multiple currencies. As a result, our operating results and cash flows are subject to fluctuations due to changes in foreign currency exchange rates. As of January 31, 2023, our most significant currency exposures were the euro, British pound, Canadian dollar, and Australian dollar.
Due to our exposure to market risks that may result from changes in foreign currency exchange rates, we enter into foreign currency derivative hedging transactions to mitigate these risks. For further information, see Note 10, Derivative Instruments, of the Notes to Consolidated Financial Statements included in Part II, Item 8 of this report.
Interest Rate Risk on our Investments
We had cash, cash equivalents, and marketable securities totaling $6.1 billion and $3.6 billion as of January 31, 2023, and 2022, respectively. Cash equivalents and marketable securities were invested primarily in U.S. treasury securities, U.S. agency obligations, corporate bonds, commercial paper, money market funds, and marketable equity investments. The cash, cash equivalents, and marketable securities are held primarily for working capital purposes. Our investment portfolios are managed to preserve capital and meet liquidity needs. We do not enter into investments for trading or speculative purposes.
Our cash equivalents and our portfolio of debt securities are subject to market risk due to changes in interest rates. Fixed rate securities may have their market value adversely affected due to a rise in interest rates, while floating rate securities may produce less income than expected if interest rates fall. Due in part to these factors, our future investment income may fluctuate due to changes in interest rates or we may suffer losses in principal if we sell securities that decline in market value due to changes in interest rates. Further, since our debt securities are classified as “available-for-sale,” if the fair value of the security declines below its amortized cost basis, then any portion of that decline attributable to credit losses, to the extent expected to be nonrecoverable before the sale of the impaired security, is recognized on the Consolidated Statements of Operations.
An immediate increase of 100 basis points in interest rates would have resulted in a $29 million and $11 million market value reduction in our investment portfolio as of January 31, 2023, and 2022, respectively. This estimate is based on a sensitivity model that measures market value changes when changes in interest rates occur.
Interest Rate Risk on our Debt
The Senior Notes have fixed annual interest rates, and therefore we do not have economic interest rate exposure on these debt obligations. However, the fair values of the Senior Notes are exposed to interest rate risk. Generally, the fair values of the Senior Notes will increase as interest rates fall and decrease as interest rates rise.
Borrowings under our 2022 Credit Agreement will bear interest, at our option, at a base rate plus a margin of 0.000% to 0.500% or a secured overnight financing rate (“SOFR”) plus 10 basis points, plus a margin of 0.750% to 1.500%, with such margin being determined based on our consolidated leverage ratio or debt rating. Because the interest rates applicable to borrowings under the 2022 Credit Agreement are variable, we are exposed to market risk from changes in the underlying index rates, which affect our cost of borrowing.
For further information, see Note 11, Debt, of the Notes to Consolidated Financial Statements included in Part II, Item 8 of this report.
Item 8. FINANCIAL STATEMENTS AND SUPPLEMENTARY DATA
WORKDAY, INC.
INDEX TO CONSOLIDATED FINANCIAL STATEMENTS
Report of Independent Registered Public Accounting Firm
To the Stockholders and the Board of Directors of Workday, Inc.
Opinion on the Financial Statements
We have audited the accompanying consolidated balance sheets of Workday, Inc. (the Company) as of January 31, 2023 and 2022, the related consolidated statements of operations, comprehensive income (loss), stockholders’ equity and cash flows for each of the three years in the period ended January 31, 2023, and the related notes (collectively referred to as the “consolidated financial statements”). In our opinion, the consolidated financial statements present fairly, in all material respects, the financial position of the Company at January 31, 2023 and 2022, and the results of its operations and its cash flows for each of the three years in the period ended January 31, 2023, in conformity with U.S. generally accepted accounting principles.
We also have audited, in accordance with the standards of the Public Company Accounting Oversight Board (United States) (PCAOB), the Company’s internal control over financial reporting as of January 31, 2023, based on criteria established in Internal Control-Integrated Framework issued by the Committee of Sponsoring Organizations of the Treadway Commission (2013 framework) and our report dated February 27, 2023 expressed an unqualified opinion thereon.
Basis for Opinion
These financial statements are the responsibility of the Company’s management. Our responsibility is to express an opinion on the Company’s financial statements based on our audits. We are a public accounting firm registered with the PCAOB and are required to be independent with respect to the Company in accordance with the U.S. federal securities laws and the applicable rules and regulations of the Securities and Exchange Commission and the PCAOB.
We conducted our audits in accordance with the standards of the PCAOB. Those standards require that we plan and perform the audit to obtain reasonable assurance about whether the financial statements are free of material misstatement, whether due to error or fraud. Our audits included performing procedures to assess the risks of material misstatement of the financial statements, whether due to error or fraud, and performing procedures that respond to those risks. Such procedures included examining, on a test basis, evidence regarding the amounts and disclosures in the financial statements. Our audits also included evaluating the accounting principles used and significant estimates made by management, as well as evaluating the overall presentation of the financial statements. We believe that our audits provide a reasonable basis for our opinion.
Critical Audit Matter
The critical audit matter communicated below is a matter arising from the current period audit of the financial statements that was communicated or required to be communicated to the audit committee and that: (1) relates to accounts or disclosures that are material to the financial statements and (2) involved our especially challenging, subjective or complex judgments. The communication of the critical audit matter does not alter in any way our opinion on the consolidated financial statements, taken as a whole, and we are not, by communicating the critical audit matter below, providing a separate opinion on the critical audit matter or on the account or disclosure to which it relates.
| Revenue Recognition | |||||
| Description of the Matter | As described in Note 2 to the consolidated financial statements, the Company recognizes revenue primarily from subscription services and professional services contracts. Some of the Company’s contracts contain multiple performance obligations. For these contracts, the Company assesses the performance obligations and accounts for those obligations separately if they are distinct. In such cases, the transaction price is allocated to the distinct performance obligations on a relative standalone selling price basis. Auditing the Company’s determination of distinct performance obligations was challenging. For example, there were nonstandard terms and conditions that required judgment to determine whether the distinct performance obligations were identified and accounted for appropriately. | ||||
| How We Addressed the Matter in Our Audit | We obtained an understanding, evaluated the design and tested the operating effectiveness of controls over the Company’s process to identify distinct performance obligations. Among other audit procedures, we selected a sample of contracts and evaluated whether management appropriately identified and considered the terms and conditions and the appropriate revenue recognition. As part of our procedures, we evaluated the assessment of distinct performance obligations. |
/s/ Ernst & Young LLP
We have served as the Company’s auditor since 2008.
San Francisco, California
February 27, 2023
Report of Independent Registered Public Accounting Firm
To the Stockholders and the Board of Directors of Workday, Inc.
Opinion on Internal Control Over Financial Reporting
We have audited Workday, Inc.’s internal control over financial reporting as of January 31, 2023, based on criteria established in Internal Control-Integrated Framework issued by the Committee of Sponsoring Organizations of the Treadway Commission (2013 framework) (the COSO criteria). In our opinion, Workday, Inc. (the Company) maintained, in all material respects, effective internal control over financial reporting as of January 31, 2023, based on the COSO criteria.
We also have audited, in accordance with the standards of the Public Company Accounting Oversight Board (United States) (PCAOB), the consolidated balance sheets of the Company as of January 31, 2023 and 2022, the related consolidated statements of operations, comprehensive income (loss), stockholders’ equity and cash flows for each of the three years in the period ended January 31, 2023, and the related notes and our report dated February 27, 2023 expressed an unqualified opinion thereon.
Basis for Opinion
The Company’s management is responsible for maintaining effective internal control over financial reporting and for it
Showing the first 8K of 157K characters. Open the full section
Item 9. CHANGES IN AND DISAGREEMENTS WITH ACCOUNTANTS ON ACCOUNTING AND FINANCIAL DISCLOSURE
None.
Item 9A. CONTROLS AND PROCEDURES
(a) Evaluation of Disclosure Controls and Procedures
Under the supervision and with the participation of our management, including our principal executive officers and principal financial officer, we conducted an evaluation of the effectiveness of the design and operation of our disclosure controls and procedures, as defined in Rules 13a-15(e) and 15d-15(e) under the Exchange Act as of the end of the period covered by this report.
In designing and evaluating our disclosure controls and procedures, management recognizes that any disclosure controls and procedures, no matter how well designed and operated, can provide only reasonable assurance of achieving the desired control objectives. In addition, the design of disclosure controls and procedures must reflect the fact that there are resource constraints and that management is required to apply its judgment in evaluating the benefits of possible controls and procedures relative to their costs.
Based on management’s evaluation, our principal executive officers and principal financial officer concluded that our disclosure controls and procedures are designed to, and are effective to, provide assurance at a reasonable level that the information we are required to disclose in reports that we file or submit under the Exchange Act is recorded, processed, summarized, and reported within the time periods specified in SEC rules and forms, and that such information is accumulated and communicated to our management, including our principal executive officers and principal financial officer, as appropriate, to allow timely decisions regarding required disclosures.
(b) Management’s Report on Internal Control Over Financial Reporting
Our management is responsible for establishing and maintaining adequate internal control over financial reporting (as defined in Rule 13a-15(f) under the Exchange Act). Management conducted an assessment of the effectiveness of our internal control over financial reporting based on the criteria set forth in Internal Control—Integrated Framework issued by the Committee of Sponsoring Organizations of the Treadway Commission (2013 framework). Based on the assessment, management has concluded that its internal control over financial reporting was effective as of January 31, 2023, to provide reasonable assurance regarding the reliability of financial reporting and the preparation of financial statements in accordance with GAAP. Our independent registered public accounting firm, Ernst & Young LLP, has issued an audit report with respect to our internal control over financial reporting, which appears in Part II, Item 8, and is incorporated herein by reference.
(c) Changes in Internal Control Over Financial Reporting
Under the supervision and with the participation of our management, including our principal executive officers and principal financial officer, we conducted an evaluation of any changes in our internal control over financial reporting (as such term is defined in Rules 13a-15(f) and 15d-15(f) under the Exchange Act) that occurred during our most recently completed fiscal quarter. Based on that evaluation, our principal executive officers and principal financial officer concluded that there has not been any material change in our internal control over financial reporting during the fourth quarter of fiscal 2023 that materially affected, or is reasonably likely to materially affect, our internal control over financial reporting.
(d) Limitations on Effectiveness of Controls and Procedures and Internal Control over Financial Reporting
In designing and evaluating the disclosure controls and procedures and internal control over financial reporting, management recognizes that any controls and procedures, no matter how well designed and operated, can provide only reasonable assurance of achieving the desired control objectives. In addition, the design of disclosure controls and procedures and internal control over financial reporting must reflect the fact that there are resource constraints and that management is required to apply judgment in evaluating the benefits of possible controls and procedures relative to their costs.
See Management’s Report on Internal Control over Financial Reporting above and the Report of Independent Registered Public Accounting Firm on our internal control over financial reporting in Item 8, which are incorporated herein by reference.
Item 9B. OTHER INFORMATION
Item 9C. DISCLOSURE REGARDING FOREIGN JURISDICTIONS THAT PREVENT INSPECTIONS
Item 10. DIRECTORS, EXECUTIVE OFFICERS, AND CORPORATE GOVERNANCE
The information concerning our directors, our Audit Committee, and any changes to the process by which stockholders may recommend nominees to the Board of Directors required by this Item are incorporated herein by reference to information contained in the Proxy Statement, including “Proposal No. 1: Election of Directors” and “Directors and Corporate Governance.”
The information concerning our executive officers required by this Item is incorporated herein by reference to information contained in the Proxy Statement including “Executive Officers and Other Executive Management.”
With regard to the information required by this Item regarding compliance with Section 16(a) of the Exchange Act, we will provide disclosure of delinquent Section 16(a) reports, if any, in our Proxy Statement, and such disclosure, if any, is incorporated herein by reference.
We have adopted a code of ethics, our Code of Conduct, which applies to all employees, including our principal executive officers, our principal financial officer, and all other executive officers. The Code of Conduct is available on our website at www.workday.com/codeofconduct. A copy may also be obtained without charge by contacting Investor Relations, Workday, Inc., 6110 Stoneridge Mall Road, Pleasanton, California 94588 or by emailing ir@workday.com.
We plan to post on our website at the address described above any future amendments or waivers of our Code of Conduct.
Item 11. EXECUTIVE COMPENSATION
The information required by this Item is incorporated herein by reference to information contained in the Proxy Statement, including “Directors and Corporate Governance” and “Executive Compensation.”
Item 12. SECURITY OWNERSHIP OF CERTAIN BENEFICIAL OWNERS AND MANAGEMENT AND RELATED STOCKHOLDER MATTERS
The information required by this Item is incorporated herein by reference to information contained in the Proxy Statement, including “Equity Compensation Plan Information” and “Security Ownership of Certain Beneficial Owners and Management.”
Item 13. CERTAIN RELATIONSHIPS AND RELATED TRANSACTIONS, AND DIRECTOR INDEPENDENCE
The information required by this Item is incorporated herein by reference to information contained in the Proxy Statement, including “Directors and Corporate Governance,” “Related Party Transactions,” and “Employment Arrangements and Indemnification Agreements.”
Item 14. PRINCIPAL ACCOUNTANT FEES AND SERVICES
Item 15. EXHIBITS AND FINANCIAL STATEMENT SCHEDULES
1. Consolidated Financial Statements
See Index to Consolidated Financial Statements at Item 8 herein.
2. Financial Statement Schedules
All schedules have been omitted because they are not required, not applicable, or not present in amounts sufficient to require submission of the schedule.
3. Exhibits
| 31.3 | Certification of Periodic Report by Principal Financial Officer under Section 302 of the Sarbanes-Oxley Act of 2002 | X | ||||||||||||||||||||||||||||||||||||
| 32.1* | Certification of Chief Executive Officer pursuant to 18 U.S.C. Section 1350, as adopted pursuant to Section 906 of the Sarbanes-Oxley Act of 2002 | X | ||||||||||||||||||||||||||||||||||||
| 32.2* | Certification of Chief Executive Officer pursuant to 18 U.S.C. Section 1350, as adopted pursuant to Section 906 of the Sarbanes-Oxley Act of 2002 | X | ||||||||||||||||||||||||||||||||||||
| 32.3* | Certification of Chief Financial Officer Pursuant to 18 U.S.C. Section 1350, as adopted pursuant to Section 906 of the Sarbanes-Oxley Act of 2002 | X | ||||||||||||||||||||||||||||||||||||
| 101.INS | XBRL Instance Document - Instance document does not appear in the Interactive Data File because its XBRL tags are embedded within the Inline XBRL document | X | ||||||||||||||||||||||||||||||||||||
| 101.SCH | Inline XBRL Taxonomy Extension Schema Document | X | ||||||||||||||||||||||||||||||||||||
| 101.CAL | Inline XBRL Taxonomy Extension Calculation Linkbase Document | X | ||||||||||||||||||||||||||||||||||||
| 101.DEF | Inline XBRL Taxonomy Extension Definition Linkbase Document | X | ||||||||||||||||||||||||||||||||||||
| 101.LAB | Inline XBRL Taxonomy Extension Label Linkbase Document | X | ||||||||||||||||||||||||||||||||||||
| 101.PRE | Inline XBRL Taxonomy Extension Presentation Linkbase Document | X | ||||||||||||||||||||||||||||||||||||
| 104 | Cover Page Interactive Data File (formatted as Inline XBRL and contained in Exhibit 101) | X |
| † | Indicates a management contract or compensatory plan. | |||||||
| * | These exhibits are furnished with this Annual Report on Form 10-K and are not deemed filed with the SEC and are not incorporated by reference in any filing of Workday, Inc. under the Securities Act or the Exchange Act, whether made before or after the date hereof and irrespective of any general incorporation language in such filings. |
Item 16. FORM 10-K SUMMARY
Not applicable.
SIGNATURES
Pursuant to the requirements of Section 13 or 15(d) of the Securities Exchange Act of 1934, the Registrant has duly caused this Annual Report on Form 10-K to be signed on its behalf by the undersigned, thereunto duly authorized, in the City of Pleasanton, State of California, on this 27th day of February, 2023.
| WORKDAY, INC. | |||||
| /s/ Barbara Larson | |||||
| Barbara Larson Chief Financial Officer (Principal Financial and Accounting Officer) |
POWER OF ATTORNEY
KNOW ALL PERSONS BY THESE PRESENTS, that each person whose signature appears below constitutes and appoints Barbara Larson or Richard H. Sauer, or any of them, his or her attorneys-in-fact, for such person in any and all capacities, to sign any amendments to this report and to file the same, with exhibits thereto, and other documents in connection therewith, with the Securities and Exchange Commission, hereby ratifying and confirming all that either of said attorneys-in-fact, or substitute or substitutes, may do or cause to be done by virtue hereof.
Pursuant to the requirements of the Securities Exchange Act of 1934, this report has been signed below by the following persons on behalf of the Registrant and in the capacities and on the dates indicated.
| Signature | Title | Date | ||||||||||||
| /s/ Aneel Bhusri | Co-Chief Executive Officer | February 27, 2023 | ||||||||||||
| Aneel Bhusri | (Principal Executive Officer) | |||||||||||||
| /s/ Carl M. Eschenbach | Co-Chief Executive Officer | February 27, 2023 | ||||||||||||
| Carl M. Eschenbach | (Principal Executive Officer) | |||||||||||||
| /s/ Barbara Larson | Chief Financial Officer | February 27, 2023 | ||||||||||||
| Barbara Larson | (Principal Financial and Accounting Officer) | |||||||||||||
| /s/ Thomas F. Bogan | Director | February 27, 2023 | ||||||||||||
| Thomas F. Bogan | ||||||||||||||
| /s/ Ann-Marie Campbell | Director | February 27, 2023 | ||||||||||||
| Ann-Marie Campbell | ||||||||||||||
| /s/ Christa Davies | Director | February 27, 2023 | ||||||||||||
| Christa Davies | ||||||||||||||
| /s/ Lynne M. Doughtie | Director | February 27, 2023 | ||||||||||||
| Lynne M. Doughtie | ||||||||||||||
| /s/ Wayne A.I. Frederick, M.D. | Director | February 27, 2023 | ||||||||||||
| Wayne A.I. Frederick, M.D. | ||||||||||||||
| Director | ||||||||||||||
| Mark J. Hawkins | ||||||||||||||
| /s/ Michael M. McNamara | Director | February 27, 2023 | ||||||||||||
| Michael M. McNamara | ||||||||||||||
| /s/ George J. Still, Jr. | Director | February 27, 2023 | ||||||||||||
| George J. Still, Jr. | ||||||||||||||
| /s/ Lee J. Styslinger III | Director | February 27, 2023 | ||||||||||||
| Lee J. Styslinger III | ||||||||||||||
| /s/ Jerry Yang | Director | February 27, 2023 | ||||||||||||
| Jerry Yang |