 filings.tools
Western Digital 10-K 2019-06-28
Filed 2019-08-27. 21 sections, 470K characters. Original on sec.gov · Markdown · JSON
Cover and table of contents
UNITED STATES
SECURITIES AND EXCHANGE COMMISSION
Washington, D.C. 20549
FORM 10-K
(Mark One)
| ☒ | ANNUAL REPORT PURSUANT TO SECTION 13 OR 15(d) OF THE SECURITIES EXCHANGE ACT OF 1934 |
For the fiscal year ended June 28, 2019
Or
| ☐ | TRANSITION REPORT PURSUANT TO SECTION 13 OR 15(d) OF THE SECURITIES EXCHANGE ACT OF 1934 |
For the transition period from to
Commission file number: 1-8703

WESTERN DIGITAL CORP****ORATION
(Exact Name of Registrant as Specified in Its Charter)
| Delaware | 33-0956711 | |||||
| (State or other jurisdiction of incorporation or organization) | (I.R.S. Employer Identification No.) | |||||
| 5601 Great Oaks Parkway | San Jose, | California | 95119 | |||
| (Address of principal executive offices) | (Zip Code) |
Registrant’s telephone number, including area code: (408) 717-6000
Securities registered pursuant to Section 12(b) of the Act:
| Title of each class | Trading symbol(s) | Name of each exchange on which registered |
| Common Stock, $.01 Par Value Per Share | WDC | The Nasdaq Stock Market LLC |
| (Nasdaq Global Select Market) |
Securities registered pursuant to Section 12(g) of the Act:
None
Indicate by check mark if the registrant is a well-known seasoned issuer, as defined in Rule 405 of the Securities Act. Yes ý No ¨
Indicate by check mark if the registrant is not required to file reports pursuant to Section 13 or Section 15(d) of the Act. Yes ¨ No ý
Indicate by check mark whether the registrant: (1) has filed all reports required to be filed by Section 13 or 15(d) of the Securities Exchange Act of 1934 during the preceding 12 months (or for such shorter period that the registrant was required to file such reports), and (2) has been subject to such filing requirements for the past 90 days. Yes ý No ¨
Indicate by check mark whether the registrant has submitted electronically every Interactive Data File required to be submitted pursuant to Rule 405 of Regulation S-T (§ 232.405 of this chapter) during the preceding 12 months (or for such shorter period that the registrant was required to submit such files). Yes ý No ¨
Indicate by check mark whether the registrant is a large accelerated filer, an accelerated filer, a non-accelerated filer, a smaller reporting company, or an emerging growth company. See the definitions of “large accelerated filer,” “accelerated filer,” “smaller reporting company,” and “emerging growth company” in Rule 12b-2 of the Exchange Act.
| Large accelerated filer | Accelerated filer | Non-accelerated filer | Smaller reporting company | Emerging growth company |
| ☒ | ☐ | ☐ | ☐ | ☐ |
If an emerging growth company, indicate by check mark if the registrant has elected not to use the extended transition period for complying with any new or revised financial accounting standards provided pursuant to Section 13(a) of the Exchange Act. ¨
Indicate by check mark whether the registrant is a shell company (as defined in Rule 12b-2 of the Act). Yes ☐ No ý
The aggregate market value of the registrant’s common stock held by non-affiliates of the registrant on December 28, 2018, the last business day of the registrant’s most recently completed second fiscal quarter, was $9.5 billion, based on the closing sale price as reported on the Nasdaq Global Select Market.
There were 296,003,875 shares of common stock, par value $0.01 per share, outstanding as of the close of business on August 14, 2019.
Documents Incorporated by Reference
Part III incorporates by reference certain information from the registrant’s definitive proxy statement (the “Proxy Statement”) for the 2019 Annual Meeting of Stockholders, which will be filed with the Securities and Exchange Commission within 120 days after the end of the 2019 fiscal year. Except with respect to information specifically incorporated by reference in this Form 10-K, the Proxy Statement is not deemed to be filed as part hereof.
WESTERN DIGITAL CORPORATION
INDEX
| PAGE NO. | ||
| PART I | ||
| Item 1. | Business | 4 |
| Item 1A. | Risk Factors | 12 |
| Item 1B. | Unresolved Staff Comments | 28 |
| Item 2. | Properties | 29 |
| Item 3. | Legal Proceedings | 30 |
| Item 4. | Mine Safety Disclosures | 30 |
| PART II | ||
| Item 5. | Market for Registrant’s Common Equity, Related Stockholder Matters and Issuer Purchases of Equity Securities | 31 |
| Item 6. | Selected Financial Data | 33 |
| Item 7. | Management’s Discussion and Analysis of Financial Conditions and Results of Operations | 34 |
| Item 7A. | Quantitative and Qualitative Disclosures About Market Risk | 45 |
| Item 8. | Financial Statements and Supplementary Data | 47 |
| Item 9. | Changes in and Disagreements With Accountants on Accounting and Financial Disclosure | 117 |
| Item 9A. | Controls and Procedures | 117 |
| Item 9B. | Other Information | 118 |
| PART III | ||
| Item 10. | Director, Executive Officers and Corporate Governance | 118 |
| Item 11. | Executive Compensation | 118 |
| Item 12. | Security Ownership of Certain Beneficial Owners and Management and Related Stockholder Matters | 118 |
| Item 13. | Certain Relationships and Related Transactions, and Director Independence | 118 |
| Item 14. | Principal Accounting Fees and Services | 118 |
| PART IV | ||
| Item 15. | Exhibits, Financial Statement Schedules | 119 |
| Item 16. | Form 10‑K Summary | 123 |
Unless otherwise indicated, references herein to specific years and quarters are to our fiscal years and fiscal quarters, and references to financial information are on a consolidated basis. As used herein, the terms “we,” “us,” “our,” the “Company,” “WDC” and “Western Digital” refer to Western Digital Corporation and its subsidiaries, unless we state, or the context indicates, otherwise.
WDC, a Delaware corporation, is the parent company of our data storage business. Our principal executive offices are located at 5601 Great Oaks Parkway, San Jose, California 95119. Our telephone number is (408) 717-6000.
Western Digital, the Western Digital logo, G-Technology, SanDisk and WD are registered trademarks or trademarks of Western Digital or its affiliates in the U.S. and/or other countries. All other trademarks, registered trademarks and/or service marks, indicated or otherwise, are the property of their respective owners.
FORWARD-LOOKING STATEMENTS
This document contains forward-looking statements within the meaning of the federal securities laws. Any statements that do not relate to historical or current facts or matters are forward-looking statements. You can identify some of the forward-looking statements by the use of forward-looking words, such as “may,” “will,” “could,” “would,” “project,” “believe,” “anticipate,” “expect,” “estimate,” “continue,” “potential,” “plan,” “forecast,” and the like, or the use of future tense. Statements concerning current conditions may also be forward-looking if they imply a continuation of current conditions. Examples of forward-looking statements include, but are not limited to, statements concerning:
| • | expectations regarding our Flash Ventures joint venture with Toshiba Memory Corporation, the flash industry and our flash wafer output plans; |
| • | our cost and expense reduction actions; |
| • | our quarterly cash dividend policy and share repurchase program; |
| • | expectations regarding our product development and technology plans; |
| • | expectations regarding our future results of operations; |
| • | expectations regarding the outcome of legal proceedings in which we are involved; |
| • | expectations regarding the repatriation of funds from our foreign operations; |
| • | our beliefs regarding tax benefits and the timing of future payments, if any, relating to the unrecognized tax benefits, and the adequacy of our tax provisions; |
| • | expectations regarding capital investments and sources of funding for those investments; and |
| • | our beliefs regarding the sufficiency of our available liquidity to meet our working capital, our debt and debt covenants, our dividend plans and our capital expenditure needs. |
Forward-looking statements are subject to risks and uncertainties that could cause actual results to differ materially from those expressed in the forward-looking statements. You are urged to carefully review the disclosures we make concerning risks and other factors that may affect our business and operating results, including those made in Part I*, Item 1A of this* Annual Report on Form 10-K*, and any of those made in our other reports filed with the Securities and Exchange Commission. You are cautioned not to place undue reliance on these forward-looking statements, which speak only as of the date of this document. We do not intend, and undertake no obligation, to publish revised forward-looking statements to reflect events or circumstances after the date of this document or to reflect the occurrence of unanticipated events.*
PART I
Item 1. Business
General
Western Digital Corporation (“Western Digital”) is a leading developer, manufacturer, and provider of data storage devices and solutions that address the evolving needs of the information technology (“IT”) industry and the infrastructure that enables the proliferation of data in virtually every other industry. We create environments for data to thrive. We are driving the innovation needed to help customers capture, preserve, access and transform an ever-increasing diversity of data. Everywhere data lives, from advanced data centers to mobile sensors to personal devices, our industry-leading solutions deliver the possibilities of data.
Our broad portfolio of technology and products address the following key end markets: Client Devices; Data Center Devices and Solutions; and Client Solutions. We also generate license and royalty revenue from our extensive intellectual property (“IP”), which is included in each of these three end market categories.
Founded in 1970 in Santa Ana, California and now headquartered in San Jose, California, Western Digital has one of the technology industry’s most valuable patent portfolios with more than 14,000 patents awarded worldwide. Since 2009, we have been a Standard & Poor’s 500 (“S&P 500”) company. We have a rich heritage of innovation and operational excellence, a wide range of IP assets and broad research and development (“R&D”) capabilities. The unabated growth and value of data continues, creating a global need for a larger and more capable storage infrastructure. Our devices and solutions are made using either rotating magnetic technology, hard disk drives (“HDD”), or semiconductor technology, referred to as flash-based memory (“flash”). We continue to transform ourselves to address this growth by providing the broadest range of storage technologies in the industry with a comprehensive product portfolio and global reach.
We enable cloud service providers to build more powerful, cost effective and efficient data centers. We have relationships with the full range of original equipment manufacturers (“OEM”) and data center customers currently addressing storage opportunities, such as storage subsystem suppliers, major server OEMs, Internet and social media infrastructure players, and personal computer (“PC”) and Mac™ OEMs. We have also built strong consumer brands by providing effective tools to manage fast-accumulating libraries of personal content. We market our products primarily under the HGST, SanDisk and WD brands. Our products are sold through distribution, retail and direct channels worldwide. We are a vertically integrated company with deep capabilities to transform disk drive and flash-based components into products and solutions. We operate a series of joint ventures with Toshiba Memory Corporation (“TMC”) that provide us with industry leading flash-based memory wafers that we use in our products (see “Ventures with Toshiba Memory” Section below).
We are well positioned to capitalize on the ongoing expansion in digital content generation and management. This fundamental trend is linked directly to commercial enterprises’ and consumers’ need for data storage and extraction of value from the data. The ways in which people and organizations are creating and using data are changing and the amount of data considered useful to store is expanding. More digital content is being stored and managed in a cloud environment on both HDDs and flash-based solid state drives (“SSDs”). With a focus on innovation and value creation, our goal is to grow through strong execution and targeted investments in data center infrastructure, mobility and the cloud.
Industry
We operate in the data storage and data management industry. Our devices and solutions provide a broad range of reliability, performance, storage capacity and data retention capabilities to our customers. The ability to capture and create value through the use of data analytics is increasingly important to our customers. In a connected global marketplace, across the data infrastructure, there has been a proliferation in the methods by and the rates at which content is generated, accessed, transformed, consumed and stored by end users. When combined with fast global networks, these trends create tremendous need for cost effective, high-performance and/or high-capacity storage solutions in edge and end-point use cases such as mobile, computing and consumer electronic devices, as well as in a wide range of storage systems, servers and data centers.
The growth in computing complexity, cloud computing applications, connected mobile devices and Internet connected products is driving unabated growth in the volume of digital content to be stored. This growth has led to a creation of new form factors for data storage. The storage industry is increasingly utilizing tiered architectures with HDDs, SSDs and other non-volatile memory-based storage to address an expanding set of uses and applications. We continuously monitor the advantages, disadvantages and advances of the full array of storage technologies, including reviewing these technologies with our customers, to ensure we are appropriately resourced to meet our customers’ storage needs. Storage solutions that hold large amounts of data are key enablers of the trends seen in the evolution of a data driven economy, underpinned by the increase of digital content creation, consumption and monetization. Our investments in a range of early stage companies made possible through Western Digital Capital Global enables us to monitor and lead key trends within our ecosystem.
We are a market and customer driven company, focused on growth, technology, innovation and value creation for our customers, employees and shareholders. We develop deep and collaborative relationships with our customers with a goal of enabling their continued success, an approach that has made us a trusted business partner in our served markets. As our portfolio of storage solutions expands further, we believe our customer engagement approach is one of the key factors that will help us continue to achieve strong financial performance over the long term. We continue to evolve our customer engagement and go-to-market model to address changing customer and market needs. We are well positioned to expand our value-creation model within an evolving and growing storage ecosystem with our diversified product platform and unique competitive advantages.
Competition
Our industry is highly competitive. We compete with manufacturers of HDDs and flash-based memory for client devices and solutions, and data center devices and solutions. In HDD, we compete with Seagate Technology plc and Toshiba Electronic Devices & Storage Corporation. In flash, we compete with vertically integrated suppliers such as Intel Corporation, Micron Technology, Inc., Samsung Electronics Co., Ltd., SK hynix, Inc., TMC and numerous smaller companies that assemble flash into products.
Business Strategy
Our overall strategy is to leverage our technology, innovation and execution capabilities to be an industry-leading and broad-based developer, manufacturer and provider of storage devices and solutions that support the infrastructure that has enabled the unabated proliferation of data. We believe we are the only company in the world with large-scale capabilities to develop and manufacture a portfolio of integrated data storage solutions that are based on both rotating magnetic and flash memory technologies. We strive to successfully execute our strategy through the following foundational elements in order to deliver the best outcome for our customers, partners, investors and employees:
| • | Technology Leadership: We continue to innovate and develop advanced technologies across platforms for both HDD and flash to deliver timely new products and solutions to meet growing demands for scale, performance and cost efficiency in the market. |
| • | Broad Product Portfolio: We leverage our capabilities in firmware, software and systems in both HDD and flash to deliver compelling and differentiated integrated storage solutions to our customers that offer the best combinations of performance, cost, power consumption, form factor, quality and reliability, while creating new use cases for our solutions in emerging markets. |
| • | Operational Excellence: We are focused on delivering the best value for our customers in data center, client and consumer markets through a relentless focus on appropriately scaling our operations across both HDD and flash technologies to efficiently support business growth, achieving best in class cost, quality and cycle-time, maintaining industry leading manufacturing capabilities, and having a competitive advantage in supply-chain management. |
Our strategy provides the following benefits, which distinguish us in the dynamic and competitive data storage industry:
| • | differentiates us as the leading developer and manufacturer of integrated products and solutions based on both HDD and flash, making us a more strategic supply partner to our large-scale customers who have storage needs across the data infrastructure ecosystem; |
| • | enables scaling for efficiency and flexibility, allowing us to leverage our HDD and flash R&D and capital expenditures to deliver storage solutions to multiple markets; |
| • | results in continued diversification of our HDD and flash storage solutions portfolio and entry into additional growing adjacent markets; and |
| • | allows us to achieve strong financial performance, including healthy cash generation, thereby enabling organic and inorganic business investments and return of cash to shareholders. |
Data Storage Solutions
We offer a broad line of data storage solutions to meet the evolving storage needs of end markets which include the following:
Client Devices
Client Devices consist of HDDs and SSDs for computing devices, such as desktop and notebook PCs, security surveillance systems, gaming consoles and set top boxes; flash-based embedded storage products for mobile phones, tablets, notebook PCs and other portable and wearable devices, automotive, Internet of Things (“IoT”), industrial and connected home applications; and flash-based memory wafers and components. Our HDDs and SSDs are designed for use in devices requiring high performance, reliability and capacity with various attributes such as low cost per GB, quiet acoustics, low power consumption and protection against shocks. Our embedded storage include custom embedded solutions and embedded flash products, such as our multi-chip package (“MCP”) solutions that combine flash-based and mobile dynamic random-access memory (“DRAM”) in an integrated package.
Data Center Devices and Solutions
Data Center Devices and Solutions consist of high-capacity enterprise HDDs and high-performance enterprise SSDs, data center software and system solutions. Our capacity enterprise helium hard drives provide high capacity storage needs and low total cost of ownership benefits for the growing cloud data center market. Our high-performance enterprise class SSDs include high-performance flash-based SSDs and software solutions which are optimized for performance applications providing a range of capacity and performance levels primarily for use in enterprise servers, supporting high volume on-line transactions, data analysis and other enterprise applications. Our data center solutions also include a wide range of high-capacity HDDs and drive configurations which provide enterprise class reliability at the lowest cost per gigabyte (“GB”). These drives are primarily for use in data storage systems, in tiered storage models and where data must be stored reliably for years. Our system solutions provide petabyte scalable capacity with high performance at compelling economics. We also provide higher value data storage platforms and systems to the market through our vertically integrated scale-out object storage active archive systems.
Client Solutions
Client Solutions consist of HDDs and SSDs embedded into external storage products and removable flash-based products, which include cards, universal serial bus (“USB”) flash drives and wireless drives. Our external HDD storage products in both mobile and desktop form factors provide affordable, high quality, reliable storage for backup and capacity expansion that are designed to keep digital content secure. We offer client portable SSDs with a range of capacities and performance characteristics to address a broad spectrum of the client storage market. Our removable cards are designed primarily for use in consumer devices, such as mobile phones, tablets, imaging systems, still cameras, action video cameras and security surveillance systems. Our USB flash drives are used in the computing and consumer markets and are designed for high-performance and reliability. Our wireless drive products allow in-field back up of created content, as well as wireless streaming of high-definition movies, photos, music and documents to tablets, smartphones and PCs.
Technology
Rotating Magnetic Storage
HDDs provide non-volatile data storage based on the recording of magnetic information on a rotating disk. We have successfully developed and commercialized HDDs that operate in an enclosed helium environment, instead of air, delivering industry leading HDD capacity and performance attributes. Our improvements in HDD capacity, which lower product costs over time, have been enabled largely through advancements in recording head and magnetic media technology. We develop and manufacture substantially all of the recording heads and magnetic media used in our hard drive products. We invest considerable resources in R&D, manufacturing infrastructure and capital equipment for recording head and media technology, as well as other aspects of the magnetic recording system such as HDD mechanics, controller and firmware technology, in order to secure our competitive position and cost structure. In 2018, we announced the world’s first microwave-assisted magnetic recording (“MAMR”) HDD - a breakthrough in innovation for delivering ultra-high capacity HDDs to meet the future demands of Big Data with proven data center-level reliability.
Solid State Storage
Solid state storage products provide non-volatile data storage based on flash technology. We develop and manufacture solid state storage products in different form factors for a variety of different markets, including enterprise or cloud storage, client storage, automotive, mobile devices and removable memory devices.
Our solid state storage products utilize our captive flash-based technology which we develop and manufacture through our business ventures with TMC. We devote significant research and development resources to the development of highly reliable, high-performance, cost-effective flash-based technology. Over time, we have successfully developed and commercialized an increased number of storage bits per cell in an increasingly smaller form factor, further driving cost reductions. Following our introduction and commercialization in 2018 of products based on 4-bits-per-cell architectures (“QLC technology”) and on 3-dimensional flash technology (“3D NAND”), which we refer to as BiCS3, we started shipping products based on QLC and BiCS4 technologies in 2019. BiCS4 QLC technology delivers an industry-leading storage capacity of 1.33 terabits on a single chip. In addition, we implemented our advanced UFS and e.MMC interface in a new portfolio of advanced embedded flash drives to empower smartphone users to unlock the full potential of today’s data-driven applications and experiences. We also provide a range of embedded storage solutions for customers developing high-end, highly demanding, and data-intensive automotive applications.
We expect to develop and commercialize additional generations of 3D NAND technologies over the next several years while continuing to utilize our older technology for certain markets and applications.
We are leveraging our expertise, resources and strategic investments in non-volatile memories to explore a wide spectrum of persistent memory and storage class memory technologies. We have also initiated, defined and developed standards to meet new market needs and to promote wide acceptance of flash storage standards through interoperability and ease-of-use.
Our products generally leverage a common platform for various products within product families, and in some cases across product families, resulting in the commonality of components which reduces our exposure to changes in demand, facilitates inventory management and allows us to achieve lower costs through purchasing economies. This platform strategy also enables our customers to leverage their qualification efforts onto successive product models. For a discussion of associated risks, see Part I, Item 1A, Risk Factors, of this Annual Report on Form 10‑K.
Research and Development
We devote substantial resources to the development of new products and the improvement of existing products. We focus our engineering efforts on coordinating our product design and manufacturing processes to bring our products to market in a cost-effective and timely manner. For a discussion of associated risks, see Part I, Item 1A, Risk Factors, of this Annual Report on Form 10‑K.
Patents, Licenses and Proprietary Information
We rely on a combination of patents, trademarks, copyright and trade secret laws, confidentiality procedures and licensing arrangements to protect our IP rights.
We have more than 14,000 active patents worldwide and have many patent applications in process. We continually seek additional United States (“U.S.”) and international patents on our technology. We believe that, although our active patents and patent applications have considerable value, the successful manufacturing and marketing of our products also depends upon the technical and managerial competence of our staff. Accordingly, the patents held and applied for cannot alone ensure our future success.
In addition to patent protection of certain IP rights, we consider elements of our product designs and processes to be proprietary and confidential. We believe that our non-patented IP, particularly some of our process technology, is an important factor in our success. We rely upon non-disclosure agreements, contractual provisions and a system of internal safeguards to protect our proprietary information. Despite these safeguards, there is a risk that competitors may obtain and use such information. The laws of foreign jurisdictions in which we conduct business may provide less protection for confidential information than the laws of the U.S.
We rely on certain technology that we license from other parties to manufacture and sell our products. We believe that we have adequate cross-licenses and other agreements in place in addition to our own IP portfolio to compete successfully in the storage industry. For a discussion of associated risks, see Part I, Item 1A, Risk Factors, of this Annual Report on Form 10‑K.
Manufacturing
We believe that we have significant know-how, unique product manufacturing processes, test and tooling, execution skills, human resources and training to continue to be successful and to grow our manufacturing operations as necessary. We strive to maintain manufacturing flexibility, high manufacturing yields, reliable products and high-quality components. The critical elements of our production of HDD and flash-based products are high-volume and utilization, low-cost assembly and testing, strict adherence to quality metrics and maintaining close relationships with our strategic component suppliers to access best-in-class technology and manufacturing capacity. We continually monitor our manufacturing capabilities to respond to the changing requirements of our customers and maintain our competitiveness and position as a data technology leader.
HDD and flash-based product manufacturing are complex processes involving the production and assembly of precision components with narrow tolerances and rigorous testing. The manufacturing processes involve a number of steps that are dependent on each other and occur in “clean room” environments that demand skill in process engineering and efficient space utilization to control the operating costs of these manufacturing environments. We continually evaluate our manufacturing processes in an effort to increase productivity, sustain and improve quality and decrease manufacturing costs. We continually evaluate which steps in the manufacturing process would benefit from automation and how automated manufacturing processes can improve productivity and reduce manufacturing costs.
Substantially all of our flash-based supply requirements for our flash-based products is obtained from our business ventures with TMC, which provide us with leading-edge, high-quality and low-cost flash memory wafers. This represents our captive supply and we are obligated to take our share of the output from these ventures or pay the fixed costs associated with that capacity. See “Ventures with Toshiba Memory” below for additional information. While substantially all of our flash memory supply utilized for our products is purchased from these ventures, from time-to-time, we also purchase flash memory from other flash manufacturers, which we refer to as non-captive. While we do not unilaterally control the operations of our ventures with TMC, we believe that our business venture relationship with TMC helps us to reduce the costs of producing our products, increases our ability to control the quality of our products and speeds delivery of our products to our customers. Our vertically integrated manufacturing operations for our flash-based products are concentrated in three locations, with our business ventures with TMC located in Yokkaichi, Japan, and our in-house assembly and test operations located in Shanghai, China and Penang, Malaysia.
We also leverage the efficiencies of contract manufacturers when strategically advantageous. For a discussion of associated risks, see Part I, Item 1A, Risk Factors, of this Annual Report on Form 10‑K.
Materials and Supplies
HDD consists primarily of recording heads, magnetic media and a printed circuit board assembly. We design and manufacture substantially all of the recording heads and magnetic media required for our products. As a result, we are more dependent upon our own development and execution efforts and less reliant on recording head and magnetic media technologies developed by other manufacturers. We depend on an external supply base for all remaining components and materials for use in our HDD product design and manufacturing.
Our flash-based products consist of flash memory, controllers and firmwares. Substantially all of our flash-based memory is supplied by our business ventures with TMC. Controllers are primarily designed in-house and manufactured by third-party foundries or acquired from third-party suppliers. We believe the use of our in-house assembly and test facilities, as well as contract manufacturers, provides flexibility and gives us access to increased production capacity. We have developed deep relationships with these vendors and TMC to establish continuous supply of flash-based memory and controllers.
We generally retain multiple suppliers for our component requirements but in some instances use sole or single sources for business or technology reasons. Currently, we believe that there are no major issues with component availability. For a discussion of associated risks, see Part I, Item 1A, Risk Factors, of this Annual Report on Form 10‑K.
Ventures with Toshiba Memory
We and TMC currently operate three business ventures in 300-millimeter flash-based manufacturing facilities in Japan, which provide us leading-edge, cost-competitive flash-based memory wafers for our end products. Through Flash Partners Ltd., Flash Alliance Ltd., and Flash Forward Ltd., which we collectively refer to as Flash Ventures, we and TMC collaborate in the development and manufacture of flash-based memory wafers using semiconductor manufacturing equipment owned or leased by each of the Flash Venture entities. We hold a 49.9% ownership position in each of the Flash Venture entities. Each Flash Venture entity purchases wafers from TMC at cost and then resells those wafers to us and TMC at cost plus a mark-up. We are obligated to pay for variable costs incurred in producing our share of Flash Ventures’ flash-based memory wafer supply, based on our three month forecast, which generally equals 50% of Flash Ventures’ output. In addition, we are obligated to pay for half of Flash Ventures’ fixed costs regardless of the output we choose to purchase. We are also obligated to fund 49.9% to 50% of Flash Ventures’ capital investments to the extent that Flash Ventures’ operating cash flow is insufficient to fund these investments. We and TMC also collaborate on certain R&D activities in support of Flash Ventures.
The agreements governing the operations of the Flash Venture entities also set out a framework for any investment by the joint venture partners in flash manufacturing capacity. Since its inception, Flash Ventures has been based in a manufacturing site in Yokkaichi, Japan that is owned and operated by TMC. The Yokkaichi site currently includes five wafer fabrication facilities, the newest of which is known as “Y6.” We have jointly invested, and intend to continue to jointly invest, with TMC in manufacturing equipment for Y6. In May 2019, we entered into additional agreements to extend Flash Ventures to a new wafer fabrication facility, known as “K1.” K1 is currently under construction at a site in Kitakami, Iwate, Japan that is operated by Toshiba Memory Corporation Iwate, a wholly owned subsidiary of TMC. As with Y6, the primary purpose of K1 is to provide clean room space to continue the transition of existing flash-based wafer capacity to newer technology nodes.
For a discussion of risks associated with our business ventures with TMC, see Part I, Item 1A, Risk Factors, of this Annual Report on Form 10‑K.
Sales and Distribution
We maintain sales offices in selected parts of the world including the major geographies of the Americas, Asia Pacific, Europe and the Middle East. Our international sales, which include sales to foreign subsidiaries of U.S. companies but do not include sales to U.S. subsidiaries of foreign companies, represented 78%, 78% and 80% of our net revenue for 2019, 2018 and 2017, respectively. Sales to international customers are subject to certain risks not normally encountered in domestic operations, including exposure to tariffs and various trade regulations. For a discussion of associated risks, see Part I, Item 1A, Risk Factors, of this Annual Report on Form 10‑K.
We perform our marketing and advertising functions internally and through outside firms utilizing both consumer media and trade publications targeting various reseller and end-user categories. We also maintain customer relationships through direct communication and by providing information and support through our website. In accordance with standard storage industry practice, we provide distributors and retailers with limited price protection and programs under which we reimburse certain marketing expenditures. We also provide distributors, resellers and OEMs with other sales incentive programs. While these groups of customers make up our end markets, some of these customers cross into multiple groups. We define these customers as follows:
Original Equipment Manufacturers. OEMs, including large-scale data center operators*,* system integrators and cloud customers who bundle, embed, or integrate our storage solutions, purchase our products either directly or through a contract manufacturer such as an original design manufacturer and assemble them into the devices they build. OEMs typically seek to qualify two or more providers for each generation of products and generally will purchase products from those vendors for the life of that product. Many of our OEM customers utilize just-in-time inventory management processes. As a result, for certain OEMs, we maintain a base stock of finished goods inventory in facilities located near or adjacent to the OEM’s operations. In addition, we sell directly to cloud infrastructure players as well as flash storage solutions to customers that offer our products under their own brand name in the retail market, which we also classify as OEMs.
Distributors. We use a broad group of distributors to sell our products to non-direct customers such as small computer and consumer electronics (“CE”) manufacturers, dealers, value-added resellers, systems integrators, online retailers and other resellers. Distributors generally enter into non-exclusive agreements with us for the purchase and redistribution of our products in specific territories.
Retailers. We sell our branded products directly to a select group of major retailers such as computer superstores, warehouse clubs, online retailers and computer electronics stores, and authorize sales through distributors to smaller retailers. The retail channel complements our other sales channels while helping to build brand awareness for us and our products. We also sell our branded products through our websites.
For each of 2019, 2018 and 2017, no single customer accounted for 10% or more of our net revenue. For a discussion of associated risks, see Part I, Item 1A, Risk Factors, of this Annual Report on Form 10‑K. For additional information regarding revenue recognition and major customers, see Part II, Item 8, Note 1, Organization and Basis of Presentation and Note 10, Business Segment, Revenue Information, Geographic Information and Concentration of Risk, of the Notes to Consolidated Financial Statements included in this Annual Report on Form 10‑K.
Backlog
A substantial portion of our orders are generally for shipments within 60 days of the placement of the order. Customers’ purchase orders may be canceled with relatively short notice to us, with little or no cost to the customer, or modified by customers to provide for delivery at a later date. In addition, for many of our OEMs utilizing just-in-time inventory, we do not generally require firm order commitments and instead receive a periodic forecast of requirements. Therefore, backlog information as of the end of a particular period is not necessarily indicative of future levels of our revenue and profit and may not be comparable to prior periods.
Seasonality
We have historically experienced seasonal fluctuations in our business with higher levels of demand in the first and second quarters of our fiscal year as a result of increased customer spending. Seasonality can also be impacted by the growth in emerging markets and macroeconomic conditions. For a discussion of associated risks, see Part I, Item 1A, Risk Factors, of this Annual Report on Form 10‑K.
Service and Warranty
We generally warrant our newly manufactured products against defects in materials and workmanship from one to five years from the date of sale depending on the type of product, with a small number of products having a warranty ranging up to ten years or more. Our warranty obligation is generally limited to repair or replacement. We have engaged third parties in various countries in multiple regions to provide various levels of testing, processing, or recertification of returned products for our customers. For additional information regarding our service and warranty policy, see Part II, Item 8, Note 1, Organization and Basis of Presentation and Note 3, Supplemental Financial Statement Data*,* of the Notes to Consolidated Financial Statements included in this Annual Report on Form 10-K.
Environmental Regulation
We are subject to a variety of U.S. and foreign laws and regulations in connection with our operations and relating to the protection of the environment, including those governing discharges of pollutants into the air and water, the management and disposal of hazardous substances and the clean-up of contaminated sites. Some of our operations require environmental permits and controls to prevent and reduce air and water pollution. These permits are subject to modification, renewal and revocation by issuing authorities. We believe that we have obtained or are in the process of obtaining all necessary environmental permits for our operations.
We have established environmental management systems and continually update our environmental policies and standard operating procedures for our operations worldwide. We believe that our operations are in material compliance with applicable environmental laws, regulations and permits. We budget for operating and capital costs on an ongoing basis to comply with environmental laws.
Our properties have in some cases been operated for many years and may contain soil or groundwater contamination. In certain of our facilities we are undertaking voluntary monitoring of soil and groundwater. Based on available information, including our voluntary monitoring activities, we do not believe that we have a current affirmative legal obligation for any remedial action.
For a discussion of associated risks, see Part I, Item 1A, Risk Factors, of this Annual Report on Form 10‑K.
Employees
As of June 28, 2019, we employed a total of approximately 61,800 employees worldwide, excluding temporary employees and contractors. Many of our employees are highly skilled and our continued success depends in part upon our ability to attract and retain such employees. Accordingly, we offer employee benefit programs that we believe are, in the aggregate, competitive with those offered by our competitors.
While the substantial majority of our employees are not party to a collective bargaining agreement, a majority of our employees in Japan and China are subject to collective bargaining agreements. We consider our employee relations to be good. For a discussion of associated risks, see Part I, Item 1A, Risk Factors, of this Annual Report on Form 10‑K.
Corporate Responsibility and Sustainability
We believe responsible and sustainable business practices support our long-term success. As a company, we are deeply committed to protecting and supporting our people, our environment, and our communities. That commitment is reflected through sustainability-focused initiatives as well as day-to-day activities, including our adoption of sustainability-focused policies and procedures, our publicly-recognized focus on fostering an inclusive workplace, our constant drive toward more efficient use of materials and energy, our careful and active management of our supply chain, our community-focused volunteerism programs and philanthropic initiatives, and our impactful, globally-integrated ethics and compliance program.
| • | We seek to protect the human rights and civil liberties of our employees through policies, procedures, and programs that avoid risks of compulsory and child labor, both within our company and throughout our supply chain. |
| • | We foster a workplace of dignity, respect, diversity, and inclusion through our recruiting and advancement practices, internal communications, and employee resource groups. |
| • | We educate our employees annually on relevant ethics and compliance topics, publish accessible guidance on ethical issues and related company resources in our Global Code of Conduct, and encourage reporting of ethical concerns through any of several global and local reporting channels. |
| • | We support local communities throughout the world, focusing on hunger relief, environmental quality, and STEM (science, technology, engineering, and math) education, especially for underrepresented and underprivileged youth. |
| • | We utilize a robust integrated management system, with associated policies and procedures, to evaluate and manage occupational health and safety risks, environmental compliance, and chemical and hazardous substance risks. |
| • | We innovate to reduce the energy used by our products, the energy used to manufacture them, and the amount of new materials required to manufacture them. |
Available Information
We maintain an Internet website at www.wdc.com. The information on our website is not incorporated in this Annual Report on Form 10‑K. Our Annual Report on Form 10‑K, Quarterly Reports on Form 10‑Q, Current Reports on Form 8‑K and amendments to reports filed or furnished pursuant to Sections 13(a) and 15(d) of the Securities Exchange Act of 1934, as amended, are available on our website at www.wdc.com, free of charge, as soon as reasonably practicable after the electronic filing of these reports with, or furnishing of these reports to, the Securities and Exchange Commission (“SEC”). The SEC maintains a website at www.sec.gov that contains reports, proxy and information statements and other information regarding issuers that file electronically with the SEC, including us.
Item 1A. Risk Factors
Our business, financial condition and operating results can be affected by a number of risks and uncertainties, whether currently known or unknown, any one or more of which could, directly or indirectly, cause our actual results of operations and financial condition to vary materially from past, or from anticipated future, results of operations and financial condition. The risks and uncertainties discussed below are not the only ones facing our business, but represent risks and uncertainties that we believe are material to us. Additional risks and uncertainties not presently known to us or that we currently deem immaterial may also adversely affect our business, financial condition, results of operations or the market price of our common stock.
Adverse global or regional conditions could harm our business, results of operations and financial condition.
A large portion of our revenue is derived from our international operations, and many of our products and components are produced overseas. As a result, our business, results of operations and financial condition depend significantly on global and regional conditions. Adverse changes in global or regional economic conditions, including, but not limited to, volatility in the financial markets, tighter credit, slower growth in certain geographic regions, political uncertainty, other macroeconomic factors, and changes to policies, rules and regulations, could significantly harm demand for our products, increase credit and collectability risks, result in revenue reductions, increase manufacturing and operating costs or result in impairment charges or other expenses.
Our revenue and future growth are significantly dependent on the growth of international markets, and we may face difficulties in entering or maintaining international sales markets. We are subject to risks associated with our global manufacturing operations and global marketing and sales efforts, as well as risks associated with our utilization of and reliance on contract manufacturers, including:
| • | obtaining requisite governmental permits and approvals, compliance with foreign laws and regulations and changes in foreign laws and regulations; |
| • | the need to comply with regulations on international business, including the Foreign Corrupt Practices Act, the United Kingdom Bribery Act 2010, the anti-bribery laws of other countries and rules regarding conflict minerals; |
| • | copyright levies or similar fees or taxes imposed in European and other countries; |
| • | exchange, currency and tax controls and reallocations; |
| • | weaker protection of IP rights; |
| • | trade restrictions, such as export controls, export bans, embargoes, sanctions, license and certification requirements (including on encryption technology), new or increased tariffs and fees and complex customs regulations; and |
| • | difficulties in managing international operations, including appropriate internal controls. |
As a result of these risks, our business, results of operations or financial condition could be adversely affected.
We rely substantially on our business ventures with Toshiba Memory Corporation (“TMC”) for the development and supply of flash-based memory, which subjects us to risks and uncertainties that could harm our business, financial condition and operating results.
We depend on our ventures with TMC to develop and manufacture our flash-based memory. We partner with TMC on the development of flash-based technology, including future generations of 3D NAND, as well as other non-volatile memory technology in support of Flash Ventures. Flash Ventures is subject to various risks that could harm the value of our investments, our revenue and costs, our future rate of spending, our technology plans and our future growth opportunities.
Substantially all of our flash-based memory is supplied by Flash Ventures, which limits our ability to respond to market demand and supply changes. A failure to accurately forecast demand could cause us to over-invest or under-invest in technology transitions or the expansion of Flash Ventures’ capacity. Over-investment by us or our competitors could result in excess supply, which could cause significant decreases in our product prices, significant excess, obsolete inventory or inventory write-downs or under-utilization charges, and the potential impairment of our investments in Flash Ventures. On the other hand, if we under-invest in Flash Ventures or otherwise grow or transition Flash Ventures’ capacity more slowly than we expect or than the rest of the industry, we may not have enough supply of the right type of memory or at all to meet demand on a timely and cost effective basis and we may lose opportunities for revenue, gross margin and market share as a result. If our supply is limited, we may make strategic decisions with respect to the allocation of our supply among our products and customers, and these strategic allocation decisions may result in less favorable gross margin or damage certain customer relationships. We are contractually obligated to pay for 50% of the fixed costs of Flash Ventures regardless of whether we purchase any wafers from Flash Ventures. Furthermore, purchase orders placed with Flash Ventures and under the foundry arrangements with TMC for up to three months are binding and cannot be canceled. Therefore, once our purchase decisions have been made, our production costs for flash memory are fixed, and we may be unable to reduce costs to match any subsequent declines in pricing or demand, which would harm our gross margin. Our limited ability to react to fluctuations in flash memory supply and demand makes our financial results particularly susceptible to variations from our forecasts and expectations.
Under the Flash Ventures agreements, we have limited power to unilaterally direct most of the activities that most significantly impact Flash Ventures’ performance and we have limited ability to source or fabricate flash-based memory outside of Flash Ventures. Lack of alignment with TMC with respect to Flash Ventures could adversely impact our ability to stay at the forefront of technological advancement and our investment in Flash Ventures and otherwise harm our business. Misalignment could arise due to changes in TMC’s strategic priorities and/or ownership, which has changed significantly recently and could continue to change. TMC’s stakeholders may include, or have included in the past, flash and HDD competitors, customers, a private equity firm and a bank owned by the Government of Japan. TMC’s ownership and capital structure could lead to delays in decision-making, disputes, or changes in strategic direction that could adversely impact Flash Ventures and/or adversely affect our business prospects, results of operations and financial condition. There may exist conflicts of interest between TMC’s stakeholders and Flash Ventures or us with respect to, among other things, protecting and growing Flash Ventures’ business, IP and competitively sensitive confidential information.
Flash Ventures requires significant investments by both TMC and us for technology transitions, including the transition to 3D NAND, and capacity expansions. TMC’s parent company, Toshiba Memory Holdings Corporation (“TMHC”), recently announced new financing in the amount of 1.2 trillion Japanese yen. TMHC’s financing agreements and/or its high level of debt could limit TMC’s ability to timely fund or finance investments in Flash Ventures or our joint development efforts, as well as limit Flash Ventures’ ability to enter into lease financings. To the extent that lease financings for Flash Ventures are not accessible on favorable terms or at all, more cash would be required to fund investments. If TMC does not or we do not provide sufficient resour
Showing the first 8K of 82K characters. Open the full section
Item 1B. Unresolved Staff Comments
Not applicable.
Item 2. Properties
Our principal executive offices are located in San Jose, California. Our leased facilities are occupied under leases that expire at various times through 2034. Our principal manufacturing, R&D, marketing and administrative facilities as of June 28, 2019 were as follows:
| Location | Buildings Owned or Leased | Approximate Square Footage | Description | ||||
| United States | |||||||
| California | |||||||
| Fremont | Leased | 290,000 | Manufacturing of head wafers and R&D | ||||
| Irvine | Leased | 490,000 | R&D, administrative, marketing and sales | ||||
| Milpitas | Owned | 589,000 | R&D, marketing and sales, and administrative | ||||
| San Jose | Owned and Leased | 2,750,000 | Manufacturing of head wafers, head, media and product development, R&D, administrative, marketing and sales | ||||
| Colorado | |||||||
| Longmont | Leased | 62,000 | R&D | ||||
| Minnesota | |||||||
| Rochester | Leased | 121,000 | Product development | ||||
| Asia | |||||||
| China | |||||||
| Shanghai | Owned | 774,000 | Assembly and test of SSDs | ||||
| Shenzhen | Owned and Leased | 567,000 | Manufacturing of media | ||||
| Japan | |||||||
| Fujisawa | Owned | 661,000 | Product development | ||||
| Malaysia | |||||||
| Johor | Owned | 277,000 | Manufacturing of substrates | ||||
| Kuala Lumpur | Owned | 146,000 | R&D | ||||
| Kuching | Owned | 285,000 | Manufacturing and development of substrates | ||||
| Penang | Owned | 1,664,000 | Assembly and test of SSDs, manufacturing of media, and R&D | ||||
| Philippines | |||||||
| Laguna | Owned | 632,000 | Manufacturing of HGAs and slider fabrication | ||||
| Thailand | |||||||
| Bang Pa-In | Owned | 1,577,000 | Slider fabrication, manufacturing of HDDs and HGAs, and R&D | ||||
| Prachinburi | Owned | 838,000 | Manufacturing of HDDs | ||||
| India | |||||||
| Bangalore | Owned and Leased | 638,000 | R&D and marketing | ||||
| Middle East | |||||||
| Israel | |||||||
| Kfar Saba | Owned | 167,000 | R&D and marketing | ||||
| Tefen | Owned | 64,000 | R&D and marketing |
We also lease office space in various other locations throughout the world primarily for R&D, sales, operations, administration and technical support. We believe our present facilities are adequate for our current needs, although we upgrade our facilities from time to time to meet anticipated future technological and market requirements. In general, new manufacturing facilities can be developed and become operational within approximately nine to eighteen months should we require such additional facilities.
Item 3. Legal Proceedings
For a description of our legal proceedings, see Part II, Item 8, Note 16, Legal Proceedings, of the Notes to Consolidated Financial Statements included in this Annual Report on Form 10-K, which is incorporated by reference in response to this item.
Item 4. Mine Safety Disclosures
Not applicable.
PART II
Item 5. Market for Registrant’s Common Equity, Related Stockholder Matters and Issuer Purchases of Equity Securities
Market Information for Common Stock
Our common stock is listed on the Nasdaq Global Select Market (“Nasdaq”) under the symbol “WDC.” The approximate number of holders of record of our common stock as of August 14, 2019 was 947.
Repurchases of Equity Securities
There were no repurchases by us of shares of our common stock during the quarter ended June 28, 2019.
Stock Performance Graph
The following graph compares the cumulative total stockholder return of our common stock with the cumulative total return of the S&P 500 Index and the Dow Jones U.S. Technology Hardware & Equipment Index for the five years ended June 28, 2019. The graph assumes that $100 was invested in our common stock at the close of market on June 27, 2014 and that all dividends were reinvested. Stockholder returns over the indicated period should not be considered indicative of future stockholder returns.
TOTAL RETURN TO STOCKHOLDERS
(Assumes $100 investment on June 27, 2014)
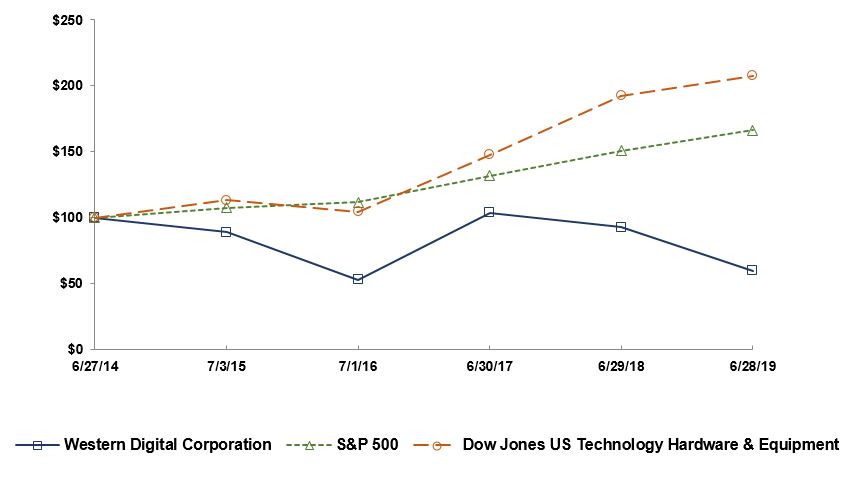
Total Return Analysis
| June 27, 2014 | July 3, 2015 | July 1, 2016 | June 30, 2017 | June 29, 2018 | June 28, 2019 | ||||||||||||||||||
| Western Digital Corporation | $ | 100.00 | $ | 88.77 | $ | 52.89 | $ | 103.62 | $ | 92.72 | $ | 59.52 | |||||||||||
| S&P 500 Index | $ | 100.00 | $ | 107.42 | $ | 111.71 | $ | 131.70 | $ | 150.64 | $ | 166.33 | |||||||||||
| Dow Jones U.S. Technology Hardware & Equipment Index | $ | 100.00 | $ | 113.29 | $ | 104.58 | $ | 147.70 | $ | 192.40 | $ | 207.45 |
The stock performance graph shall not be deemed soliciting material or to be filed with the SEC or subject to Regulation 14A or 14C under the Securities Exchange Act of 1934 or to the liabilities of Section 18 of the Securities Exchange Act of 1934, nor shall it be incorporated by reference into any past or future filing under the Securities Act of 1933 or the Securities Exchange Act of 1934, except to the extent we specifically request that it be treated as soliciting material or specifically incorporate it by reference into a filing under the Securities Act of 1933 or the Securities Exchange Act of 1934.
Item 6. Selected Financial Data
Financial Highlights
This selected consolidated financial data should be read together with the Consolidated Financial Statements and related Notes contained in this Annual Report on Form 10‑K, as well as the section of this Annual Report on Form 10‑K entitled “Management’s Discussion and Analysis of Financial Condition and Results of Operations.”
| June 28, 2019 | June 29, 2018 | June 30, 2017 | July 1, 2016 | July 3, 2015 | |||||||||||||||
| (in millions, except per share and employee data) | |||||||||||||||||||
| Revenue, net | $ | 16,569 | $ | 20,647 | $ | 19,093 | $ | 12,994 | $ | 14,572 | |||||||||
| Gross profit | 3,752 | 7,705 | 6,072 | 3,435 | 4,221 | ||||||||||||||
| Net income (loss) | (754 | ) | 675 | 397 | 242 | 1,465 | |||||||||||||
| Income (loss) per common share: | |||||||||||||||||||
| Basic | $ | (2.58 | ) | $ | 2.27 | $ | 1.38 | $ | 1.01 | $ | 6.31 | ||||||||
| Diluted | $ | (2.58 | ) | $ | 2.20 | $ | 1.34 | $ | 1.00 | $ | 6.18 | ||||||||
| Cash dividends declared per common share | $ | 2.00 | $ | 2.00 | $ | 2.00 | $ | 2.00 | $ | 1.80 | |||||||||
| Working capital | $ | 4,660 | $ | 6,182 | $ | 6,712 | $ | 5,635 | $ | 5,275 | |||||||||
| Total assets | $ | 26,370 | $ | 29,235 | $ | 29,860 | $ | 32,862 | $ | 15,170 | |||||||||
| Long-term debt | $ | 10,246 | $ | 10,993 | $ | 12,918 | $ | 13,660 | $ | 2,149 | |||||||||
| Shareholders’ equity | $ | 9,967 | $ | 11,531 | $ | 11,418 | $ | 11,145 | $ | 9,219 | |||||||||
| Number of employees (1) | 61,800 | 71,600 | 67,600 | 72,900 | 76,400 |
| (1) | Excludes temporary employees and contractors. |
Results for Tegile Systems, Inc., Upthere, Inc., SanDisk Corporation and Amplidata NV, which were acquired on September 15, 2017, August 25, 2017, May 12, 2016 and March 9, 2015, respectively, are included in our operating results only after their respective dates of acquisition.
| Management’s Discussion and Analysis of Financial Conditions and Results of Operations |
Our Company
We are a leading developer, manufacturer and provider of data storage devices and solutions that address the evolving needs of the information technology (“IT”) industry and the infrastructure that enables the proliferation of data in virtually every other industry. We create environments for data to thrive. We drive the innovation needed to help customers capture, preserve, access and transform an ever-increasing diversity of data. Everywhere data lives, from advanced data centers to mobile sensors to personal devices, our industry-leading solutions deliver the possibilities of data.
Our broad portfolio of technology and products address the following key end markets: Client Devices; Data Center Devices and Solutions; and Client Solutions. We also generate license and royalty revenue from our extensive intellectual property (“IP”), which is included in each of these three end market categories.
Our fiscal year ends on the Friday nearest to June 30 and typically consists of 52 weeks. Approximately every five to six years, we report a 53-week fiscal year to align the fiscal year with the foregoing policy. Fiscal years 2019, which ended on June 28, 2019, 2018, which ended on June 29, 2018, and 2017, which ended on June 30, 2017, are each comprised of 52 weeks, with all quarters presented consisting of 13 weeks. Fiscal year 2020, which ends on July 3, 2020, will be comprised of 53 weeks, with the first quarter consisting of 14 weeks and the remaining quarters consisting of 13 weeks each.
Key Developments
Flash Ventures
Through our three business ventures with Toshiba Memory Corporation (“TMC”), referred to as “Flash Ventures”, we and TMC operate flash-based memory wafer manufacturing facilities in Japan. We are obligated to pay for variable costs incurred in producing our share of Flash Ventures’ flash-based memory wafer supply, based on our three month forecast, which generally equals 50% of Flash Ventures’ output. In addition, we are obligated to pay for half of Flash Ventures’ fixed costs regardless of the output we choose to purchase. We are also obligated to fund 49.9% to 50% of Flash Ventures’ capital investments to the extent that Flash Ventures’ operating cash flow is insufficient to fund these investments.
Since its inception, Flash Ventures has been based in a manufacturing site in Yokkaichi, Japan, which currently includes five wafer fabrication facilities. In May 2019, we entered into additional agreements with TMC to extend Flash Ventures to a new wafer fabrication facility, known as “K1,” located in Kitakami, Japan. The primary purpose of K1 is to provide clean room space to continue the transition of existing flash-based wafer capacity to newer technology nodes. Output from the initial production line at K1 is expected in the second half of fiscal year 2020. Meaningful output from K1 is not expected to begin until the first half of fiscal year 2021. Our share of the initial commitment for K1 is expected to result in equipment investments, relocation costs and start-up costs totaling approximately $660 million, to be incurred primarily through the second half of fiscal year 2020. We also agreed to prepay an aggregate of approximately $360 million over a 3-year period beginning in the first half of fiscal year 2020 toward K1 building depreciation, to be credited against future wafer charges.
The flash industry is characterized by cyclicality as it responds to variations in customers’ demand for products and manages production capacity to meet that demand. As technology conversions have matured and manufacturing yields have improved, flash supply has increased relative to demand. As a result, average selling price per gigabyte of flash-based products has declined in recent quarters.
Flash Ventures has historically operated near 100% of its manufacturing capacity. As a result of flash business conditions, we chose to temporarily reduce our utilization of our share of Flash Ventures’ manufacturing capacity at the Yokkaichi site to an abnormally low level through the end of fiscal year 2019 to more closely align our flash-based wafer supply with the projected demand. As a result of this temporary reduction to abnormally low production levels, we incurred costs of $264 million associated with the reduction in utilization, which was recorded as a charge to cost of revenue in the year ended June 28, 2019.
Production levels at the Yokkaichi site have also been reduced as a result of an unexpected power outage incident that occurred in the Yokkaichi region on June 15, 2019. The power outage incident impacted the facilities and process tools and resulted in the damage of flash wafers in production. We expect the incident to result in a reduction of our flash wafer availability of less than 6 exabytes, the majority of which is expected to be contained in the first quarter of fiscal year 2020. As a result of this power outage incident, we incurred aggregate charges of $145 million recorded in cost of revenue for the year ended June 28, 2019, which primarily consisted of the write-off of damaged inventory and unabsorbed manufacturing overhead costs. We expect additional charges of less than $100 million to be recorded in cost of revenue by the end of the first quarter of fiscal 2020. We are pursuing recovery of our losses associated with this event; however, the amount of any recovery cannot be estimated at this time.
Cost and Expense Reduction Actions
During fiscal 2019, we implemented actions to better align our cost and expense structure to near-term business conditions. These actions included accelerating the closure of our HDD manufacturing facility in Kuala Lumpur, Malaysia, reducing other HDD manufacturing costs and other measures to reduce our costs and expenses. We incurred costs of $166 million for the year ended June 28, 2019 in connection with the implementation of these actions and we expect to reduce costs of revenue and operating expenses by $800 million on an annualized basis. The reductions are split approximately equally between cost of revenue and operating expenses. The level of our cost of revenue and operating expenses in any particular period may vary based on differing levels of incentive cash compensation, payroll tax increases, and unexpected or non-recurring costs or expenses, as well as the impact of a 14th week in the first quarter of fiscal 2020.
Results of Operations
Summary Comparison of 2019, 2018 and 2017
The following table sets forth, for the periods presented, selected summary information from our Consolidated Statements of Operations by dollars and percentage of net revenue(1):
| 2019 | 2018 | 2017 | ||||||||||||||||||
| (in millions, except percentages) | ||||||||||||||||||||
| Revenue, net | $ | 16,569 | 100.0 | % | $ | 20,647 | 100.0 | % | $ | 19,093 | 100.0 | % | ||||||||
| Cost of revenue | 12,817 | 77.4 | 12,942 | 62.7 | 13,021 | 68.2 | ||||||||||||||
| Gross profit | 3,752 | 22.6 | 7,705 | 37.3 | 6,072 | 31.8 | ||||||||||||||
| Operating Expenses: | ||||||||||||||||||||
| Research and development | 2,182 | 13.2 | 2,400 | 11.6 | 2,441 | 12.8 | ||||||||||||||
| Selling, general and administrative | 1,317 | 7.9 | 1,473 | 7.1 | 1,445 | 7.6 | ||||||||||||||
| Employee termination, asset impairment, and other charges | 166 | 1.0 | 215 | 1.0 | 232 | 1.2 | ||||||||||||||
| Total operating expenses | 3,665 | 22.1 | 4,088 | 19.8 | 4,118 | 21.6 | ||||||||||||||
| Operating income | 87 | 0.5 | 3,617 | 17.5 | 1,954 | 10.2 | ||||||||||||||
| Interest and other income (expense): | ||||||||||||||||||||
| Interest income | 57 | 0.3 | 60 | 0.3 | 26 | 0.1 | ||||||||||||||
| Interest expense | (469 | ) | (2.8 | ) | (676 | ) | (3.3 | ) | (847 | ) | (4.4 | ) | ||||||||
| Other income, net | 38 | 0.2 | (916 | ) | (4.4 | ) | (364 | ) | (1.9 | ) | ||||||||||
| Total interest and other expense, net | (374 | ) | (2.3 | ) | (1,532 | ) | (7.4 | ) | (1,185 | ) | (6.2 | ) | ||||||||
| Income (loss) before taxes | (287 | ) | (1.7 | ) | 2,085 | 10.1 | 769 | 4.0 | ||||||||||||
| Income tax expense | 467 | 2.8 | 1,410 | 6.8 | 372 | 1.9 | ||||||||||||||
| Net income (loss) | $ | (754 | ) | (4.6 | )% | $ | 675 | 3.3 | % | $ | 397 | 2.1 | % |
| (1) | Percentages may not total due to rounding. |
The following table sets forth, for the periods presented, summary information regarding our revenue(1):
| 2019 | 2018 | 2017 | |||||||||
| (in millions, except percentages) | |||||||||||
| Revenue by Geography: | |||||||||||
| Americas | $ | 4,361 | $ | 5,622 | $ | 5,108 | |||||
| Europe, Middle East and Africa | 3,109 | 3,858 | 3,276 | ||||||||
| Asia | 9,099 | 11,167 | 10,709 | ||||||||
| Total revenue | $ | 16,569 | $ | 20,647 | $ | 19,093 | |||||
| Revenue by End Market: | |||||||||||
| Client Devices | $ | 8,095 | $ | 10,108 | $ | 9,520 | |||||
| Data Center Devices & Solutions | 5,038 | 6,075 | 5,505 | ||||||||
| Client Solutions | 3,436 | 4,464 | 4,068 | ||||||||
| Total revenue | $ | 16,569 | $ | 20,647 | $ | 19,093 | |||||
| Revenue by Form Factor: | |||||||||||
| HDD | $ | 8,746 | $ | 10,698 | $ | 10,640 | |||||
| Flash-based | 7,823 | 9,949 | 8,453 | ||||||||
| Total revenue | $ | 16,569 | $ | 20,647 | $ | 19,093 | |||||
| Exabytes Shipped | 383 | 389 | 313 |
| (1) | Revenue for 2019 is presented in accordance with Accounting Standards Codification (“ASC”) 606. Revenue for 2018 and 2017 is presented in accordance with ASC 605. For information related to our transition from ASC 605 to ASC 606, see Part II, Item 8, Note 1, Organization and Basis of Presentation, of the Notes to Consolidated Financial Statements included in this Annual Report on Form 10-K. |
For each of 2019, 2018 and 2017, no single customer accounted for 10% or more of our net revenue. For 2019, 2018 and 2017, our top 10 customers accounted for 45%, 42% and 36% of our net revenue, respectively.
Fiscal Year 2019 Net Revenue and Gross Margin Compared to Fiscal Year 2018 Net Revenue and Gross Margin
Net Revenue. Net revenue decreased $4.08 billion, or 19.8%, in 2019 compared to 2018, driven by lower average selling prices per gigabyte for flash-based products and lower sales of HDD products. Specifically, Client Devices revenue for the year ended June 28, 2019 decreased 19.9% year over year, primarily driven by lower sales of client HDD products and flash-based mobile products and lower average selling prices per gigabyte of flash-based products. Our revenue for Data Center Devices and Solutions for the year ended June 28, 2019 decreased 17.1% year over year, driven primarily by lower sales of our enterprise SSDs and existing performance enterprise HDDs while our revenue from capacity enterprise HDDs products was similar to the previous year. Client Solutions revenue for the year ended June 28, 2019 decreased 23.0% year over year, primarily driven by lower average selling prices per gigabyte of flash-based products due to the competitive market landscape and lower sales of retail HDD attributed to a lower HDD market with a shift to SSDs.
Changes in net revenue by geography generally reflect normal fluctuations in market demand and competitive dynamics.
Consistent with standard industry practice, we have sales incentive and marketing programs that provide customers with price protection and other incentives or reimbursements that are recorded as a reduction to gross revenue. For 2019, 2018 and 2017, these programs represented 15%, 12% and 12% of gross revenue, respectively, and adjustments to revenue due to changes in accruals for these programs have generally averaged less than 1% of gross revenue over the last three fiscal years. The amounts attributed to our sales incentive and marketing programs generally vary according to several factors including industry conditions, list pricing strategies, seasonal demand, competitor actions, channel mix and overall availability of products. Changes in future customer demand and market conditions may require us to adjust our incentive programs as a percentage of gross revenue.
Gross Profit and Gross Margin. Gross profit decreased $3.95 billion, or 51%, as compared to 2018, primarily as a result of lower average selling prices per gigabyte for flash-based products due to oversupply and competition, flash manufacturing underutilization charges of $264 million, charges related to the power outage incident of $145 million and a charge of $110 million primarily to reduce component inventory to net realizable value for flash-based multi-chip package products that include externally-sourced dynamic random access memory products. These charges were partially offset by lower amortization expense on acquired intangible assets.
Operating Expenses
Fiscal Year 2019 Operating Expenses Compared to Fiscal Year 2018 Operating Expenses
Research and development (“R&D”) expense decreased $218 million, or 9%, compared to 2018, primarily due to lower variable and stock-based compensation expense, as well as savings realized from our expense reduction actions.
Selling, general and administrative (“SG&A”) expense decreased $156 million, or 11%, compared to 2018, primarily due to lower variable compensation expense, as well as savings realized from our expense reduction actions. In addition, we had lower charges related to stock-based compensation expenses, amortization expense on acquired intangible assets, charges related to the implementation of cost-saving initiatives, acquisition-related charges and other charges, which aggregated to $317 million for 2019 compared to $340 million for 2018.
The decrease in employee termination, asset impairment and other charges reflects lower costs for closure of foreign manufacturing facilities and for our 2016 restructuring plan, which were initiated in prior years, partially offset by additional actions associated with the realignment of our business in fiscal year 2019. For additional information regarding employee termination, asset impairment and other charges, see Part II, Item 8, Note 15, Employee Termination, Asset Impairment and Other Charges, of the Notes to Consolidated Financial Statements included in this Annual Report on Form 10-K.
Interest and Other Income (Expense)
Fiscal Year 2019 Interest and Other Income (Expense) Compared to Fiscal Year 2018 Interest and Other Income (Expense)
Total interest and other expense, net decreased $1.16 billion, or 76%, in 2019 primarily due to the loss on extinguishment of debt of $899 million in the prior year as well as lower interest expense resulting from reductions in the principal amount of debt and lower interest rates as a result of changes to our debt facilities in the third and fourth quarters of fiscal 2018, partially offset by increases in the LIBOR interest rate.
Income Tax Expense
The following table sets forth income tax information from our Consolidated Statements of Operations by dollar and effective tax rate:
| 2019 | 2018 | 2017 | |||||||||
| (in millions, except percentages) | |||||||||||
| Income (loss) before taxes | $ | (287 | ) | $ | 2,085 | $ | 769 | ||||
| Income tax expense (benefit) | 467 | 1,410 | 372 | ||||||||
| Effective tax rate | (163 | )% | 68 | % | 48 | % |
The Tax Cuts and Jobs Act (the “2017 Act”), enacted on December 22, 2017, includes a broad range of tax reform proposals affecting businesses, including a reduction in the U.S. federal corporate tax rate from 35% to 21%, a one-time mandatory deemed repatriation tax on earnings of certain foreign subsidiaries that were previously tax deferred and the creation of new taxes on certain foreign earnings.
When initially accounting for the tax effects of the enactment of the 2017 Act, we applied the applicable Securities and Exchange Commission (“SEC”) guidance and made a reasonable estimate of the effects on our existing deferred tax balances and the one-time mandatory deemed repatriation tax required by the 2017 Act. As we finalized the accounting for the tax effects of the enactment of the 2017 Act during the one-year measurement period permitted by applicable SEC guidance, we reflected adjustments to the recorded provisional amounts. During the second quarter of fiscal 2019, we completed our accounting for the tax effects of the enactment of the 2017 Act. Although the U.S. Treasury and the Internal Revenue Service (“IRS”) have issued tax guidance on certain provisions of the 2017 Act since the enactment date, we anticipate the issuance of future additional regulatory and interpretive guidance, even though the one-year measurement period has ended. Although we were able to apply a reasonable interpretation of the law along with any available guidance in finalizing our accounting for the tax effects of the 2017 Act, such future additional regulatory or interpretive guidance would constitute new information which may require further refinements to our estimates in future periods.
The primary driver of the difference between the effective tax rate for the year ended June 28, 2019 and the U.S. Federal statutory rate of 21% is the discrete effect of the finalization of the accounting for the tax effects of the enactment of the 2017 Act. These discrete effects consist of $119 million related to the mandatory deemed repatriation tax and $189 million related to the decision to change our indefinite reinvestment assertion. The remaining difference is attributable primarily to a change in the estimated effective tax rate due to changes in the relative mix of earnings by jurisdiction, partially offset by credits and tax holidays.
The primary drivers for the difference between the effective tax rate for the year ended June 29, 2018 and the blended U.S. Federal statutory rate of 28% are provisional taxes recognized as a result of the 2017 Act and an increase to the valuation allowance for net operating loss carryforwards from restructuring activities, which are partially offset by the 2018 generation of tax credits and tax holidays in Malaysia, Philippines, Singapore and Thailand that expired or will expire at various dates during fiscal years 2018 through 2030. The windfall tax benefits are a result of the adoption of ASU 2016-09, which required us to recognize $78 million of net windfall tax benefits related to vesting and exercises of stock-based awards as a component of our income tax expense for fiscal year 2018.
Our future effective tax rate is subject to future regulatory developments and changes in the mix of our U.S. earnings compared to foreign earnings. Our total tax expense in future fiscal years may also vary as a result of discrete items such as excess tax benefits or deficiencies.
For additional information regarding income tax expense (benefit), see Part II, Item 8, Note 13, Income Tax Expense, of the Notes to Consolidated Financial Statements included in this Annual Report on Form 10-K.
A discussion of our results of operations for the year ended June 30, 2017 is included in Part II, Item 7, “Management’s Discussion and Analysis of Financial Condition and Results of Operations - Results of Operation”, included in our Annual Report on Form 10-K for the year ended June 30, 2017.
Liquidity and Capital Resources
The following table summarizes our statements of cash flows:
| 2019 | 2018 | 2017 | |||||||||
| (in millions) | |||||||||||
| Net cash provided by (used in): | |||||||||||
| Operating activities | $ | 1,547 | $ | 4,205 | $ | 3,437 | |||||
| Investing activities | (1,272 | ) | (1,655 | ) | (636 | ) | |||||
| Financing activities | (1,829 | ) | (3,900 | ) | (4,595 | ) | |||||
| Effect of exchange rate changes on cash | 4 | 1 | (3 | ) | |||||||
| Net decrease in cash and cash equivalents | $ | (1,550 | ) | $ | (1,349 | ) | $ | (1,797 | ) |
We believe our cash, cash equivalents and cash generated from operations as well as our available credit facilities will be sufficient to meet our working capital, debt, dividend and capital expenditure needs for at least the next twelve months. Our ability to sustain our working capital position is subject to a number of risks that we discuss in Part I, Item 1A, Risk Factors, in this Annual Report on Form 10-K.
During fiscal 2020, we expect cash used for purchases of property, plant and equipment and net activity in notes receivable and equity investments relating to our Flash Ventures joint venture with Toshiba Memory Corporation to be less than $500 million. The total expected cash to be used could vary depending on the timing and completion of various capital projects and the availability, timing and terms of related financing.
A total of $2.37 billion and $4.15 billion of our cash and cash equivalents was held outside of the U.S. as of June 28, 2019 and June 29, 2018, respectively. During the second quarter of fiscal 2019, we finalized the accounting for the tax effects of the mandatory deemed repatriation tax on our indefinite reinvestment assertion. After re-evaluating the existing short- and long-term capital allocation polices, we made the determination that it was our intention to repatriate all of our foreign undistributed earnings. Our decision during the second quarter of fiscal 2019 to change our indefinite reinvestment assertion was based on interpretative guidance issued by the IRS through that date related to the ordering and taxation of a repatriation of our foreign undistributed earnings. During the fourth quarter of fiscal 2019, the IRS issued additional interpretative guidance affecting the taxation of a certain portion of our foreign undistributed earnings, which could result in additional federal taxes. After consideration of this additional interpretative guidance, we made the determination that we no longer intend to repatriate this portion of our foreign undistributed earnings and did not establish an accrual for this liability. For additional information regarding our indefinite reinvestment assertion, see Part II, Item 8, Note 13, Income Tax Expense, of the Notes to Consolidated Financial Statements included in this Annual Report on Form 10-K.
Operating Activities
Cash flow from operating activities primarily consists of net income, adjusted for non-cash charges, plus or minus changes in operating assets and liabilities. This represents our principal source of cash. Net cash used for changes in operating assets and liabilities was $260 million for 2019, as compared to net cash provided of $486 million for 2018. The net cash provided by changes in other operating assets and liabilities in 2018 primarily reflects the payable recorded for the mandatory deemed repatriation tax as described in Part II, Item 8, Note 13, Income Tax Expense, of the Notes to Consolidated Financial Statements included in this Annual Report on Form 10-K. Changes in our operating assets and liabilities are also largely affected by our working capital requirements, which are dependent on the effective management of our cash conversion cycle. Our cash conversion cycle measures how quickly we can convert our products into cash through sales. The cash conversion cycles were as follows:
| 2019 | 2018 | 2017 | |||||
| (in days) | |||||||
| Days sales outstanding | 26 | 39 | 37 | ||||
| Days in inventory | 93 | 83 | 65 | ||||
| Days payables outstanding | (54 | ) | (71 | ) | (66) | ||
| Cash conversion cycle | 65 | 51 | 36 |
Changes in days sales outstanding (“DSOs”) are generally due to the linearity of shipments. Changes in days in inventory (“DIOs”) are generally related to the timing of inventory builds. Changes in days payables outstanding (“DPOs”) are generally related to production volume and the timing of purchases during the period. From time to time, we modify the timing of payments to our vendors. We make modifications primarily to manage our vendor relationships and to manage our cash flows, including our cash balances. Generally, we make the payment term modifications through negotiations with our vendors or by granting to, or receiving from, our vendors’ payment term accommodations.
For 2019, DSO decreased by 13 days over the prior year, primarily reflecting the timing of shipments and customer collections and the factoring of receivables. DIO increased by 10 days over the prior year, primarily reflecting increases in hard drive inventory in response to the plant closure in Kuala Lumpur, Malaysia and increases in flash inventory as a result of the recent market imbalance. DPO decreased by 17 days over the prior year, primarily reflecting reductions in flash production volumes as well as routine variations in timing of purchases and payments during the period.
Investing Activities
During 2019, net cash used in investing activities primarily consisted of $876 million of capital expenditures and a net $598 million increase in notes receivable issuances to Flash Ventures to fund its capital expansion, partially offset by net proceeds of $103 million from the sale of investments and $119 million from the sale of property, plant and equipment. Net cash used in investing activities for 2018 primarily consisted of $835 million of capital expenditures, a $742 million net increase in notes receivable issuances to and investments in Flash Ventures and $100 million for acquisitions.
Our cash equivalents are primarily invested in money market funds that invest in U.S. Treasury securities and U.S. Government agency securities as well as bank certificates of deposit. In addition, from time to time, we invest directly in U.S. Treasury securities, U.S. and International Government agency securities, certificates of deposit, asset-backed securities and corporate and municipal notes and bonds.
Financing Activities
During 2019, net cash used in financing activities primarily consisted of $681 million for the repayment of our revolving credit facility and debt, $584 million to pay dividends on our common stock and $563 million for share repurchases. Net cash used in financing activities for 2018 primarily consisted of $17.07 billion in debt repayments, $593 million to pay dividends on our common stock and $591 million for share repurchases, partially offset by net proceeds of $14.28 billion from debt issuances and draws under our revolving credit facility.
A discussion of our liquidity and capital resources for the year ended June 30, 2017 is included in Part II, Item 7, “Management’s Discussion and Analysis of Financial Condition and Results of Operations - Liquidity and Capital Resources”, included in our Annual Report on Form 10-K for the year ended June 30, 2017.
Off-Balance Sheet Arrangements
Other than the commitments related to Flash Ventures, facility lease commitments incurred in the normal course of business and certain indemnification provisions (see “Short and Long-term Liquidity-Contractual Obligations and Commitments” below), we do not have any other material off-balance sheet financing arrangements or liabilities, guarantee contracts, retained or contingent interests in transferred assets, or any other obligation arising out of a material variable interest in an unconsolidated entity. We do not have any majority-owned subsidiaries that are not included in the Consolidated Financial Statements. Additionally, with the exception of Flash Ventures and our joint venture with Unisplendour Corporation Limited and Unissoft (Wuxi) Group Co. Ltd. (“Unis”), referred to as the “Unis Venture”, we do not have an interest in, or relationships with, any variable interest entities. For additional information regarding our off-balance sheet arrangements, see Part II, Item 8, Note 9, Commitments, Contingencies and Related Parties, of the Notes to Consolidated Financial Statements included in this Annual Report on Form 10-K.
Short and Long-term Liquidity
Contractual Obligations and Commitments
The following is a summary of our known contractual cash obligations and commercial commitments as of June 28, 2019:
| Total | 1 Year (2020) | 2-3 Years (2021-2022) | 4-5 Years (2023-2024) | More than 5 Years (Beyond 2024) | |||||||||||||||
| (in millions) | |||||||||||||||||||
| Long-term debt, including current portion(1) | $ | 10,694 | $ | 276 | $ | 587 | $ | 7,531 | $ | 2,300 | |||||||||
| Interest on debt | 1,902 | 423 | 815 | 445 | 219 | ||||||||||||||
| Flash Ventures related commitments(2) | 5,867 | 2,620 | 2,366 | 808 | 73 | ||||||||||||||
| Operating leases | 291 | 59 | 78 | 38 | 116 | ||||||||||||||
| Purchase obligations and other commitments | 2,977 | 2,050 | 523 | 194 | 210 | ||||||||||||||
| Mandatory Deemed Repatriation Tax | 1,104 | 62 | 199 | 285 | 558 | ||||||||||||||
| Total | $ | 22,835 | $ | 5,490 | $ | 4,568 | $ | 9,301 | $ | 3,476 |
| (1) | Principal portion of debt, excluding discounts and issuance costs. |
| (2) | Includes reimbursement for depreciation and lease payments on owned and committed equipment, funding commitments for loans and equity investments and payments for other committed expenses, including R&D and building depreciation. Funding commitments assume no additional operating lease guarantees. Additional operating lease guarantees can reduce funding commitments. |
Debt
Additional information regarding our indebtedness, including information about availability under our revolving credit facility and the principal repayment terms, interest rates, covenants and other key terms of our outstanding indebtedness, is included in Part II, Item 8, Note 6, Debt, of the Notes to Consolidated Financial Statements included in this Annual Report on Form 10-K.
Flash Ventures
Flash Ventures sells to and leases back from a consortium of financial institutions a portion of its tools and has entered into equipment lease agreements of which we guarantee half or all of the outstanding obligations under each lease agreement. The leases are subject to customary covenants and cancellation events that relate to Flash Ventures and each of the guarantors. The occurrence of a cancellation event could result in an acceleration of the lease obligations and a call on our guarantees. As of June 28, 2019, we were in compliance with all covenants under these Japanese lease facilities. See Part II, Item 8, Note 9, Commitments, Contingencies and Related Parties, of the Notes to Consolidated Financial Statements included in this Annual Report on Form 10-K for information regarding Flash Ventures.
Purchase Obligations and Other Commitments
In the normal course of business, we enter into purchase orders with suppliers for the purchase of components used to manufacture our products. These purchase orders generally cover forecasted component supplies needed for production during the next quarter, are recorded as a liability upon receipt of the components, and generally may be changed or canceled at any time prior to shipment of the components. We also enter into long-term agreements with suppliers that contain fixed future commitments, which are contingent on certain conditions such as performance, quality and technology of the vendor’s components. These arrangements are included under “Purchase obligations” in the table above.
Mandatory Deemed Repatriation Tax
The following is a summary of our estimated mandatory deemed repatriation tax obligations that are payable in the following fiscal years (in millions):
| 2020 | $ | 62 | ||
| 2021 | 99 | |||
| 2022 | 100 | |||
| 2023 | 99 | |||
| 2024 | 186 | |||
| 2025 | 248 | |||
| 2026 | 310 | |||
| Total | $ | 1,104 |
For additional information regarding our estimate of the total tax liability for the mandatory deemed repatriation tax, see Part II, Item 8, Note 13, Income Tax Expense, of the Notes to Consolidated Financial Statements included in this Annual Report on Form 10-K.
Unrecognized Tax Benefits
As of June 28, 2019, the liability for unrecognized tax benefits (excluding accrued interest and penalties) was approximately $695 million. Accrued interest and penalties related to unrecognized tax benefits as of June 28, 2019 was approximately $123 million. Of these amounts, approximately $699 million could result in potential cash payments. We are not able to provide a reasonable estimate of the timing of future tax payments related to these obligations. For additional information regarding our total tax liability for unrecognized tax benefits, see Part II, Item 8, Note 13, Income Tax Expense, of the Notes to Consolidated Financial Statements included in this Annual Report on Form 10-K.
Interest Rate Swap
We have entered into interest rate swap agreements to moderate our exposure to fluctuations in interest rates underlying our variable rate debt. For a description of our current interest rate swaps, see Part II, Item 7A, Quantitative and Qualitative Disclosures About Market Risk included in this Annual Report on Form 10-K.
Foreign Exchange Contracts
We purchase foreign exchange contracts to hedge the impact of foreign currency fluctuations on certain underlying assets, liabilities and commitments for operating expenses and product costs denominated in foreign currencies. For a description of our current foreign exchange contract commitments, see Part II, Item 7A, Quantitative and Qualitative Disclosures About Market Risk and Part II, Item 8, Note 5, Derivative Instruments and Hedging Activities, of the Notes to Consolidated Financial Statements included in this Annual Report on Form 10-K.
Indemnifications
In the ordinary course of business, we may provide indemnifications of varying scope and terms to customers, vendors, lessors, business partners and other parties with respect to certain matters, including, but not limited to, losses arising out of our breach of agreements, products or services to be provided by us, environmental compliance or from IP infringement claims made by third parties. In addition, we have entered into indemnification agreements with our directors and certain of our officers that will require us, among other things, to indemnify them against certain liabilities that may arise by reason of their status or service as directors or officers. We maintain director and officer insurance, which may cover certain liabilities arising from our obligation to indemnify our directors and officers in certain circumstances.
It is not possible to determine the maximum potential amount under these indemnification agreements due to the limited history of prior indemnification claims and the unique facts and circumstances involved in each particular agreement. Such indemnification agreements may not be subject to maximum loss clauses. Historically, we have not incurred material costs as a result of obligations under these agreements.
Stock Repurchase Program
Our Board of Directors previously authorized $5.00 billion for the repurchase of our common stock. On July 25, 2018, our Board of Directors authorized a new $5.00 billion share repurchase program that is effective through July 25, 2023, replacing all prior programs. For the three months ended June 28, 2019, we did not make any stock repurchases. For the year ended June 28, 2019, we repurchased 0.8 million shares for a total cost of $61 million under the previous authorization and 7.6 million shares for a total cost of $502 million under the new authorization. Therefore, our stock repurchases under all stock repurchase authorizations in effect for the year ended June 28, 2019 totaled $563 million. The remaining amount available to be repurchased under our current stock repurchase program as of June 28, 2019 was $4.50 billion. Repurchases under the stock repurchase program may be made in the open market or in privately negotiated transactions and may be made under a Rule 10b5-1 plan. We expect stock repurchases to be funded principally by operating cash flows.
Cash Dividend
Since the first quarter of 2013, we have issued a quarterly cash dividend. During the twelve months ended June 28, 2019, we declared aggregate cash dividends of $2.00 per share on our outstanding common stock totaling $583 million, of which $147 million was paid on July 15, 2019.
On August 7, 2019, we declared a cash dividend of $0.50 per share of our common stock to our shareholders of record as of October 4, 2019, which will be paid on October 22, 2019. We may modify, suspend, or cancel our cash dividend policy in any manner and at any time. The amount of future dividends under our cash dividend policy, and the declaration and payment thereof, will be based upon all relevant factors, including our financial position, results of operations, cash flows, capital requirements and restrictions under our Credit Agreement and other financing agreements, and shall be in compliance with applicable law.
Recent Accounting Pronouncements
For a description of recently issued and adopted accounting pronouncements, including the respective dates of adoption and expected effects on our results of operations and financial condition, see Part II, Item 8, Note 2, Recent Accounting Pronouncements, of the Notes to Consolidated Financial Statements included in this Annual Report on Form 10-K.
Critical Accounting Policies and Estimates
We have prepared the accompanying Consolidated Financial Statements in accordance with accounting principles generally accepted in the United States (“U.S. GAAP”). The preparation of the financial statements requires the use of judgments and estimates that affect the reported amounts of revenue, expenses, assets, liabilities and shareholders’ equity. We have adopted accounting policies and practices that are generally accepted in the industry in which we operate. We believe the following are our most critical accounting policies that affect significant areas and involve judgment and estimates made by us. If these estimates differ significantly from actual results, the impact to Consolidated Financial Statements may be material.
Revenue
We provide distributors and retailers (collectively referred to as “resellers”) with limited price protection for inventories held by resellers at the time of published list price reductions and/or a right of return. We also provide resellers and original equipment manufacturers (“OEMs”) with other sales incentive programs. We use judgment in our assessment of variable consideration in contracts to be included in the transaction price. We use the expected value method to arrive at the amount of variable consideration. We believe the estimate of variable consideration is not constrained and that the expected value method is the appropriate estimate of the amount of variable consideration based on the fact that we have a large number of contracts with similar characteristics. Our methodology for the estimates is based on several factors, including anticipated price decreases during the reseller holding period, resellers’ sell-through and inventory levels, estimated amounts to be reimbursed to qualifying customers, historical pricing information, historical and anticipated returns information and customer claim processing. We also have programs under which we reimburse qualified distributors and retailers for certain marketing expenditures, which are typically recorded as a reduction of the transaction price and, therefore, of revenue. We net sales rebates against open customer receivable balances if the criteria to offset are met, otherwise they are recorded within other accrued liabilities.
Inventories
We value inventories at the lower of cost (first-in, first-out) or net realizable value. We record inventory write-downs for the valuation of inventory at the lower of cost or net realizable value by analyzing market conditions and estimates of future sales prices as compared to inventory costs and inventory balances.
We evaluate inventory balances for excess quantities and obsolescence on a regular basis by analyzing estimated demand, inventory on hand, sales levels and other information and reduce inventory balances to net realizable value for excess and obsolete inventory based on this analysis. Unanticipated changes in technology or customer demand could result in a decrease in demand for one or more of our products, which may require a write down of inventory that could materially affect operating results.
Litigation and Other Contingencies
When we become aware of a claim or potential claim, we assess the likelihood of any loss or exposure. We disclose information regarding each material claim where the likelihood of a loss contingency is probable or reasonably possible. If a loss contingency is probable and the amount of the loss can be reasonably estimated, we record an accrual for the loss. In such cases, there may be an exposure to potential loss in excess of the amount accrued. Where a loss is not probable but is reasonably possible or where a loss in excess of the amount accrued is reasonably possible, we disclose an estimate of the amount of the loss or range of possible losses for the claim if a reasonable estimate can be made, unless the amount of such reasonably possible losses is not material to our financial position, results of operations or cash flows. The ability to predict the ultimate outcome of such matters involves judgments, estimates and inherent uncertainties. The actual outcome of such matters could differ materially from management’s estimates. For additional information, see Part II, Item 8, Note 16, Legal Proceedings, of the Notes to Consolidated Financial Statements included in this Annual Report on Form 10‑K.
Income Taxes
We account for income taxes under the asset and liability method, which provides that deferred tax assets and liabilities be recognized for temporary differences between the financial reporting basis and the tax basis of our assets and liabilities and expected benefits of utilizing net operating loss and tax credit carryforwards. We record a valuation allowance when it is more likely than not that the deferred tax assets will not be realized. Each quarter, we evaluate the need for a valuation allowance for our deferred tax assets and we adjust the valuation allowance so that we record net deferred tax assets only to the extent that we conclude it is more likely than not that these deferred tax assets will be realized. We account for interest and penalties related to income taxes as a component of the provision for income taxes.
We recognize liabilities for uncertain tax positions based on a two-step process. To the extent a tax position does not meet a more-likely-than-not level of certainty, no benefit is recognized in the financial statements. If a position meets the more-likely-than-not level of certainty, it is recognized in the financial statements at the largest amount that has a greater than 50% likelihood of being realized upon ultimate settlement. Interest and penalties related to unrecognized tax benefits are recognized on liabilities recorded for uncertain tax positions and are recorded in our provision for income taxes. The actual liability for unrealized tax benefits in any such contingency may be materially different from our estimates, which could result in the need to record additional liabilities for unrecognized tax benefits or potentially adjust previously-recorded liabilities for unrealized tax benefits and materially affect our operating results.
Goodwill and Other Long-Lived Assets
Goodwill is not amortized. Instead, it is tested for impairment on an annual basis or more frequently whenever events or changes in circumstances indicate that goodwill may be impaired. We perform our annual impairment test as of the first day of our fiscal fourth quarter. We use qualitative factors to determine whether goodwill is more likely than not impaired and whether a quantitative test for impairment is considered necessary. If we conclude from the qualitative assessment that goodwill is more likely than not impaired, we are required to perform a quantitative approach to determine the amount of impairment. We are required to use judgment when applying the goodwill impairment test, including the identification of one or more reporting units. If we had more than one reporting unit, judgment would also be required in the assignment of assets and liabilities to reporting units, assignment of goodwill to reporting units and determination of the fair value of each reporting unit. In addition, the estimates used to determine the fair value of each reporting unit may change based on results of operations, macroeconomic conditions or other factors. Changes in these estimates could materially affect our assessment of the fair value and goodwill impairment for each reporting unit. If our stock price decreases significantly, goodwill could become impaired, which could result in a material charge and adversely affect our results of operations.
Other long-lived intangible assets are amortized over their estimated useful lives based on the pattern in which the economic benefits are expected to be received. Long-lived assets are tested for recoverability whenever events or changes in circumstances indicate that their carrying amounts may not be recoverable. If impairment is indicated, the impairment is measured as the amount by which the carrying amount of the assets exceeds the fair value of the assets. The estimates of fair value require evaluation of future market conditions and product lifecycles as well as projected revenue, earnings and cash flow.
Item 7A. Quantitative and Qualitative Disclosures About Market Risk
Disclosure About Foreign Currency Risk
Although the majority of our transactions are in U.S. dollars, some transactions are based in various foreign currencies. We purchase short-term, foreign exchange contracts to hedge the impact of foreign currency exchange fluctuations on certain underlying assets, liabilities and commitments for product costs and operating expenses denominated in foreign currencies. The purpose of entering into these hedge transactions is to minimize the impact of foreign currency fluctuations on our results of operations. Substantially all of the contract maturity dates do not exceed 12 months. We do not purchase foreign exchange contracts for speculative or trading purposes. For additional information, see Part II, Item 8, Note 4, Fair Value Measurements and Investments and Note 5, Derivative Instruments and Hedging Activities, of the Notes to Consolidated Financial Statements included in this Annual Report on Form 10‑K.
As of June 28, 2019, we had outstanding the foreign exchange contracts presented in the following table. The designated foreign exchange contracts are entered to protect the U.S. dollar value of our product cost and operating expenses. Changes in fair values of the non-designated foreign exchange contracts are recognized in other income (expense), net and are largely offset by corresponding changes in the fair values of the foreign currency denominated monetary assets and liabilities.
| Contract Amount | Weighted-Average Contract Rate (1) | Mark to Market Unrealized Gain (Loss) | ||||||||
| (in millions, except weighted-average contract rate) | ||||||||||
| Designated Hedges (cash flow hedges): | ||||||||||
| Japanese yen | $ | 1,087 | 108.98 | $ | 21 | |||||
| Malaysian ringgit | 38 | 4.17 | — | |||||||
| Philippine peso | 31 | 53.13 | 1 | |||||||
| Thai baht | 156 | 31.68 | 5 | |||||||
| Total designated forward contracts | $ | 1,312 | $ | 27 | ||||||
| Non-Designated Hedges: | ||||||||||
| British pound sterling | $ | 25 | 0.79 | $ | — | |||||
| Euro | 252 | 0.88 | (1 | ) | ||||||
| Japanese yen | 3,520 | 108.35 | (28 | ) | ||||||
| Malaysian ringgit | 247 | 4.16 | 1 | |||||||
| Philippine peso | 80 | 51.74 | 1 | |||||||
| Thai baht | 269 | 31.20 | 4 | |||||||
| Total non-designated forward contracts | $ | 4,393 | $ | (23 | ) |
| (1) | Expressed in units of foreign currency per U.S. dollar. |
During 2019, 2018 and 2017, total net realized and unrealized transaction and foreign exchange contract currency gains and losses were not material to our Consolidated Financial Statements.
Notwithstanding our efforts to mitigate some foreign exchange risks, we do not hedge all of our foreign currency exposures, and there can be no assurance that our mitigating activities related to the exposures that we hedge will adequately protect us against risks associated with foreign currency fluctuations.
Disclosure About Other Market Risks
Variable Interest Rate Risk
Borrowings under our revolving credit facility and our term loan A-1 due 2023 bear interest at a rate per annum, at our option, of either an adjusted London Interbank Offered Rate (“LIBOR”) (subject to a 0.0% floor) plus an applicable margin varying from 1.125% to 2.000% or a base rate plus an applicable margin varying from 0.125% to 1.000%, in each case depending on our corporate credit ratings. As of June 28, 2019, the applicable margin based on our current credit ratings was 1.5%. Borrowings under our U.S. Term Loan B-4 due 2023 bear interest at a rate per annum, at our option, of either an adjusted LIBOR (subject to a 0.0% floor) plus a margin of 1.75% or a base rate plus a margin of 0.75%.
We have generally held a balance of fixed and variable rate debt. At June 28, 2019, 68% of the par value of our debt was at variable rates. To balance the portfolio, we entered into pay-fixed interest rate swaps on $2.00 billion notional amount, which effectively converts a portion of our term loan to fixed rates through February 2023. As of June 28, 2019, we had $7.26 billion of variable rate debt. After giving effect to the $2.00 billion of interest rate swaps, we effectively had $5.26 billion of long-term debt subject to variations in interest rates and a one percent increase in the variable rate of interest would increase annual interest expense by $53 million.
For additional information regarding our variable interest rate debt, see Part II, Item 8, Note 6, Debt, of the Notes to Consolidated Financial Statements included in this Annual Report on Form 10-K.
Item 8. Financial Statements and Supplementary Data
Index to Financial Statements and Financial Statement Schedule
| PAGE NO. | |
| Consolidated Financial Statements: | |
| Report of Independent Registered Public Accounting Firm | 48 |
| Consolidated Balance Sheets — As of June 28, 2019 and June 29, 2018 | 50 |
| Consolidated Statements of Operations — Three Years Ended June 28, 2019 | 51 |
| Consolidated Statements of Comprehensive Income (Loss) — Three Years Ended June 28, 2019 | 52 |
| Consolidated Statements of Cash Flows — Three Years Ended June 28, 2019 | 53 |
| Consolidated Statements of Shareholders' Equity — Three Years Ended June 28, 2019 | 54 |
| Notes to Consolidated Financial Statements | 55 |
Report of Independent Registered Public Accounting Firm
To the Shareholders and Board of Directors
Western Digital Corporation:
Opinions on the Consolidated Financial Statements and Internal Control Over Financial Reporting
We have audited the accompanying consolidated balance sheets of Western Digital Corporation and subsidiaries (the Company) as of June 28, 2019 and June 29, 2018, the related consolidated statements of operations, comprehensive income (loss), shareholders’ equity, and cash flows for each of the years in the three-year period ended June 28, 2019, and the related notes (collectively, the consolidated financial statements). We also have audited the Company’s internal control over financial reporting as of June 28, 2019, based on criteria established in Internal Control - Integrated Framework (2013) issued by the Committee of Sponsoring Organizations of the Treadway Commission.
In our opinion, the consolidated financial statements referred to above present fairly, in all material respects, the financial position of the Company as of June 28, 2019 and June 29, 2018, and the results of its operations and its cash flows for each of the years in the three-year period ended June 28, 2019, in conformity with U.S. generally accepted accounting principles. Also in our opinion, the Company maintained, in all material respects, effective internal control over financial reporting as of June 28, 2019, based on criteria established in Internal Control - Integrated Framework (2013) issued by the Committee of Sponsoring Organizations of the Treadway Commission.
Basis for Opinions
The Company’s management is responsible for these consolidated financial statements, for maintaining effective internal control over financial reporting, and for its assessment of the effectiveness of internal control over financial reporting, included in the accompanying Item 9A, Management’s Report on Internal Control over Financial Reporting. Our responsibility is to express an opinion on the Company’s consolidated financial statements and an opinion on the Company’s internal control over financial reporting based on our audits. We are a public accounting firm registered with the Public Company Accounting Oversight Board (United States) (PCAOB) and are required to be independent with respect to the Company in accordance with the U.S. federal securities laws and the applicable rules and regulations of the Securities and Exchange Commission and the PCAOB.
We conducted our audits in accordance with the standards of the PCAOB. Those standards require that we plan and perform the audits to obtain reasonable assurance about whether the consolidated financial statements are free of material misstatement, whether due to error or fraud, and whether effective internal control over financial reporting was maintained in all material respects.
Our audits of the consolidated financial statements included performing procedures to assess the risks of material misstatement of the consolidated financial statements, whether due to error or fraud, and performing procedures that respond to those risks. Such procedures included examining, on a test basis, evidence regarding the amounts and disclosures in the consolidated financial statements. Our audits also included evaluating the accounting principles used and significant estimates made by management, as well as evaluating the overall presentation of the consolidated financial statements. Our audit of internal control over financial reporting included obtaining an understanding of internal control over financial reporting, assessing the risk that a material weakness exists, and testing and evaluating the design and operating effectiveness of internal control based on the assessed risk. Our audits also included performing such other procedures as we considered necessary in the circumstances. We believe that our audits provide a reasonable basis for our opinions.
Definition and Limitations of Internal Control Over Financial Reporting
A company’s internal control over financial reporting is a process designed to provide reasonable assurance regarding the reliability of financial reporting and the preparation of financial statements for external purposes in accordance with generally accepted accounting principles. A company’s internal control over financial reporting includes those policies and procedures that (1) pertain to the maintenance of records that, in reasonable detail, accurately and fairly reflect the transactions and dispositions of the assets of the company; (2) provide reasonable assurance that transactions are recorded as necessary to permit preparation of financial statements in accordance with generally accepted accounting principles, and that receipts and expenditures of the company are being made only in accordance with authorizations of management and directors of the company; and (3) provide reasonable assurance regarding prevention or timely detection of unauthorized acquisition, use, or disposition of the company’s assets that could have a material effect on the financial statements.
Because of its inherent limitations, internal control over financial reporting may not prevent or detect misstatements. Also, projections of any evaluation of effectiveness to future periods are subject to the risk that controls may become inadequate because of changes in conditions, or that the degree of compliance with the policies or procedures may deteriorate.
| /s/ KPMG LLP |
We have served as the Company’s auditor since 1970.
Irvine, California
August 27, 2019
WESTERN DIGITAL CORPORATION
CONSOLIDATED BALANCE SHEETS
(in millions, except par value)
| June 28, 2019 | June 29, 2018 | ||||||
| ASSETS | |||||||
| Current assets: | |||||||
| Cash and cash equivalents | $ | 3,455 | $ | 5,005 | |||
| Accounts receivable, net | 1,204 | 2,197 | |||||
| Inventories | 3,283 | 2,944 | |||||
| Other current assets | 535 | 492 | |||||
| Total current assets | 8,477 | 10,638 | |||||
| Property, plant and equipment, net | 2,843 | 3,095 | |||||
| Notes receivable and investments in Flash Ventures | 2,791 | 2,105 | |||||
| Goodwill | 10,076 | 10,075 | |||||
| Other intangible assets, net | 1,711 | 2,680 | |||||
| Other non-current assets | 472 | 642 | |||||
| Total assets | $ | 26,370 | $ | 29,235 | |||
| LIABILITIES AND SHAREHOLDERS’ EQUITY | |||||||
| Current liabilities: | |||||||
| Accounts payable | $ | 1,567 | $ | 2,265 | |||
| Accounts payable to related parties | 331 | 259 | |||||
| Accrued expenses | 1,296 | 1,274 | |||||
| Accrued compensation | 347 | 479 | |||||
| Current portion of long-term debt | 276 |
Showing the first 8K of 238K characters. Open the full section
Item 9. Changes in and Disagreements With Accountants on Accounting and Financial Disclosure
None.
Item 9A. Controls and Procedures
Evaluation of Disclosure Controls and Procedures
As required by SEC Rule 13a‑15(b) of the Securities Exchange Act of 1934, as amended (the “Exchange Act”), we carried out an evaluation, under the supervision and with the participation of our management, including our Chief Executive Officer and Chief Financial Officer, of the effectiveness of the design and operation of our disclosure controls and procedures (as such term is defined in Rule 13a-15(e) under the Exchange Act) as of the end of the period covered by this Annual Report on Form 10‑K.
Based on that evaluation, our Chief Executive Officer and Chief Financial Officer concluded that, as of the end of the period covered by this Annual Report on Form 10‑K, our disclosure controls and procedures were effective.
Management’s Report on Internal Control over Financial Reporting
Our management is responsible for establishing and maintaining adequate internal control over financial reporting (as defined in Rules 13a‑15(f) and 15d‑15(f) of the Exchange Act) to provide reasonable assurance regarding the reliability of our financial reporting and the preparation of financial statements for external purposes in accordance with generally accepted accounting principles. Internal control over financial reporting includes those policies and procedures that (i) pertain to the maintenance of records that in reasonable detail accurately and fairly reflect the transactions and dispositions of our assets; (ii) provide reasonable assurance that the transactions are recorded as necessary to permit preparation of financial statements in accordance with generally accepted accounting principles, and that our receipts and expenditures are being made only in accordance with authorizations of our management and our directors; and (iii) provide reasonable assurance regarding prevention or timely detection of unauthorized acquisition, use or disposition of our assets that could have a material effect on the financial statements.
Our management evaluated the effectiveness of our internal control over financial reporting using the criteria set forth by the Committee of Sponsoring Organizations of the Treadway Commission (COSO) in Internal Control — Integrated Framework (2013). Based on this evaluation, our management concluded that our internal control over financial reporting was effective as of the end of the period covered by this Annual Report on Form 10‑K. KPMG LLP, our independent registered public accounting firm, which audited the Consolidated Financial Statements included in this Annual Report on Form 10‑K, has issued an audit report on our internal control over financial reporting. See Report of Independent Registered Public Accounting Firm herein.
Changes in Internal Control over Financial Reporting
There has been no change in our internal control over financial reporting during the fourth fiscal quarter ended June 28, 2019, that has materially affected, or is reasonably likely to materially affect, our internal control over financial reporting.
We are implementing an enterprise resource planning (“ERP”) system on a worldwide basis, which is expected to improve the efficiency of certain financial and related transactional processes. The gradual implementation is expected to occur in phases over the next several years. We have completed the implementation of certain processes, including the financial consolidation and reporting, fixed assets, supplier management and indirect procure-to-pay processes, and have revised and updated the related controls. These changes did not materially affect our internal control over financial reporting. As we implement the remaining functionality under this ERP system over the next several years, we will continue to assess the impact on our internal control over financial reporting.
Inherent Limitations of Effectiveness of Controls
Our management, including our Chief Executive Officer and our Chief Financial Officer, does not expect our internal controls over financial reporting will prevent all error and all fraud. A control system, no matter how well conceived and operated, can provide only reasonable, not absolute, assurance that the objectives of the control system are met. Further, the benefits of controls must be considered relative to their costs. Because of the inherent limitations in a system of internal control over financial reporting, no evaluation of controls can provide absolute assurance that all control issues and instances of fraud, if any, have been detected. These inherent limitations include the realities that judgments in decision-making can be faulty, and that breakdowns can occur because of simple error or mistake. Additionally, controls can be circumvented by the individual acts of some persons, by collusion of two or more people, or by management override of the control. The design of any system of controls is also based in part upon certain assumptions about the likelihood of future events, and there can be no assurance that any design will succeed in achieving its stated goals under all potential future conditions. Because of the inherent limitations in a cost-effective control system, misstatements due to error or fraud may occur and not be detected.
Item 9B. Other Information
None.
PART III
Item 10. Director, Executive Officers and Corporate Governance
There is incorporated herein by reference the information required by this Item included in the Company’s Proxy Statement for the 2019 Annual Meeting of Stockholders, which will be filed with the SEC no later than 120 days after the close of the fiscal year ended June 28, 2019. In addition, our Board of Directors has adopted a Code of Business Ethics that applies to all of our directors, employees and officers, including our Chief Executive Officer and Chief Financial Officer. The current version of the Code of Business Ethics is available on our website under the Corporate Governance section at www.wdc.com. To the extent required by rules adopted by the SEC and The Nasdaq Stock Market LLC, we intend to promptly disclose future amendments to certain provisions of the Code of Business Ethics, or waivers of such provisions granted to executive officers and directors, on our website under the Corporate Governance section at www.wdc.com.
Item 11. Executive Compensation
There is incorporated herein by reference the information required by this Item included in the Company’s Proxy Statement for the 2019 Annual Meeting of Stockholders, which will be filed with the SEC no later than 120 days after the close of the fiscal year ended June 28, 2019.
Item 12. Security Ownership of Certain Beneficial Owners and Management and Related Stockholder Matters
There is incorporated herein by reference the information required by this Item included in the Company’s Proxy Statement for the 2019 Annual Meeting of Stockholders, which will be filed with the SEC no later than 120 days after the close of the fiscal year ended June 28, 2019.
Item 13. Certain Relationships and Related Transactions, and Director Independence
There is incorporated herein by reference the information required by this Item included in the Company’s Proxy Statement for the 2019 Annual Meeting of Stockholders, which will be filed with the SEC no later than 120 days after the close of the fiscal year ended June 28, 2019.
Item 14. Principal Accounting Fees and Services
There is incorporated herein by reference the information required by this Item included in the Company’s Proxy Statement for the 2019 Annual Meeting of Stockholders, which will be filed with the SEC no later than 120 days after the close of the fiscal year ended June 28, 2019.
PART IV
Item 15. Exhibits, Financial Statement Schedules
The following documents are filed as a part of this Annual Report on Form 10‑K:
| (1) | Financial Statements. The financial statements included in Part II, Item 8 of this document are filed as part of this Annual Report on Form 10‑K. |
| (2) | Financial Statement Schedules. |
All schedules are omitted as the required information is immaterial, inapplicable or the information is presented in the Consolidated Financial Statements or related Notes.
| (3) | Exhibits. The exhibits listed in the Exhibit Index below are filed with, or incorporated by reference in, this Annual Report on Form 10‑K, as specified in the Exhibit List, from exhibits previously filed with the SEC. Certain agreements listed in the Exhibit List that we have filed or incorporated by reference may contain representations and warranties by us or our subsidiaries. These representations and warranties have been made solely for the benefit of the other party or parties to such agreements and (i) may have been qualified by disclosures made to such other party or parties, (ii) were made only as of the date of such agreements or such other date(s) as may be specified in such agreements and are subject to more recent developments, which may not be fully reflected in our public disclosures, (iii) may reflect the allocation of risk among the parties to such agreements and (iv) may apply materiality standards different from what may be viewed as material to investors. Accordingly, these representations and warranties may not describe the actual state of affairs at the date hereof and should not be relied upon. |
EXHIBIT INDEX
| Exhibit Number | Description | |
| 3.1 | Amended and Restated Certificate of Incorporation of Western Digital Corporation, as amended to date (Filed as Exhibit 3.1 to the Company’s Quarterly Report on Form 10-Q (File No. 1-08703) with the Securities and Exchange Commission on February 8, 2006) | |
| 3.2 | Amended and Restated By-Laws of Western Digital Corporation, as amended effective as of May 2, 2018 (Filed as Exhibit 3.1 to the Company’s Current Report on Form 8-K (File No. 1-08703) with the Securities and Exchange Commission on May 7, 2018) | |
| 4.1 | Description of Western Digital Corporation’s Capital Stock† | |
| 4.2 | Indenture (including Form of 0.5% Convertible Senior Notes due 2020), dated as of October 29, 2013, by and between SanDisk Corporation and The Bank of New York Mellon Trust Company, N.A. (Filed as Exhibit 4.1 to SanDisk Corporation’s Current Report on Form 8-K (File No. 000-26734) with the Securities and Exchange Commission on October 29, 2013) | |
| 4.3 | First Supplemental Indenture to the Indenture filed as Exhibit 4.2 hereto, dated as of May 12, 2016, among SanDisk Corporation, The Bank of New York Mellon Trust Company, N.A., as trustee, and Western Digital Corporation (Filed as Exhibit 4.1 to the Company’s Current Report on Form 8-K (File No. 1-08703) with the Securities and Exchange Commission on May 12, 2016) | |
| 4.4 | Indenture (including Form of 4.750% Senior Notes due 2026), dated as of February 13, 2018, among Western Digital Corporation; HGST, Inc., WD Media, LLC, Western Digital (Fremont), LLC and Western Digital Technologies, Inc., as guarantors; and U.S. Bank National Association, as trustee (Filed as Exhibit 4.1 to the Company’s Current Report on Form 8-K (File No. 333-222762) with the Securities and Exchange Commission on February 13, 2018) | |
| 4.5 | Indenture (including Form of 1.50% Convertible Senior Notes due 2024), dated as of February 13, 2018, among Western Digital Corporation; HGST, Inc., WD Media, LLC, Western Digital (Fremont), LLC and Western Digital Technologies, Inc., as guarantors; and U.S. Bank National Association, as trustee (Filed as Exhibit 4.2 to the Company’s Current Report on Form 8-K (File No. 333-222762) with the Securities and Exchange Commission on February 13, 2018) | |
| 10.1 | Western Digital Corporation Amended and Restated 2017 Performance Incentive Plan (formerly named the Western Digital Corporation Amended and Restated 2004 Performance Incentive Plan), amended and restated as of August 2, 2018 (Filed as Exhibit 10.1 to the Company’s Current Report on Form 8-K (File No. 1-08703) with the Securities and Exchange Commission on November 7, 2018)* | |
| 10.1.1 | Form of Notice of Grant of Stock Option and Option Agreement - Executives, under the Western Digital Corporation 2017 Performance Incentive Plan (Filed as Exhibit 10.1.1 to the Company’s Quarterly Report on Form 10-Q (File No. 1-08703) with the Securities and Exchange Commission on February 6, 2018)* | |
| 10.1.2 | Form of Notice of Grant of Stock Option and Option Agreement - Non-Executives, under the Western Digital Corporation 2017 Performance Incentive Plan (Filed as Exhibit 10.1.2 to the Company’s Quarterly Report on Form 10-Q (File No. 1-08703) with the Securities and Exchange Commission on February 6, 2018)* | |
| 10.1.3 | Form of Notice of Grant of Stock Units and Stock Unit Award Agreement - Executives, under the Western Digital Corporation 2017 Performance Incentive Plan (Filed as Exhibit 10.1.3 to the Company’s Quarterly Report on Form 10-Q (File No. 1-08703) with the Securities and Exchange Commission on February 6, 2018)* | |
| 10.1.4 | Form of Notice of Grant of Stock Units and Stock Unit Award Agreement, under the Western Digital Corporation 2017 Performance Incentive Plan (Filed as Exhibit 10.1.4 to the Company’s Quarterly Report on Form 10-Q (File No. 1-08703) with the Securities and Exchange Commission on February 6, 2018)* | |
| 10.1.5 | Form of Notice of Grant of Performance Stock Units and Performance Stock Unit Award Agreement - Executives, under the Western Digital Corporation 2017 Performance Incentive Plan (Filed as Exhibit 10.1.5 to the Company’s Quarterly Report on Form 10-Q (File No. 1-08703) with the Securities and Exchange Commission on February 6, 2018)* | |
| 10.1.6 | Form of Notice of Grant of Performance Stock Units and Performance Stock Unit Award Agreement - Financial Measures, under the Western Digital Corporation 2017 Performance Incentive Plan (Filed as Exhibit 10.1 to the Company’s Quarterly Report on Form 10-Q (File No. 1-08703) with the Securities and Exchange Commission on November 6, 2018)* | |
| 10.1.7 | Form of Notice of Grant of Performance Stock Units and Performance Stock Unit Award Agreement - TSR Measure, under the Western Digital Corporation 2017 Performance Incentive Plan (Filed as Exhibit 10.2 to the Company’s Quarterly Report on Form 10-Q (File No. 1-08703) with the Securities and Exchange Commission on November 6, 2018)* | |
| 10.1.8 | Form of Notice of Grant of Stock Option and Option Agreement - Executives, as amended on November 3, 2015, under the Western Digital Corporation Amended and Restated 2004 Performance Incentive Plan (now named the Western Digital Corporation 2017 Performance Incentive Plan) (Filed as Exhibit 10.1.1 to the Company’s Quarterly Report on Form 10-Q (File No. 1-08703) with the Securities and Exchange Commission on February 10, 2016)* | |
| 10.1.9 | Form of Notice of Grant of Stock Option and Option Agreement - Non-Executives, as amended on November 3, 2015, under the Western Digital Corporation Amended and Restated 2004 Performance Incentive Plan (now named the Western Digital Corporation 2017 Performance Incentive Plan) (Filed as Exhibit 10.1.2 to the Company’s Quarterly Report on Form 10-Q (File No. 1-08703) with the Securities and Exchange Commission on February 10, 2016)* | |
| 10.1.10 | Form of Notice of Grant of Stock Units and Stock Unit Award Agreement - Executives, as amended on November 3, 2015, under the Western Digital Corporation Amended and Restated 2004 Performance Incentive Plan (now named the Western Digital Corporation 2017 Performance Incentive Plan) (Filed as Exhibit 10.1.3 to the Company’s Quarterly Report on Form 10-Q (File No. 1-08703) with the Securities and Exchange Commission on February 10, 2016)* |
| Exhibit Number | Description | |
| 10.1.11 | Form of Notice of Grant of Stock Units and Stock Unit Award Agreement, as amended on November 3, 2015, under the Western Digital Corporation Amended and Restated 2004 Performance Incentive Plan (now named the Western Digital Corporation 2017 Performance Incentive Plan) (Filed as Exhibit 10.1.4 to the Company’s Quarterly Report on Form 10-Q (File No. 1-08703) with the Securities and Exchange Commission on February 10, 2016)* | |
| 10.1.12 | Form of Notice of Grant of Performance Stock Units and Performance Stock Unit Award Agreement for Mark Long, dated September 17, 2015, under the Western Digital Corporation Amended and Restated 2004 Performance Incentive Plan (now named the Western Digital Corporation 2017 Performance Incentive Plan) (Filed as Exhibit 10.2 to the Company’s Quarterly Report on Form 10-Q (File No. 1-08703) with the Securities and Exchange Commission on November 10, 2015)* | |
| 10.1.13 | Form of Notice of Grant of Performance Stock Units and Performance Stock Unit Award Agreement (revised March 2016) under the Western Digital Corporation Amended and Restated 2004 Performance Incentive Plan (now named the Western Digital Corporation 2017 Performance Incentive Plan) (Filed as Exhibit 10.1 to the Company’s Quarterly Report on Form 10-Q (File No. 1-08703) with the Securities and Exchange Commission on May 9, 2016)* | |
| 10.1.14 | Western Digital Corporation Amended and Restated 2004 Performance Incentive Plan (now named the Western Digital Corporation 2017 Performance Incentive Plan) Non-Employee Director Option Grant Program, as amended September 6, 2012, and Form of Notice of Grant of Stock Option and Option Agreement - Non-Employee Directors (Filed as Exhibit 10.5 to the Company’s Quarterly Report on Form 10-Q (File No. 1-08703) with the Securities and Exchange Commission on November 2, 2012)* | |
| 10.1.15 | Western Digital Corporation 2017 Performance Incentive Plan Non-Employee Director Restricted Stock Unit Grant Program, as amended November 1, 2017 (Filed as Exhibit 10.2 to the Company’s Quarterly Report on Form 10-Q (File No. 1-08703) with the Securities and Exchange Commission on February 6, 2018)* | |
| 10.1.16 | Form of Notice of Grant of Restricted Stock Units and Restricted Stock Unit Award Agreement - Vice President and Above under the Western Digital Corporation 2017 Performance Incentive Plan (Filed as Exhibit 10.3 to the Company’s Quarterly Report on Form 10-Q (File No. 1-08703) with the Securities and Exchange Commission on November 6, 2018)* | |
| 10.1.17 | Form of Notice of Grant of Restricted Stock Units and Restricted Stock Unit Award Agreement under the Western Digital Corporation 2017 Performance Incentive Plan (Filed as Exhibit 10.4 to the Company’s Quarterly Report on Form 10-Q (File No. 1-08703) with the Securities and Exchange Commission on November 6, 2018)* | |
| 10.1.18 | Western Digital Corporation Incentive Compensation Plan, as Amended and Restated August 5, 2015 (Filed as Exhibit 10.1.8 to the Company’s Annual Report on Form 10‑K (File No. 1-08703) with the Securities and Exchange Commission on August 21, 2015)* | |
| 10.2 | Western Digital Corporation Amended and Restated 2005 Employee Stock Purchase Plan, as amended August 2, 2018 (Filed as Exhibit 10.2 to the Company’s Current Report on Form 8-K (File No. 1-08703) with the Securities and Exchange Commission on November 7, 2018)* | |
| 10.3 | SanDisk Corporation 2013 Incentive Plan (Filed as Exhibit 4.2 to the Company’s Registration Statement on Form S-8 (File No. 333-211420) with the Securities and Exchange Commission on May 17, 2016)* | |
| 10.4 | Amended and Restated Deferred Compensation Plan, amended and restated effective January 1, 2013 (Filed as Exhibit 10.4 to the Company’s Annual Report on Form 10-Q (File No. 1-08703) with the Securities and Exchange Commission on November 2, 2012)* | |
| 10.5 | Western Digital Corporation Amended and Restated Change of Control Severance Plan, amended and restated as of November 3, 2015 (Filed as Exhibit 10.2 to the Company’s Current Report on Form 8-K (File No. 1-08703) with the Securities and Exchange Commission on November 5, 2015)* | |
| 10.6 | Western Digital Corporation Executive Severance Plan, amended and restated as of February 2, 2017 (Filed as Exhibit 10.3 to the Company’s Quarterly Report on Form 10-Q (File No. 1-08703) with the Securities and Exchange Commission on February 7, 2017)* | |
| 10.7 | Form of Indemnity Agreement for Directors of Western Digital Corporation (Filed as Exhibit 10.4 to the Company’s Quarterly Report on Form 10-Q (File No. 1-08703) with the Securities and Exchange Commission on November 8, 2002)* | |
| 10.8 | Form of Indemnity Agreement for Officers of Western Digital Corporation (Filed as Exhibit 10.5 to the Company’s Quarterly Report on Form 10-Q (File No. 1-08703) with the Securities and Exchange Commission on November 8, 2002)* | |
| 10.9 | Form of Indemnification Agreement entered into between SanDisk Corporation and its directors and officers (Filed as Exhibit 10.10 to the Company’s Annual Report on Form 10-K (File No. 1-08703) with the Securities and Exchange Commission on August 24, 2018)* | |
| 10.10 | Offer Letter, dated as of April 1, 2019, to Robert Eulau (Filed as Exhibit 10.1 to the Company’s Quarterly Report on Form 10-Q (File No. 1-08703) with the Securities and Exchange Commission on May 7, 2019)* | |
| 10.11 | Severance Agreement, dated as of June 15, 2019, by and between Western Digital Corporation and Mark Long*† | |
| 10.12 | Loan Agreement, dated as of April 29, 2016, by and among Western Digital Corporation, JPMorgan Chase Bank, N.A., as administrative agent and collateral agent, and the lenders and financial institutions from time to time party thereto (Filed as Exhibit 10.4 to the Company’s Quarterly Report on Form 10-Q (File No. 1-08703) with the Securities and Exchange Commission on May 9, 2016) | |
| 10.12.1 | Amendment No. 1, dated as of August 17, 2016, to the Loan Agreement dated as of April 29, 2016, by and among Western Digital Corporation, JPMorgan Chase Bank, N.A., as administrative agent and collateral agent, the lenders party thereto and the other loan parties thereto (Filed as Exhibit 10.1 to the Company’s Current Report on Form 8-K (File No. 1-08703) with the Securities and Exchange Commission on August 18, 2016) |
| Exhibit Number | Description | |
| 10.12.2 | Amendment No. 2, dated as of September 22, 2016, to the Loan Agreement dated as of April 29, 2016, by and among Western Digital Corporation, JPMorgan Chase Bank, N.A., as administrative agent and collateral agent, the lenders party thereto and the other loan parties thereto (Filed as Exhibit 10.1 to the Company’s Current Report on Form 8-K (File No. 1-08703) with the Securities and Exchange Commission on September 22, 2016) | |
| 10.12.3 | Amendment No. 3, dated as of March 14, 2017, to the Loan Agreement dated as of April 29, 2016, by and among Western Digital Corporation, JPMorgan Chase Bank, N.A., as administrative agent and collateral agent, the lenders party thereto and the other loan parties thereto (Filed as Exhibit 10.1 to the Company’s Current Report on Form 8-K (File No. 1-08703) with the Securities and Exchange Commission on March 14, 2017) | |
| 10.12.4 | Amendment No. 4, dated as of March 23, 2017, to the Loan Agreement dated as of April 29, 2016, by and among Western Digital Corporation, JPMorgan Chase Bank, N.A., as administrative agent and collateral agent, the lenders party thereto and the other loan parties thereto (Filed as Exhibit 10.1 to the Company’s Current Report on Form 8-K (File No. 1-08703) with the Securities and Exchange Commission on March 23, 2017) | |
| 10.12.5 | Amendment No. 5, dated as of November 8, 2017, to the Loan Agreement dated as of April 29, 2016, by and among Western Digital Corporation, JPMorgan Chase Bank, N.A., as administrative agent and collateral agent, the lenders party thereto and the other loan parties thereto (Filed as Exhibit 10.1 to the Company’s Current Report on Form 8-K (File No. 1-08703) with the Securities and Exchange Commission on November 8, 2017) | |
| 10.12.6 | Amendment No. 6, dated as of November 29, 2017, to the Loan Agreement dated as of April 29, 2016, by and among Western Digital Corporation, JPMorgan Chase Bank, N.A., as administrative agent and collateral agent, the lenders party thereto and the other loan parties thereto (Filed as Exhibit 10.1 to the Company’s Current Report on Form 8-K (File No. 1-08703) with the Securities and Exchange Commission on November 29, 2017) | |
| 10.12.7 | Amendment No. 7, dated as of February 27, 2018, to the Loan Agreement dated as of April 29, 2016, by and among Western Digital Corporation, JPMorgan Chase Bank, N.A., as administrative agent and collateral agent, the lenders party thereto and the other loan parties thereto (Filed as Exhibit 10.1 to the Company’s Current Report on Form 8-K (File No. 1-08703) with the Securities and Exchange Commission on February 27, 2018) | |
| 10.12.8 | Amendment No. 8, dated as of May 15, 2018, to the Loan Agreement dated as of April 29, 2016, by and among Western Digital Corporation, JPMorgan Chase Bank, N.A., as administrative agent and collateral agent, the lenders party thereto and the other loan parties thereto (Filed as Exhibit 10.1 to the Company’s Current Report on Form 8-K (File No. 1-08703) with the Securities and Exchange Commission on May 15, 2018) | |
| 10.12.9 | Amendment No. 9, dated as of April 29, 2019, to the Loan Agreement dated as of April 29, 2016, by and among Western Digital Corporation, JPMorgan Chase Bank, N.A., as administrative agent and collateral agent, the lenders party thereto and the other loan parties thereto (Filed as Exhibit 10.2 to the Company’s Quarterly Report on Form 10-Q (File No. 000-26734) with the Securities and Exchange Commission on May 7, 2019) | |
| 10.13 | Guaranty Agreement, dated as of April 29, 2016, by and among Western Digital Corporation, the subsidiary guarantors party thereto and JPMorgan Chase Bank, N.A., as administrative agent for the guaranteed creditors (Filed as Exhibit 10.2 to the Company’s Current Report on Form 8-K (File No.1-08703) with the Securities and Exchange Commission on April 29, 2016) | |
| 10.14 | Security Agreement, dated as of May 12, 2016, by and among the debtors (as defined therein) party thereto and JPMorgan Chase Bank, N.A., as collateral agent (Filed as Exhibit 10.2 to the Company’s Current Report on Form 8-K (File No. 1-08703) with the Securities and Exchange Commission on May 12, 2016) | |
| 10.15 | Flash Alliance Master Agreement, dated as of July 7, 2006, by and among SanDisk Corporation, Toshiba Corporation and SanDisk (Ireland) Limited (Filed as Exhibit 10.1 to SanDisk Corporation’s Quarterly Report on Form 10-Q (File No. 000-26734) with the Securities and Exchange Commission on November 8, 2006)# | |
| 10.16 | Operating Agreement of Flash Alliance, Ltd., dated as of July 7, 2006, by and between Toshiba Corporation and SanDisk (Ireland) Limited (Filed as Exhibit 10.2 to SanDisk Corporation’s Quarterly Report on Form 10-Q (File No. 000-26734) with the Securities and Exchange Commission on November 8, 2006)# | |
| 10.17 | Joint Venture Restructure Agreement, dated as of January 29, 2009, by and among SanDisk Corporation, SanDisk (Ireland) Limited, SanDisk (Cayman) Limited, Toshiba Corporation, Flash Partners Limited and Flash Alliance Limited (Filed as Exhibit 10.1 to SanDisk Corporation’s Quarterly Report on Form 10-Q (File No. 000-26734) with the Securities and Exchange Commission on May 7, 2009)# | |
| 10.18 | New Y2 Facility Agreement, dated October 20, 2015, by and among SanDisk Corporation, SanDisk (Ireland) Limited, SanDisk (Cayman) Limited, SanDisk Flash B.V., Toshiba Corporation, Flash Partners Limited, Flash Alliance Limited and Flash Forward Limited (Filed as Exhibit 10.37 to SanDisk Corporation’s Annual Report on Form 10‑K (File No. 000-26734) with the Securities and Exchange Commission on February 12, 2016)# | |
| 10.19 | FAL Commitment and Extension Agreement, dated as of December 12, 2017, by and among Western Digital Corporation, SanDisk LLC, SanDisk (Ireland) Limited and Toshiba Memory Corporation (Filed as Exhibit 10.6 to the Company’s Quarterly Report on Form 10-Q (File No. 1-08703) with the Securities and Exchange Commission on February 6, 2018)# | |
| 10.20 | Y6 Facility Agreement, dated as of December 12, 2017, by and among Western Digital Corporation, SanDisk LLC, SanDisk (Cayman) Limited, SanDisk (Ireland) Limited, SanDisk Flash B.V., Flash Partners, Ltd., Flash Alliance, Ltd., Flash Forward, Ltd. and Toshiba Memory Corporation (Filed as Exhibit 10.7 to the Company’s Quarterly Report on Form 10-Q (File No. 1-08703) with the Securities and Exchange Commission on February 6, 2018)# | |
| 10.21 | K1 Facility Agreement, dated as of May 15, 2019, by and among Western Digital, SanDisk LLC, SanDisk (Cayman) Limited, SanDisk (Ireland) Limited, SanDisk Flash B.V., Flash Partners, Ltd., Flash Alliance, Ltd., Flash Forward Ltd., Toshiba Memory Corporation and Toshiba Memory Corporation Iwate†## |
| Exhibit Number | Description | |
| 10.22 | Confidential Settlement and Mutual Release Agreement, dated as of December 12, 2017, by and among Western Digital Corporation, SanDisk LLC, SanDisk (Cayman) Limited, SanDisk (Ireland) Limited, SanDisk Flash B.V., Toshiba Corporation and Toshiba Memory Corporation (Filed as Exhibit 10.8 to the Company’s Quarterly Report on Form 10-Q (File No. 1-08703) with the Securities and Exchange Commission on February 6, 2018)# | |
| 10.23 | Confidential Settlement and Mutual Release Agreement, dated as of December 12, 2017, by and among Western Digital Corporation, SanDisk LLC, SanDisk (Cayman) Limited, SanDisk (Ireland) Limited, SanDisk Flash B.V., Bain Capital Private Equity, L.P., BCPE Pangea Cayman, L.P., BCPE Pangea Cayman2, Ltd., Bain Capital Fund XII, L.P., Bain Capital Asia Fund III, L.P. and K.K. Pangea (Filed as Exhibit 10.9 to the Company’s Quarterly Report on Form 10-Q (File No. 1-08703) with the Securities and Exchange Commission on February 6, 2018)# | |
| 21 | Subsidiaries of Western Digital Corporation† | |
| 23 | Consent of Independent Registered Public Accounting Firm† | |
| 31.1 | Certification of Principal Executive Officer Pursuant to Section 302 of the Sarbanes-Oxley Act of 2002† | |
| 31.2 | Certification of Principal Financial Officer Pursuant to Section 302 of the Sarbanes-Oxley Act of 2002† | |
| 32.1 | Certification of Chief Executive Officer Pursuant to 18 U.S.C. Section 1350, as adopted pursuant to Section 906 of the Sarbanes-Oxley Act of 2002** | |
| 32.2 | Certification of Chief Financial Officer Pursuant to 18 U.S.C. Section 1350, as adopted pursuant to Section 906 of the Sarbanes-Oxley Act of 2002** | |
| 101.INS | XBRL Instance Document† | |
| 101.SCH | XBRL Taxonomy Extension Schema Document† | |
| 101.CAL | XBRL Taxonomy Extension Calculation Linkbase Document† | |
| 101.LAB | XBRL Taxonomy Extension Label Linkbase Document† | |
| 101.PRE | XBRL Taxonomy Extension Presentation Linkbase Document† | |
| 101.DEF | XBRL Taxonomy Extension Definition Linkbase Document† |
| † | Filed with this report. |
| ** | Furnished with this report. |
| * | Management contract or compensatory plan or arrangement required to be filed as an exhibit pursuant to applicable rules of the Securities and Exchange Commission. |
| # | Pursuant to a request for confidential treatment, certain portions of this exhibit have been redacted from the publicly filed document and have been furnished separately to the Securities and Exchange Commission as required by Rule 24b-2 under the Securities Exchange Act of 1934, as amended. |
| ## | As permitted by Regulation S-K, Item 601(b)(10)(iv) of the Securities Exchange Act of 1934, as amended, certain confidential portions of this exhibit have been redacted from the publicly filed document. |
Item 16. Form 10‑K Summary
None.
SIGNATURES
Pursuant to the requirements of Section 13 or 15(d) of the Securities Exchange Act of 1934, the Registrant has duly caused this Annual Report on Form 10‑K to be signed on its behalf by the undersigned, thereunto duly authorized.
| WESTERN DIGITAL CORPORATION | ||
| By: | /s/ ROBERT K. EULAU | |
| Robert K. Eulau | ||
| Chief Financial Officer | ||
| (Principal Financial Officer and Principal Accounting Officer) |
Dated: August 27, 2019
Pursuant to the requirements of the Securities Exchange Act of 1934, this Annual Report on Form 10‑K has been signed below by the following persons on behalf of the Registrant and in the capacities and on the dates indicated.
| Signature | Title | Date | ||
| /s/ STEPHEN D. MILLIGAN | Chief Executive Officer, Director (Principal Executive Officer) | August 27, 2019 | ||
| Stephen D. Milligan | ||||
| /s/ ROBERT K. EULAU | Chief Financial Officer (Principal Financial Officer and Principal Accounting Officer) | August 27, 2019 | ||
| Robert K. Eulau | ||||
| /s/ MATTHEW E. MASSENGILL | Chairman of the Board | August 27, 2019 | ||
| Matthew E. Massengill | ||||
| /s/ KIMBERLY E. ALEXY | Director | August 27, 2019 | ||
| Kimberly E. Alexy | ||||
| /s/ MARTIN I. COLE | Director | August 27, 2019 | ||
| Martin I. Cole | ||||
| /s/ KATHLEEN A. COTE | Director | August 27, 2019 | ||
| Kathleen A. Cote | ||||
| /s/ HENRY T. DENERO | Director | August 27, 2019 | ||
| Henry T. DeNero | ||||
| /s/ TUNҪ DOLUCA | Director | August 27, 2019 | ||
| Tunҫ Doluca | ||||
| /s/ MICHAEL D. LAMBERT | Director | August 27, 2019 | ||
| Michael D. Lambert | ||||
| /s/ LEN J. LAUER | Director | August 27, 2019 | ||
| Len J. Lauer | ||||
| /s/ STEPHANIE A. STREETER | Director | August 27, 2019 | ||
| Stephanie A. Streeter |