 filings.tools
Welltower 10-K 2019-12-31
Filed 2020-02-14. 22 sections, 863K characters. Original on sec.gov · Markdown · JSON
Cover and table of contents
UNITED STATES SECURITIES AND EXCHANGE COMMISSION
Washington, D.C. 20549
FORM 10-K
☒ ANNUAL REPORT PURSUANT TO SECTION 13 OR 15(d) OF THE SECURITIES EXCHANGE ACT OF 1934
For the fiscal year ended December 31, 2019
☐ TRANSITION REPORT PURSUANT TO SECTION 13 OR 15(d) OF THE SECURITIES EXCHANGE ACT OF 1934
For the transition period from ____ to ____
Commission File Number 1-8923

WELLTOWER INC.
(Exact name of registrant as specified in its charter)
| Delaware | 34-1096634 | ||||
| (State or other jurisdiction of incorporation or organization) | (I.R.S. Employer Identification No.) | ||||
| 4500 Dorr Street, | Toledo, | Ohio | 43615 | ||
| (Address of principal executive offices) | (Zip Code) | ||||
(419) 247-2800
(Registrant’s telephone number, including area code)
Securities registered pursuant to Section 12(b) of the Act:
| Title of Each Class | Trading Symbol(s) | Name of Each Exchange on Which Registered |
| Common Stock, $1.00 par value | WELL | New York Stock Exchange |
| 4.800% Notes due 2028 | WELL28 | New York Stock Exchange |
| 4.500% Notes due 2034 | WELL34 | New York Stock Exchange |
Securities registered pursuant to Section 12(g) of the Act: None
Indicate by check mark if the registrant is a well-known seasoned issuer, as defined in Rule 405 of the Securities Act. Yes ☑ No ☐
Indicate by check mark if the registrant is not required to file reports pursuant to Section 13 or 15(d) of the Act. Yes ☐ No ☑
Indicate by check mark whether the registrant (1) has filed all reports required to be filed by Section 13 or 15(d) of the Securities Exchange Act of 1934 during the preceding 12 months (or for such shorter period that the registrant was required to file such reports), and (2) has been subject to such filing requirements for the past 90 days. Yes ☑ No ☐
Indicate by check mark whether the registrant has submitted electronically, every Interactive Data File required to be submitted pursuant to Rule 405 of Regulation S-T (§232.405 of this chapter) during the preceding 12 months (or for such shorter period that the registrant was required to submit such files). Yes ☑ No ☐
Indicate by check mark whether the registrant is a large accelerated filer, an accelerated filer, a non-accelerated filer, a smaller reporting company or an emerging growth company. See the definitions of “large accelerated filer,” “accelerated filer,” “smaller reporting company” and "emerging growth company" in Rule 12b-2 of the Exchange Act.
| Large accelerated filer | ☑ | Accelerated filer | ☐ | Non-accelerated filer | ☐ | Smaller reporting company | ☐ | Emerging growth company | ☐ |
If an emerging growth company, indicate by check mark if the registrant has elected not to use the extended transition period for complying with any new or revised financial accounting standards provided pursuant to Section 13(a) of the Exchange Act.
Indicate by check mark whether the registrant is a shell company (as defined in Rule 12b-2 of the Exchange Act). Yes ☐ No ☑
The aggregate market value of the shares of voting common stock held by non-affiliates of the registrant, computed by reference to the closing sales price of such shares on the New York Stock Exchange as of the last business day of the registrant’s most recently completed second fiscal quarter was $32,986,689,000.
As of January 31, 2020, the registrant had 410,331,441 shares of common stock outstanding.
DOCUMENTS INCORPORATED BY REFERENCE
Portions of the registrant’s definitive proxy statement for the annual stockholders’ meeting to be held April 30, 2020, are incorporated by reference into Part III.
WELLTOWER INC. AND SUBSIDIARIES
2019 FORM 10-K ANNUAL REPORT
TABLE OF CONTENTS
| Page | ||
| PART I | ||
| Item 1. | Business | 2 |
| Item 1A. | Risk Factors | 23 |
| Item 1B. | Unresolved Staff Comments | 35 |
| Item 2. | Properties | 36 |
| Item 3. | Legal Proceedings | 37 |
| Item 4. | Mine Safety Disclosures | 37 |
| PART II | ||
| Item 5. | Market for Registrant’s Common Equity, Related Stockholder Matters and Issuer Purchases of Equity Securities | 38 |
| Item 6. | Selected Financial Data | 39 |
| Item 7. | Management’s Discussion and Analysis of Financial Condition and Results of Operations | 40 |
| Item 7A. | Quantitative and Qualitative Disclosures About Market Risk | 60 |
| Item 8. | Financial Statements and Supplementary Data | 61 |
| Item 9. | Changes in and Disagreements with Accountants on Accounting and Financial Disclosure | 94 |
| Item 9A. | Controls and Procedures | 94 |
| Item 9B. | Other Information | 96 |
| PART III | ||
| Item 10. | Directors, Executive Officers and Corporate Governance | 97 |
| Item 11. | Executive Compensation | 97 |
| Item 12. | Security Ownership of Certain Beneficial Owners and Management and Related Stockholder Matters | 97 |
| Item 13. | Certain Relationships and Related Transactions and Director Independence | 97 |
| Item 14. | Principal Accounting Fees and Services | 97 |
| PART IV | ||
| Item 15. | Exhibits and Financial Statement Schedules | 98 |
| Item 16. | Form 10-K Summary | 102 |
| Signature | 103 |
PART I
Item 1. Business
General
Welltower Inc. (NYSE:WELL), an S&P 500 company headquartered in Toledo, Ohio, is driving the transformation of health care infrastructure. The company invests with leading seniors housing operators, post-acute providers and health systems to fund the real estate and infrastructure needed to scale innovative care delivery models and improve people’s wellness and overall health care experience. Welltower™, a real estate investment trust (“REIT”), owns interests in properties concentrated in major, high-growth markets in the United States (“U.S.”), Canada and the United Kingdom (“U.K.”), consisting of seniors housing, post-acute communities and outpatient medical properties. More information is available on the Internet at www.welltower.com. The information on our website is not incorporated by reference in this Annual Report on Form 10-K, and our web address is included as an inactive textual reference only.
Our primary objectives are to protect stockholder capital and enhance stockholder value. We seek to pay consistent cash dividends to stockholders and create opportunities to increase dividend payments to stockholders as a result of annual increases in net operating income and portfolio growth. To meet these objectives, we invest across the full spectrum of seniors housing and health care real estate and diversify our investment portfolio by property type, relationship and geographic location.
References herein to “we,” “us,” “our” or the “company” refer to Welltower Inc., a Delaware corporation, and its subsidiaries unless specifically noted otherwise.
Portfolio of Properties
Please see “Item 7 – Management’s Discussion and Analysis of Financial Condition and Results of Operation – Executive Summary – Company Overview” for a table that summarizes our portfolio as of December 31, 2019.
Property Types
We invest in seniors housing and health care real estate and evaluate our business through three reportable segments: Seniors Housing Operating, Triple-net and Outpatient Medical. For additional information regarding our segments, please see Note 18 to our consolidated financial statements. The accounting policies of the segments are the same as those described in the summary of significant accounting policies in Note 2 to our consolidated financial statements. The following is a summary of our various property types.
Seniors Housing Operating
Our seniors housing operating properties include seniors apartments, independent living and independent supportive living, continuing care retirement communities, assisted living, Alzheimer's/dementia care and include care homes with or without nursing (U.K.), which assist with activities of daily living that preserve a person's mobility and social systems to promote cognitive engagement. Our properties include stand-alone properties that provide one level of service, combination properties that provide multiple levels of service and communities or campuses that provide a wide range of services. Properties are primarily held in joint venture entities with operating partners. We utilize the structure authorized by the REIT Investment Diversification and Empowerment Act of 2007, which is commonly referred to as a “RIDEA” structure (the provisions of the Internal Revenue Code authorizing the RIDEA structure were enacted as part of the Housing and Economic Recovery Act of 2008).
Seniors Apartments Seniors apartments refer to age-restricted multi-unit housing with self-contained living units for older adults, usually aged 55+ who are able to care for themselves. Seniors apartments generally do not offer other additional services such as meals or transportation.
Independent Living and Independent Supportive Living (Canada) Independent living and independent supportive living refers to age-restricted, multifamily properties with central dining that provide residents access to meals and other services such as housekeeping, linen service, transportation and social and recreational activities.
Continuing Care Retirement Communities Continuing care retirement communities typically include a combination of detached homes and properties offering independent living, assisted living and/or long-term/post-acute care services on one campus. These communities appeal to residents because there is no need to relocate when health and medical needs change. Resident payment plans vary, but can include entrance fees, condominium fees and rental fees. Many of these communities also charge monthly maintenance fees in exchange for a living unit, meals and some health services.
Assisted Living Assisted living refers to state-regulated rental properties that provide independent living services, but also provide supportive care from trained employees to residents who require assistance with activities of daily living, including, but not limited to, management of medications, bathing, dressing, toileting, ambulating and eating.
Alzheimer’s/Dementia Care Certain properties offering assisted living may include state-licensed settings that specialize in caring for those afflicted with Alzheimer’s disease and/or other types of dementia.
Care Homes with or without Nursing (U.K.) Care homes without nursing, regulated by the Care Quality Commission ("CQC”), are rental properties that provide essentially the same services as U.S. assisted living. Care homes with nursing, also regulated by the CQC, are licensed daily rate or rental properties where most individuals require 24-hour nursing and/or medical care. Generally, these properties are licensed for various national and local reimbursement programs. Unlike the U.S., care homes with nursing in the U.K. generally do not provide post-acute care.
Our Seniors Housing Operating segment accounted for 67%, 69% and 65% of total revenues for the years ended December 31, 2019, 2018 and 2017, respectively. As of December 31, 2019, we had relationships with 25 operators to manage our seniors housing operating properties. In each instance, our partner provides management services to the properties pursuant to an incentive-based management contract. We rely on our partners to effectively and efficiently manage these properties. For the year ended December 31, 2019, our relationship with Sunrise Senior Living accounted for approximately 35% of our Seniors Housing Operating segment revenues and 24% of our total revenues.
Triple-net
Our triple-net properties offer services including independent living and independent supportive living (Canada), assisted living, continuing care retirement communities, Alzheimer's/dementia care and care homes with or without nursing (U.K.) described above, as well as long-term/post-acute care. We invest primarily through acquisitions, development and joint venture partnerships. Our properties are primarily leased to operators under long-term, triple-net master leases that obligate the tenant to pay all operating costs, utilities, real estate taxes, insurance, building repairs, maintenance costs and all obligations under certain ground leases. We are not involved in property management. Our properties include stand-alone properties that provide one level of service, combination facilities that provide multiple levels of service, and communities or campuses that provide a wide range of services.
Long-Term/Post-Acute Care Facilities Post-acute care is at the leading edge of reducing health care costs while improving quality. These high-impact centers help patients recover from illness or surgery with the goals of getting the patient home and healed faster and reducing hospital readmission rates. Our long-term/post-acute care properties generally offer skilled nursing/post-acute care, inpatient rehabilitation and long-term acute care services. Skilled nursing/post-acute care refers to licensed daily rate or rental properties where most individuals require 24-hour nursing and/or medical care. Generally, these properties are lice
Showing the first 8K of 130K characters. Open the full section
Item 1A. Risk Factors
This section highlights significant factors, events and uncertainties that could create risk with an investment in our securities. The events and consequences discussed in these risk factors could, in circumstances we may not be able to accurately predict, recognize or control, have a material adverse effect on our business, growth, reputation, prospects, financial condition, operating results, cash flows, liquidity, ability to pay dividends and stock price. These risk factors do not identify all risks that we face: our operations could also be affected by factors, events or uncertainties that are not presently known to us or that we currently do not consider to present significant risks to our operations. We group these risk factors into three categories:
| • | Risks arising from our business; |
| • | Risks arising from our capital structure; and |
| • | Risks arising from our status as a REIT. |
Risks Arising from Our Business
Our investments in and acquisitions of health care and seniors housing properties may be unsuccessful or fail to meet our expectations
We are exposed to the risk that some of our acquisitions may not prove to be successful. We could encounter unanticipated difficulties and expenditures relating to any acquired properties, including contingent liabilities, and acquired properties might require significant management attention that would otherwise be devoted to our ongoing business. If we agree to provide construction funding to an operator/tenant and the project is not completed, we may need to take steps to ensure completion of the project. Such expenditures may negatively affect our results of operations. Investments in and acquisitions of seniors housing and health care properties entail risks associated with real estate investments generally, including risks that the investment will not achieve expected returns, that the cost estimates for necessary property improvements will prove inaccurate or that the tenant, operator or manager will fail to meet performance expectations. Furthermore, there can be no assurance that our anticipated acquisitions and investments, the completion of which is subject to various conditions, will be consummated in accordance with anticipated timing, on anticipated terms, or at all. We may be unable to obtain or assume financing for acquisitions on favorable terms or at all. Health care properties are often highly customizable and the development or redevelopment of such properties may require costly tenant-specific improvements. We also may be unable to quickly and efficiently integrate new acquisitions, particularly acquisitions of portfolios of properties, into our existing operations, and this could have an adverse effect on our results of operations and financial condition. Acquired properties may be located in new markets, either within or outside the United States, where we may face risks associated with a lack of market knowledge or understanding of the local economy, lack of business relationships in the area, costs associated with opening a new regional office and unfamiliarity with local governmental and permitting procedures. As a result, we cannot assure you that we will achieve the economic benefit we expect from acquisitions, investment, development and redevelopment opportunities.
Acquired properties may expose us to unknown liability
We may acquire properties or invest in joint ventures that own properties subject to liabilities and without any recourse, or with only limited recourse, against the prior owners or other third parties with respect to unknown liabilities. As a result, if a liability were asserted against us based upon ownership of those properties, we might have to pay substantial sums to settle or contest it, which could adversely affect our results of operations and cash flow. Unknown liabilities with respect to acquired properties might include: liabilities for clean up of undisclosed environmental contamination, claims by tenants, vendors or other persons against the former owners of the properties, liabilities incurred in the ordinary course of business and claims for indemnification by general partners, directors and others indemnified by the former owners of the properties.
Competition for acquisitions may result in increased prices for properties
We may face competition for acquisition opportunities from other well-capitalized investors, including publicly traded and privately held REITs, private real estate funds, domestic and foreign financial institutions, life insurance companies, sovereign wealth funds, pension trusts, partnerships and individual investors. This competition may adversely affect us by subjecting us to the following risks: we may be unable to acquire a desired property because of competition from other well-capitalized real estate investors and, even if we are able to acquire a desired property, competition from other real estate investors may significantly increase the purchase price.
Our investments in joint ventures could be adversely affected by our lack of exclusive control over these investments, our partners’ insolvency or failure to meet their obligations, and disputes between us and our partners
We have entered into, and may continue in the future to enter into, partnerships or joint ventures with other persons or entities. Joint venture investments involve risks that may not be present with other methods of ownership, including the possibility that our partner might become insolvent, refuse to make capital contributions when due or otherwise fail to meet its obligations, which may result in certain liabilities to us for guarantees and other commitments; that our partner might at any time have economic or other business interests or goals that are or become inconsistent with our interests or goals; that we could become engaged in a dispute with our partner, which could require us to expend additional resources to resolve such dispute and could have an adverse impact on the operations and profitability of the joint venture; that our partner may be in a position to take action or withhold consent contrary to our instructions or requests; and that our joint venture partners may be structured differently than us for tax purposes, which could create conflicts of interest and risks to our REIT status. In some instances, we and/or our partner may have the right to trigger a buy-sell, put right or forced sale arrangement, which could cause us to sell our interest, acquire our partner’s interest or sell the underlying asset at a time when we otherwise would not have initiated such a transaction. Our ability to acquire our partner’s interest may be limited if we do not have sufficient cash, available borrowing capacity or other capital resources. In such event, we may be forced to sell our interest in the joint venture when we would otherwise prefer to retain it. On the other hand, our ability to transfer our interest in a joint venture to a third party may be restricted and the market for our interest may be limited and/or valued lower than fair market value. Joint ventures may require us to share decision-making authority with our partners, which could limit our ability to control the properties in the joint ventures. Even when we have a controlling interest, certain major decisions may require partner approval, such as the sale, acquisition or financing of a property.
We are exposed to operational risks with respect to our Seniors Housing Operating properties that could adversely affect our revenue and operations
We are exposed to various operational risks with respect to our Seniors Housing Operating properties that may increase our costs or adversely affect our ability to generate revenues. These risks include fluctuations in occupancy, Medicare and Medicaid reimbursement, if applicable, and private pay rates; economic conditions;
Showing the first 8K of 77K characters. Open the full section
Item 1B. Unresolved Staff Comments
None.
Item 2. Properties
We lease our corporate headquarters located at 4500 Dorr Street, Toledo, Ohio 43615. We also lease corporate offices throughout the U.S., Canada, the United Kingdom and Luxembourg and have ground leases relating to certain of our properties. The following table sets forth certain information regarding the properties that comprise our consolidated real property and real estate loan investments as of December 31, 2019 (dollars in thousands):
| Seniors Housing Operating | Triple-net | Outpatient Medical | |||||||||||||||||||||||||
| Property Location | Number of Properties | Total Investment | Annualized Revenues(1) | Number of Properties | Total Investment | Annualized Revenues(1) | Number of Properties | Total Investment | Annualized Revenues(1) | ||||||||||||||||||
| Alaska | — | $ | — | $ | — | — | $ | — | $ | — | 2 | $ | 29,810 | $ | (2,240 | ) | |||||||||||
| Alabama | 2 | 15,133 | 6,083 | 2 | 19,705 | 2,569 | 8 | 94,244 | 10,565 | ||||||||||||||||||
| Arkansas | — | — | — | — | — | — | 2 | 42,529 | 3,529 | ||||||||||||||||||
| Arizona | 6 | 86,883 | 32,517 | — | — | — | 8 | 87,655 | 11,077 | ||||||||||||||||||
| California | 82 | 3,052,393 | 688,631 | 23 | 456,935 | 64,633 | 45 | 1,092,865 | 105,239 | ||||||||||||||||||
| Colorado | 11 | 427,566 | 87,463 | 12 | 302,374 | 32,854 | 2 | 33,628 | 5,074 | ||||||||||||||||||
| Connecticut | 3 | 66,838 | 17,820 | 8 | 117,918 | 15,211 | 1 | 41,421 | 5,499 | ||||||||||||||||||
| District Of Columbia | 2 | 78,356 | 14,540 | — | — | — | — | — | — | ||||||||||||||||||
| Delaware | 3 | 69,290 | 25,484 | 7 | 114,126 | 9,544 | — | 46,998 | 1,402 | ||||||||||||||||||
| Florida | 14 | 898,178 | 144,974 | 51 | 583,500 | 56,682 | 42 | 529,060 | 74,346 | ||||||||||||||||||
| Georgia | 9 | 127,018 | 38,612 | 3 | 40,852 | 3,570 | 13 | 236,915 | 32,572 | ||||||||||||||||||
| Iowa | 4 | 75,655 | 28,926 | 7 | 57,537 | 5,884 | 1 | 7,734 | 1,648 | ||||||||||||||||||
| Idaho | 1 | 22,405 | 5,433 | — | 67 | — | 2 | 55,317 | 1,399 | ||||||||||||||||||
| Illinois | 16 | 454,088 | 119,759 | 25 | 356,243 | 31,919 | 7 | 108,941 | 14,426 | ||||||||||||||||||
| Indiana | — | — | — | 28 | 358,904 | 45,696 | 10 | 164,034 | 22,324 | ||||||||||||||||||
| Kansas | 3 | 67,263 | 15,133 | 27 | 242,844 | 27,460 | 5 | 62,249 | 8,665 | ||||||||||||||||||
| Kentucky | 2 | 37,074 | 14,461 | 6 | 50,485 | 4,187 | 1 | 6,792 | 762 | ||||||||||||||||||
| Louisiana | 3 | 50,062 | 15,957 | 1 | 8,076 | 840 | — | — | — | ||||||||||||||||||
| Massachusetts | 19 | 565,730 | 113,921 | 9 | 110,005 | 16,484 | 7 | 110,662 | 4,556 | ||||||||||||||||||
| Maryland | 8 | 393,479 | 90,687 | 24 | 298,974 | 18,155 | 12 | 283,567 | 28,576 | ||||||||||||||||||
| Maine | 1 | 25,151 | 11,995 | — | — | — | 1 | 18,601 | 2,693 | ||||||||||||||||||
| Michigan | 6 | 165,217 | 32,231 | 18 | 207,961 | 20,225 | 3 | 70,250 | 7,706 | ||||||||||||||||||
| Minnesota | 3 | 83,838 | 15,771 | 11 | 233,938 | 21,552 | 9 | 182,594 | 30,679 | ||||||||||||||||||
| Missouri | 6 | 153,312 | 25,085 | 1 | 12,089 | 854 | 11 | 201,245 | 23,578 | ||||||||||||||||||
| Mississippi | 2 | 14,870 | 8,354 | 1 | 10,820 | — | 1 | 37,866 | 1,020 | ||||||||||||||||||
| Montana | 1 | 5,635 | 4,484 | 1 | 6,131 | 767 | — | — | — | ||||||||||||||||||
| North Carolina | 2 | 113,352 | 19,680 | 50 | 372,570 | 54,641 | 26 | 479,061 | 39,975 | ||||||||||||||||||
| Nebraska | — | — | — | 4 | 29,852 | 4,418 | 2 | 32,943 | 4,885 | ||||||||||||||||||
| New Hampshire | — | — | — | 4 | 47,720 | 7,341 | 1 | 12,038 | 1,721 | ||||||||||||||||||
| New Jersey | 26 | 688,084 | 210,140 | 41 | 771,913 | 84,672 | 15 | 407,653 | 51,813 | ||||||||||||||||||
| New Mexico | 1 | 17,505 | 1,548 | — | — | — | 3 | 29,424 | 3,594 | ||||||||||||||||||
| Nevada | 4 | 47,210 | 23,816 | 1 | 18,780 | 3,767 | 8 | 100,851 | 10,794 | ||||||||||||||||||
| New York | 27 | 596,987 | 141,993 | 4 | 41,850 | 7,271 | 18 | 434,793 | 17,454 | ||||||||||||||||||
| Ohio | 17 | 422,614 | 66,041 | 34 | 288,499 | 35,030 | 9 | 125,346 | 13,712 | ||||||||||||||||||
| Oklahoma | 2 | 37,620 | 3,650 | 20 | 219,772 | 25,505 | 2 | 22,736 | 4,361 | ||||||||||||||||||
| Oregon | 1 | 10,339 | 2,678 | 1 | 2,793 | 818 | 2 | 55,131 | 4,059 | ||||||||||||||||||
| Pennsylvania | 14 | 222,217 | 67,864 | 71 | 837,818 | 116,500 | 1 | 34,315 | 2,312 | ||||||||||||||||||
| South Carolina | 1 | 4,086 | 7,121 | 8 | 37,460 | 3,069 | 3 | 33,762 | 3,684 | ||||||||||||||||||
| Tennessee | 2 | 48,041 | 16,259 | 4 | 37,879 | 4,791 | 9 | 177,859 | 18,778 | ||||||||||||||||||
| Texas | 33 | 1,088,682 | 234,874 | 37 | 393,201 | 53,592 | 71 | 1,386,701 | 135,489 | ||||||||||||||||||
| Utah | 2 | 20,355 | 7,875 | 1 | 23,614 | 2,103 | — | — | — | ||||||||||||||||||
| Virginia | 5 | 282,587 | 77,302 | 27 | 281,446 | 29,811 | 6 | 119,944 | 14,492 | ||||||||||||||||||
| Washington | 24 | 625,662 | 137,873 | 7 | 93,483 | 10,254 | 9 | 218,008 | 26,987 | ||||||||||||||||||
| Wisconsin | 2 | 19,850 | 8,493 | 4 | 67,702 | 8,640 | 5 | 94,723 | 6,123 | ||||||||||||||||||
| West Virginia | — | — | — | 3 | 45,336 | 5,107 | — | — | — | ||||||||||||||||||
| Total domestic | 370 | 11,180,625 | 2,585,528 | 586 | 7,201,172 | 836,416 | 383 | 7,310,265 | 755,328 | ||||||||||||||||||
| Canada | 106 | 2,150,044 | 452,734 | 6 | 146,737 | 10,341 | — | — | — | ||||||||||||||||||
| United Kingdom | 57 | 1,634,009 | 352,658 | 66 | 1,228,409 | 106,336 | 4 | 268,010 | 25,587 | ||||||||||||||||||
| Total international | 163 | 3,784,053 | 805,392 | 72 | 1,375,146 | 116,677 | 4 | 268,010 | 25,587 | ||||||||||||||||||
| Grand total | 533 | $ | 14,964,678 | $ | 3,390,920 | 658 | $ | 8,576,318 | $ | 953,093 | 387 | $ | 7,578,275 | $ | 780,915 |
(1) Represents revenue for the month ended December 31, 2019 annualized.
The following table sets forth occupancy and average annualized revenues for certain property types (excluding investments in unconsolidated entities):
| Occupancy(1) | Average Annualized Revenues(2) | |||||||||||||
| 2019 | 2018 | 2019 | 2018 | |||||||||||
| Seniors Housing Operating(3) | 86.9% | 87.5% | $ | 56,329 | $ | 60,635 | per unit | |||||||
| Triple-net(4) | 84.3% | 84.9% | 14,578 | 12,831 | per bed/unit | |||||||||
| Outpatient Medical(5) | 94.1% | 93.1% | 34 | 34 | per sq. ft. |
(1) We use unaudited, periodic financial information provided solely by tenants/borrowers to calculate occupancy for properties other than Outpatient Medical buildings and have not independently verified the information.
(2) Represents December annualized revenues divided by total beds, units or square feet as presented in the tables above.
(3) Occupancy represents average occupancy for the three months ended December 31.
(4) Occupancy represents average quarterly operating occupancy based on the quarters ended September 30 and excludes properties that are unstabilized, closed or for which data is not available or meaningful.
(5) Occupancy represents the percentage of total rentable square feet leased and occupied (including month-to-month and holdover leases and excluding terminations) as of December 31.
The following table sets forth information regarding lease expirations for certain portions of our portfolio as of December 31, 2019 (dollars in thousands):
| Expiration Year(1) | ||||||||||||||||||||||||||||||||||||||||||||
| 2020 | 2021 | 2022 | 2023 | 2024 | 2025 | 2026 | 2027 | 2028 | 2029 | Thereafter | ||||||||||||||||||||||||||||||||||
| Triple-net: | ||||||||||||||||||||||||||||||||||||||||||||
| Properties | 11 | 7 | 10 | 1 | 4 | 48 | 76 | 18 | 15 | 15 | 431 | |||||||||||||||||||||||||||||||||
| Base rent(2) | $ | 3,782 | $ | 12,292 | $ | 8,889 | $ | 840 | $ | 11,262 | $ | 53,216 | $ | 103,179 | $ | 35,381 | $ | 22,036 | $ | 33,619 | $ | 492,113 | ||||||||||||||||||||||
| % of base rent | 0.5 | % | 1.6 | % | 1.1 | % | 0.1 | % | 1.5 | % | 6.9 | % | 13.3 | % | 4.6 | % | 2.8 | % | 4.3 | % | 63.3 | % | ||||||||||||||||||||||
| Units | 1,101 | 1,394 | 1,264 | 70 | 692 | 3,033 | 6,085 | 2,350 | 1,633 | 1,429 | 44,811 | |||||||||||||||||||||||||||||||||
| % of units | 1.7 | % | 2.2 | % | 2.0 | % | 0.1 | % | 1.1 | % | 4.7 | % | 9.5 | % | 3.7 | % | 2.6 | % | 2.2 | % | 70.2 | % | ||||||||||||||||||||||
| Outpatient Medical: | ||||||||||||||||||||||||||||||||||||||||||||
| Square feet | 1,748,858 | 2,053,686 | 2,165,074 | 2,158,927 | 2,230,230 | 1,305,946 | 1,670,290 | 1,025,948 | 1,052,671 | 1,148,176 | 6,183,564 | |||||||||||||||||||||||||||||||||
| Base rent(2) | $ | 48,233 | $ | 57,464 | $ | 58,846 | $ | 58,295 | $ | 65,687 | $ | 34,681 | $ | 42,112 | $ | 25,805 | $ | 27,501 | $ | 29,829 | $ | 139,889 | ||||||||||||||||||||||
| % of base rent | 8.2 | % | 9.8 | % | 10.0 | % | 9.9 | % | 11.2 | % | 5.9 | % | 7.2 | % | 4.4 | % | 4.7 | % | 5.1 | % | 23.6 | % | ||||||||||||||||||||||
| Leases | 471 | 422 | 433 | 442 | 355 | 213 | 208 | 137 | 118 | 152 | 214 | |||||||||||||||||||||||||||||||||
| % of leases | 14.9 | % | 13.3 | % | 13.7 | % | 14.0 | % | 11.2 | % | 6.7 | % | 6.6 | % | 4.3 | % | 3.7 | % | 4.8 | % | 6.8 | % |
(1) Excludes investments in unconsolidated entities, developments, land parcels, loans receivable and sub-leases. Investments classified as held for sale are included in 2020.
(2) The most recent monthly cash base rent annualized. Base rent does not include tenant recoveries or amortization of above and below market lease intangibles or other non cash income.
Item 3. Legal Proceedings
From time to time, there are various legal proceedings pending against us that arise in the ordinary course of our business. Management does not believe that the resolution of any of these legal proceedings either individually or in the aggregate will have a material adverse effect on our business, results of operations or financial condition. Further, from time to time, we are party to certain legal proceedings for which third parties, such as tenants, operators and/or managers are contractually obligated to indemnify, defend and hold us harmless. In some of these matters, the indemnitors have insurance for the potential damages. In other matters, we are being defended by tenants and other obligated third parties and these indemnitors may not have sufficient insurance, assets, income or resources to satisfy their defense and indemnification obligations to us. The unfavorable resolution of such legal proceedings could, individually or in the aggregate, materially adversely affect the indemnitors’ ability to satisfy their respective obligations to us, which, in turn, could have a material adverse effect on our business, results of operations or financial condition. It is management’s opinion that there are currently no such legal proceedings pending that will, individually or in the aggregate, have such a material adverse effect. Despite management’s view of the ultimate resolution of these legal proceedings, we may have significant legal expenses and costs associated with the defense of such matters. Further, management cannot predict the outcome of these legal proceedings and if management’s expectation regarding such matters is not correct, such proceedings could have a material adverse effect on our business, results of operations or financial condition.
Item 4. Mine Safety Disclosures
None.
PART II
Item 5. Market for Registrant’s Common Equity, Related Stockholder Matters and Issuer Purchases of Equity Securities
Our common stock trades on the New York Stock Exchange (NYSE:WELL). There were 3,564 stockholders of record as of January 31, 2020.
Stockholder Return Performance Presentation
Set forth below is a line graph comparing the yearly percentage change and the cumulative total stockholder return on our shares of common stock against the cumulative total return of the S & P Composite-500 Stock Index and the FTSE NAREIT Equity Index. As of December 31, 2019, 155 companies comprised the FTSE NAREIT Equity Index, which consists of REITs identified by NAREIT as equity (those REITs which have at least 75% of their investments in real property). The data are based on the closing prices as of December 31 for each of the five years. 2014 equals $100 and dividends are assumed to be reinvested.
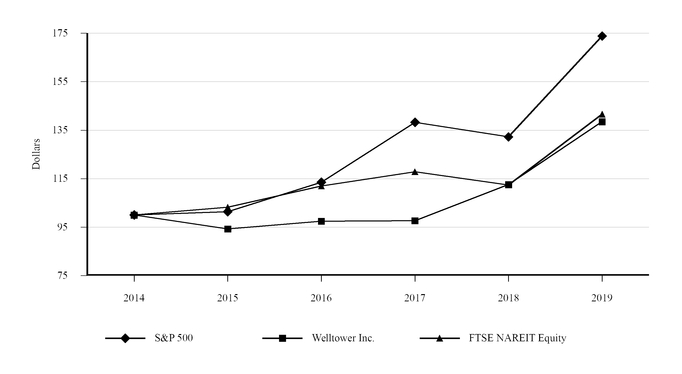
| 12/31/2014 | 12/31/2015 | 12/31/2016 | 12/31/2017 | 12/31/2018 | 12/31/2019 | |||||||||||||||||||
| S & P 500 | $ | 100.00 | $ | 101.38 | $ | 113.51 | $ | 138.29 | $ | 132.23 | $ | 173.86 | ||||||||||||
| Welltower Inc. | 100.00 | 94.28 | 97.45 | 97.65 | 112.59 | 138.52 | ||||||||||||||||||
| FTSE NAREIT Equity | 100.00 | 103.20 | 111.99 | 117.84 | 112.39 | 141.61 |
Except to the extent that we specifically incorporate this information by reference, the foregoing Stockholder Return Performance Presentation shall not be deemed incorporated by reference by any general statement incorporating by reference this Annual Report on Form 10-K into any filing under the Securities Act of 1933, as amended, or under the Securities Exchange Act of 1934, as amended. This information shall not otherwise be deemed filed under such Acts.
| Issuer Purchases of Equity Securities | |||||||||||
| Period | Total Number of Shares Purchased(1) | Average Price Paid Per Share | Total Number of Shares Purchased as Part of Publicly Announced Plans or Programs(2) | Maximum Number of Shares that May Yet Be Purchased Under the Plans or Programs | |||||||
| October 1, 2019 through October 31, 2019 | 4,546 | $ | 91.04 | ||||||||
| November 1, 2019 through November 30, 2019 | 728 | 86.12 | |||||||||
| December 1, 2019 through December 31, 2019 | 891 | 78.67 | |||||||||
| Totals | 6,165 | $ | 89.43 |
(1) During the three months ended December 31, 2019, the company acquired shares of common stock held by employees who tendered owned shares to satisfy tax withholding obligations.
(2) No shares were purchased as part of publicly announced plans or programs.
Item 6. Selected Financial Data
The following selected financial data for the five years ended December 31, 2019 are derived from our audited consolidated financial statements (in thousands, except per share data):
| Year Ended December 31, | ||||||||||||||||||||
| 2015 | 2016 | 2017 | 2018 | 2019 | ||||||||||||||||
| Operating Data | ||||||||||||||||||||
| Total revenues | $ | 3,859,826 | $ | 4,281,160 | $ | 4,316,641 | $ | 4,700,499 | $ | 5,121,306 | ||||||||||
| Total expenses | 3,223,709 | 3,571,907 | 4,017,025 | 4,277,009 | 4,578,414 | |||||||||||||||
| Income from continuing operations before income taxes and other items | 636,117 | 709,253 | 299,616 | 423,490 | 542,892 | |||||||||||||||
| Income tax (expense) benefit | (6,451 | ) | 19,128 | (20,128 | ) | (8,674 | ) | (2,957 | ) | |||||||||||
| Income (loss) from unconsolidated entities | (21,504 | ) | (10,357 | ) | (83,125 | ) | (641 | ) | 42,434 | |||||||||||
| Gain (loss) on real estate dispositions, net | 280,387 | 364,046 | 344,250 | 415,575 | 748,041 | |||||||||||||||
| Income from continuing operations | 888,549 | 1,082,070 | 540,613 | 829,750 | 1,330,410 | |||||||||||||||
| Net income | 888,549 | 1,082,070 | 540,613 | 829,750 | 1,330,410 | |||||||||||||||
| Preferred stock dividends | 65,406 | 65,406 | 49,410 | 46,704 | — | |||||||||||||||
| Preferred stock redemption charge | — | — | 9,769 | — | — | |||||||||||||||
| Net income (loss) attributable to noncontrolling interests | 4,799 | 4,267 | 17,839 | 24,796 | 97,978 | |||||||||||||||
| Net income attributable to common stockholders | $ | 818,344 | $ | 1,012,397 | $ | 463,595 | $ | 758,250 | $ | 1,232,432 | ||||||||||
| Other Data | ||||||||||||||||||||
| Average number of common shares outstanding: | ||||||||||||||||||||
| Basic | 348,240 | 358,275 | 367,237 | 373,620 | 401,845 | |||||||||||||||
| Diluted | 349,424 | 360,227 | 369,001 | 375,250 | 403,808 | |||||||||||||||
| Per Share Data | ||||||||||||||||||||
| Basic: | ||||||||||||||||||||
| Income from continuing operations | $ | 2.55 | $ | 3.02 | $ | 1.47 | $ | 2.22 | $ | 3.31 | ||||||||||
| Net income attributable to common stockholders | $ | 2.35 | $ | 2.83 | $ | 1.26 | $ | 2.03 | $ | 3.07 | ||||||||||
| Diluted: | ||||||||||||||||||||
| Income from continuing operations | $ | 2.54 | $ | 3.00 | $ | 1.47 | $ | 2.21 | $ | 3.29 | ||||||||||
| Net income attributable to common stockholders | $ | 2.34 | $ | 2.81 | $ | 1.26 | $ | 2.02 | $ | 3.05 | ||||||||||
| Cash distributions per common share | $ | 3.30 | $ | 3.44 | $ | 3.48 | $ | 3.48 | $ | 3.48 | ||||||||||
| December 31, | ||||||||||||||||||||
| Balance Sheet Data | 2015 | 2016 | 2017 | 2018 | 2019 | |||||||||||||||
| Net real estate investments(1) | $ | 26,888,685 | $ | 26,563,629 | $ | 26,171,077 | $ | 28,420,769 | $ | 31,119,271 | ||||||||||
| Total assets | 29,023,845 | 28,865,184 | 27,944,445 | 30,342,072 | 33,380,751 | |||||||||||||||
| Total debt and lease obligations(1) | 12,967,686 | 12,358,245 | 11,731,936 | 13,297,144 | 15,388,765 | |||||||||||||||
| Total liabilities | 13,664,877 | 13,185,279 | 12,643,799 | 14,331,427 | 16,398,247 | |||||||||||||||
| Total preferred stock | 1,006,250 | 1,006,250 | 718,503 | 718,498 | — | |||||||||||||||
| Total equity | 15,175,885 | 15,281,472 | 14,925,452 | 15,586,599 | 16,506,627 | |||||||||||||||
| (1) Effective January 1, 2019, we adopted new guidance on leases using the prospective method. See Note 2 to the consolidated financial statements for further details. |
Item 7. Management’s Discussion and Analysis of Financial Condition and Results of Operations
| EXECUTIVE SUMMARY | |
| Company Overview | 41 |
| Business Strategy | 41 |
| Key Transactions | 42 |
| Key Performance Indicators, Trends and Uncertainties | 43 |
| Corporate Governance | 44 |
| LIQUIDITY AND CAPITAL RESOURCES | |
| Sources and Uses of Cash | 45 |
| Off-Balance Sheet Arrangements | 45 |
| Contractual Obligations | 46 |
| Capital Structure | 46 |
| RESULTS OF OPERATIONS | |
| Summary | 47 |
| Seniors Housing Operating | 48 |
| Triple-net | 50 |
| Outpatient Medical | 51 |
| Non-Segment/Corporate | 53 |
| OTHER | |
| Non-GAAP Financial Measures | 54 |
| Critical Accounting Policies | 57 |
Item 7. Management’s Discussion and Analysis of Financial Condition and Results of Operations
The following discussion and analysis is based primarily on the consolidated financial statements of Welltower Inc. presented in conformity with U.S. generally accepted accounting principles (“U.S. GAAP”) for the periods presented and should be read together with the notes thereto contained in this Annual Report on Form 10-K. Other important factors are identified in “Item 1 — Business” and “Item 1A — Risk Factors” above.
Executive Summary
Company Overview
Welltower Inc. (NYSE:WELL), an S&P 500 company headquartered in Toledo, Ohio, is driving the transformation of health care infrastructure. The company invests with leading seniors housing operators, post-acute providers and health systems to fund the real estate and infrastructure needed to scale innovative care delivery models and improve people’s wellness and overall health care experience. Welltower™, a real estate investment trust (“REIT”), owns interests in properties concentrated in major, high-growth markets in the United States (“U.S.”), Canada and the United Kingdom (“U.K.”), consisting of seniors housing and post-acute communities and outpatient medical properties. Ou
Showing the first 8K of 84K characters. Open the full section
Item 7. Management’s Discussion and Analysis of Financial Condition and Results of Operations
| Year Ended | Year Ended | Year Ended | ||||||||||||||||
| December 31, 2019 | December 31, 2018 | December 31, 2017 | ||||||||||||||||
| Weighted Avg. | Weighted Avg. | Weighted Avg. | ||||||||||||||||
| Amount | Interest Rate | Amount | Interest Rate | Amount | Interest Rate | |||||||||||||
| Beginning balance | $ | 386,738 | 4.20% | $ | 279,951 | 4.72% | $ | 404,079 | 4.85% | |||||||||
| Debt assumed | 202,084 | 4.12% | 171,275 | 3.99% | 23,094 | 6.67% | ||||||||||||
| Debt extinguished | (10,244 | ) | 5.75% | (61,291 | ) | 7.43% | (137,416 | ) | 5.99% | |||||||||
| Principal payments | (6,311 | ) | 4.97% | (3,197 | ) | 5.91% | (9,806 | ) | 6.85% | |||||||||
| Ending balance | $ | 572,267 | 3.97% | $ | 386,738 | 4.20% | $ | 279,951 | 4.72% | |||||||||
| Monthly averages | $ | 397,756 | 4.15% | $ | 238,214 | 4.25% | $ | 294,694 | 4.62% |
A portion of our Outpatient Medical properties were formed through partnerships. Income or loss from unconsolidated entities represents our share of net income or losses from partnerships where we are the noncontrolling partner. Net income attributable to noncontrolling interests represents our partners’ share of net income or loss relating to those partnerships where we are the controlling partner.
Non-Segment/Corporate
The following is a summary of our results of operations for the non-segment/corporate activities (dollars in thousands):
| Year Ended | One Year Change | Year Ended | One Year Change | Two Year Change | ||||||||||||||||||||||||||||||
| December 31, | December 31, | December 31, | ||||||||||||||||||||||||||||||||
| 2019 | 2018 | $ | % | 2017 | $ | % | $ | % | ||||||||||||||||||||||||||
| Revenues: | ||||||||||||||||||||||||||||||||||
| Other income | $ | 3,966 | $ | 2,275 | $ | 1,691 | 74 | % | $ | 1,538 | $ | 737 | 48 | % | $ | 2,428 | 158 | % | ||||||||||||||||
| Expenses: | ||||||||||||||||||||||||||||||||||
| Interest expense | 461,273 | 436,256 | 25,017 | 6 | % | 396,148 | 40,108 | 10 | % | 65,125 | 16 | % | ||||||||||||||||||||||
| General and administrative expenses | 126,549 | 126,383 | 166 | 0 | % | 122,008 | 4,375 | 4 | % | 4,541 | 4 | % | ||||||||||||||||||||||
| Loss (gain) on extinguishments of debt, net | 82,541 | 4,091 | 78,450 | 1,918 | % | — | 4,091 | n/a | 82,541 | n/a | ||||||||||||||||||||||||
| Other expenses | 10,705 | 7,729 | 2,976 | 39 | % | 50,829 | (43,100 | ) | -85 | % | (40,124 | ) | -79 | % | ||||||||||||||||||||
| Total expenses | 681,068 | 574,459 | 106,609 | 19 | % | 568,985 | 5,474 | 1 | % | 112,083 | 20 | % | ||||||||||||||||||||||
| Loss from continuing operations before income taxes | (677,102 | ) | (572,184 | ) | (104,918 | ) | -18 | % | (567,447 | ) | (4,737 | ) | -1 | % | (109,655 | ) | -19 | % | ||||||||||||||||
| Income tax benefit (expense) | (2,284 | ) | (11,362 | ) | 9,078 | 80 | % | 2,070 | (13,432 | ) | -649 | % | (4,354 | ) | -210 | % | ||||||||||||||||||
| Loss from continuing operations | (679,386 | ) | (583,546 | ) | (95,840 | ) | -16 | % | (565,377 | ) | (18,169 | ) | -3 | % | (114,009 | ) | -20 | % | ||||||||||||||||
| Preferred stock dividends | — | 46,704 | (46,704 | ) | -100 | % | 49,410 | (2,706 | ) | -5 | % | (49,410 | ) | -100 | % | |||||||||||||||||||
| Preferred stock redemption charge | — | — | — | n/a | 9,769 | (9,769 | ) | -100 | % | (9,769 | ) | -100 | % | |||||||||||||||||||||
| Net loss attributable to common stockholders | $ | (679,386 | ) | $ | (630,250 | ) | $ | (49,136 | ) | -8 | % | $ | (624,556 | ) | $ | (5,694 | ) | -1 | % | $ | (54,830 | ) | -9 | % |
The following is a summary of our Non-Segment/Corporate interest expense for the periods presented (dollars in thousands):
| Year Ended | One Year Change | Year Ended | One Year Change | Two Year Change | |||||||||||||||||||||||||||||
| December 31, | December 31, | December 31, | |||||||||||||||||||||||||||||||
| 2019 | 2018 | $ | % | 2017 | $ | % | $ | % | |||||||||||||||||||||||||
| Senior unsecured notes | $ | 402,133 | $ | 387,955 | $ | 14,178 | 4 | % | $ | 364,773 | $ | 23,182 | 6 | % | $ | 37,360 | 10 | % | |||||||||||||||
| Secured debt | — | 115 | (115 | ) | -100 | % | 127 | (12 | ) | -9 | % | (127 | ) | -100 | % | ||||||||||||||||||
| Unsecured revolving credit facility and commercial paper program | 43,861 | 34,626 | 9,235 | 27 | % | 17,863 | 16,763 | 94 | % | 25,998 | 146 | % | |||||||||||||||||||||
| Loan expense | 15,279 | 13,560 | 1,719 | 13 | % | 13,385 | 175 | 1 | % | 1,894 | 14 | % | |||||||||||||||||||||
| Totals | $ | 461,273 | $ | 436,256 | $ | 25,017 | 6 | % | $ | 396,148 | $ | 40,108 | 10 | % | $ | 65,125 | 16 | % |
The change in interest expense on senior unsecured notes is due to the net effect of issuances and extinguishments, as well as the movement in foreign exchange rates and related hedge activity. Please refer to Note 11 to consolidated financial statements for additional information. The change in interest expense on our unsecured revolving credit facility and commercial paper program is due primarily to the net effect and timing of draws, paydowns and variable interest rate changes. Please refer to Note 10 of our consolidated financial statements for additional information regarding our unsecured revolving credit facility and commercial paper program. Loan expenses represent the amortization of costs incurred in connection with senior unsecured notes issuances. The loss on extinguishment recognized in 2019 is due primarily to the early extinguishment of the $600,000,000 of 4.125% senior unsecured notes due 2019 and the $450,000,000 of 6.125% senior unsecured notes due 2020 in March 2019, the early extinguishment of the $450,000,000 of 4.95% senior unsecured notes due 2021 and the $600,000,000 of 5.25% senior unsecured notes due 2022 in September 2019 and the early redemption of the $300 million Canadian-denominated 3.35% senior unsecured notes due 2020 in December 2019. The loss on extinguishment of debt in 2018 is due to the term loan facility drawn on in July 2018 and paid off in August 2018.
Item 7. Management’s Discussion and Analysis of Financial Condition and Results of Operations
General and administrative expenses as a percentage of consolidated revenues for the years ended December 31, 2019, 2018 and 2017 were 2.47%, 2.69% and 2.83%, respectively.
Other expenses for all years include severance-related costs associated with the departure of certain executive officers and key employees.
The decrease in preferred dividends is due to the conversion of all outstanding Series I Cumulative Convertible Perpetual Preferred Stock during the year ended December 31, 2019.
Other
Non-GAAP Financial Measures
We believe that net income and net income attributable to common stockholders (“NICS”), as defined by U.S. GAAP, are the most appropriate earnings measurements. However, we consider FFO, NOI, SSNOI, EBITDA and Adjusted EBITDA to be useful supplemental measures of our operating performance. Historical cost accounting for real estate assets in accordance with U.S. GAAP implicitly assumes that the value of real estate assets diminishes predictably over time as evidenced by the provision for depreciation. However, since real estate values have historically risen or fallen with market conditions, many industry investors and analysts have considered presentations of operating results for real estate companies that use historical cost accounting to be insufficient. In response, the National Association of Real Estate Investment Trusts (“NAREIT”) created funds from operations attributable to common stockholders (“FFO”) as a supplemental measure of operating performance for REITs that excludes historical cost depreciation from net income. FFO, as defined by NAREIT, means NICS, computed in accordance with U.S. GAAP, excluding gains (or losses) from sales of real estate and impairment of depreciable assets, plus depreciation and amortization, and after adjustments for unconsolidated entities and noncontrolling interests.
Consolidated net operating income (“NOI”) is used to evaluate the operating performance of our properties. We define NOI as total revenues, including tenant reimbursements, less property operating expenses. Property operating expenses represent costs associated with managing, maintaining and servicing tenants for our properties. These expenses include, but are not limited to, property-related payroll and benefits, property management fees paid to operators, marketing, housekeeping, food service, maintenance, utilities, property taxes and insurance. General and administrative expenses represent costs unrelated to property operations. These expenses include, but are not limited to, payroll and benefits, professional services, office expenses and depreciation of corporate fixed assets. Same store NOI (“SSNOI”) is used to evaluate the operating performance of our properties using a consistent population which controls for changes in the composition of our portfolio. As used herein, same store is generally defined as those revenue-generating properties in the portfolio for the eight quarters ended December 31, 2019 ("2018 and 2019 Same Store Pool") and December 31, 2018 ("2017 and 2018 Same Store Pool"). Land parcels, loans and sub-leases, as well as any properties acquired, under development, transitioned to a different segment, sold or classified as held for sale during that period are excluded from the same store amounts. Additionally, unconsolidated properties are excluded from the same store amounts. We believe NOI and SSNOI provide investors relevant and useful information because they measure the operating performance of our properties at the property level on an unleveraged basis. We use NOI and SSNOI to make decisions about resource allocations and to assess the property level performance of our properties.
EBITDA stands for earnings (net income) before interest, taxes, depreciation and amortization. We believe that EBITDA, along with net income and cash flow provided from operating activities, is an important supplemental measure because it provides additional information to assess and evaluate the performance of our operations. We primarily utilize EBITDA to measure our interest coverage ratio, which represents EBITDA divided by total interest, and our fixed charge coverage ratio, which represents EBITDA divided by fixed charges. Fixed charges include total interest, secured debt principal amortization, and preferred dividends. Covenants in our senior unsecured notes and primary unsecured credit facility contain financial ratios based on a definition of EBITDA that is specific to those agreements. Failure to satisfy these covenants could result in an event of default that could have a material adverse impact on our cost and availability of capital, which could in turn have a material adverse impact on our consolidated results of operations, liquidity and/or financial condition. Due to the materiality of these debt agreements and the financial covenants, we have disclosed Adjusted EBITDA, which represents EBITDA as defined above excluding unconsolidated entities and adjusted for items per our covenant. We use Adjusted EBITDA to measure our adjusted fixed charge coverage ratio, which represents Adjusted EBITDA divided by fixed charges on a trailing twelve months basis. Fixed charges include total interest (excluding capitalized interest and non-cash interest expenses), secured debt principal amortization and preferred dividends. Our covenant requires an adjusted fixed charge coverage ratio of at least 1.50 times.
Our supplemental reporting measures and similarly entitled financial measures are widely used by investors, equity and debt analysts and rating agencies in the valuation, comparison, rating and investment recommendations of companies. Management uses these financial measures to facilitate internal and external comparisons to our historical operating results and in making operating decisions. Additionally, these measures are utilized by the Board of Directors to evaluate management. None of our supplemental measures represent net income or cash flow provided from operating activities as determined in accordance with U.S. GAAP and should not be considered as alternative measures of profitability or liquidity. Finally, the supplemental measures, as defined by us, may not be comparable to similarly entitled items reported by other real estate investment trusts or other companies.
Item 7. Management’s Discussion and Analysis of Financial Condition and Results of Operations
The table below reflects the reconciliation of FFO to NICS, the most directly comparable U.S. GAAP measure, for the periods presented. Noncontrolling interest and unconsolidated entity amounts represent adjustments to reflect our share of depreciation and amortization, gains/loss on real estate dispositions and impairments of assets. Amounts are in thousands except for per share data.
| Year Ended December 31, | ||||||||||||
| FFO Reconciliation: | 2019 | 2018 | 2017 | |||||||||
| Net income attributable to common stockholders | $ | 1,232,432 | $ | 758,250 | $ | 463,595 | ||||||
| Depreciation and amortization | 1,027,073 | 950,459 | 921,720 | |||||||||
| Impairment of assets | 28,133 | 115,579 | 124,483 | |||||||||
| Loss (gain) on real estate dispositions, net | (748,041 | ) | (415,575 | ) | (344,250 | ) | ||||||
| Noncontrolling interests | (20,197 | ) | (69,193 | ) | (60,018 | ) | ||||||
| Unconsolidated entities | 57,680 | 52,663 | 60,046 | |||||||||
| Funds from operations attributable to common stockholders | $ | 1,577,080 | $ | 1,392,183 | $ | 1,165,576 | ||||||
| Average diluted shares outstanding: | 403,808 | 375,250 | 369,001 | |||||||||
| Per diluted share data: | ||||||||||||
| Net income attributable to common stockholders | $ | 3.05 | $ | 2.02 | $ | 1.26 | ||||||
| Funds from operations attributable to common stockholders | $ | 3.91 | $ | 3.71 | $ | 3.16 |
The table below reflects the reconciliation of EBITDA and Adjusted EBITDA to net income, the most directly comparable U.S. GAAP measure, for the periods presented. Dollars are in thousands.
| Year Ended December 31, | ||||||||||||
| Adjusted EBITDA Reconciliation: | 2019 | 2018 | 2017 | |||||||||
| Net income | $ | 1,330,410 | $ | 829,750 | $ | 540,613 | ||||||
| Interest expense | 555,559 | 526,592 | 484,622 | |||||||||
| Income tax expense (benefit) | 2,957 | 8,674 | 20,128 | |||||||||
| Depreciation and amortization | 1,027,073 | 950,459 | 921,720 | |||||||||
| EBITDA | 2,915,999 | 2,315,475 | 1,967,083 | |||||||||
| Loss (income) from unconsolidated entities | (42,434 | ) | 641 | 83,125 | ||||||||
| Stock-based compensation expense(1) | 25,047 | 27,646 | 19,102 | |||||||||
| Loss (gain) on extinguishment of debt, net | 84,155 | 16,097 | 37,241 | |||||||||
| Loss (gain) on real estate dispositions, net | (748,041 | ) | (415,575 | ) | (344,250 | ) | ||||||
| Impairment of assets | 28,133 | 115,579 | 124,483 | |||||||||
| Provision for loan losses | 18,690 | — | 62,966 | |||||||||
| Loss (gain) on derivatives and financial instruments, net | (4,399 | ) | (4,016 | ) | 2,284 | |||||||
| Other expenses(1) | 51,052 | 111,990 | 176,395 | |||||||||
| Additional other income | — | (14,832 | ) | — | ||||||||
| Adjusted EBITDA | $ | 2,328,202 | $ | 2,153,005 | $ | 2,128,429 | ||||||
| Adjusted Interest Coverage Ratio: | ||||||||||||
| Interest expense | $ | 555,559 | $ | 526,592 | $ | 484,622 | ||||||
| Capitalized interest | 15,272 | 7,905 | 13,489 | |||||||||
| Non-cash interest expense | (8,645 | ) | (10,860 | ) | (10,359 | ) | ||||||
| Total interest | 562,186 | 523,637 | 487,752 | |||||||||
| Adjusted EBITDA | $ | 2,328,202 | $ | 2,153,005 | $ | 2,128,429 | ||||||
| Adjusted interest coverage ratio | 4.14x | 4.11x | 4.36x | |||||||||
| Adjusted Fixed Charge Coverage Ratio: | ||||||||||||
| Total interest | $ | 562,186 | $ | 523,637 | $ | 487,752 | ||||||
| Secured debt principal payments | 54,325 | 56,288 | 64,078 | |||||||||
| Preferred dividends | — | 46,704 | 49,410 | |||||||||
| Total fixed charges | 616,511 | 626,629 | 601,240 | |||||||||
| Adjusted EBITDA | $ | 2,328,202 | $ | 2,153,005 | $ | 2,128,429 | ||||||
| Adjusted fixed charge coverage ratio | 3.78x | 3.44x | 3.54x |
(1) Certain severance-related costs are included in stock-based compensation and excluded from other expenses.
Item 7. Management’s Discussion and Analysis of Financial Condition and Results of Operations
Our leverage ratios include book capitalization, undepreciated book capitalization and market capitalization. Book capitalization represents the sum of net debt (defined as total long-term debt less cash and cash equivalents and any IRC section 1031 deposits), total equity and redeemable noncontrolling interests. Undepreciated book capitalization represents book capitalization adjusted for accumulated depreciation and amortization. Market capitalization represents book capitalization adjusted for the fair market value of our common stock. Our leverage ratios are defined as the proportion of net debt to total capitalization. The table below reflects the reconciliation of our leverage ratios to our balance sheets for the periods presented. Amounts are in thousands, except share price.
| Year Ended December 31, | ||||||||||||||
| 2019 | 2018 | 2017 | ||||||||||||
| Book capitalization: | ||||||||||||||
| Unsecured credit facility and commercial paper | $ | 1,587,597 | $ | 1,147,000 | $ | 719,000 | ||||||||
| Long-term debt obligations(1) | 13,436,365 | 12,150,144 | 11,012,936 | |||||||||||
| Cash and cash equivalents(2) | (284,917 | ) | (215,376 | ) | (249,620 | ) | ||||||||
| Total net debt | 14,739,045 | 13,081,768 | 11,482,316 | |||||||||||
| Total equity and noncontrolling interests(3) | 16,982,504 | 16,010,645 | 15,300,646 | |||||||||||
| Book capitalization | $ | 31,721,549 | $ | 29,092,413 | $ | 26,782,962 | ||||||||
| Net debt to book capitalization ratio | 46.5 | % | 45.0 | % | 42.9 | % | ||||||||
| Undepreciated book capitalization: | ||||||||||||||
| Total net debt | $ | 14,739,045 | $ | 13,081,768 | $ | 11,482,316 | ||||||||
| Accumulated depreciation and amortization | 5,715,459 | 5,499,958 | 4,838,370 | |||||||||||
| Total equity and noncontrolling interests(3) | 16,982,504 | 16,010,645 | 15,300,646 | |||||||||||
| Undepreciated book capitalization | $ | 37,437,008 | $ | 34,592,371 | $ | 31,621,332 | ||||||||
| Net debt to undepreciated book capitalization ratio | 39.4 | % | 37.8 | % | 36.3 | % | ||||||||
| Market capitalization: | ||||||||||||||
| Common shares outstanding | 410,257 | 383,675 | 371,732 | |||||||||||
| Period end share price | $ | 81.78 | $ | 69.41 | $ | 63.77 | ||||||||
| Common equity market capitalization | $ | 33,550,817 | $ | 26,630,882 | $ | 23,705,350 | ||||||||
| Total net debt | 14,739,045 | 13,081,768 | 11,482,316 | |||||||||||
| Noncontrolling interests(3) | 1,442,060 | 1,378,311 | 877,499 | |||||||||||
| Preferred stock | — | 718,498 | 718,503 | |||||||||||
| Market capitalization: | $ | 49,731,922 | $ | 41,809,459 | $ | 36,783,668 | ||||||||
| Net debt to market capitalization ratio | 29.6 | % | 31.3 | % | 31.2 | % |
(1) Amounts include senior unsecured notes, secured debt and lease liabilities related to financing leases, as reflected on our Consolidated Balance Sheet.
(2) Inclusive of IRC section 1031 deposits, if any.
(3) Includes amounts attributable to both redeemable noncontrolling interests and noncontrolling interests as reflected on our Consolidated Balance Sheet.
The following tables reflect the reconciliation of NOI to net income, the most directly comparable U.S. GAAP measure, for the years presented. Dollar amounts are in thousands.
| Year Ended December 31, | ||||||||||||
| NOI Reconciliation: | 2019 | 2018 | 2017 | |||||||||
| Net income | $ | 1,330,410 | $ | 829,750 | $ | 540,613 | ||||||
| Loss (gain) on real estate dispositions, net | (748,041 | ) | (415,575 | ) | (344,250 | ) | ||||||
| Loss (income) from unconsolidated entities | (42,434 | ) | 641 | 83,125 | ||||||||
| Income tax expense (benefit) | 2,957 | 8,674 | 20,128 | |||||||||
| Other expenses | 52,612 | 112,898 | 177,776 | |||||||||
| Impairment of assets | 28,133 | 115,579 | 124,483 | |||||||||
| Provision for loan losses | 18,690 | — | 62,966 | |||||||||
| Loss (gain) on extinguishment of debt, net | 84,155 | 16,097 | 37,241 | |||||||||
| Loss (gain) on derivatives and financial instruments, net | (4,399 | ) | (4,016 | ) | 2,284 | |||||||
| General and administrative expenses | 126,549 | 126,383 | 122,008 | |||||||||
| Depreciation and amortization | 1,027,073 | 950,459 | 921,720 | |||||||||
| Interest expense | 555,559 | 526,592 | 484,622 | |||||||||
| Consolidated net operating income (NOI) | $ | 2,431,264 | $ | 2,267,482 | $ | 2,232,716 | ||||||
| NOI by segment: | ||||||||||||
| Seniors Housing Operating | $ | 1,039,520 | $ | 985,022 | $ | 880,026 | ||||||
| Triple-net | 918,743 | 900,049 | 967,084 | |||||||||
| Outpatient Medical | 469,035 | 380,136 | 384,068 | |||||||||
| Non-segment/corporate | 3,966 | 2,275 | 1,538 | |||||||||
| Total NOI | $ | 2,431,264 | $ | 2,267,482 | $ | 2,232,716 |
Item 7. Management’s Discussion and Analysis of Financial Condition and Results of Operations
The following is a reconciliation of our consolidated NOI to same store NOI for the periods presented for the respective pools. Dollar amounts are in thousands.
| 2018 and 2019 Same Store Pool | 2017 and 2018 Same Store Pool | |||||||||||||||
| SSNOI Reconciliations: | 2019 | 2018 | 2018 | 2017 | ||||||||||||
| NOI: | ||||||||||||||||
| Seniors Housing Operating | $ | 1,039,520 | $ | 985,022 | $ | 985,022 | $ | 880,026 | ||||||||
| Triple-net | 918,743 | 900,049 | 900,049 | 967,084 | ||||||||||||
| Outpatient Medical | 469,035 | 380,136 | 380,136 | 384,068 | ||||||||||||
| Total | 2,427,298 | 2,265,207 | 2,265,207 | 2,231,178 | ||||||||||||
| Adjustments: | ||||||||||||||||
| Seniors Housing Operating: | ||||||||||||||||
| Non-cash SSNOI on same store properties | (1,720 | ) | (1,344 | ) | (1,176 | ) | (1,542 | ) | ||||||||
| NOI attributable to non same store properties | (337,933 | ) | (282,185 | ) | (167,430 | ) | (54,069 | ) | ||||||||
| Subtotal | (339,653 | ) | (283,529 | ) | (168,606 | ) | (55,611 | ) | ||||||||
| Triple-net: | ||||||||||||||||
| Non-cash SSNOI on same store properties | 28,033 | 25,981 | 17,057 | 23,970 | ||||||||||||
| NOI attributable to non same store properties | (430,436 | ) | (417,133 | ) | (401,098 | ) | (482,797 | ) | ||||||||
| Subtotal | (402,403 | ) | (391,152 | ) | (384,041 | ) | (458,827 | ) | ||||||||
| Outpatient Medical: | ||||||||||||||||
| Non-cash SSNOI on same store properties | 7,067 | 7,224 | 9,551 | 9,576 | ||||||||||||
| NOI attributable to non same store properties | (164,490 | ) | (79,221 | ) | (46,628 | ) | (56,654 | ) | ||||||||
| Subtotal | (157,423 | ) | (71,997 | ) | (37,077 | ) | (47,078 | ) | ||||||||
| SSNOI: | ||||||||||||||||
| Seniors Housing Operating | 699,867 | 701,493 | 816,416 | 824,415 | ||||||||||||
| Triple-net | 516,340 | 508,897 | 516,008 | 508,257 | ||||||||||||
| Outpatient Medical | 311,612 | 308,139 | 343,059 | 336,990 | ||||||||||||
| Total | $ | 1,527,819 | $ | 1,518,529 | $ | 1,675,483 | $ | 1,669,662 |
| 2018 and 2019 Same Store Pool | 2017 and 2018 Same Store Pool | |||||||||||||||||||||||
| SSNOI Property Reconciliations: | Seniors Housing Operating | Triple-net | Outpatient Medical | Total | Seniors Housing Operating | Triple-net | Outpatient Medical | Total | ||||||||||||||||
| Total properties | 533 | 658 | 387 | 1,578 | 501 | 726 | 281 | 1,508 | ||||||||||||||||
| Recent acquisitions/development conversions | (77 | ) | (237 | ) | (138 | ) | (452 | ) | (26 | ) | (246 | ) | (44 | ) | (316 | ) | ||||||||
| Developments | (11 | ) | (7 | ) | (4 | ) | (22 | ) | (4 | ) | (9 | ) | (4 | ) | (17 | ) | ||||||||
| Held for sale | (18 | ) | (11 | ) | (42 | ) | (71 | ) | (13 | ) | (40 | ) | (2 | ) | (55 | ) | ||||||||
| Segment transitions | (86 | ) | (18 | ) | — | (104 | ) | (68 | ) | (44 | ) | — | (112 | ) | ||||||||||
| Loans, land parcels and subleases(1) | — | (17 | ) | (6 | ) | (23 | ) | — | (21 | ) | (7 | ) | (28 | ) | ||||||||||
| Same store properties | 341 | 368 | 197 | 906 | 390 | 366 | 224 | 980 | ||||||||||||||||
| (1) Includes eight land parcels, eight subleases and seven loans for the 2018 and 2019 Same Store Pool and nine land parcels, eight subleases and 11 loans for the 2017 and 2018 Same Store Pool. |
Critical Accounting Policies
Our consolidated financial statements are prepared in accordance with U.S. GAAP, which requires us to make estimates and assumptions. Management considers accounting estimates or assumptions critical if:
| • | the nature of the estimates or assumptions is material due to the levels of subjectivity and judgment necessary to account for highly uncertain matters or the susceptibility of such matters to change; and |
| • | the impact of the estimates and assumptions on financial condition or operating performance is material. |
Management has discussed the development and selection of its critical accounting policies with the Audit Committee of the Board of Directors and the Audit Committee has reviewed the disclosure presented below relating to them. Management believes the current assumptions and other considerations used to estimate amounts reflected in our consolidated financial statements are appropriate and are not reasonably likely to change in the future. However, since these estimates require assumptions to be made that were uncertain at the time the estimate was made, they bear the risk of change. If actual experience differs from the assumptions and other considerations used in estimating amounts reflected in our consolidated financial statements, the resulting changes could have a material adverse effect on our consolidated results of operations, liquidity and/or financial condition. Please refer to Note 2 to our consolidated financial statements for further information on significant accounting policies that impact us and for the impact of new accounting standards, including accounting pronouncements that were issued but not yet adopted by us.
The following table presents information about our critical accounting policies, as well as the material assumptions used to develop each estimate:
Item 7. Management’s Discussion and Analysis of Financial Condition and Results of Operations
| Nature of Critical Accounting Estimate | Assumptions/Approach Used | |
| Impairment of Real Property Assessing impairment of real property involves subjectivity in determining if indicators of impairment are present and in estimating the future undiscounted cash flows or estimated fair value of an asset. In estimating the undiscounted cash flows or fair value, key assumptions that would be made are the estimation of future rental revenues, operating expenses, capitalization rates and the ability and intent to hold the respective asset, all of which are affected by our expectations of future market or economic conditions. These estimates can have a significant impact on the undiscounted cash flows or estimated fair value of an asset. | Quarterly, we evaluate our real estate investments on a property by property basis to determine if there are indicators of impairment. These indicators may include expected operational performance, the tenant's ability to make rent payments, a decision to dispose of an asset before the end of its estimated useful life and changes in the market that may permanently reduce the value of the property. If indicators of impairment exist, an undiscounted cash flow analysis will be prepared and the results of such analysis will be compared to the current net book value to determine if an impairment charge is necessary. This analysis requires us to use judgment in determining whether indicators of impairment exist and to estimate the expected future undiscounted cash flows or estimated fair values of the property. Properties that meet the held for sale criteria are recorded at the lesser of the fair value less costs to sell or carrying value. | |
| Real Estate Acquisitions We believe that substantially all of our real estate acquisitions are considered asset acquisitions for which we record the related real estate acquired (tangible assets and identifiable intangible assets and liabilities) at cost on a relative fair value basis. Liabilities assumed and any associated noncontrolling interests are reflected at fair value. Tangible assets consist primarily of land, building and improvements. Identifiable intangible assets and liabilities primarily consist of the above or below market component of in-place leases and the value of in-place leases. The total amount of other intangible assets acquired is further allocated to in-place lease values and customer relationship values based on management's evaluation of the specific characteristics of each tenant's lease and our overall relationship with respect to that tenant. | The allocation of the purchase price to the related real estate acquired (tangible assets and intangible assets and liabilities) involves subjectivity as such allocations are based on a relative fair value analysis. In determining the fair values that drive such analysis, we estimate the fair value of each component of the real estate acquired which generally includes land, buildings and improvements, the above or below market component of in-place leases and the value of in-place leases. Significant assumptions used to determine such fair values include comparable land sales, capitalization rates, discount rates, market rental rates and property operating data, all of which can be impacted by expectations about future market or economic conditions. Our estimates of the values of these components affect the amount of depreciation and amortization we record over the estimated useful life of the property or the term of the lease. | |
| Principles of Consolidation The consolidated financial statements include our accounts, the accounts of our wholly-owned subsidiaries, and the accounts of joint venture entities in which we own a majority voting interest with the ability to control operations and where no substantive participating rights or substantive kick out rights have been granted to the noncontrolling interests. In addition, we consolidate those entities deemed to be variable interest entities (“VIEs”) in which we are determined to be the primary beneficiary. All material intercompany transactions and balances have been eliminated in consolidation. | We make judgments about which entities are VIEs based on an assessment of whether (i) the equity investors as a group, if any, do not have a controlling financial interest, or (ii) the equity investment at risk is insufficient to finance that entity’s activities without additional subordinated financial support. We make judgments with respect to our level of influence or control of an entity and whether we are (or are not) the primary beneficiary of a VIE. Consideration of various factors includes, but is not limited to, our ability to direct the activities that most significantly impact the entity's economic performance, our form of ownership interest, our representation on the entity's governing body, the size and seniority of our investment, our ability and the rights of other investors to participate in policy making decisions, replace the manager and/or liquidate the entity, if applicable. Our ability to correctly assess our influence or control over an entity at inception of our involvement or on a continuous basis when determining the primary beneficiary of a VIE affects the presentation of these entities in our consolidated financial statements. If we perform a primary beneficiary analysis at a date other than at inception of the VIE, our assumptions may be different and may result in the identification of a different primary beneficiary. |
Item 7. Management’s Discussion and Analysis of Financial Condition and Results of Operations
| Nature of Critical Accounting Estimate | Assumptions/Approach Used | |
| Allowance for Loan Losses The allowance for loan losses is maintained at a level believed adequate to absorb potential losses in our loans receivable. The determination of the allowance is based on a quarterly evaluation of all outstanding loans. If this evaluation indicates that there is a greater risk of loan charge-offs, additional allowances or placement on non-accrual status may be required. A loan is impaired when, based on current information and events, it is probable that we will be unable to collect all amounts due as scheduled according to the contractual terms of the original loan agreement or if it has been modified in a troubled debt restructuring. Consistent with this definition, all loans on non-accrual are deemed impaired. To the extent circumstances improve and the risk of collectability is diminished, we will return these loans to income accrual status. | The determination of the allowance is based on a quarterly evaluation of all outstanding loans, including general economic conditions and estimated collectability of loan payments. We evaluate the collectability of our loans receivable based on a combination of factors, including, but not limited to, delinquency status, historical loan charge-offs, financial strength of the borrower and guarantors, and value of the underlying collateral. Any loans with collectability concerns are subjected to a projected payoff valuation. The valuation is based on the expected future cash flows and/or the estimated fair value of the underlying collateral. The valuation is compared to the outstanding balance to determine the reserve needed for each loan. We may base our valuation on the fair value of collateral, net of sales costs, if the repayment of the loan is expected to be provided solely by the collateral. |
Item 7A. Quantitative and Qualitative Disclosures About Market Risk
We are exposed to various market risks, including the potential loss arising from adverse changes in interest rates and foreign currency exchange rates. We seek to mitigate the underlying foreign currency exposures with gains and losses on derivative contracts hedging these exposures. We seek to mitigate the effects of fluctuations in interest rates by matching the terms of new investments with new long-term fixed rate borrowings to the extent possible. We may or may not elect to use financial derivative instruments to hedge interest rate exposure. These decisions are principally based on our policy to match our variable rate investments with comparable borrowings, but are also based on the general trend in interest rates at the applicable dates and our perception of the future volatility of interest rates. This section is presented to provide a discussion of the risks associated with potential fluctuations in interest rates and foreign currency exchange rates. For more information, see Notes 12 and 17 to our consolidated financial statements.
We historically borrow on our unsecured revolving credit facility and commercial paper program to acquire, construct or make loans relating to health care and seniors housing properties. Then, as market conditions dictate, we will issue equity or long-term fixed rate debt to repay the borrowings under our unsecured revolving credit facility and commercial paper program. We are subject to risks associated with debt financing, including the risk that existing indebtedness may not be refinanced or that the terms of refinancing may not be as favorable as the terms of current indebtedness. The majority of our borrowings were completed under indentures or contractual agreements that limit the amount of indebtedness we may incur. Accordingly, in the event that we are unable to raise additional equity or borrow money because of these limitations, our ability to acquire additional properties may be limited.
A change in interest rates will not affect the interest expense associated with our fixed rate debt. Interest rate changes, however, will affect the fair value of our fixed rate debt. Changes in the interest rate environment upon maturity of this fixed rate debt could have an effect on our future cash flows and earnings, depending on whether the debt is replaced with other fixed rate debt, variable rate debt or equity or repaid by the sale of assets. To illustrate the impact of changes in the interest rate markets, we performed a sensitivity analysis on our fixed rate debt instruments whereby we modeled the change in net present values arising from a hypothetical 1% increase in interest rates to determine the instruments’ change in fair value. The following table summarizes the analysis performed as of the dates indicated (in thousands):
| December 31, 2019 | December 31, 2018 | |||||||||||||||
| Principal balance | Change in fair value | Principal balance | Change in fair value | |||||||||||||
| Senior unsecured notes | $ | 9,724,691 | $ | (751,848 | ) | $ | 9,009,159 | $ | (548,558 | ) | ||||||
| Secured debt | 1,814,229 | (69,756 | ) | 1,639,983 | (59,522 | ) | ||||||||||
| Totals | $ | 11,538,920 | $ | (821,604 | ) | $ | 10,649,142 | $ | (608,080 | ) |
Our variable rate debt, including our unsecured revolving credit facility and commercial paper program, is reflected at fair value. At December 31, 2019, we had $3,470,584,000 outstanding related to our variable rate debt. Assuming no changes in outstanding balances, a 1% increase in interest rates would result in increased annual interest expense of $34,706,000. At December 31, 2018, we had $2,683,553,000 outstanding under our variable rate debt. Assuming no changes in outstanding balances, a 1% increase in interest rates would have resulted in increased annual interest expense of $26,836,000.
We are subject to currency fluctuations that may, from time to time, affect our financial condition and results of operations. Increases or decreases in the value of the Canadian Dollar or British Pounds Sterling relative to the U.S. Dollar impact the amount of net income we earn from our investments in Canada and the United Kingdom. Based solely on our results for the year ended December 31, 2019, including the impact of existing hedging arrangements, if these exchange rates were to increase or decrease by 10%, our net income from these investments would increase or decrease, as applicable, by less than $13,000,000. We will continue to mitigate these underlying foreign currency exposures with non-U.S. denominated borrowings and gains and losses on derivative contracts. If we increase our international presence through investments in, or acquisitions or development of, seniors housing and health care properties outside the U.S., we may also decide to transact additional business or borrow funds in currencies other than U.S. Dollars, Canadian Dollars or British Pounds Sterling. To illustrate the impact of changes in foreign currency markets, we performed a sensitivity analysis on our derivative portfolio whereby we modeled the change in net present values arising from a hypothetical 1% increase in foreign currency exchange rates to determine the instruments’ change in fair value. The following table summarizes the results of the analysis performed, excluding cross currency hedge activity (dollars in thousands):
| December 31, 2019 | December 31, 2018 | |||||||||||||||
| Carrying value | Change in fair value | Carrying value | Change in fair value | |||||||||||||
| Foreign currency exchange contracts | $ | 26,767 | $ | 12,136 | $ | 23,620 | $ | 16,163 | ||||||||
| Debt designated as hedges | 1,586,116 | 15,861 | 1,559,159 | 15,592 | ||||||||||||
| Totals | $ | 1,612,883 | $ | 27,997 | $ | 1,582,779 | $ | 31,755 |
Item 8. Financial Statements and Supplementary Data
REPORT OF INDEPENDENT REGISTERED PUBLIC ACCOUNTING FIRM
To the Shareholders and the Board of Directors of Welltower Inc.
Opinion on the Financial Statements
We have audited the accompanying consolidated balance sheets of Welltower Inc. and subsidiaries (the Company) as of December 31, 2019 and 2018, the related consolidated statements of comprehensive income, equity and cash flows for each of the three years in the period ended December 31, 2019, and the related notes and financial statement schedules listed in the Index at Item 15(a) (collectively referred to as the “consolidated financial statements”). In our opinion, the consolidated financial statements present fairly, in all material respects, the financial position of the Company at December 31, 2019 and 2018 and the results of its operations and its cash flows for each of the three years in the period ended December 31, 2019, in conformity with U.S. generally accepted accounting principles.
We also have audited, in accordance with the standards of the Public Company Accounting Oversight Board (United States) (PCAOB), the Company’s internal control over financial reporting as of December 31, 2019, based on criteria established in Internal Control – Integrated Framework issued by the Committee of Sponsoring Organizations of the Treadway Commission (2013 framework) and our report dated February 14, 2020 expressed an unqualified opinion thereon.
Adoption of New Accounting Standard
As discussed in Note 2 to the consolidated financial statements, the Company changed its method of accounting for leases effective January 1, 2019.
Basis for Opinion
These financial statements are the responsibility of the Company’s management. Our responsibility is to express an opinion on the Company’s financial statements based on our audits. We are a public accounting firm registered with the PCAOB and are required to be independent with respect to the Company in accordance with the U.S. federal securities laws and the applicable rules and regulations of the Securities and Exchange Commission and the PCAOB.
We conducted our audits in accordance with the standards of the PCAOB. Those standards require that we plan and perform the audit to obtain reasonable assurance about whether the financial statements are free of material misstatement, whether due to error or fraud. Our audits included performing procedures to assess the risks of material misstatement of the financial statements, whether due to error or fraud, and performing procedures that respond to those risks. Such procedures included examining, on a test basis, evidence regarding the amounts and disclosures in the financial statements. Our audits also included evaluating the accounting principles used and significant estimates made by management, as well as evaluating the overall presentation of the financial statements. We believe that our audits provide a reasonable basis for our opinion.
Critical Audit Matters
The critical audit matters communicated below are matters arising from the current period audit of the financial statements that were communicated or required to be communicated to the audit committee and that: (1) relate to accounts or disclosures that are material to the financial statements and (2) involved our especially challenging, subjective, or complex judgments. The communication of critical audit matters does not alter in any way our opinion on the consolidated financial statements, taken as a whole, and we are not, by communicating the critical audit matters below, providing separate opinions on the critical audit matters or on the accounts or disclosures to which they relate.
Impairment of Real Property
| Description of the Matter | At December 31, 2019, the Company’s net real property owned was approximately $30.3 billion. As discussed in Note 2 to the consolidated financial statements, the Company reviews its real property quarterly on a property-by-property basis to determine if facts and circumstances suggest that the real property may be impaired. If the undiscounted cash flows indicate that the real property will not be recoverable, the carrying value of the real property is reduced to its estimated fair value and an impairment charge is recognized for the difference between the carrying value and the fair value. |
Auditing the Company’s process to evaluate real property owned for impairment was complex due to the high degree of subjectivity in determining whether indicators of impairment were present for certain properties, and in determining the future undiscounted cash flows and estimated fair values, if necessary, of properties where indicators of impairment were determined to be present. In particular, the undiscounted cash flows and fair value estimates were sensitive to significant assumptions, including future rental revenues and operating expenses, capitalization rates, and anticipated hold period, which are affected by expectations about future market or economic conditions.
| How We Addressed the |
| Matter in Our Audit |
We obtained an understanding, evaluated the design, and tested the operating effectiveness of controls over the Company’s process to evaluate real property owned for impairment. This included testing controls over the Company’s review of impairment indicators by property and management's review and approval of the significant assumptions described above.
To test the Company's evaluation of real property for impairment, we performed audit procedures that included, among others, assessing the methodologies used by management, evaluating the significant assumptions discussed above and testing the completeness and accuracy of the underlying data used by the Company in its analyses. We compared the significant assumptions used by management to current industry and economic trends and evaluated whether changes to the Company’s business and other relevant factors would affect the significant assumptions. In addition, we assessed the historical accuracy of the Company’s estimates and performed sensitivity analyses of the significant assumptions to evaluate the changes in the undiscounted future cash flows and estimated fair values of the property that would result from changes in the significant assumptions.
Real Estate Acquisitions
| Description of the Matter | During 2019, the Company completed approximately $4.0 billion of real estate acquisitions. As disclosed in Note 3 of the consolidated financial statements, the total purchase price for all properties acquired has been allocated to the related real estate acquired (tangible assets and identifiable intangible assets and liabilities) based upon their relative fair values. |
Auditing the fair values allocated by management to the real estate acquired was complex because the fair value estimates were sensitive to significant assumptions, including comparable land sales, capitalization rates, discount rates, market rental rates and property operating data, which can be impacted by expectations about future market or economic conditions.
| How We Addressed the |
| Matter in Our Audit |
We obtained an understanding, evaluated the design, and tested the operating effectiveness of controls over the Company’s process to account for real estate acquisitions, including controls over the Company’s review of the significant assumptions discussed above.
To test the fair values allocated to the real estate acquired, we performed audit procedures that included, among others, assessing the methodologies used by management and evaluating the significant assumptions used by the Company discussed above. We compared certain of management’s assumptions to external market data for similar properties and tested the clerical accuracy of the valuation models. We involved our valuation specialist in our evaluation of the significant assumptions used by
Showing the first 8K of 167K characters. Open the full section
Item 9. Changes in and Disagreements with Accountants on Accounting and Financial Disclosure
Not applicable.
Item 9A. Controls and Procedures
Disclosure Controls and Procedures
An evaluation was carried out under the supervision and with the participation of our management, including our Chief Executive Officer and Chief Financial Officer, of the effectiveness of the disclosure controls and procedures (as defined in Rule 13a-15(e) of the Securities Exchange Act of 1934, as amended) as of the end of the period covered by this report. Based on that evaluation, the Chief Executive Officer and Chief Financial Officer concluded that the disclosure controls and procedures were effective as of the end of the period covered by this report.
Management’s Report on Internal Control over Financial Reporting
Management is responsible for establishing and maintaining adequate internal control over financial reporting (as defined in Rule 13a-15(f) of the Securities Exchange Act of 1934, as amended). The Company’s internal control over financial reporting is a process designed to provide reasonable assurance regarding the reliability of financial reporting and the preparation of financial statements for external purposes in accordance with U.S. generally accepted accounting principles. The Company’s internal control over financial reporting includes those policies and procedures that (1) pertain to the maintenance of records that, in reasonable detail, accurately and fairly reflect the transactions and dispositions of the assets of the Company; (2) provide reasonable assurance that transactions are recorded as necessary to permit preparation of financial statements in accordance with U.S. generally accepted accounting principles, and that receipts and expenditures of the Company are being made only in accordance with authorizations of management and directors of the Company; and (3) provide reasonable assurance regarding prevention or timely detection of unauthorized acquisition, use, or disposition of the Company’s assets that could have a material effect on the financial statements. Because of its inherent limitations, internal control over financial reporting may not prevent or detect misstatements. Also, projections of any evaluation of effectiveness to future periods are subject to the risk that controls may become inadequate because of changes in conditions, or that the degree of compliance with the policies or procedures may deteriorate.
Management has assessed the effectiveness of the Company’s internal control over financial reporting as of December 31, 2019 based on the criteria established by the Committee of Sponsoring Organizations of the Treadway Commission (2013 framework) in a report entitled Internal Control — Integrated Framework.
Based on this assessment, using the criteria above, management concluded that the Company’s system of internal control over financial reporting was effective as of December 31, 2019.
The independent registered public accounting firm of Ernst & Young LLP, as auditors of the Company’s consolidated financial statements, has issued an attestation report on the Company’s internal control over financial reporting.
Changes in Internal Control over Financial Reporting
No change in our internal control over financial reporting (as defined in Rule 13a-15(f) of the Securities Exchange Act of 1934, as amended) occurred during the fourth quarter of the one-year period covered by this report that materially affected, or is reasonably likely to materially affect, our internal control over financial reporting.
REPORT OF INDEPENDENT REGISTERED PUBLIC ACCOUNTING FIRM
To the Shareholders and the Board of Directors of Welltower Inc.
Opinion on Internal Control over Financial Reporting
We have audited Welltower Inc. and subsidiaries’ internal control over financial reporting as of December 31, 2019, based on criteria established in Internal Control – Integrated Framework issued by the Committee of Sponsoring Organizations of the Treadway Commission (2013 framework) (the COSO criteria). In our opinion, Welltower Inc. and subsidiaries (the Company) maintained, in all material respects, effective internal control over financial reporting as of December 31, 2019, based on the COSO criteria.
We also have audited, in accordance with the standards of the Public Company Accounting Oversight Board (United States) (PCAOB), the consolidated balance sheets of Welltower Inc. and subsidiaries as of December 31, 2019 and 2018, the related consolidated statements of comprehensive income, equity and cash flows for each of the three years in the period ended December 31, 2019, and the related notes and financial statement schedules listed in the index at Item 15(a) and our report dated February 14, 2020 expressed an unqualified opinion thereon.
Basis for Opinion
The Company’s management is responsible for maintaining effective internal control over financial reporting and for its assessment of the effectiveness of internal control over financial reporting included in the accompanying Management’s Report on Internal Control over Financial Reporting. Our responsibility is to express an opinion on the Company’s internal control over financial reporting based on our audit. We are a public accounting firm registered with the PCAOB and are required to be independent with respect to the Company in accordance with the U.S. federal securities laws and the applicable rules and regulations of the Securities and Exchange Commission and the PCAOB.
We conducted our audit in accordance with the standards of the PCAOB. Those standards require that we plan and perform the audit to obtain reasonable assurance about whether effective internal control over financial reporting was maintained in all material respects.
Our audit included obtaining an understanding of internal control over financial reporting, assessing the risk that a material weakness exists, testing and evaluating the design and operating effectiveness of internal control based on the assessed risk, and performing such other procedures as we considered necessary in the circumstances. We believe that our audit provides a reasonable basis for our opinion.
Definition and Limitations of Internal Control over Financial Reporting
A company’s internal control over financial reporting is a process designed to provide reasonable assurance regarding the reliability of financial reporting and the preparation of financial statements for external purposes in accordance with generally accepted accounting principles. A company’s internal control over financial reporting includes those policies and procedures that (1) pertain to the maintenance of records that, in reasonable detail, accurately and fairly reflect the transactions and dispositions of the assets of the company; (2) provide reasonable assurance that transactions are recorded as necessary to permit preparation of financial statements in accordance with generally accepted accounting principles, and that receipts and expenditures of the company are being made only in accordance with authorizations of management and directors of the company; and (3) provide reasonable assurance regarding prevention or timely detection of unauthorized acquisition, use, or disposition of the company’s assets that could have a material effect on the financial statements.
Because of its inherent limitations, internal control over financial reporting may not prevent or detect misstatements. Also, projections of any evaluation of effectiveness to future periods are subject to the risk that controls may become inadequate because of changes in conditions, or that the degree of compliance with the policies or procedures may deteriorate.
/s/ Ernst & Young LLP
Toledo, Ohio
February 14, 2020
Item 9B. Other Information
None.
PART III
Item 10. Directors, Executive Officers and Corporate Governance
The information required by this Item is incorporated herein by reference to the information under the headings “Election of Directors,” “Corporate Governance,” “Executive Officers,” and “Security Ownership of Directors and Management and Certain Beneficial Owners — Section 16(a) Beneficial Ownership Reporting Compliance” in our definitive proxy statement, which will be filed with the Securities and Exchange Commission (the “Commission”) prior to May 1, 2020.
We have adopted a Code of Business Conduct and Ethics that applies to our directors, officers and employees. The code is posted on the Internet at www.welltower.com/investors/governance. Any amendment to, or waivers from, the code that relate to any officer or director of the company will be promptly disclosed on the Internet at www.welltower.com.
In addition, the Board has adopted charters for the Audit, Compensation and Nominating/Corporate Governance Committees. These charters are posted on the Internet at www.welltower.com/investors/governance. Please refer to “Item 7 – Management’s Discussion and Analysis of Financial Condition and Results of Operations – Executive Summary – Corporate Governance” in the Annual Report on Form 10-K for further discussion of corporate governance.
The information on our website is not incorporated by reference in this Annual Report on Form 10-K, and our web address is included as an inactive textual reference only.
Item 11. Executive Compensation
The information required by this Item is incorporated herein by reference to the information under the headings “Executive Compensation” and “Director Compensation” in our definitive proxy statement, which will be filed with the Commission prior to May 1, 2020.
Item 12. Security Ownership of Certain Beneficial Owners and Management and Related Stockholder Matters
The information required by this Item is incorporated herein by reference to the information under the headings “Security Ownership of Directors and Management and Certain Beneficial Owners” and “Equity Compensation Plan Information” in our definitive proxy statement, which will be filed with the Commission prior to May 1, 2020.
Item 13. Certain Relationships and Related Transactions and Director Independence
The information required by this Item is incorporated herein by reference to the information under the headings “Corporate Governance — Independence and Meetings” and “Security Ownership of Directors and Management and Certain Beneficial Owners — Certain Relationships and Related Transactions” in our definitive proxy statement, which will be filed with the Commission prior to May 1, 2020.
Item 14. Principal Accounting Fees and Services
The information required by this Item is incorporated herein by reference to the information under the heading “Ratification of the Appointment of the Independent Registered Public Accounting Firm” in our definitive proxy statement, which will be filed with the Commission prior to May 1, 2020.
PART IV
Item 15. Exhibits and Financial Statement Schedules
1. (i) Our Consolidated Financial Statements are included in Part II, Item 8:
| Report of Independent Registered Public Accounting Firm | 61 |
| Consolidated Balance Sheets – December 31, 2019 and 2018 | 63 |
| Consolidated Statements of Comprehensive Income — Years ended December 31, 2019, 2018 and 2017 | 64 |
| Consolidated Statements of Equity — Years ended December 31, 2019, 2018 and 2017 | 66 |
| Consolidated Statements of Cash Flows — Years ended December 31, 2019, 2018 and 2017 | 67 |
| Notes to Consolidated Financial Statements | 68 |
(ii) The following Financial Statement Schedules are included beginning on page 105
III – Real Estate and Accumulated Depreciation
IV – Mortgage Loans on Real Estate
The financial statement schedule required by Item15(a) (Schedule II, Valuation and Qualifying Accounts) is included in Item 8 of this Annual Report on Form 10-K.
2. Exhibits:
The exhibits listed below are either filed with this Form 10-K or incorporated by reference in accordance with Rule 12b-32 of the Securities Exchange Act of 1934.
| 4.4(c) | Second Supplemental Indenture, dated as of December 20, 2019, by and among HCN Canadian Holdings-1 LP, the Company and BNY Trust Company of Canada. |
| 4.5 | Description of Securities of the Registrant. |
| 10.7 | Summary of Director Compensation (filed with the Commission as Exhibit 10.2 to the Company's Form 10-Q filed August 1, 2019 (File No. 001-08923), and incorporated by reference thereto).* |
| 10.14(a) | Welltower Inc. 2020-2022 Long-Term Incentive Program.* |
10.14(b) Form of Restricted Stock Unit Award Agreement under the 2020-2022 Long-Term Incentive Program.*
21 Subsidiaries of the Company.
23 Consent of Ernst & Young LLP, independent registered public accounting firm.
31.1 Rule 13a-14(a)/15d-14(a) Certification of Chief Executive Officer.
31.2 Rule 13a-14(a)/15d-14(a) Certification of Chief Financial Officer.
32.1 Certification pursuant to 18 U.S.C. Section 1350 by Chief Executive Officer.
32.2 Certification pursuant to 18 U.S.C. Section 1350 by Chief Financial Officer.
101.INS Inline XBRL Instance Document. The instance document does not appear in the Interactive Data File because its XBRL tags are embedded within the Inline XBRL document.
101.SCH Inline XBRL Taxonomy Extension Schema Document
101.CAL Inline XBRL Taxonomy Extension Calculation Linkbase Document
101.LAB Inline XBRL Taxonomy Extension Label Linkbase Document
101.PRE Inline XBRL Taxonomy Extension Presentation Linkbase Document
101.DEF Inline XBRL Taxonomy Extension Definition Linkbase Document
| 104 | The cover page from the Company's Annual Report on Form 10-K for the year ended December 31, 2019, formatted in Inline XBRL (included in Exhibit 101) |
| * | Management Contract or Compensatory Plan or Arrangement. |
Item 16. Form 10-K Summary
None.
SIGNATURES
Pursuant to the requirements of Section 13 or 15(d) of the Securities Exchange Act of 1934, the Registrant has duly caused this report to be signed on its behalf by the undersigned, thereunto duly authorized.
Date: February 14, 2020
WELLTOWER INC.
By: /s/ Thomas J. DeRosa
Thomas J. DeRosa,
Chairman and Chief Executive Officer
Pursuant to the requirements of the Securities Exchange Act of 1934, this report has been signed below on February 14, 2020 by the following persons on behalf of the Registrant and in the capacities indicated.
| /s/ Jeffrey H. Donahue ** | /s/ Kathryn M. Sullivan ** | |
| Jeffrey H. Donahue, Lead Director | Kathryn M. Sullivan, Director | |
| /s/ Kenneth J. Bacon ** | /s/ R. Scott Trumbull ** | |
| Kenneth J. Bacon, Director | R. Scott Trumbull, Director | |
| /s/ Karen B. DeSalvo ** | /s/ Thomas J. DeRosa ** | |
| Karen B. DeSalvo, Director | Thomas J. DeRosa, Chairman and Chief Executive Officer | |
| (Principal Executive Officer) | ||
| /s/ Sharon M. Oster ** | /s/ Timothy G. McHugh ** | |
| Sharon M. Oster, Director | Timothy G. McHugh, Senior Vice President and Chief | |
| Financial Officer (Principal Financial Officer) | ||
| /s/ Sergio D. Rivera ** | /s/ Joshua T. Fieweger** | |
| Sergio D. Rivera, Director | Joshua T. Fieweger, Senior Vice President and | |
| Controller (Principal Accounting Officer) | ||
| /s/ Johnese M. Spisso ** | ||
| Johnese M. Spisso, Director | **By: /s/ Thomas J. DeRosa | |
| Thomas J. DeRosa, Attorney-in-Fact | ||
| Welltower Inc. | ||||||||||||||||||||||||||||||||||
| Schedule III | ||||||||||||||||||||||||||||||||||
| Real Estate and Accumulated Depreciation | ||||||||||||||||||||||||||||||||||
| December 31, 2019 | ||||||||||||||||||||||||||||||||||
| (Dollars in thousands) | ||||||||||||||||||||||||||||||||||
| Initial Cost to Company | Gross Amount at Which Carried at Close of Period | |||||||||||||||||||||||||||||||||
| Description | Encumbrances | Land | Building & Improvements | Cost Capitalized Subsequent to Acquisition | Land | Building & Improvements | Accumulated Depreciation(1) | Year Acquired | Year Built | Address | ||||||||||||||||||||||||
| Seniors Housing Operating: | ||||||||||||||||||||||||||||||||||
| Adderbury, UK | $ | — | $ | 2,144 | $ | 12,549 | $ | 657 | $ | 2,230 | $ | 13,120 | $ | 1,032 | 2015 | 2017 | Banbury Road | |||||||||||||||||
| Albertville, AL | — | 170 | 6,203 | 489 | 176 | 6,686 | 1,998 | 2010 | 1999 | 151 Woodham Dr. | ||||||||||||||||||||||||
| Albuquerque, NM | — | 1,270 | 20,837 | 2,653 | 1,354 | 23,406 | 7,255 | 2010 | 1984 | 500 Paisano St NE | ||||||||||||||||||||||||
| Alexandria, VA | — | 8,280 | 50,914 | 296 | 8,280 | 51,210 | 2,459 | 2016 | 2018 | 5550 Cardinal Place | ||||||||||||||||||||||||
| Altrincham, UK | — | 4,244 | 25,187 | 3,274 | 4,565 | 28,140 | 6,892 | 2012 | 2009 | 295 Hale Road | ||||||||||||||||||||||||
| Amherst, NY | — | 1,131 | 10,520 | 806 | 1,131 | 11,326 | 623 | 2019 | 2013 | 1880 Sweet Home Road | ||||||||||||||||||||||||
| Amherstview, ON | — | 473 | 4,446 | 691 | 519 | 5,091 | 1,019 | 2015 | 1974 | 4567 Bath Road | ||||||||||||||||||||||||
| Anderson, SC | — | 710 | 6,290 | 878 | 710 | 7,168 | 3,811 | 2003 | 1986 | 311 Simpson Rd. | ||||||||||||||||||||||||
| Ankeny, IA | — | 1,129 | 10,239 | — | 1,129 | 10,239 | 970 | 2016 | 2012 | 1275 SW State Street | ||||||||||||||||||||||||
| Apple Valley, CA | — | 480 | 16,639 | 856 | 486 | 17,489 | 5,084 | 2010 | 1999 | 11825 Apple Valley Rd. | ||||||||||||||||||||||||
| Arlington, TX | — | 1,660 | 37,395 | 3,019 | 1,660 | 40,414 | 10,850 | 2012 | 2000 | 1250 West Pioneer Parkway | ||||||||||||||||||||||||
| Arlington, VA | — | 8,385 | 31,198 | 15,162 | 8,386 | 46,359 | 13,165 | 2017 | 1992 | 900 N Taylor Street | ||||||||||||||||||||||||
| Arlington, VA | — | — | 2,338 | 1,657 | 5 | 3,990 | 259 | 2018 | 1992 | 900 N Taylor Street | ||||||||||||||||||||||||
| Arnprior, ON | — | 788 | 6,283 | 880 | 851 | 7,100 | 1,783 | 2013 | 1991 | 15 Arthur Street | ||||||||||||||||||||||||
| Atlanta, GA | — | 2,058 | 14,914 | 2,148 | 2,080 | 17,040 | 12,165 | 1997 | 1999 | 1460 S Johnson Ferry Rd. | ||||||||||||||||||||||||
| Atlanta, GA | — | 2,100 | 20,603 | 1,824 | 2,197 | 22,330 | 4,829 | 2014 | 2000 | 1000 Lenox Park Blvd NE | ||||||||||||||||||||||||
| Austin, TX | — | 880 | 9,520 | 1,902 | 885 | 11,417 | 6,144 | 1999 | 1998 | 12429 Scofield Farms Dr. | ||||||||||||||||||||||||
| Austin, TX | — | 1,560 | 21,413 | 750 | 1,560 | 22,163 | 3,533 | 2014 | 2013 | 11330 Farrah Lane | ||||||||||||||||||||||||
| Austin, TX | — | 4,200 | 74,850 | 1,287 | 4,200 | 76,137 | 10,166 | 2015 | 2014 | 4310 Bee Caves Road | ||||||||||||||||||||||||
| Bagshot, UK | — | 4,960 | 29,881 | 6,822 | 5,340 | 36,323 | 8,360 | 2012 | 2009 | 14 - 16 London Road | ||||||||||||||||||||||||
| Banstead, UK | — | 6,695 | 55,113 | 9,912 | 7,246 | 64,474 | 14,801 | 2012 | 2005 | Croydon Lane | ||||||||||||||||||||||||
| Basingstoke, UK | — | 3,420 | 18,853 | 1,958 | 3,678 | 20,553 | 3,155 | 2014 | 2012 | Grove Road | ||||||||||||||||||||||||
| Basking Ridge, NJ | — | 2,356 | 37,710 | 1,738 | 2,395 | 39,409 | 9,083 | 2013 | 2002 | 404 King George Road | ||||||||||||||||||||||||
| Bassett, UK | — | 4,874 | 32,304 | 8,919 | 5,255 | 40,842 | 10,030 | 2013 | 2006 | 111 Burgess Road | ||||||||||||||||||||||||
| Bath, UK | — | 2,696 | 11,876 | 783 | 2,805 | 12,550 | 979 | 2015 | 2017 | Clarks Way, Rush Hill | ||||||||||||||||||||||||
| Baton Rouge, LA | 12,930 | 790 | 29,436 | 1,242 | 886 | 30,582 | 6,912 | 2013 | 2009 | 9351 Siegen Lane | ||||||||||||||||||||||||
| Beaconsfield, UK | — | 5,566 | 50,952 |
Showing the first 8K of 292K characters. Open the full section