 filings.tools
Item 5. Market for Registrant’s Common Equity, Related Stockholder Matters and Issuer Purchases of Equity Securities
4K characters. Original on sec.gov · Markdown
Item 5. Market for Registrant’s Common Equity, Related Stockholder Matters and Issuer Purchases of Equity Securities
Our common stock is listed on the New York Stock Exchange under the symbol “WMB.” At the close of business on February 17, 2023, we had 6,013 holders of record of our common stock.
Share Repurchase Program
| ISSUER PURCHASES OF EQUITY SECURITIES | ||||||||||||||||||||||||||
| Period | (a) Total Number of Shares Purchased | (b) Average Price Paid Per Share | (c) Total Number of Shares Purchased as Part of Publicly Announced Plans or Programs**(1)** | (d) Maximum Number (or Approximate Dollar Value) of Shares that May Yet Be Purchased Under the Plans or Programs | ||||||||||||||||||||||
| October 1 - October 31, 2022 | — | $ | — | — | $ | 1,491,248,057 | ||||||||||||||||||||
| November 1 - November 30, 2022 | — | $ | — | — | $ | 1,491,248,057 | ||||||||||||||||||||
| December 1 - December 31, 2022 | — | $ | — | — | $ | 1,491,248,057 | ||||||||||||||||||||
| Total | — | — |
(1)We announced a stock repurchase program on September 8, 2021. Our board of directors has authorized the repurchase of up to $1.5 billion of the company’s common stock. The stock repurchase program has no expiration date. We intend to purchase shares of our stock from time to time in open market transactions, block purchases, privately negotiated or structured transactions, or in such other manner as determined at our discretion, subject to market conditions and other factors.
Performance Graph
Set forth below is a line graph comparing our cumulative total stockholder return on our common stock (assuming reinvestment of dividends) with the cumulative total return of the S&P 500 Stock Index, the Bloomberg Americas Pipelines Index, and the Arca Natural Gas Index for the period of five fiscal years commencing January 1, 2018. The Bloomberg Americas Pipelines Index is composed of Enbridge Inc., TC Energy Corporation, Kinder Morgan, Inc., ONEOK, Inc., Cheniere Energy, Inc., Pembina Pipeline Corporation, Targa Resources Corp., New Fortress Energy Inc., and Williams. The Arca Natural Gas Index is comprised of over 20 highly capitalized companies in the natural gas industry involved primarily in natural gas exploration and production and natural gas pipeline transportation and transmission. The graph below assumes an investment of $100 at the beginning of the period.
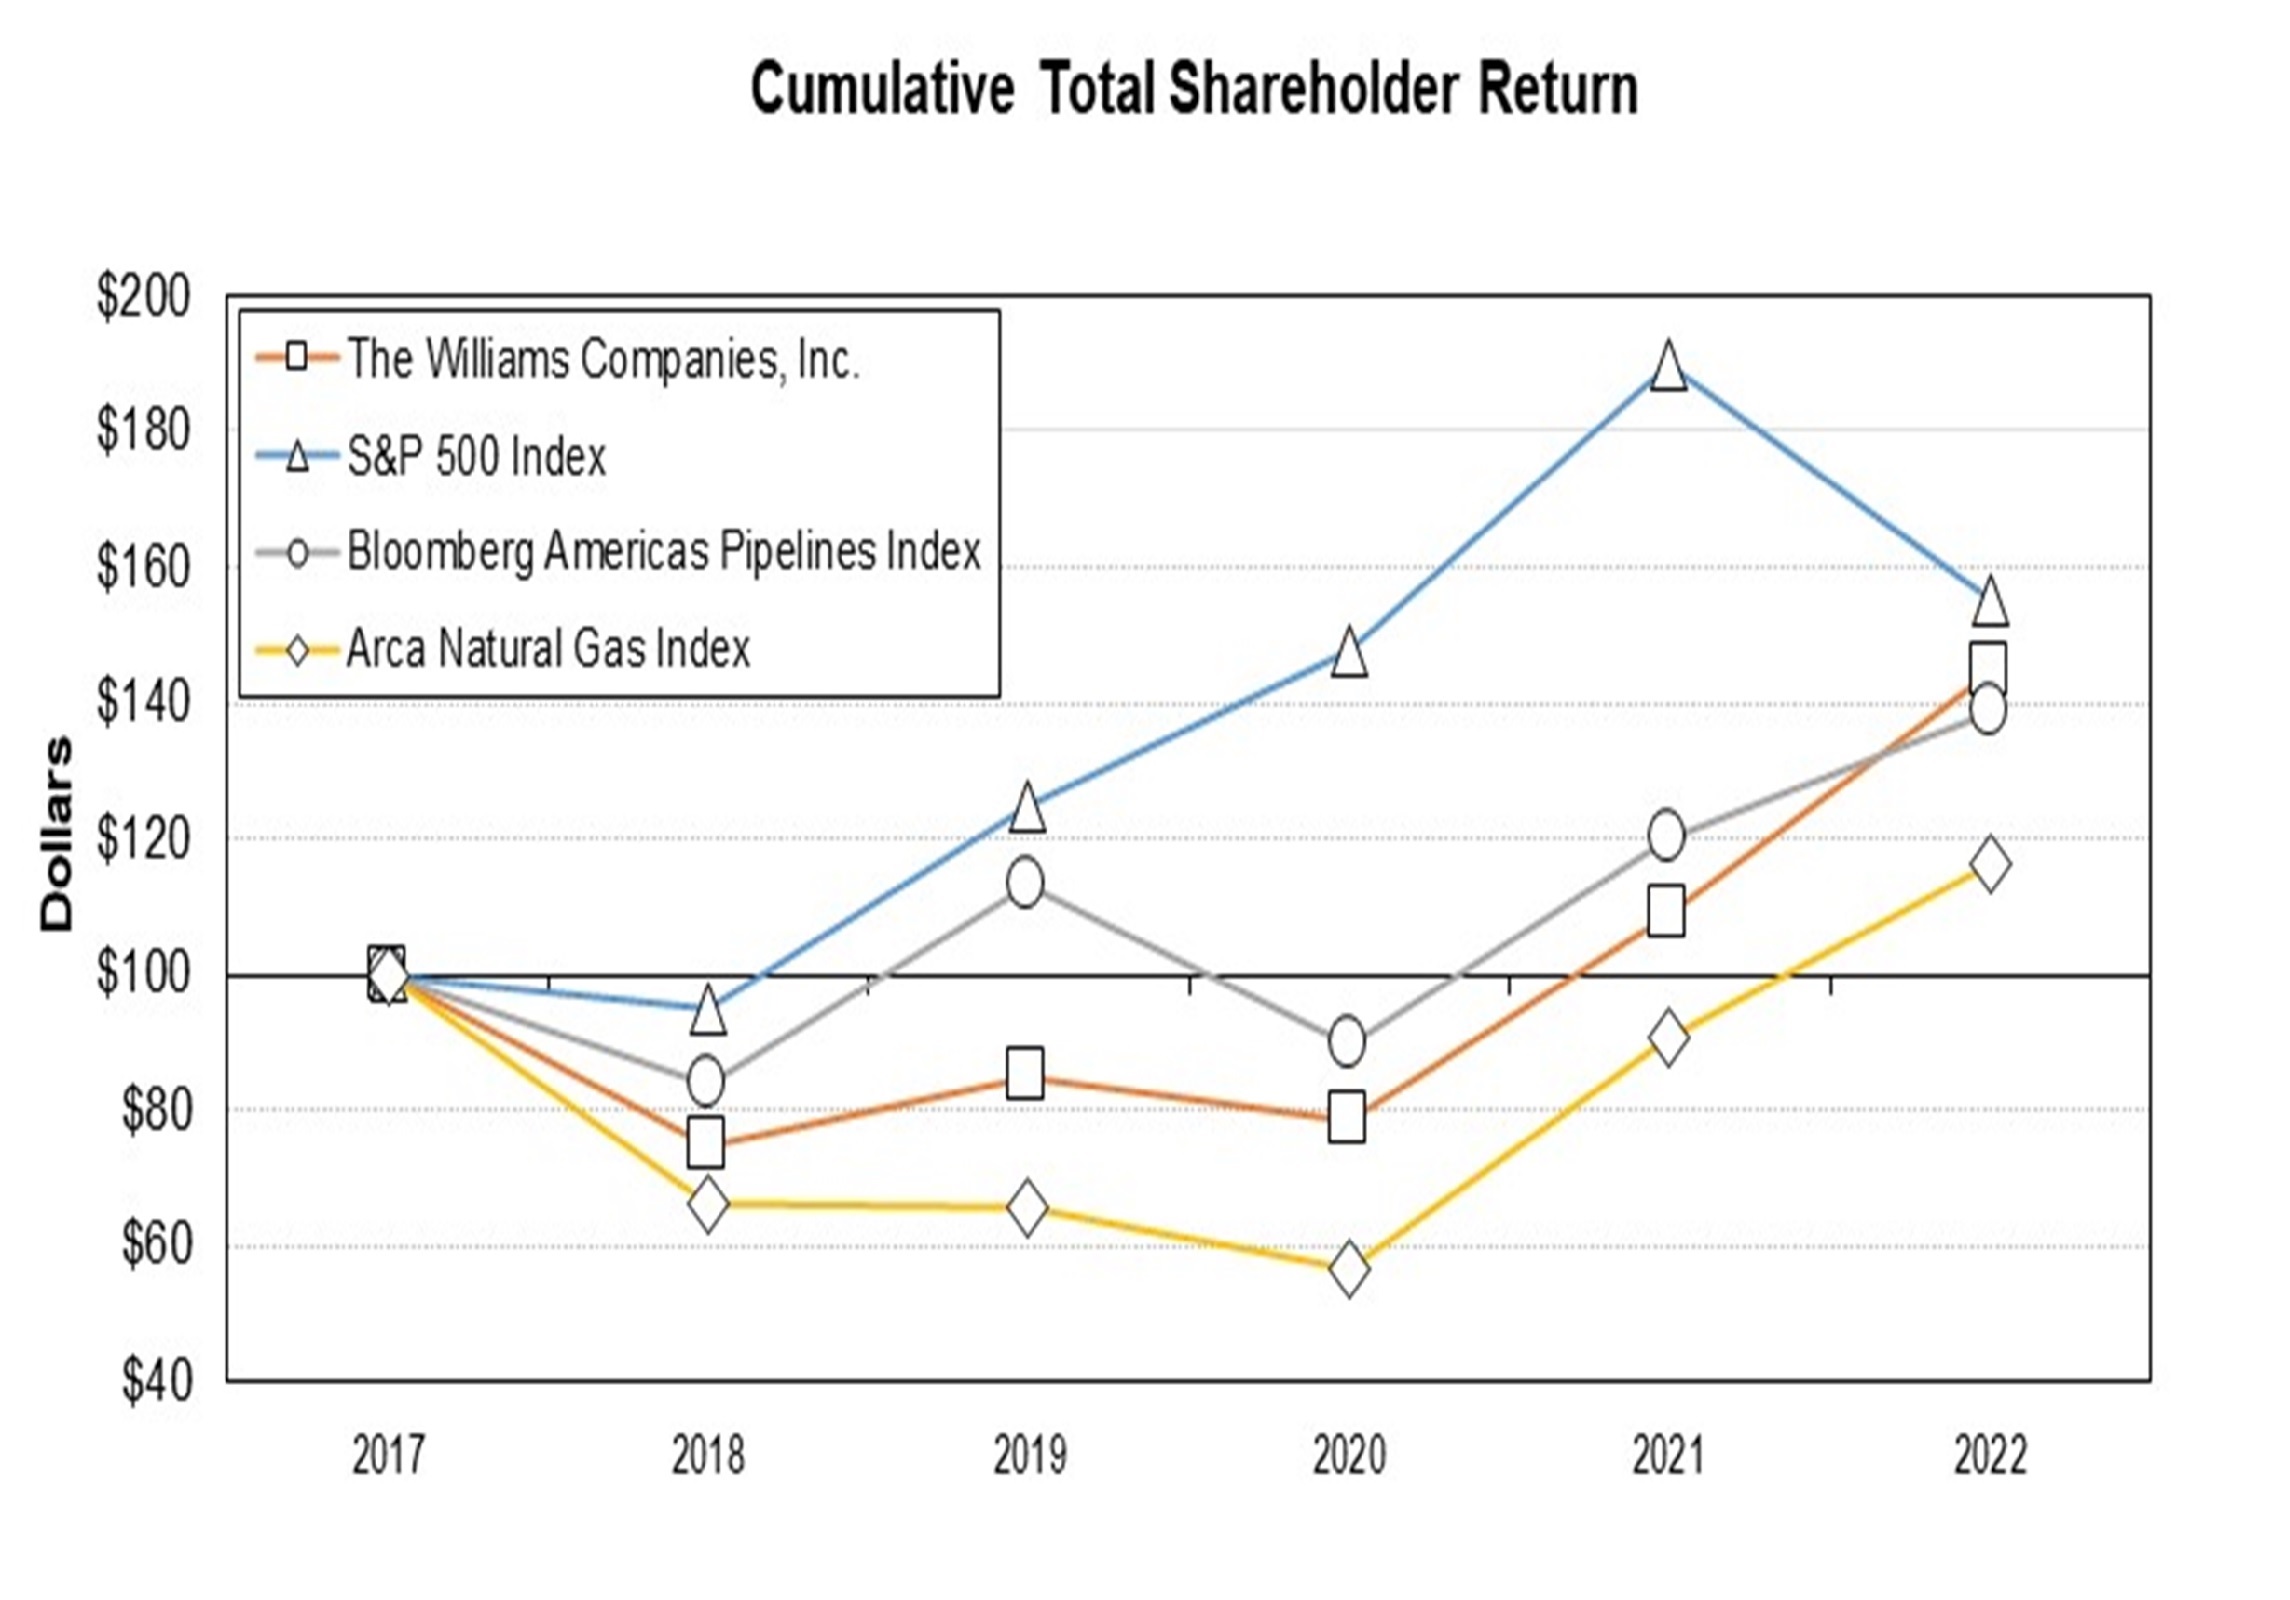
| 2017 | 2018 | 2019 | 2020 | 2021 | 2022 | ||||||||||||||||||||||||||||||
| The Williams Companies, Inc. | 100.0 | 74.5 | 85.1 | 78.7 | 108.9 | 144.8 | |||||||||||||||||||||||||||||
| S&P 500 Index | 100.0 | 94.8 | 124.7 | 147.6 | 189.9 | 155.5 | |||||||||||||||||||||||||||||
| Bloomberg Americas Pipelines Index | 100.0 | 83.8 | 113.4 | 89.7 | 120.3 | 139.0 | |||||||||||||||||||||||||||||
| Arca Natural Gas Index | 100.0 | 66.4 | 65.5 | 56.7 | 91.0 | 116.5 |
Previous: Item 4. Mine Safety Disclosures · Next: Item 7. Management’s Discussion and Analysis of Financial Condition and Results of Operations