 filings.tools
Williams-Sonoma 10-K 2019-02-03
Filed 2019-04-04. 22 sections, 312K characters. Original on sec.gov · Markdown · JSON
Cover and table of contents
10-K 1 d683578d10k.htm 10-K
Table of Contents
UNITED STATES
SECURITIES AND EXCHANGE COMMISSION
WASHINGTON, D.C. 20549
FORM 10-K
(Mark One):
| ☒ | ANNUAL REPORT PURSUANT TO SECTION 13 OR 15(d) OF THE SECURITIES EXCHANGE ACT OF 1934 |
|---|
For the fiscal year ended February 3, 2019.
OR
| ☐ | TRANSITION REPORT PURSUANT TO SECTION 13 OR 15(d) OF THE SECURITIES EXCHANGE ACT OF 1934 |
|---|
For the transition period from to
Commission file number 001-14077
WILLIAMS-SONOMA, INC.
(Exact name of registrant as specified in its charter)
| Delaware | 94-2203880 | |
| (State or other jurisdiction of incorporation or organization) | (I.R.S. Employer Identification No.) | |
| 3250 Van Ness Avenue, San Francisco, CA | 94109 | |
| (Address of principal executive offices) | (Zip Code) |
Registrant’s telephone number, including area code: (415) 421-7900
Securities registered pursuant to Section 12(b) of the Act:
| Common Stock, $.01 par value | New York Stock Exchange, Inc. | |
| (Title of class) | (Name of each exchange on which registered) |
Securities registered pursuant to Section 12(g) of the Act: None
Indicate by check mark if the registrant is a well-known seasoned issuer, as defined in Rule 405 of the Securities Act. Yes ☒ No ☐
Indicate by check mark if the registrant is not required to file reports pursuant to Section 13 or Section 15(d) of the Act. Yes ☐ No ☒
Indicate by check mark whether the registrant (1) has filed all reports required to be filed by Section 13 or 15(d) of the Securities Exchange Act of 1934 during the preceding 12 months (or for such shorter period that the registrant was required to file such reports), and (2) has been subject to such filing requirements for the past 90 days. Yes ☒ No ☐
Indicate by check mark whether the registrant has submitted electronically every Interactive Data File required to be submitted pursuant to Rule 405 of Regulation S-T (§232.405 of this chapter) during the preceding 12 months (or for such shorter period that the registrant was required to submit such files). Yes ☒ No ☐
Indicate by check mark if disclosure of delinquent filers pursuant to Item 405 of Regulation S-K (§229.405 of this chapter) is not contained herein, and will not be contained, to the best of registrant’s knowledge, in definitive proxy or information statements incorporated by reference in Part III of this Form 10-K or any amendment to this Form 10-K. ☒
Indicate by check mark whether the registrant is a large accelerated filer, an accelerated filer, a non-accelerated filer, a smaller reporting company, or emerging growth company. See definitions of “large accelerated filer,” “accelerated filer,” “smaller reporting company,” and “emerging growth company” in Rule 12b-2 of the Exchange Act.
Large accelerated filer ☒ Accelerated filer ☐ Non-accelerated filer ☐ Smaller reporting company ☐ Emerging growth company ☐
If an emerging growth company, indicate by check mark if the registrant has elected not to use the extended transition period for complying with any new or revised financial accounting standards provided pursuant to Section 13(a) of the Exchange Act. ☐
Indicate by check mark whether the registrant is a shell company (as defined in Rule 12b-2 of the Act). Yes ☐ No ☒
As of July 29, 2018, the approximate aggregate market value of the registrant’s common stock held by non-affiliates was $4,678,185,000. It is assumed for purposes of this computation that an affiliate includes all persons as of July 29, 2018 listed as executive officers and directors with the Securities and Exchange Commission. This aggregate market value includes all shares held in the Williams-Sonoma, Inc. Stock Fund within the registrant’s 401(k) Plan.
As of March 31, 2019, 78,563,968 shares of the registrant’s common stock were outstanding.
Table of Contents
DOCUMENTS INCORPORATED BY REFERENCE
Portions of our definitive Proxy Statement for the 2019 Annual Meeting of Stockholders, also referred to in this Annual Report on Form 10-K as our Proxy Statement, which will be filed with the Securities and Exchange Commission, or SEC, have been incorporated in Part III hereof.
FORWARD-LOOKING STATEMENTS
This Annual Report on Form 10-K and the letter to stockholders contained in this Annual Report contain forward-looking statements within the “safe harbor” provisions of the Private Securities Litigation Reform Act of 1995 that involve risks and uncertainties, as well as assumptions that, if they do not fully materialize or prove incorrect, could cause our business and operating results to differ materially from those expressed or implied by such forward-looking statements. Such forward-looking statements include, without limitation, statements related to: projections of earnings, revenues, growth and other financial items; the strength of our business and our brands; our ability to execute strategic priorities and growth initiatives regarding digital leadership, product and technology innovation, cross-brand initiatives, retail transformation and operational excellence; our beliefs about our competitive advantages and areas of potential future growth in the market; our ability to drive long-term sustainable returns; the plans, strategies, initiatives and objectives of management for future operations; our brands, products and related initiatives, including our ability to introduce new brands, brand extensions, products and product lines and bring in new customers; our belief that our e-commerce websites and direct-mail catalogs act as a cost-efficient means of testing market acceptance of new products and new brands; the complementary nature of our e-commerce and retail channels; our marketing efforts; our acquisition of Outward, Inc., including the valuation of intangible assets acquired; our global business and expansion efforts, including franchise, other third-party arrangements and company-owned operations; our ability to attract new customers; the seasonal variations in demand; our ability to recruit, retain and motivate skilled personnel; our belief in the reasonableness of the steps taken to protect the security and confidentiality of the information we collect; our belief in the adequacy of our facilities and the availability of suitable additional or substitute space; our belief in the ultimate resolution of current legal proceedings; the payment of dividends; our stock repurchase program; our capital allocation strategy in fiscal 2019; our planned use of cash in fiscal 2019; our compliance with financial covenants; our belief that our cash on hand and available credit facilities will provide adequate liquidity for our business operations over the next 12 months; the impact of the 2017 Tax Cuts and Jobs Act; the impact of tariffs on our business and our results of operations; our belief regarding the effects of potential losses under our indemnification obligations; the impact of inflation; the effects of changes in our inventory reserves; the impact of new accounting pronouncements; and statements of belief and statements of assumptions underlying any of the foregoing. You can identify these and other forward-looking statements by the use of words such as “will,” “may,” “should,” “expects,” “plans,” “anticipates,” “believes,” “estimates,” “predicts,” “intends,” “potential,” “continue,” or the negative of such terms, or other comparable terminology.
The risks, uncertainties and assumptions referred to above that could cause our results to differ materially from the results expressed or implied by such forward-looking statements include, but are not limited to, those discussed under the heading “Risk Factors” in Item 1A hereto and the risks, uncertainties and assumptions discussed from time to time in our other public filings and public announcements. All forward-looking statements included in this document are based on information available to us as of the date hereof, and we assume no obligation to update these forward-looking statements.
Table of Contents
WILLIAMS-SONOMA, INC.
ANNUAL REPORT ON FORM 10-K
FISCAL YEAR ENDED FEBRUARY 3, 2019
TABLE OF CONTENTS
Table of Contents
PART I
Item 1. BUSINESS
| --- | --- |
OVERVIEW
Williams-Sonoma, Inc., incorporated in 1973, is a multi-channel specialty retailer of high quality products for the home.
In 1956, our founder, Chuck Williams, turned a passion for cooking and eating with friends into a small business with a big idea. He opened a store in Sonoma, California, to sell the French cookware that intrigued him while visiting Europe but that could not be found in America. Chuck’s business, which set a standard for customer service, took off and helped fuel a revolution in American cooking and entertaining that continues today.
In the decades that followed, the quality of our products, our ability to identify new opportunities in the market and our people-first approach to business have facilitated our expansion beyond the kitchen into nearly every area of the home. Growth across the Williams-Sonoma, Inc. portfolio has been fueled by three areas of strategic investment: brand experimentation and innovation, for a best-in-class approach to multi-channel retail experiences; operational excellence across the enterprise, from quality product and sourcing, to efficient manufacturing and supply chain; and culture and corporate social responsibility, from commitments to foster women in leadership and embrace diversity, to a healthy impact on our community and environment.
Today, Williams-Sonoma, Inc. is one of the United States’ largest e-commerce retailers with some of the best known and most beloved brands in home furnishings. We operate in the U.S., Puerto Rico, Canada, Australia and the United Kingdom and offer international shipping to customers worldwide. Our unaffiliated franchisees operate stores in the Middle East, the Philippines, Mexico and South Korea, as well as e-commerce websites in certain locations.
Williams Sonoma
From the beginning, our namesake brand, Williams Sonoma, has been bringing people together around food. A leading specialty retailer of high-quality products for the kitchen and home, the brand seeks to provide world-class service and an engaging customer experience. Williams Sonoma products include everything for cooking, dining and entertaining, including: cookware, tools, electrics, cutlery, tabletop and bar, outdoor, furniture and a vast library of cookbooks. The brand also includes Williams Sonoma Home, a premium concept that offers classic home furnishings and decorative accessories, extending the Williams Sonoma lifestyle beyond the kitchen into every room of the home.
Pottery Barn
Established in 1949 and acquired by Williams-Sonoma, Inc. in 1986, Pottery Barn is a premier multi-channel home furnishings retailer. The brand was founded on the idea that home furnishings should be exceptional in comfort, quality, style and value. Pottery Barn’s stores, website, and catalogs are specially designed to make shopping an enjoyable experience, with inspirational lifestyle displays dedicated to every space in the home. Pottery Barn products include furniture, bedding, bathroom accessories, rugs, curtains, lighting, tabletop, outdoor and decorative accessories.
Pottery Barn Kids
Launched in 1999, Pottery Barn Kids serves as an inspirational destination for creating childhood memories by decorating nurseries, bedrooms and play spaces. Pottery Barn Kids offers exclusive, innovative and high-quality products designed specifically for creating magical spaces where children can play, laugh, learn and grow.
West Elm
Born in Brooklyn in 2002, West Elm is dedicated to transforming people’s lives and spaces through creativity, style and purpose. West Elm creates unique, modern and affordable home decor and curate a global selection of local, ethically-sourced and Fair Trade Certified products, available online and in our stores worldwide.
Table of Contents
PBteen
Launched in 2003, PBteen is the first home concept to focus exclusively on the teen market. The brand offers a complete line of furniture, bedding, lighting, decorative accents and more for teen bedrooms, dorm rooms, study spaces and lounges. PBteen’s innovative products are specifically designed to help teens create a comfortable and stylish room that reflects their own individual aesthetic.
Rejuvenation
Rejuvenation, founded in 1977 with a passion for timeless design and quality craftsmanship, was acquired by Williams-Sonoma, Inc. in 2011. With design, manufacturing and distribution facilities in Portland, Oregon, Rejuvenation offers a wide assortment of made-to-order lighting, hardware, furniture and home décor inspired by history, designed for today and made to last for years to come.
Mark and Graham
Launched in 2012, Mark and Graham is designed to be a premier destination for personalized gift buying. With over 100 monograms and font types to choose from, a Mark and Graham purchase is uniquely personal. The brand’s product lines include women’s and men’s accessories, small leather goods, jewelry, key item apparel, paper, entertaining and bar, home décor and seasonal items.
Outward
In 2017, we acquired Outward, Inc., a 3-D imaging and augmented reality platform for the home furnishings and décor industry. Headquartered in San Jose, California, Outward’s technology enables scalable applications in product visualization, digital room design and augmented and virtual reality.
E-COMMERCE OPERATIONS
As of February 3, 2019, the e-commerce channel had the following merchandise strategies: Williams Sonoma, Pottery Barn, Pottery Barn Kids, West Elm, PBteen, Williams Sonoma Home, Rejuvenation and Mark and Graham, which sell our products through our e-commerce websites and direct-mail catalogs. We offer shipping from many of our brands to countries worldwide, while our catalogs reach customers throughout the U.S. The e-commerce channel complements the retail channel by building brand awareness and acting as an effective advertising vehicle. In addition, we believe that our e-commerce websites and our direct-mail catalogs act as a cost-efficient means of testing market acceptance of new products and new brands. Leveraging these insights and our multi-channel positioning, our marketing efforts, including digital advertising and the circulation of catalogs, are targeted toward driving sales to each of our channels. Consistent with our published privacy policies, we send our catalogs to addresses from our proprietary customer list, as well as to addresses from lists of other mail order direct marketers, magazines and companies with which we establish a business relationship. In accordance with prevailing industry practice and our privacy policies, we may also rent our list to select mailers. Our customer mailings are continually updated to include new prospects and to eliminate non-responders.
Detailed financial information about the e-commerce channel is found in Note K to our Consolidated Financial Statements.
RETAIL STORES
As of February 3, 2019, the retail channel had the following merchandise strategies: Williams Sonoma, Pottery Barn, Pottery Barn Kids, West Elm and Rejuvenation, which operate 625 stores, comprising 579 stores in 43 states, Washington, D.C. and Puerto Rico, 24 stores in Canada, 19 stores in Australia and 3 stores in the United Kingdom. We also have multi-year franchise agreements with third parties in the Middle East, the Philippines, Mexico and South Korea that currently operate 108 franchised stores as well as e-commerce websites in certain locations. The retail channel complements the e-commerce channel by building brand awareness and attracting new customers to our brands. Our retail stores serve as billboards for our brands, which we believe inspires our customers to also shop online and through our catalogs.
Table of Contents
Detailed financial information about the retail channel is found in Note K to our Consolidated Financial Statements.
SUPPLIERS
We purchase most of our merchandise from numerous foreign and domestic manufacturers and importers, the largest of which accounted for approximately 2% of our purchases during fiscal 2018. Approximately 66% of our merchandise purchases in fiscal 2018 were sourced from foreign vendors, predominantly in Asia and Europe. Substantially all of these purchases were negotiated and paid for in U.S. dollars. In addition, we manufacture merchandise, primarily upholstered furniture and lighting, at our facilities located in North Carolina, California, Oregon and Mississippi.
COMPETITION AND SEASONALITY
The specialty e-commerce and retail businesses are highly competitive. Our specialty retail stores, e-commerce websites and direct-mail catalogs compete with other retailers, including large department stores, discount retailers, other specialty retailers offering home-centered assortments, other e-commerce websites and other direct-mail catalogs. The substantial sales growth in the direct-to-customer industry within the last decade, particularly in e-commerce, has encouraged the entry of many new competitors, including discount retailers selling similar products at reduced prices, new business models and an increase in competition from established companies. We compete on the basis of our brand authority, the quality of our merchandise, service to our customers, our proprietary customer list, our e-commerce websites and our marketing capabilities, as well as the location and appearance of our stores. We believe that we compare favorably with many of our current competitors with respect to some or all of these factors.
Our business is subject to substantial seasonal variations in demand. Historically, a significant portion of our net revenues and net earnings have been realized during the period from October through January, and levels of net revenues and net earnings have typically been lower during the period from February through September. We believe this is the general pattern associated with the retail industry. In preparation for and during our holiday selling season, we hire a substantial number of additional temporary employees, primarily in our retail stores, customer care centers and distribution facilities, and incur significant fixed catalog production and mailing costs.
EMPLOYEES
As of February 3, 2019, we had approximately 28,200 employees, of whom approximately 11,400 were full-time. In preparation for and during our fiscal 2018 holiday selling season, we hired approximately 8,300 temporary employees primarily in our retail stores, customer care centers and distribution facilities.
INTELLECTUAL PROPERTY
As of February 3, 2019, we own and/or have applied to register 146 separate trademarks and service marks. We own and/or have applied to register our key brand names as trademarks in the U.S. as well as 94 additional jurisdictions. Generally, exclusive rights to the trademarks and service marks are held by Williams-Sonoma, Inc. and are used by our subsidiaries and franchisees under a license. These marks include our core brand names as well as brand names for selected products and services. The core brand names in particular, including “Williams Sonoma,” “Pottery Barn,” “pottery barn kids,” “PBteen,” “west elm,” “Williams Sonoma Home,” “Rejuvenation” and “Mark and Graham” are of material importance to us. Trademarks are generally valid as long as they are in use and/or their registrations are properly maintained, and they have not been found to have become generic. Trademark registrations can generally be renewed indefinitely so long as the marks are in use. We also own numerous copyrights and trade dress rights for our products, product packaging, catalogs, books, house publications, website designs and store designs, among other things, which are used by our subsidiaries and franchisees under a license. We hold patents on certain product functions, product designs and proprietary technology. Patents are generally valid for 14 to 20 years as long as their registrations are properly maintained. In addition, we have registered and maintain numerous Internet domain names, including “williams-sonoma.com,” “potterybarn.com,” “potterybarnkids.com,”
Table of Contents
“pbteen.com,” “westelm.com,” “wshome.com,” “williams-sonomainc.com,” “rejuvenation.com” and “markandgraham.com.” Collectively, the trademarks, patents, copyrights, trade dress rights and domain names that we hold are of material importance to us.
AVAILABLE INFORMATION
We file annual reports on Form 10-K, quarterly reports on Form 10-Q, current reports on Form 8-K, proxy and information statements and amendments to reports filed or furnished pursuant to Sections 13(a), 14 and 15(d) of the Securities Exchange Act of 1934, as amended. The SEC maintains a website at www.sec.gov that contains reports, proxy and information statements and other information regarding Williams-Sonoma, Inc. and other companies that file materials electronically with the SEC. Our annual reports, Forms 10-K, Forms 10-Q, Forms 8-K and proxy and information statements are also available, free of charge, on our website at www.williams-sonomainc.com.
Investors and others should note that we announce material financial and operational information to our investors using our Investor Relations website (http://ir.williams-sonomainc.com), press releases, SEC filings and public conference calls and webcasts. Information on our website is not, and will not be deemed, a part of this report or incorporated into any other filings we make with the SEC.
Item 1A. RISK FACTORS
| --- | --- |
A description of the risks and uncertainties associated with our business is set forth below. You should carefully consider such risks and uncertainties, together with the other information contained in this report and in our other public filings. If any of such risks and uncertainties actually occurs, our business, financial condition or operating results could differ materially from the plans, projections and other forward-looking statements included in the section titled “Management’s Discussion and Analysis of Financial Condition and Results of Operations” and elsewhere in this report and in our other public filings. In addition, if any of the following risks and uncertainties, or if any other risks and uncertainties, actually occurs, our business, financial condition or operating results could be harmed substantially, which could cause the market price of our stock to decline, perhaps significantly.
Declines in general economic conditions, and the resulting impact on consumer confidence and consumer spending, could adversely impact our results of operations.
Our financial performance is subject to declines in general economic conditions and the impact of such economic conditions on levels of consumer confidence and consumer spending. Consumer confidence and consumer spending may deteriorate significantly, and could remain depressed for an extended period of time. Consumer purchases of discretionary items, including our merchandise, generally decline during periods when disposable income is limited, unemployment rates increase or there is economic uncertainty. An uncertain economic environment could also cause our vendors to go out of business or our banks to discontinue lending to us or our vendors, or it could cause us to undergo restructurings, any of which would adversely impact our business and operating results.
We are unable to control many of the factors affecting consumer spending, and declines in consumer spending on home furnishings and kitchen products in general could reduce demand for our products.
Our business depends on consumer demand for our products and, consequently, is sensitive to a number of factors that influence consumer spending, including general economic conditions, consumer disposable income, fuel prices, recession and fears of recession, unemployment, war and fears of war, inclement weather, availability of consumer credit, consumer debt levels, conditions in the housing market, interest rates, sales tax rates and rate increases, inflation, consumer confidence in future economic and political conditions, and consumer perceptions of personal well-being and security. In particular, past economic downturns have led to decreased discretionary spending, which adversely impacted our business. In addition, periods of decreased home purchases typically lead to decreased consumer spending on home products. These factors have affected, and may in the future affect, our various brands and channels differently. Adverse changes in factors affecting discretionary consumer spending have reduced and may in the future reduce consumer demand for our products, thus reducing our sales and harming our business and operating results.
Table of Contents
If we are unable to identify and analyze factors affecting our business, anticipate changing consumer preferences and buying trends, and manage our inventory commensurate with customer demand, our sales levels and operating results may decline.
Our success depends, in large part, upon our ability to identify and analyze factors affecting our business and to anticipate and respond in a timely manner to changing merchandise trends and customer demands in order to maintain and attract customers. For example, in the specialty home products business, style and color trends are constantly evolving. As a result, consumer preferences cannot be predicted with certainty and may change between selling seasons. We must be able to stay current with preferences and trends in our brands and address the customer tastes for each of our target customer demographics. Additionally, changes in customer preferences and buying trends may also affect our brands differently. We must also be able to identify and adjust the customer offerings in our brands to cater to customer demands. For example, a change in customer preferences for children’s room furnishings may not correlate to a similar change in buying trends for other home furnishings. If we misjudge either the market for our merchandise or our customers’ purchasing habits, our sales may decline significantly or may be delayed while we work to fill related backorders. Alternatively, we may be required to mark down certain products to sell any excess inventory or to sell such inventory through our outlet stores or other liquidation channels at prices which are significantly lower than our retail prices, any of which would negatively impact our business and operating results.
In addition, we must manage our inventory effectively and commensurate with customer demand. Much of our inventory is sourced from vendors located outside of the U.S. Thus, we usually must order merchandise, and enter into contracts for the purchase and manufacturing of such merchandise, up to twelve months and generally multiple seasons in advance of the applicable selling season and frequently before trends are known. The extended lead times for many of our purchases may make it difficult for us to respond rapidly to new or changing trends. Our vendors also may not have the capacity to handle our demands or may go out of business in times of economic crisis. In addition, the seasonal nature of the specialty home products business requires us to carry a significant amount of inventory prior to peak selling season. As a result, we are vulnerable to demand and pricing shifts and to misjudgments in the selection and timing of merchandise purchases. If we do not accurately predict our customers’ preferences and acceptance levels of our products, our inventory levels will not be appropriate, and our business and operating results may be negatively impacted.
There is also increased focus, including by governmental and non-governmental organizations, investors, customers, consumers and other stakeholders, on sustainability matters. Our reputation could be damaged if we do not (or are perceived not to) act responsibly with respect to any sustainability matters, which could negatively impact our business and results of operations.
We may be exposed to cybersecurity risks and costs associated with credit card fraud, identity theft and business interruption that could cause us to incur unexpected expenses and loss of revenue.
A significant portion of our customer orders are placed through our e-commerce websites or through our customer care centers. In addition, a significant portion of sales made through our retail channel require the collection of certain customer data, such as credit card information. In order for our sales channels to function successfully, we, our banking and authorizations partners, and other parties involved in processing customer transactions must be able to transmit confidential information, including credit card information and other personal information of our customers, securely over public and private networks. Third parties may have or develop the technology or knowledge to breach, disable, disrupt or interfere with our systems or processes or those of our vendors. Although we take the security of our systems and the privacy of our customers’ confidential information seriously, and we believe we take reasonable steps to protect the security and confidentiality of the information we collect, we cannot guarantee that our security measures will effectively prevent others from obtaining unauthorized access to our information and our customers’ information. The techniques used to obtain unauthorized access to systems change f
Showing the first 8K of 79K characters. Open the full section
Item 1B. UNRESOLVED STAFF COMMENTS
None.
Item 2. PROPERTIES
We lease store locations, distribution and manufacturing facilities, corporate facilities and customer care centers for our U.S. and foreign operations for original terms generally ranging from 5 to 22 years. Certain leases contain renewal options for periods of up to 20 years.
For our store locations, our gross leased store space as of February 3, 2019 totaled approximately 6,557,000 square feet for 625 stores compared to approximately 6,451,000 square feet for 631 stores as of January 28, 2018.
Leased Properties
The following table summarizes the location and size of our leased facilities occupied by us as of February 3, 2019:
| Location | Occupied Square Footage (Approximate) | |||
| Distribution and Manufacturing Facilities | ||||
| Mississippi | 2,165,000 | |||
| New Jersey | 2,103,000 | |||
| California | 1,432,000 | |||
| Georgia | 1,075,000 | |||
| Texas | 822,000 | |||
| Tennessee | 603,000 | |||
| North Carolina | 412,000 | |||
| Ohio | 265,000 | |||
| Massachusetts | 140,000 | |||
| Florida | 135,000 | |||
| Oregon | 91,000 | |||
| Colorado | 80,000 | |||
| Corporate Facilities | ||||
| California | 266,000 | |||
| New York | 238,000 | |||
| Oregon | 49,000 | |||
| Customer Care Centers | ||||
| Nevada | 36,000 | |||
| Other | 32,000 |
In addition to the above leased properties, we enter into other agreements for offsite storage needs for our distribution facilities and our retail store locations, as necessary. As of February 3, 2019, the total leased space
Table of Contents
relating to these properties was not material to us and is not included in the occupied square footage reported above.
Owned Properties
As of February 3, 2019, we owned 471,000 square feet of space, primarily in California, for our corporate headquarters and certain data center operations.
We believe that all of our facilities are adequate for our current needs and that suitable additional or substitute space will be available in the future to replace our existing facilities, or to accommodate the expansion of our operations, if necessary.
Item 3. LEGAL PROCEEDINGS
We are involved in lawsuits, claims and proceedings incident to the ordinary course of our business. These disputes, which are not currently material, are increasing in number as our business expands and our company grows. We review the need for any loss contingency reserves and establish reserves when, in the opinion of management, it is probable that a matter would result in liability, and the amount can be reasonably estimated. In view of the inherent difficulty of predicting the outcome of these matters, it may not be possible to determine whether any loss is probable or to reasonably estimate the amount of the loss until the case is close to resolution, in which case no reserve is established until that time. Any claims against us, whether meritorious or not, could result in costly litigation, require significant amounts of management time and result in the diversion of significant operational resources. The results of these lawsuits, claims and proceedings cannot be predicted with certainty. However, we believe that the ultimate resolution of these current matters will not have a material adverse effect on our consolidated financial statements taken as a whole.
Item 4. MINE SAFETY DISCLOSURES
Item 5. MARKET FOR REGISTRANT’S COMMON EQUITY, RELATED STOCKHOLDER MATTERS AND ISSUER PURCHASES OF EQUITY SECURITIES
| --- | --- |
MARKET INFORMATION
Our common stock is traded on the New York Stock Exchange, or the NYSE, under the symbol WSM. The closing price of our common stock on the NYSE on March 31, 2019 was $56.27.
STOCKHOLDERS
The number of stockholders of record of our common stock as of March 31, 2019 was 320. This number excludes stockholders whose stock is held in nominee or street name by brokers.
PERFORMANCE GRAPH
This graph compares the cumulative total stockholder return for our common stock with those of the NYSE Composite Index and S&P Retailing, our peer group index. The cumulative total return listed below assumed an initial investment of $100 and reinvestment of dividends. The graph shows historical stock price performance, including reinvestment of dividends, and is not necessarily indicative of future performance.
COMPARISON OF FIVE YEAR CUMULATIVE TOTAL RETURN*
Among Williams-Sonoma, Inc., the NYSE Composite Index,
and S&P Retailing
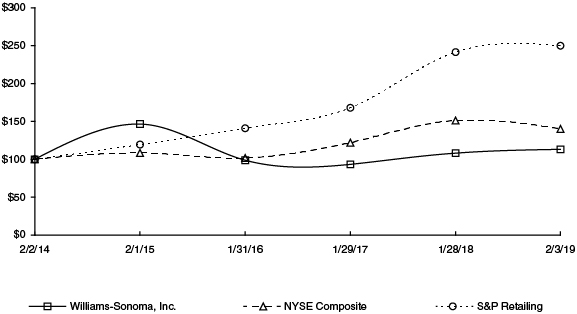
| * | $100 invested on 2/2/14 in stock or index, including reinvestment of dividends. Fiscal year ending February 3. |
|---|
| 2/2/14 | 2/1/15 | 1/31/16 | 1/29/17 | 1/28/18 | 2/03/19 | |||||||
| Williams-Sonoma, Inc. | 100.00 | 146.32 | 98.58 | 93.24 | 108.08 | 112.76 | ||||||
| NYSE Composite Index | 100.00 | 108.27 | 101.44 | 122.00 | 151.10 | 140.18 | ||||||
| S&P Retailing | 100.00 | 119.10 | 140.73 | 167.81 | 241.26 | 249.58 |
*** Notes:**
| A. | The lines represent monthly index levels derived from compounded daily returns that include all dividends. |
|---|
| B. | The indices are re-weighted daily, using the market capitalization on the previous trading day. |
|---|
| C. | If the monthly interval, based on the fiscal year-end, is not a trading day, the preceding trading day is used. |
|---|
Table of Contents
STOCK REPURCHASE PROGRAMS
During fiscal 2018, we repurchased 5,373,047 shares of our common stock at an average cost of $54.96 per share and a total cost of $295,304,000. In March 2019, our Board of Directors authorized an increase in the amount available for repurchase under our existing stock repurchase plan by an additional $500,000,000. During fiscal 2017, we repurchased 4,050,697 shares of our common stock at an average cost of $48.43 per share and a total cost of $196,179,000. During fiscal 2016, we repurchased 2,871,480 shares of our common stock at an average cost of $52.68 per share and a total cost of $151,272,000.
The following table summarizes our repurchases of shares of our common stock during the fourth quarter of fiscal 2018 under our stock repurchase program:
| Fiscal period | Total Number of Shares Purchased1 | Average Price Paid Per Share | Total Number of Shares Purchased as Part of a Publicly Announced Program1 | Maximum Dollar Value of Shares That May Yet Be Purchased Under the Program | ||||||||||||||
| October 29, 2018 | – November 25, 2018 | 141,671 | $ 59.12 | 141,671 | $ 290,522,000 | |||||||||||||
| November 26, 2018 | – December 30, 2018 | 1,074,046 | $ 48.96 | 1,074,046 | $ 237,934,000 | |||||||||||||
| December 31, 2018 | – February 3, 2019 | 273,455 | $ 51.63 | 273,455 | $ 223,815,000 | |||||||||||||
| Total | 1,489,172 | $ 50.42 | 1,489,172 | $ 223,815,000 |
| 1 | Excludes shares withheld for employee taxes upon vesting of stock-based awards. |
|---|
Stock repurchases under our program may be made through open market and privately negotiated transactions at times and in such amounts as management deems appropriate. The timing and actual number of shares repurchased will depend on a variety of factors including price, corporate and regulatory requirements, capital availability and other market conditions. The stock repurchase program does not have an expiration date and may be limited or terminated at any time without prior notice.
Table of Contents
Item 6. SELECTED FINANCIAL DATA
| --- | --- |
Five-Year Selected Financial Data
| In thousands, except percentages, per share amounts and retail stores data | Fiscal 20181 (53 Weeks) | Fiscal 2017 (52 Weeks) | Fiscal 2016 (52 Weeks) | Fiscal 2015 (52 Weeks) | Fiscal 2014 (52 Weeks) | |||||||||||||||
| Results of Operations | ||||||||||||||||||||
| Net revenues | $ | 5,671,593 | $ | 5,292,359 | $ | 5,083,812 | $ | 4,976,090 | $ | 4,698,719 | ||||||||||
| Net revenue growth | 7.2% | 4.1% | 2.2% | 5.9% | 7.1% | |||||||||||||||
| Comparable brand revenue growth_2_ | 3.7% | 3.2% | 0.7% | 3.7% | 7.1% | |||||||||||||||
| Gross profit | $ | 2,101,013 | $ | 1,931,711 | $ | 1,883,310 | $ | 1,844,214 | $ | 1,800,504 | ||||||||||
| Gross margin | 37.0% | 36.5% | 37.0% | 37.1% | 38.3% | |||||||||||||||
| Operating income | $ | 435,953 | $ | 453,811 | $ | 472,599 | $ | 488,634 | $ | 502,265 | ||||||||||
| Operating margin_3_ | 7.7% | 8.6% | 9.3% | 9.8% | 10.7% | |||||||||||||||
| Net earnings | $ | 333,684 | $ | 259,545 | $ | 305,387 | $ | 310,068 | $ | 308,854 | ||||||||||
| Basic earnings per share | $ | 4.10 | $ | 3.03 | $ | 3.45 | $ | 3.42 | $ | 3.30 | ||||||||||
| Diluted earnings per share | $ | 4.05 | $ | 3.02 | $ | 3.41 | $ | 3.37 | $ | 3.24 | ||||||||||
| Shares used in calculation of earnings per share: Basic | 81,420 | 85,592 | 88,594 | 90,787 | 93,634 | |||||||||||||||
| Diluted | 82,340 | 86,080 | 89,462 | 92,102 | 95,200 | |||||||||||||||
| Financial Position | ||||||||||||||||||||
| Working capital_4_ | $ | 619,531 | $ | 628,622 | $ | 405,924 | $ | 339,673 | $ | 515,975 | ||||||||||
| Total assets | $ | 2,812,844 | $ | 2,785,749 | $ | 2,476,879 | $ | 2,417,427 | $ | 2,330,277 | ||||||||||
| Return on assets | 11.9% | 9.9% | 12.5% | 13.1% | 13.2% | |||||||||||||||
| Net cash provided by operating activities | $ | 585,986 | $ | 499,704 | $ | 524,709 | $ | 544,026 | $ | 461,697 | ||||||||||
| Capital expenditures | $ | 190,102 | $ | 189,712 | $ | 197,414 | $ | 202,935 | $ | 204,800 | ||||||||||
| Long-term debt and other long-term liabilities | $ | 380,944 | $ | 372,226 | $ | 71,215 | $ | 49,713 | $ | 62,698 | ||||||||||
| Stockholders’ equity | $ | 1,155,714 | $ | 1,203,566 | $ | 1,248,220 | $ | 1,198,226 | $ | 1,224,706 | ||||||||||
| Stockholders’ equity per share (book value) | $ | 14.66 | $ | 14.37 | $ | 14.29 | $ | 13.38 | $ | 13.33 | ||||||||||
| Return on equity | 28.3% | 21.2% | 25.0% | 25.6% | 24.9% | |||||||||||||||
| Annual dividends declared per share | $ | 1.72 | $ | 1.56 | $ | 1.48 | $ | 1.40 | $ | 1.32 | ||||||||||
| E-commerce Net Revenues | ||||||||||||||||||||
| E-commerce net revenue growth | 10.9% | 5.5% | 4.4% | 6.4% | 12.1% | |||||||||||||||
| E-commerce net revenues as a percent of net revenues | 54.3% | 52.5% | 51.8% | 50.7% | 50.5% | |||||||||||||||
| Retail Net Revenues | ||||||||||||||||||||
| Retail net revenue growth (decline) | 3.0% | 2.6% | (0.1% | ) | 5.4% | 2.4% | ||||||||||||||
| Retail net revenues as a percent of net revenues | 45.7% | 47.5% | 48.2% | 49.3% | 49.5% | |||||||||||||||
| Number of stores at year-end | 625 | 631 | 629 | 618 | 601 | |||||||||||||||
| Store selling square footage at year-end | 4,105,000 | 4,019,000 | 3,951,000 | 3,827,000 | 3,684,000 | |||||||||||||||
| Store leased square footage at year-end | 6,557,000 | 6,451,000 | 6,359,000 | 6,163,000 | 5,965,000 |
| 1 | In fiscal 2018, we adopted Accounting Standards Update 2014-09, Revenue from Contracts with Customers, using the modified retrospective method. Amounts reported for fiscal 2017 and prior years have not been adjusted, and continue to be reported in accordance with previous revenue recognition guidance. See Note A to the Consolidated Financial Statements. |
|---|
| 2 | Comparable brand revenue is calculated on a 52-week to 52-week basis, with the exception of fiscal 2018 which is calculated on a 53-week to 53-week basis. See definition of comparable brand revenue within “Management’s Discussion and Analysis of Financial Condition and Results of Operations.” |
|---|
| 3 | Operating margin is defined as operating income as a percent of net revenues. |
|---|
| 4 | In fiscal 2015, we prospectively adopted Accounting Standards Update 2015-17, Balance Sheet Classification of Deferred Taxes, and now present both deferred tax assets and deferred tax liabilities as noncurrent in our Consolidated Balance Sheets. Prior balance sheets were not retrospectively adjusted and, as a result, working capital for fiscal 2014 may not be comparable to other years. |
|---|
The information set forth above is not necessarily indicative of future operations and should be read in conjunction with “Management’s Discussion and Analysis of Financial Condition and Results of Operations” and the Consolidated Financial Statements and notes thereto in this Annual Report on Form 10-K.
Table of Contents
Item 7. MANAGEMENT’S DISCUSSION AND ANALYSIS OF FINANCIAL CONDITION AND RESULTS OF OPERATIONS
| --- | --- |
The following discussion and analysis of our financial condition, results of operations, and liquidity and capital resources for the 53 weeks ended February 3, 2019 (“fiscal 2018”), the 52 weeks ended January 28, 2018 (“fiscal 2017”), and the 52 weeks ended January 29, 2017 (“fiscal 2016”) should be read in conjunction with our Consolidated Financial Statements and notes thereto. As fiscal 2018 is a 53-week year as compared to a 52-week year in fiscal 2017, our discussion of fiscal 2018 results below includes approximately $85,000,000 of net revenues and $0.10 of diluted earnings per share associated with the additional week. All explanations of changes in operational results are discussed in order of magnitude.
OVERVIEW
Net revenues in fiscal 2018, including the impact of the additional week, increased by $379,234,000, or 7.2%, compared to fiscal 2017, with comparable brand revenue growth of 3.7%. This increase in net revenues was driven by a 10.9% increase in e-commerce net revenues and a 3.0% increase in retail net revenues, with particular strength in furniture. Total fiscal 2018 net revenue growth was partially attributable to a 1.6% increase in store leased square footage and a 5.7% increase in international revenues, primarily related to our company-owned international operations, as well as the favorable impact of the adoption of ASU 2014-09 primarily associated with the reclassification of other income from selling, general and administrative expenses into net revenues (see Note A to our Consolidated Financial Statements). Revenue growth was also supported by our double digit new customer growth, which reflects the success of our strategies to increase customer acquisition and drive our future growth.
All brands delivered positive comparable brand revenue growth in fiscal 2018. Growth in Pottery Barn accelerated from last year, driven by strength in e-commerce and growth in new businesses: Marketplace and Pottery Barn Apartment, as well as strong upholstery growth. The Pottery Barn Kids and Teen business improved from last year, delivering combined comparable brand revenue growth of 2.8%. Our Baby business continued to gain momentum attracting new customers as the entry point to our brand and through registry creations. West Elm had another year of double digit net revenue growth driven by strong e-commerce performance and continued strength in the core furniture business. The Williams Sonoma brand delivered comparable brand revenue growth of 1.7%. And, our emerging brands, Rejuvenation and Mark and Graham, continued to scale with double digit net revenue growth and increased profitability.
Across the business, fiscal 2018 was a year of delivering more compelling experiences for our customers. As part of our strategic priority of digital leadership, we enhanced the e-commerce experience through two differentiators: content and convenience. In fiscal 2018, we updated our shop path with more accurate and engaging content that is inspirational and drives conversion. We also enhanced our product information pages with a focus on product quality and reasons to buy. To provide our customers with omni-channel convenience, we launched Buy Online Pickup In Store in our brands and are in the process of scaling other fulfillment capabilities such as Buy Online Ship To Store and Buy Online Ship From Store. As a result, our e-commerce revenue growth almost doubled in fiscal 2018. With over 54% of our business conducted online, we are among the top 25 e-commerce retailers in North America.
We are using cross-brand initiatives to strengthen our position as the resource for all home furnishing, cooking and entertaining needs. In fiscal 2018, we continued to scale our loyalty program, The Key, where we have seen strong membership growth over the past year, as well as our complimentary design service, Design Crew. We also launched two new initiatives during the year: Design Crew Room Planner and The One Registry collective, both of which are enabling a more personalized and convenient shopping experience for our customers.
In our supply chain, we continued to drive operational improvements in fiscal 2018. In our non-furniture business, our order consolidation efforts and continued improvement in distribution center productivity enabled us to lower our cartons-per-order and order-to-delivery time so that our customers received their orders faster this holiday season and with less waste. Additionally, we were proud to be recognized once again by Barron’s for all of our sustainability efforts across the business. At a ranking of number 24, we were the only company in our industry to be among the financial publication’s annual list of 100 Most Sustainable U.S. companies.
Table of Contents
In summary, 2018 was another year of solid financial and operational accomplishments resulting in earnings and cash flow generation that allowed us to return approximately $435,629,000 to our stockholders through stock repurchases and dividends.
Over the next few years, we plan target whitespace in the market; we plan to drive cross-brand initiatives that leverage our platform; and we plan to bring technology innovation and continued improvement in customer experience. We have a strong foundation to support the execution of our initiatives in fiscal 2019 and beyond, as well as to deliver long-term shareholder value.
Table of Contents
Results of Operations
NET REVENUES
Net revenues consist of e-commerce net revenues and retail net revenues. E-commerce net revenues include sales of merchandise to customers through our e-commerce websites and our catalogs, as well as shipping fees. Retail net revenues include sales of merchandise to customers at our retail stores and to our franchisees, as well as shipping fees on any products shipped to our customers’ homes. Shipping fees consist of revenue received from customers for delivery of merchandise to their homes. Revenues are presented net of sales returns and other discounts. Due to the adoption of ASU 2014-09 in fiscal 2018, certain incentives received from credit card issuers as well as breakage income related to our unredeemed stored-value cards are now presented within net revenues (see Note A to our Consolidated Financial Statements).
| In thousands | Fiscal 2018 (53 Weeks) | % Total | Fiscal 2017 (52 Weeks) | % Total | Fiscal 2016 (52 Weeks) | % Total | ||||||||||||||||||
| E-commerce net revenues | $ | 3,082,064 | 54.3% | $ | 2,778,457 | 52.5% | $ | 2,633,602 | 51.8% | |||||||||||||||
| Retail net revenues | 2,589,529 | 45.7% | 2,513,902 | 47.5% | 2,450,210 | 48.2% | ||||||||||||||||||
| Net revenues | $ | 5,671,593 | 100.0% | $ | 5,292,359 | 100.0% | $ | 5,083,812 | 100.0% |
Net revenues in fiscal 2018, including the impact of the additional week of net revenues, increased by $379,234,000 or 7.2%, compared to fiscal 2017, with comparable brand revenue growth of 3.7%. This increase in net revenues was driven by a 10.9% increase in e-commerce net revenues (primarily driven by West Elm, Pottery Barn and Pottery Barn Kids and Teen) and a 3.0% increase in retail net revenues (primarily driven by West Elm and Pottery Barn), with particular strength in furniture. Total fiscal 2018 net revenue growth was partially attributable to a 1.6% increase in store leased square footage and a 5.7% increase in international revenues primarily related to our company-owned international operations, as well as the favorable impact of the adoption of ASU 2014-09 primarily associated with the reclassification of other income from selling, general and administrative expenses into net revenues (see Note A to our Consolidated Financial Statements).
Net revenues in fiscal 2017 increased by $208,547,000 or 4.1%, compared to fiscal 2016, with comparable brand revenue growth of 3.2%. This increase in net revenues was driven by a 5.5% increase in e-commerce net revenues (primarily driven by West Elm, Williams Sonoma and Rejuvenation) and a 2.6% increase in retail net revenues (primarily driven by Pottery Barn and West Elm), with particular strength in furniture. Total fiscal 2017 net revenue growth was partially attributable to a 1.4% increase in store leased square footage primarily due to 2 net new stores, and a 2.2% increase in international revenues primarily related to our company-owned international operations.
The following table summarizes our net revenues by brand for fiscal 2018, fiscal 2017 and fiscal 2016:
| In thousands | Fiscal 2018 (53 Weeks) | Fiscal 2017 (52 Weeks) | Fiscal 2016 (52 Weeks) | |||||||||
| Pottery Barn | $ | 2,177,344 | $ | 2,066,302 | $ | 2,024,218 | ||||||
| West Elm | 1,292,928 | 1,114,339 | 971,568 | |||||||||
| Williams Sonoma | 1,056,125 | 1,022,434 | 1,002,194 | |||||||||
| Pottery Barn Kids and Teen_1_ | 895,762 | 860,468 | 873,199 | |||||||||
| Other_2_ | 249,434 | 228,816 | 212,633 | |||||||||
| Total | $ | 5,671,593 | $ | 5,292,359 | $ | 5,083,812 |
| 1 | Net revenues of the Pottery Barn Kids and PBteen brands are being reported on a combined basis as Pottery Barn Kids and Teen. |
|---|
| 2 | Primarily consists of net revenues from our international franchise operations, Rejuvenation and Mark and Graham. |
|---|
Comparable Brand Revenue
Comparable brand revenue includes retail comparable store sales and e-commerce sales, as well as shipping fees, sales returns and other discounts associated with current period sales. Comparable stores are defined as
Table of Contents
permanent stores where gross square footage did not change by more than 20% in the previous 12 months and which have been open for at least 12 consecutive months without closure for seven or more consecutive days. Outlet comparable store net revenues are included in their respective brands. Sales to our international franchisees are excluded from comparable brand revenue as their stores and e-commerce websites are not operated by us. Sales from certain operations are also excluded until such time that we believe those sales are meaningful to evaluating their performance. Additionally, comparable brand revenue growth for newer concepts is not separately disclosed until such time that we believe those sales are meaningful to evaluating the performance of the brand.
| Comparable brand revenue growth (decline)1 | Fiscal 2018 (53 Weeks) | Fiscal 2017 (52 Weeks) | Fiscal 2016 (52 Weeks) | |||||||||
| Pottery Barn | 1.2% | 1.0% | (3.5% | ) | ||||||||
| West Elm | 9.5% | 10.2% | 12.8% | |||||||||
| Williams Sonoma | 1.7% | 3.2% | 1.3% | |||||||||
| Pottery Barn Kids and Teen | 2.8% | (1.7% | ) | (2.8% | ) | |||||||
| Total_2_ | 3.7% | 3.2% | 0.7% |
| 1 | Comparable brand revenue is calculated on a 53-week to 53-week basis for fiscal 2018 and on a 52-week to 52-week basis for fiscal 2017 and fiscal 2016. |
|---|
| 2 | Total comparable brand revenue growth includes the results of Rejuvenation and Mark and Graham. |
|---|
RETAIL STORE DATA
| In thousands | Fiscal 2018 (53 Weeks) | Fiscal 2017 (52 Weeks) | Fiscal 2016 (52 Weeks) | |||||||||
| Retail net revenues | $ | 2,589,529 | $ | 2,513,902 | $ | 2,450,210 | ||||||
| Retail net revenue growth (decline) | 3.0% | 2.6% | (0.1% | ) | ||||||||
| Store count – beginning of year | 631 | 629 | 618 | |||||||||
| Store openings_1_ | 23 | 28 | 29 | |||||||||
| Store closings_1_ | (29 | ) | (26 | ) | (18 | ) | ||||||
| Store count – end of year | 625 | 631 | 629 | |||||||||
| Store selling square footage at year-end | 4,105,000 | 4,019,000 | 3,951,000 | |||||||||
| Store leased square footage (“LSF”) at year-end | 6,557,000 | 6,451,000 | 6,359,000 |
| 1 | Store openings and closings in fiscal 2017 include two Williams Sonoma, two Pottery Barn and one West Elm temporary closures in Puerto Rico and Florida due to hurricanes in these areas. These stores reopened during the fourth quarter of fiscal 2017. |
|---|
| Fiscal 2018 | Fiscal 2017 | Fiscal 2016 | ||||||||||||||||||||||
| Store Count | Avg. LSF Per Store | Store Count | Avg. LSF Per Store | Store Count | Avg. LSF Per Store | |||||||||||||||||||
| Williams Sonoma | 220 | 6,900 | 228 | 6,700 | 234 | 6,600 | ||||||||||||||||||
| Pottery Barn | 205 | 14,200 | 203 | 13,900 | 201 | 13,900 | ||||||||||||||||||
| West Elm | 112 | 13,100 | 106 | 13,100 | 98 | 13,300 | ||||||||||||||||||
| Pottery Barn Kids | 78 | 7,500 | 86 | 7,400 | 89 | 7,400 | ||||||||||||||||||
| Rejuvenation | 10 | 8,500 | 8 | 8,800 | 7 | 9,100 | ||||||||||||||||||
| Total | 625 | 10,500 | 631 | 10,200 | 629 | 10,100 |
Table of Contents
COST OF GOODS SOLD
| In thousands | Fiscal 2018 (53 Weeks) | % Net Revenues | Fiscal 2017 (52 Weeks) | % Net Revenues | Fiscal 2016 (52 Weeks) | % Net Revenues | ||||||||||||||||||
| Cost of goods sold_1_ | $ | 3,570,580 | 63.0% | $ | 3,360,648 | 63.5% | $ | 3,200,502 | 63.0% |
| 1 | Includes occupancy expenses of $702,537, $683,958 and $664,177 in fiscal 2018, fiscal 2017 and fiscal 2016, respectively. |
|---|
Cost of goods sold includes cost of goods, occupancy expenses and shipping costs. Cost of goods consists of cost of merchandise, inbound freight expenses, freight-to-store expenses and other inventory related costs such as shrinkage, damages and replacements. Occupancy expenses consist of rent, depreciation and other occupancy costs, including common area maintenance, property taxes and utilities. Shipping costs consist of third-party delivery services and shipping materials.
Our classification of expenses in cost of goods sold may not be comparable to other public companies, as we do not include non-occupancy-related costs associated with our distribution network in cost of goods sold. These costs, which include distribution network employment, third-party warehouse management and other distribution-related administrative expenses, are recorded in selling, general and administrative expenses.
Within our reportable segments, the e-commerce channel does not incur freight-to-store or store occupancy expenses, and typically operates with lower markdowns and inventory shrinkage than the retail channel. However, the e-commerce channel incurs higher customer shipping, damage and replacement costs than the retail channel.
Fiscal 2018 vs. Fiscal 2017
Cost of goods sold increased by $209,932,000, or 6.2%, in fiscal 2018 compared to fiscal 2017. Cost of goods sold as a percentage of net revenues decreased to 63.0% in fiscal 2018 from 63.5% in fiscal 2017. This decrease was primarily driven by the leverage of occupancy costs and includes the favorable impact from the adoption of ASU 2014-09, primarily associated with the reclassification of other income from selling, general and administrative expenses into net revenues.
In the e-commerce channel, cost of goods sold as a percentage of net revenues decreased in fiscal 2018 compared to fiscal 2017, primarily driven by higher selling margins.
In the retail channel, cost of goods sold as a percentage of net revenues increased in fiscal 2018 compared to fiscal 2017, primarily driven by lower selling margins, partially offset by the leverage of occupancy costs.
Fiscal 2017 vs. Fiscal 2016
Cost of goods sold increased by $160,146,000, or 5.0%, in fiscal 2017 compared to fiscal 2016. Cost of goods sold as a percentage of net revenues increased to 63.5% in fiscal 2017 from 63.0% in fiscal 2016. This increase was driven by lower merchandise margins, higher shipping costs and reduced shipping income, partially offset by reduced fulfillment-related costs in our supply chain and the leverage of occupancy costs.
In the e-commerce channel, cost of goods sold as a percentage of net revenues increased in fiscal 2017 compared to fiscal 2016 primarily driven by lower merchandise margins, reduced shipping income and higher shipping costs, partially offset by reduced fulfillment-related costs in our supply chain and a reduction in occupancy costs.
In the retail channel, cost of goods sold as a percentage of net revenues increased in fiscal 2017 compared to fiscal 2016 primarily driven by lower selling margins, as well as higher occupancy costs to support our growth initiatives.
Table of Contents
SELLING, GENERAL AND ADMINISTRATIVE EXPENSES
| In thousands | Fiscal 2018 (53 weeks)1 | % Net Revenues1 | Fiscal 2017 (52 weeks) | % Net Revenues | Fiscal 2016 (52 weeks) | % Net Revenues | ||||||||||||||||||
| Selling, general and administrative expenses | $ | 1,665,060 | 29.4% | $ | 1,477,900 | 27.9% | $ | 1,410,711 | 27.7% |
| 1 | Includes the impact of the adoption of ASU 2014-09 primarily from the reclassification of other income from selling, general and administrative expenses into net revenues. |
|---|
Selling, general and administrative expenses consist of non-occupancy-related costs associated with our retail stores, distribution and manufacturing facilities, customer care centers, supply chain operations (buying, receiving and inspection) and corporate administrative functions. These costs include employment, advertising, third-party credit card processing and other general expenses.
We experience differing employment and advertising costs as a percentage of net revenues within the retail and e-commerce channels due to their distinct distribution and marketing strategies. Employment costs represent a greater percentage of net revenues within the retail channel as compared to the e-commerce channel. However, advertising expenses are higher within the e-commerce channel than in the retail channel.
Fiscal 2018 vs. Fiscal 2017
Selling, general and administrative expenses increased by $187,160,000, or 12.7%, in fiscal 2018 compared to fiscal 2017. Selling, general and administrative expenses as a percentage of net revenues increased to 29.4% in fiscal 2018 from 27.9% in fiscal 2017. This increase as a percentage of net revenues was driven by an increase in general expenses primarily from the reclassification of other income from selling, general and administrative expenses into net revenues due to the adoption of ASU 2014-09, an increase in incentive compensation, as well as increased hourly wages and digital advertising from the reinvestment of tax savings, the impact from our acquisition of Outward, and impairment and early lease termination charges related to underperforming retail stores. This was partially offset by the optimization of catalog advertising costs.
In the e-commerce channel, selling, general and administrative expenses as a percentage of net revenues increased in fiscal 2018 compared to fiscal 2017, driven by an increase in general expenses primarily associated with the reclassification of other income from selling, general and administrative expenses into net revenues, the impact from our acquisition of Outward, as well as increased hourly wages and digital advertising from the reinvestment of tax savings, partially offset by the optimization of catalog advertising costs.
In the retail channel, selling, general and administrative expenses as a percentage of net revenues increased in fiscal 2018 compared to fiscal 2017, driven by an increase in general expenses primarily associated with the reclassification of other income from selling, general and administrative expenses into net revenues as well as impairment and early lease termination charges related to underperforming retail stores.
Fiscal 2017 vs. Fiscal 2016
Selling, general and administrative expenses increased by $67,189,000, or 4.8%, in fiscal 2017 compared to fiscal 2016. Selling, general and administrative expenses as a percentage of net revenues increased to 27.9% in fiscal 2017 from 27.7% in fiscal 2016. This increase as a percentage of net revenues was primarily driven by higher digital advertising expenses resulting from our focus on new customer acquisition. This increase was partially offset by lower employment expenses within the unallocated segment.
In the e-commerce channel, selling, general and administrative expenses as a percentage of net revenues increased in fiscal 2017 compared to fiscal 2016 primarily driven by higher digital advertising expenses.
In the retail channel, selling, general and administrative expenses as a percentage of net revenues increased in fiscal 2017 compared to fiscal 2016 primarily driven by an increase in employment expenses to support our growth initiatives.
Table of Contents
INCOME TAXES
The 2017 Tax Cuts and Jobs Act (“the Tax Act”) was enacted on December 22, 2017. Among other things, the Tax Act reduced the corporate income tax rate to 21% as of January 1, 2018, introduced a new tax on global intangible low-taxed income (“GILTI”), and implemented a modified territorial tax system that includes a transition tax on deemed repatriated earnings of foreign subsidiaries.
Staff Accounting Bulletin No. 118 (“SAB 118”) issued by the SEC in December 2017 provided us with up to one year to finalize our measurement of the income tax effects of the Tax Act on our fiscal year ended January 28, 2018. As of January 28, 2018, we had made reasonable estimates of the income tax effects of the Tax Act, including the transition tax under Internal Revenue Code section 965.
As of February 3, 2019, we have completed the accounting for the income tax effects of the Tax Act based on our current interpretation of available notices and regulations issued and proposed by the U.S. Department of the Treasury and the Internal Revenue Service. As a result, during fiscal 2018 we recorded an immaterial adjustment to the fiscal 2017 provisional transition tax amount. In addition, during fiscal 2018, we booked a net tax benefit of approximately $10,576,000 from the re-measurement of our deferred tax assets.
We have historically elected not to provide for U.S. income taxes with respect to the undistributed earnings of our foreign subsidiaries as we intended to utilize those earnings in our foreign operations for an indefinite period of time. Under Internal Revenue Code section 965 of the Tax Act, we are deemed to have distributed all the post-1986 earnings of our foreign subsidiaries to the U.S. as of December 31, 2017. In light of the Tax Act, we re-evaluated our permanent reinvestment assertion with respect to unremitted foreign earnings, and we are now only permanently reinvested with respect to our foreign earnings in Canada beginning in fiscal 2018. As a result, we recorded approximately $1,493,000 of foreign withholding tax and additional state income tax in fiscal 2018. As of February 3, 2019, the post-fiscal 2017 earnings of our Canadian subsidiary are permanently reinvested. If we did not consider these earnings to be permanently reinvested, the deferred tax liability would have been immaterial as of February 3, 2019.
In fiscal 2018, we are subject to several provisions of the Tax Act, including GILTI, the base erosion anti-abuse tax and a deduction for foreign-derived intangible income. We have elected to account for GILTI as a periodic expense when the tax arises. The net impact due to these provisions was immaterial in fiscal 2018.
Our effective tax rate was 22.3% for fiscal 2018, 42.6% for fiscal 2017 and 35.3% for fiscal 2016. The decrease in the effective tax rate from fiscal 2017 was primarily due to the reduction of the U.S. corporate income tax rate from 35% to 21% as of January 1, 2018 as a result of the Tax Act, as well as the tax benefit from the true up of the remeasurement of our deferred tax assets under SAB 118.
LIQUIDITY AND CAPITAL RESOURCES
As of February 3, 2019, we held $338,954,000 in cash and cash equivalents, the majority of which was held in interest-bearing demand deposit accounts and money market funds, and of which $185,810,000 was held by our foreign subsidiaries. As is consistent within our industry, our cash balances are seasonal in nature, with the fourth quarter historically representing a significantly higher level of cash than other periods.
Throughout the fiscal year, we utilize our cash balances to build our inventory levels in preparation for our fourth quarter holiday sales. In fiscal 2019, we plan to use our cash resources to fund our inventory and inventory-related purchases, advertising and marketing initiatives, stock repurchases and dividend payments, and property and equipment purchases. In addition to our cash balances on hand, we have a credit facility which provides for a $500,000,000 unsecured revolving line of credit (“revolver”), and a $300,000,000 unsecured term loan facility (“term loan”). The revolver may be used to borrow revolving loans or to request the issuance of letters of credit. We may, upon notice to the administrative agent, request existing or new lenders to increase the revolver by up to $250,000,000, at such lenders’ option, to provide for a total of $750,000,000 of unsecured revolving credit. During fiscal 2018, we had borrowings under the revolver of $60,000,000, all of which were repaid in the fourth quarter of fiscal 2018. During fiscal 2017, we had borrowings under the revolver of $170,000,000, all of which
Table of Contents
were repaid in the fourth quarter of fiscal 2017. As of February 3, 2019, we had $300,000,000 outstanding under our term loan. The term loan matures on January 8, 2021, at which point all outstanding principal and any accrued interest must be repaid. Additionally, as of February 3, 2019, a total of $11,732,000 in issued but undrawn standby letters of credit were outstanding under the credit facility. The standby letters of credit were issued to secure the liabilities associated with workers’ compensation and other insurance programs.
Additionally, we have three unsecured letter of credit reimbursement facilities, which were amended during the year, for a total of $70,000,000, of which an aggregate of $6,820,000 was outstanding as of February 3, 2019. These letter of credit facilities represent only a future commitment to fund inventory purchases to which we had not taken legal title.
We are currently in compliance with all of our financial covenants under the credit facility and, based on our current projections, we expect to remain in compliance throughout fiscal 2019. We believe our cash on hand, in addition to our available credit facilities, will provide adequate liquidity for our business operations over the next 12 months.
Cash Flows from Operating Activities
For fiscal 2018, net cash provided by operating activities was $585,986,000 compared to $499,704,000 in fiscal 2017. For fiscal 2018, net cash provided by operating activities was primarily attributable to net earnings adjusted for non-cash items, an increase in accounts payable and accrued expenses and other liabilities, as well as an increase in gift card and other deferred revenue, partially offset by an increase in merchandise inventories and prepaid expenses and other assets and a decrease in income taxes payable. This represents an increase in net cash provided by operating activities compared to fiscal 2017 primarily due to an increase in accounts payable and accrued expenses and other liabilities offset by a change in income taxes payable.
For fiscal 2017, net cash provided by operating activities was $499,704,000 compared to $524,709,000 in fiscal 2016. For fiscal 2017, net cash provided by operating activities was primarily attributable to net earnings adjusted for non-cash items, an increase in income taxes payable, as well as deferred rent and lease incentives, partially offset by an increase in merchandise inventories. This represents a decrease in net cash provided by operating activities compared to fiscal 2016 primarily due to an increase in merchandise inventories and a decrease in net earnings, partially offset by a decrease in income taxes paid in fiscal 2017 compared to fiscal 2016.
Cash Flows from Investing Activities
For fiscal 2018, net cash used in investing activities was $187,899,000 compared to $269,760,000 in fiscal 2017, and was primarily attributable to purchases of property and equipment. Net cash used in investing activities compared to fiscal 2017 is lower due to the acquisition of Outward in fiscal 2017 (see Note O to our Consolidated Financial Statements).
For fiscal 2017, net cash used in investing activities was $269,760,000 compared to $196,975,000 in fiscal 2016, and was primarily attributable to purchases of property and equipment and the acquisition of Outward. Net cash used in investing activities compared to fiscal 2016 increased due to the acquisition of Outward.
Cash Flows from Financing Activities
For fiscal 2018, net cash used in financing activities was $450,066,000 compared to $51,707,000 in fiscal 2017. For fiscal 2018, net cash used in financing activities was primarily attributable to repurchases of common stock of $295,304,000 and the payment of dividends of $140,325,000. Net cash used in financing activities compared to fiscal 2017 decreased primarily due to term loan borrowings in fiscal 2017 and an increase in repurchases of common stock in fiscal 2018.
For fiscal 2017, net cash used in financing activities was $51,707,000 compared to $305,806,000 in fiscal 2016. For fiscal 2017, net cash used in financing activities was primarily attributable to repurchases of common stock of $196,179,000 and the payment of dividends of $135,010,000, partially offset by proceeds from issuance of long-term debt of $300,000,000. Net cash used in financing activities compared to fiscal 2016 decreased primarily due to proceeds from the issuance of long-term debt, partially offset by an increase in repurchases of common stock.
Table of Contents
Dividends
In fiscal 2018, fiscal 2017 and fiscal 2016, total cash dividends declared were approximately $144,609,000, or $1.72 per common share, $135,779,000, or $1.56 per common share, and $133,588,000, or $1.48 per common share, respectively. In March 2019, our Board of Directors authorized a $0.05, or 11.6%, increase in our quarterly cash dividend, from $0.43 to $0.48 per common share, for an annual cash dividend of $1.92 per share, subject to capital availability. Our quarterly cash dividend may be limited or terminated at any time.
Stock Repurchase Programs
See section titled Stock Repurchase Programs within Part II, Item 5 of this Annual Report on Form 10-K for further information.
Contractual Obligations
The following table provides summary information concerning our future contractual obligations as of February 3, 2019:
| Payments Due by Period_1_ | ||||||||||||||||||||
| In thousands | Fiscal 2019 | Fiscal 2020 to Fiscal 2022 | Fiscal 2023 to Fiscal 2024 | Thereafter | Total | |||||||||||||||
| Long-term debt 2 | $ | — | $ | 300,000 | $ | — | $ | — | $ | 300,000 | ||||||||||
| Interest | 10,898 | 10,232 | — | — | 21,130 | |||||||||||||||
| Operating leases_3_ | 292,387 | 678,447 | 298,086 | 422,024 | 1,690,944 | |||||||||||||||
| Purchase obligations_4_ | 960,132 | 29,271 | 186 | — | 989,589 | |||||||||||||||
| Total | $ | 1,263,417 | $ | 1,017,950 | $ | 298,272 | $ | 422,024 | $ | 3,001,663 |
| 1 | This table excludes $40.6 million of liabilities for unrecognized tax benefits associated with uncertain tax positions as we are not able to reasonably estimate when and if cash payments for these liabilities will occur. This amount, however, has been recorded as a liability in our accompanying Consolidated Balance Sheet as of February 3, 2019. |
|---|
| 2 | Long-term debt consists of term loan borrowings under our credit facility. See Note C to our Consolidated Financial Statements for discussion of our borrowing arrangements. |
|---|
| 3 | Projected undiscounted payments include only those amounts that are fixed and determinable as of the reporting date. See Note E to our Consolidated Financial Statements for discussion of our operating leases. |
|---|
| 4 | Represents estimated commitments at year-end to purchase inventory and other goods and services in the normal course of business to meet operational requirements. |
|---|
Other Contractual Obligations
We have other liabilities reflected in our Consolidated Balance Sheet. The payment obligations associated with these liabilities are not reflected in the table above due to the absence of scheduled maturities. The timing of these payments cannot be determined, except for amounts estimated to be payable in fiscal 2019, which are included in our current liabilities as of February 3, 2019.
We are party to a variety of contractual agreements under which we may be obligated to indemnify the other party for certain matters. These contracts primarily relate to commercial matters, operating leases, trademarks, intellectual property and financial matters. Under these contracts, we may provide certain routine indemnification relating to representations and warranties or personal injury matters. The terms of these indemnifications range in duration and may not be explicitly defined. Historically, we have not made significant payments for these indemnifications. We believe that if we were to incur a loss in any of these matters, the loss would not have a material effect on our financial condition or results of operations.
Table of Contents
Commercial Commitments
The following table provides summary information concerning our outstanding commercial commitments as of February 3, 2019:
| Amount of Outstanding Commitment Expiration by Period_1_ | ||||||||||||||||||||
| In thousands | Fiscal 2019 | Fiscal 2020 to Fiscal 2022 | Fiscal 2023 to Fiscal 2024 | Thereafter | Total | |||||||||||||||
| Standby letters of credit | $ | 11,732 | $ | — | $ | — | $ | — | $ | 11,732 | ||||||||||
| Letter of credit facilities | 6,820 | — | — | — | 6,820 | |||||||||||||||
| Total | $ | 18,552 | $ | — | $ | — | $ | — | $ | 18,552 |
| 1 | See Note C to our Consolidated Financial Statements for discussion of our borrowing arrangements. |
|---|
IMPACT OF INFLATION
The impact of inflation (or deflation) on our results of operations for the past three fiscal years has not been significant. However, we cannot be certain of the effect inflation (or deflation) may have on our results of operations in the future.
CRITICAL ACCOUNTING POLICIES AND ESTIMATES
Management’s Discussion and Analysis of Financial Condition and Results of Operations is based on our Consolidated Financial Statements, which have been prepared in accordance with accounting principles generally accepted in the United States of America. The preparation of these Consolidated Financial Statements requires us to make estimates and assumptions that affect the reported amounts of assets, liabilities, revenues and expenses and related disclosures of contingent assets and liabilities. These estimates and assumptions are evaluated on an ongoing basis and are based on historical experience and various other factors that we believe to be reasonable under the circumstances. Actual results could differ from these estimates.
We believe the following critical accounting policies used in the preparation of our Consolidated Financial Statements include the significant estimates and assumptions that we consider to be the most critical to an understanding of our financial statements because they involve significant judgments and uncertainties. See Note A to our Consolidated Financial Statements for further discussion of each policy.
Merchandise Inventories
Merchandise inventories, net of an allowance for shrinkage and obsolescence, are stated at the lower of cost (weighted average method) or market. To determine if the value of our inventory should be reduced below cost, we consider current and anticipated demand, customer preferences and age of the merchandise. The significant estimates used in inventory valuation are obsolescence (including excess and slow-moving inventory and lower of cost or market reserves) and estimates of inventory shrinkage. We reserve for obsolescence based on historical trends of inventory sold below cost and specific identification.
Reserves for shrinkage are estimated and recorded throughout the year as a percentage of net sales based on historical shrinkage results, cycle count results within our distribution centers, expectations of future shrinkage and current inventory levels. Actual shrinkage is recorded at year-end based on the results of our cycle count and year end physical inventory counts and can vary from our estimates due to such factors as changes in operations, the mix of our inventory (which ranges from large furniture to small tabletop items) and execution against loss prevention initiatives in our stores, distribution facilities, off-site storage locations, and with our third-party warehouse and transportation providers. Accordingly, there is no shrinkage reserve at year-end, with the exception of a cycle count reserve based on the historical cycle count results in our distribution centers. This reserve was not material to our Consolidated Financial Statements as of February 3, 2019. Historically, actual shrinkage has not differed materially from our estimates.
Our obsolescence and shrinkage reserve calculations contain estimates that require management to make assumptions and to apply judgment regarding a number of factors, including market conditions, the selling
Table of Contents
environment, historical results and current inventory trends. If actual obsolescence or shrinkage estimates change from our original estimate, we will adjust our reserves accordingly throughout the year. We have made no material changes to our assumptions included in the calculations of the obsolescence and shrinkage reserves throughout the year. In addition, we do not believe a 10% change in our inventory reserves would have a material effect on our net earnings. As of February 3, 2019 and January 28, 2018, our inventory obsolescence reserves were $13,580,000 and $12,649,000, respectively.
Property and Equipment
Property and equipment is stated at cost. Depreciation is computed using the straight-line method over the estimated useful lives of the assets.
We review the carrying value of all long-lived assets for impairment, primarily at an individual store level, whenever events or changes in circumstances indicate that the carrying value of an asset may not be recoverable. Our impairment analyses determine whether projected cash flows from operations are sufficient to recover the carrying value of these assets. Impairment may result when the carrying value of the asset exceeds the estimated undiscounted future cash flows over its remaining useful life. For store impairment, our estimate of undiscounted future cash flows over the store lease term is based upon our experience, the historical operations of the stores and estimates of future store profitability and economic conditions. The estimates of future store profitability and economic conditions require estimating such factors as sales growth, gross margin, employment costs, lease escalations, inflation and the overall economics of the retail industry, and are therefore subject to variability and difficult to predict. Actual future results may differ from those estimates. If a long-lived asset is found to be impaired, the amount recognized for impairment is equal to the excess of the asset’s net carrying value over its fair value. Long-lived assets are measured at fair value on a nonrecurring basis using Level 3 inputs as defined in the fair value hierarchy (see Note M to our Consolidated Financial Statements). The fair value is based on the present value of estimated future cash flows using a discount rate that approximates our weighted average cost of capital.
During fiscal 2018, we recorded asset impairment charges of approximately $9,639,000, related to our retail stores, which is recorded within selling, general and administrative expenses. During fiscal 2017, we did not record any asset impairment charges. During fiscal 2016, we recorded asset impairment charges of approximately $1,765,000 related to our retail stores.
Business Combinations
We account for acquired businesses when we obtain control of the business using the acquisition method of accounting. Assets acquired and liabilities assumed are recorded based upon the estimated fair value as of the acquisition date. Estimated fair values represent the estimated price that would be paid by a third-party market participant based upon the highest and best use of the assets acquired or liabilities assumed. The determination of the fair value of assets acquired and liabilities assumed requires significant judgment and estimates. In making such judgments and estimates, we utilize inputs from independent third-party valuation specialists and other internal sources. Any excess of the purchase price over the estimated fair value of the identifiable net assets acquired is recorded as goodwill. Acquisition-related expenses are expensed as incurred. During fiscal 2017, we acquired Outward (see Note O to our Consolidated Financial Statements). During the second quarter of fiscal 2018, we finalized the valuation of intangible assets acquired, which primarily represent 3-D imaging data and core intellectual property which are being amortized over a useful life of four years.
Goodwill
Goodwill is initially recorded as of the acquisition date, and is measured as any excess of the purchase price over the estimated fair value of the identifiable net assets acquired. Goodwill is not amortized, but rather is subject to impairment testing annually (on the first day of the fourth quarter), or between annual tests whenever events or changes in circumstances indicate that the fair value of a reporting unit may be below its carrying amount. We first perform a qualitative assessment to evaluate goodwill for potential impairment. If based on that assessment it is more likely than not that the fair value of the reporting unit is below its carrying value, a quantitative impairment test is necessary. The quantitative impairment test requires determining the fair value of the reporting
Table of Contents
unit. We use the income approach, whereby we calculate the fair value based on the present value of estimated future cash flows using a discount rate that approximates our weighted average cost of capital. The process of evaluating the potential impairment of goodwill is subjective and requires significant estimates and assumptions about the future such as sales growth, gross margins, employment costs, capital expenditures, inflation and future economic and market conditions. Actual future results may differ from those estimates. If the carrying value of the reporting unit’s assets and liabilities, including goodwill, exceeds its fair value, impairment is recorded for the excess, not to exceed the total amount of goodwill allocated to the reporting unit.
As of February 3, 2019 and January 28, 2018, we had goodwill of $85,382,000 and $18,838,000, respectively, primarily related to our fiscal 2017 acquisition of Outward and our fiscal 2011 acquisition of Rejuvenation, Inc. In fiscal 2018, fiscal 2017, and fiscal 2016, we performed a qualitative assessment of potential goodwill impairment and determined it was more likely than not that the fair value of each of our reporting units exceeded its carrying value. Accordingly, no further impairment testing of goodwill was performed. We did not recognize any goodwill impairment in fiscal 2018, fiscal 2017, or fiscal 2016.
Self-Insured Liabilities
We are primarily self-insured for workers’ compensation, employee health benefits, product and other general liability claims. We record self-insurance liability reserves based on claims filed, including the development of those claims, and an estimate of claims incurred but not yet reported, based on an actuarial analysis of historical claims data. Factors affecting these estimates include future inflation rates, changes in severity, benefit level changes, medical costs and claim settlement patterns. Should a different number of claims occur compared to what was estimated, or costs of the claims increase or decrease beyond what was anticipated, reserves may need to be adjusted accordingly. Self-insurance reserves for workers’ compensation, employee health benefits, product and other general liability claims were $28,542,000 and $26,370,000 as of February 3, 2019 and January 28, 2018, respectively.
Income Taxes
Income taxes are accounted for using the asset and liability method. Under this method, deferred income taxes arise from temporary differences between the tax basis of assets and liabilities and their reported amounts in our Consolidated Financial Statements. We record reserves for our estimates of the additional income tax liability that is more likely than not to result from the ultimate resolution of foreign and domestic tax examinations. At any one time, many tax years are subject to examination by various taxing jurisdictions. The results of these audits and negotiations with taxing authorities may affect the ultimate settlement of these issues. We review and update the estimates used in the accrual for uncertain tax positions as more definitive information becomes available from taxing authorities, upon completion of tax examination, upon expiration of statutes of limitation, or upon occurrence of other events.
In order to compute income tax on an interim basis, we estimate what our effective tax rate will be for the full fiscal year and adjust these estimates throughout the year as necessary. Adjustments to our income tax provision due to changes in our estimated effective tax rate are recorded in the interim period in which the change occurs. The tax expense (or benefit) related to items other than ordinary income is individually computed and recognized when the items occur. Our effective tax rate in a given financial statement period may be materially impacted by changes in the mix and level of our earnings in various taxing jurisdictions or changes in tax law.
Table of Contents
Item 7A. QUANTITATIVE AND QUALITATIVE DISCLOSURES ABOUT MARKET RISK
| --- | --- |
We are exposed to market risks, which include significant deterioration of the U.S. and foreign markets, changes in U.S. interest rates, foreign currency exchange rate fluctuations and the effects of economic uncertainty which may affect the prices we pay our vendors in the foreign countries in which we do business. We do not engage in financial transactions for trading or speculative purposes.
Interest Rate Risk
Our revolver and our term loan each have a variable interest rate which, when drawn upon, subjects us to risks associated with changes in that interest rate. As of February 3, 2019, we had $300,000,000 outstanding under the term loan, and during fiscal 2018 we had borrowings of $60,000,000 under the revolver, all of which were repaid in the fourth quarter of fiscal 2018. A hypothetical increase or decrease of one percentage point on our existing variable rate debt instruments would not materially affect our results of operations or cash flows.
In addition, we have fixed and variable income investments consisting of short-term investments classified as cash and cash equivalents, which are also affected by changes in market interest rates. As of February 3, 2019, our investments, made primarily in interest bearing demand deposit accounts and money market funds, are stated at cost and approximate their fair values.
Foreign Currency Risks
We purchase a significant amount of inventory from vendors outside of the U.S. in transactions that are denominated in U.S. dollars and, as such, any foreign currency impact related to these international purchase transactions was not significant to us during fiscal 2018 or fiscal 2017. Since we pay for the majority of our international purchases in U.S. dollars, however, a decline in the U.S. dollar relative to other foreign currencies would subject us to risks associated with increased purchasing costs from our vendors in their effort to offset any lost profits associated with any currency devaluation. We cannot predict with certainty the effect these increased costs may have on our financial statements or results of operations.
In addition, our retail and/or e-commerce businesses in Canada, Australia and the United Kingdom, and our operations throughout Asia and Europe, expose us to market risk associated with foreign currency exchange rate fluctuations. Substantially all of our purchases and sales are denominated in U.S. dollars, which limits our exposure to this risk. However, some of our foreign operations have a functional currency other than the U.S. dollar. While the impact of foreign currency exchange rate fluctuations was not material to us in fiscal 2018, we have continued to see volatility in the exchange rates in the countries in which we do business. As we continue to expand globally, the foreign currency exchange risk related to our foreign operations may increase. To mitigate this risk, we hedge a portion of our foreign currency exposure with foreign currency forward contracts in accordance with our risk management policies (see Note L to our Consolidated Financial Statements).
Table of Contents
Item 8. FINANCIAL STATEMENTS AND SUPPLEMENTARY DATA
| --- | --- |
Williams-Sonoma, Inc.
Consolidated Statements of Earnings
| In thousands, except per share amounts | Fiscal 2018 (53 weeks) | Fiscal 2017 (52 weeks) | Fiscal 2016 (52 weeks) | |||||||||
| E-commerce net revenues | $ 3,082,064 | $ 2,778,457 | $ 2,633,602 | |||||||||
| Retail net revenues | 2,589,529 | 2,513,902 | 2,450,210 | |||||||||
| Net revenues | 5,671,593 | 5,292,359 | 5,083,812 | |||||||||
| Cost of goods sold | 3,570,580 | 3,360,648 | 3,200,502 | |||||||||
| Gross profit | 2,101,013 | 1,931,711 | 1,883,310 | |||||||||
| Selling, general and administrative expenses | 1,665,060 | 1,477,900 | 1,410,711 | |||||||||
| Operating income | 435,953 | 453,811 | 472,599 | |||||||||
| Interest (income) expense, net | 6,706 | 1,372 | 688 | |||||||||
| Earnings before income taxes | 429,247 | 452,439 | 471,911 | |||||||||
| Income taxes | 95,563 | 192,894 | 166,524 | |||||||||
| Net earnings | $ 333,684 | $ 259,545 | $ 305,387 | |||||||||
| Basic earnings per share | $ 4.10 | $ 3.03 | $ 3.45 | |||||||||
| Diluted earnings per share | $ 4.05 | $ 3.02 | $ 3.41 | |||||||||
| Shares used in calculation of earnings per share: | ||||||||||||
| Basic | 81,420 | 85,592 | 88,594 | |||||||||
| Diluted | 82,340 | 86,080 | 89,462 |
See Notes to Consolidated Financial Statements.
Williams-Sonoma, Inc.
Consolidated Statements of Comprehensive Income
| In thousands | Fiscal 2018 (53 weeks) | Fiscal 2017 (52 weeks) | Fiscal 2016 (52 weeks) | |||||||||
| Net earnings | $ 333,684 | $ 259,545 | $ 305,387 | |||||||||
| Other comprehensive income (loss): | ||||||||||||
| Foreign currency translation adjustments | (5,032 | ) | 3,730 | 1,523 | ||||||||
| Change in fair value of derivative financial instruments, net of tax (tax benefit) of $390, $(259) and $(327) | 1,098 | (715 | ) | (916 | ) | |||||||
| Reclassification adjustment for realized (gain) loss on derivative financial instruments, net of tax (tax benefit) of $122, $(38) and $(41) | (357 | ) | 106 | 106 | ||||||||
| Comprehensive income | $ 329,393 | $ 262,666 | $ 306,100 |
See Notes to Consolidated Financial Statements.
Table of Contents
Williams-Sonoma, Inc.
Consolidated Balance Sheets
| In thousands, except per share amounts | Feb. 3, 2019 | Jan. 28, 2018 | ||||||
| ASSETS | ||||||||
| Current assets | ||||||||
| Cash and cash equivalents | $ | 338,954 | $ | 390,136 | ||||
| Accounts receivable, net | 107,102 | 90,119 | ||||||
| Merchandise inventories, net | 1,124,992 | 1,061,593 | ||||||
| Prepaid catalog expenses | — | 20,517 | ||||||
| Prepaid expenses | 101,356 | 62,204 | ||||||
| Other current assets | 21,939 | 11,876 | ||||||
| Total current assets | 1,694,343 | 1,636,445 | ||||||
| Property and equipment, net | 929,635 | 932,283 | ||||||
| Deferred income taxes, net | 44,055 | 67,306 | ||||||
| Goodwill | 85,382 | 18,838 | ||||||
| Other long-term assets, net | 59,429 | 130,877 | ||||||
| Total assets | $ | 2,812,844 | $ | 2,785,749 | ||||
| LIABILITIES AND STOCKHOLDERS’ EQUITY | ||||||||
| Current liabilities | ||||||||
| Accounts payable | $ | 526,702 | $ | 457,144 | ||||
| Accrued expenses | 163,559 | 134,207 | ||||||
| Gift card and other deferred revenue | 290,445 | 300,607 | ||||||
| Income taxes payable | 21,461 | 56,783 | ||||||
| Other current liabilities | 72,645 | 59,082 | ||||||
| Total current liabilities | 1,074,812 | 1,007,823 | ||||||
| Deferred rent and lease incentives | 201,374 | 202,134 | ||||||
| Long-term debt | 299,620 | 299,422 | ||||||
| Other long-term liabilities | 81,324 | 72,804 | ||||||
| Total liabilities | 1,657,130 | 1,582,183 | ||||||
| Commitments and contingencies – See Note I | ||||||||
| Stockholders’ equity | ||||||||
| Preferred stock: $.01 par value; 7,500 shares authorized; none issued | — | — | ||||||
| Common stock: $.01 par value; 253,125 shares authorized; 78,813 and 83,726 shares issued and outstanding at February 3, 2019 and January 28, 2018, respectively | 789 | 837 | ||||||
| Additional paid-in capital | 581,900 | 562,814 | ||||||
| Retained earnings | 584,333 | 647,422 | ||||||
| Accumulated other comprehensive loss | (11,073 | ) | (6,782 | ) | ||||
| Treasury stock – at cost: 2 and 11 shares as of February 3, 2019 and January 28, 2018, respectively | (235 | ) | (725 | ) | ||||
| Total stockholders’ equity | 1,155,714 | 1,203,566 | ||||||
| Total liabilities and stockholders’ equity | $ | 2,812,844 | $ | 2,785,749 |
See Notes to Consolidated Financial Statements.
Table of Contents
Williams-Sonoma, Inc.
Consolidated Statements of Stockholders’ Equity
| Common Stock | Additional Paid-in Capital | Retained Earnings | Accumulated Other Comprehensive Income (Loss) | Treasury Stock | Total Stockholders’ Equity | |||||||||||||||||||||||
| In thousands | Shares | Amount | ||||||||||||||||||||||||||
| Balance at January 31, 2016 | 89,563 | $ | 896 | $ | 541,307 | $ | 668,545 | $ | (10,616) | $ | (1,906 | ) | $ | 1,198,226 | ||||||||||||||
| Net earnings | — | — | — | 305,387 | — | — | 305,387 | |||||||||||||||||||||
| Foreign currency translation adjustments | — | — | — | — | 1,523 | — | 1,523 | |||||||||||||||||||||
| Change in fair value of derivative financial instruments, net of tax | — | — | — | — | (916 | ) | — | (916 | ) | |||||||||||||||||||
| Reclassification adjustment for realized (gain) loss on derivative financial instruments, net of tax | — | — | — | — | 106 | — | 106 | |||||||||||||||||||||
| Exercise of stock-based awards and related tax effect | 39 | — | 4,762 | — | — | — | 4,762 | |||||||||||||||||||||
| Conversion/release of stock-based awards_1_ | 594 | 6 | (26,805 | ) | — | — | (263 | ) | (27,062 | ) | ||||||||||||||||||
| Repurchases of common stock | (2,871 | ) | (29 | ) | (12,684 | ) | (138,559 | ) | — | — |
Showing the first 8K of 114K characters. Open the full section
Item 9. CHANGES IN AND DISAGREEMENTS WITH ACCOUNTANTS ON ACCOUNTING AND FINANCIAL DISCLOSURE
| --- | --- |
None.
Item 9A. CONTROLS AND PROCEDURES
| --- | --- |
Evaluation of Disclosure Controls and Procedures
As of February 3, 2019, an evaluation was performed by management, with the participation of our Chief Executive Officer (“CEO”) and our Chief Financial Officer (“CFO”), of the effectiveness of our disclosure controls and procedures. Based on that evaluation, our management, including our CEO and CFO, concluded that
Table of Contents
our disclosure controls and procedures are effective to ensure that information we are required to disclose in reports that we file or submit under the Securities Exchange Act of 1934 is accumulated and communicated to our management, including our CEO and CFO, as appropriate, to allow for timely discussions regarding required disclosures, and that such information is recorded, processed, summarized and reported within the time periods specified in the rules and forms of the SEC.
Management’s Report on Internal Control Over Financial Reporting
Our management is responsible for establishing and maintaining adequate internal control over the company’s financial reporting. These internal controls are designed to provide reasonable assurance that the reported information is fairly presented, that disclosures are adequate and that the judgments inherent in the preparation of financial statements are reasonable. There are inherent limitations in the effectiveness of any internal control, including the possibility of human error and the circumvention or overriding of controls. Further, because of changes in conditions, the effectiveness of any internal control may vary over time.
Our management assessed the effectiveness of the company’s internal control over financial reporting as of February 3, 2019. In making this assessment, we used the criteria set forth by the Committee of Sponsoring Organizations of the Treadway Commission (COSO) in Internal Control-Integrated Framework (2013). Based on our assessment using those criteria, our management concluded that, as of February 3, 2019, our internal control over financial reporting is effective.
Our independent registered public accounting firm audited the Consolidated Financial Statements included in this Annual Report on Form 10-K and the company’s internal control over financial reporting. Their audit report appears on pages 65 and 66 of this Annual Report on Form 10-K.
Changes in Internal Control Over Financial Reporting
There was no change in our internal control over financial reporting that occurred during our most recent fiscal quarter that has materially affected, or is reasonably likely to materially affect, our internal control over financial reporting.
Item 9B. OTHER INFORMATION
| --- | --- |
On April 3, 2019, the Company’s Compensation Committee adopted the Amended and Restated 2012 EVP Level Management Retention Plan (the “MRP”). The terms of the MRP are substantially identical to the terms of the Company’s 2012 EVP Level Management Retention Plan adopted on November 1, 2012 by the Company’s Compensation Committee, which terms were described in the Company’s Current Report on Form 8-K as filed with the Commission on November 7, 2012.
Table of Contents
PART III
Item 10. DIRECTORS, EXECUTIVE OFFICERS AND CORPORATE GOVERNANCE
| --- | --- |
Information required by this Item is incorporated by reference herein to information under the headings “Election of Directors,” “Information Concerning Executive Officers,” “Audit and Finance Committee Report,” “Corporate Governance — Corporate Governance Guidelines and Code of Business Conduct and Ethics,” “Corporate Governance — Audit and Finance Committee” and “Section 16(a) Beneficial Ownership Reporting Compliance” in our Proxy Statement for the 2019 Annual Meeting of Stockholders (the “Proxy Statement”).
Item 11. EXECUTIVE COMPENSATION
| --- | --- |
Information required by this Item is incorporated by reference herein to information under the headings “Corporate Governance — Compensation Committee,” “Corporate Governance — Director Compensation,” and “Executive Compensation” in our Proxy Statement.
Item 12. SECURITY OWNERSHIP OF CERTAIN BENEFICIAL OWNERS AND MANAGEMENT AND RELATED STOCKHOLDER MATTERS
| --- | --- |
Information required by this Item is incorporated by reference herein to information under the heading “Security Ownership of Principal Stockholders and Management” in our Proxy Statement.
Item 13. CERTAIN RELATIONSHIPS AND RELATED TRANSACTIONS, AND DIRECTOR INDEPENDENCE
| --- | --- |
Information required by this Item is incorporated by reference herein to information under the heading “Certain Relationships and Related Transactions” in our Proxy Statement.
Item 14. PRINCIPAL ACCOUNTANT FEES AND SERVICES
| --- | --- |
Information required by this Item is incorporated by reference herein to information under the headings “Audit and Finance Committee Report” and “Proposal 3 — Ratification of Selection of Independent Registered Public Accounting Firm — Deloitte Fees and Services” in our Proxy Statement.
Table of Contents
PART IV
Item 15. EXHIBITS AND FINANCIAL STATEMENT SCHEDULES
| --- | --- |
| (a)(1) | Financial Statements: | |||||
| The following Consolidated Financial Statements of Williams-Sonoma, Inc. and subsidiaries and the related notes are filed as part of this report pursuant to Item 8: | ||||||
| PAGE | ||||||
| Consolidated Statements of Earnings | 40 | |||||
| Consolidated Statements of Comprehensive Income | 40 | |||||
| Consolidated Balance Sheets | 41 | |||||
| Consolidated Statements of Stockholders’ Equity | 42 | |||||
| Consolidated Statements of Cash Flows | 43 | |||||
| Notes to Consolidated Financial Statements | 44 | |||||
| Report of Independent Registered Public Accounting Firm | 65 | |||||
| Quarterly Financial Information | 67 | |||||
| (a)(2) | Financial Statement Schedules: Schedules have been omitted because they are not required, are not applicable, or because the required information, where material, is included in the financial statements, notes, or supplementary financial information. | |||||
| (a)(3) | Exhibits: The exhibits listed in the below Exhibit Index are filed or incorporated by reference as part of this Form 10-K | |||||
| (b) | Exhibits: The exhibits listed in the below Exhibit Index are filed or incorporated by reference as part of this Form 10-K | |||||
| (c) | Financial Statement Schedules: Schedules have been omitted because they are not required or are not applicable. |
Exhibit Index
Table of Contents
Table of Contents
Table of Contents
Table of Contents
Table of Contents
| XBRL | ||
| 101.INS* | XBRL Instance Document | |
| 101.SCH* | XBRL Taxonomy Extension Schema Document | |
| 101.CAL* | XBRL Taxonomy Extension Calculation Linkbase Document | |
| 101.DEF* | XBRL Taxonomy Extension Definition Linkbase Document | |
| 101.LAB* | XBRL Taxonomy Extension Label Linkbase Document | |
| 101.PRE* | XBRL Taxonomy Extension Presentation Linkbase Document |
| * | Filed herewith. |
|---|
| + | Indicates a management contract or compensatory plan or arrangement. |
|---|
Item 16. FORM 10-K SUMMARY
| --- | --- |
None.
Table of Contents
SIGNATURES
Pursuant to the requirements of Section 13 or 15(d) of the Securities Exchange Act of 1934, the registrant has duly caused this report to be signed on its behalf by the undersigned, thereunto duly authorized.
| WILLIAMS-SONOMA, INC. | ||||||||
| Date: April 4, 2019 | By | /s/ LAURA ALBER | ||||||
| Chief Executive Officer |
Pursuant to the requirements of the Securities Exchange Act of 1934, as amended, this report has been signed below by the following persons on behalf of the registrant and in the capacities and on the dates indicated.
| Date: April 4, 2019 | /s/ ADRIAN BELLAMY | |
| Adrian Bellamy | ||
| Chairman of the Board of Directors | ||
| Date: April 4, 2019 | /s/ LAURA ALBER | |
| Laura Alber | ||
| Chief Executive Officer | ||
| (principal executive officer) | ||
| Date: April 4, 2019 | /s/ JULIE WHALEN | |
| Julie Whalen | ||
| Chief Financial Officer | ||
| (principal financial officer and principal accounting officer) | ||
| Date: April 4, 2019 | /s/ ANTHONY GREENER | |
| Anthony Greener | ||
| Director | ||
| Date: April 4, 2019 | /s/ ROBERT LORD | |
| Robert Lord | ||
| Director | ||
| Date: April 4, 2019 | /s/ ANNE MULCAHY | |
| Anne Mulcahy | ||
| Director | ||
| Date: April 4, 2019 | /s/ GRACE PUMA | |
| Grace Puma | ||
| Director | ||
| Date: April 4, 2019 | /s/ CHRISTIANA SMITH SHI | |
| Christiana Smith Shi | ||
| Director | ||
| Date: April 4, 2019 | /s/ SABRINA SIMMONS | |
| Sabrina Simmons | ||
| Director | ||
| Date: April 4, 2019 | /s/ FRITS VAN PAASSCHEN | |
| Frits van Paasschen | ||
| Director |