 filings.tools
Williams-Sonoma 10-K 2023-01-29
Filed 2023-03-24. 23 sections, 323K characters. Original on sec.gov · Markdown · JSON
Cover and table of contents
UNITED STATES
SECURITIES AND EXCHANGE COMMISSION
WASHINGTON, D.C. 20549
| FORM | 10-K |
(Mark One):
| ☒ | ANNUAL REPORT PURSUANT TO SECTION 13 OR 15(d) OF THE SECURITIES EXCHANGE ACT OF 1934 |
For the fiscal year ended January 29, 2023.
OR
| ☐ | TRANSITION REPORT PURSUANT TO SECTION 13 OR 15(d) OF THE SECURITIES EXCHANGE ACT OF 1934 |
For the transition period from to
Commission file number 001-14077
| WILLIAMS-SONOMA, INC. | ||||||||
| (Exact name of registrant as specified in its charter) |
| Delaware | 94-2203880 | |||||||||||||
| (State or other jurisdiction of incorporation or organization) | (I.R.S. Employer Identification No.) | |||||||||||||
| 3250 Van Ness Avenue, San Francisco, CA | 94109 | |||||||||||||
| (Address of principal executive offices) | (Zip Code) |
Registrant’s telephone number, including area code: (415) 421-7900
Securities registered pursuant to Section 12(b) of the Act:
| Title of each class: | Trading Symbol(s): | Name of each exchange on which registered: | ||||||||||||||||||
| Common Stock, par value $.01 per share | WSM | New York Stock Exchange, Inc. |
Securities registered pursuant to Section 12(g) of the Act: None
Indicate by check mark if the registrant is a well-known seasoned issuer, as defined in Rule 405 of the Securities Act. Yes ý No ☐
Indicate by check mark if the registrant is not required to file reports pursuant to Section 13 or Section 15(d) of the Act. Yes ☐ No ý
Indicate by check mark whether the registrant (1) has filed all reports required to be filed by Section 13 or 15(d) of the Securities Exchange Act of 1934 during the preceding 12 months (or for such shorter period that the registrant was required to file such reports), and (2) has been subject to such filing requirements for the past 90 days. Yes ý No ☐
Indicate by check mark whether the registrant has submitted electronically every Interactive Data File required to be submitted pursuant to Rule 405 of Regulation S-T (§232.405 of this chapter) during the preceding 12 months (or for such shorter period that the registrant was required to submit such files). Yes ý No ☐
Indicate by check mark whether the registrant is a large accelerated filer, an accelerated filer, a non-accelerated filer, a smaller reporting company, or emerging growth company. See definitions of “large accelerated filer,” “accelerated filer,” “smaller reporting company,” and “emerging growth company” in Rule 12b-2 of the Exchange Act.
Large accelerated filer ý Accelerated filer ☐ Non-accelerated filer ☐
Smaller reporting company ☐ Emerging growth company ☐
If an emerging growth company, indicate by check mark if the registrant has elected not to use the extended transition period for complying with any new or revised financial accounting standards provided pursuant to Section 13(a) of the Exchange Act. ☐
Indicate by check mark whether the registrant has filed a report on and attestation to its management’s assessment of the effectiveness of its internal control over financial reporting under Section 404(b) of the Sarbanes-Oxley Act (15 U.S.C. 7262(b)) by the registered public accounting firm that prepared or issued its audit report.☒
If securities are registered pursuant to Section 12(b) of the Act, indicate by check mark whether the financial statements of the registrant included in the filing reflect the correction of an error to previously issued financial statements. ☐
Indicate by check mark whether any of those error corrections are restatements that required a recovery analysis of incentive-based compensation received by any of the registrant’s executive officers during the relevant recovery period pursuant to § 240.10D-1(b). ☐
Indicate by check mark whether the registrant is a shell company (as defined in Rule 12b-2 of the Act). Yes ☐ No ☒
As of July 31, 2022, the approximate aggregate market value of the registrant’s common stock held by non-affiliates was $9,561,401,198 based on the closing sale price as reported on the New York Stock Exchange on such date. It is assumed for purposes of this computation that an affiliate includes all persons as of July 31, 2022 listed as executive officers and directors with the Securities and Exchange Commission. This aggregate market value includes all shares held in the Williams-Sonoma, Inc. Stock Fund within the registrant’s 401(k) Plan.
As of March 19, 2023, 66,228,239 shares of the registrant’s common stock were outstanding.
DOCUMENTS INCORPORATED BY REFERENCE
Portions of our definitive Proxy Statement for the 2023 Annual Meeting of Stockholders, also referred to in this Annual Report on Form 10-K as our Proxy Statement, which will be filed with the Securities and Exchange Commission, or SEC, have been incorporated in Part III hereof.
FORWARD-LOOKING STATEMENTS
This Annual Report on Form 10-K and the letter to stockholders contained in this Annual Report contain forward-looking statements within the “safe harbor” provisions of the Private Securities Litigation Reform Act of 1995 that involve risks and uncertainties, as well as assumptions that, if they do not fully materialize or prove incorrect, could cause our business and operating results to differ materially from those expressed or implied by such forward-looking statements. Such forward-looking statements include, without limitation, statements related to: projections of earnings, revenues, growth and other financial items; the strength of our business and our brands; our ability to execute strategic priorities and growth initiatives regarding digital leadership, product and technology innovation, cross-brand initiatives, retail transformation and operational excellence; our ability to execute on our environmental, social and governance initiatives; the continuing impact of inflation and measures to control inflation, including raising interest rates, on consumer spending; the continuing impact of the coronavirus, war in Ukraine, and shortages of various raw materials on our global supply chain, retail store operations and customer demand; labor and material shortages; the outcome of our growth initiatives; our ability to anticipate consumer preferences and buying trends; dependence on timely introduction and customer acceptance of our merchandise; changes in consumer spending based on weather, political, competitive and other conditions beyond our control; delays in store openings; competition from companies with concepts or products similar to ours; timely and effective sourcing of merchandise from our foreign and domestic vendors and delivery of merchandise through our supply chain to our stores and customers; effective inventory management; our ability to manage customer returns; uncertainties in e-marketing, infrastructure and regulation; multi-channel and multi-brand complexities; our ability to introduce new brands and brand extensions; challenges associated with our increasing global presence; dependence on external funding sources for operating capital; disruptions in the financial markets; our ability to control employment, occupancy, supply chain, product, transportation and other operating costs; our ability to improve our systems and processes; changes to our information technology infrastructure; general political, economic and market conditions and events, including war, conflict or acts of terrorism; the impact of current and potential future tariffs and our ability to mitigate impacts; the potential for increased corporate income taxes; our beliefs about our competitive advantages and areas of potential future growth in the market; our ability to drive long-term sustainable returns; the plans, strategies, initiatives and objectives of management for future operations; our brands, products and related initiatives, including our ability to introduce new products and product lines and bring in new customers; the complementary nature of our e-commerce and retail channels; our marketing efforts; our global business and expansion efforts, including franchise, other third-party arrangements and company-owned operations; the seasonal variations in demand; our ability to recruit, retain and motivate skilled personnel; our belief in the reasonableness of the steps taken to protect the security and confidentiality of the information we collect; our belief in the adequacy of our facilities and the availability of suitable additional or substitute space; our belief in the ultimate resolution of current legal proceedings; the payment of dividends; our stock repurchase program; our capital allocation strategy in fiscal 2023; our planned use of cash in fiscal 2023; our compliance with financial covenants; our belief that our cash on hand and available credit facilities will provide adequate liquidity for our business operations; our belief regarding the effects of potential losses under our indemnification obligations; the effects of changes in our inventory reserves; the impact of new accounting pronouncements; and statements of belief and statements of assumptions underlying any of the foregoing. You can identify these and other forward-looking statements by the use of words such as “will,” “may,” “should,” “expects,” “plans,” “anticipates,” “believes,” “estimates,” “predicts,” “intends,” “potential,” “continue,” or the negative of such terms, or other comparable terminology.
The risks, uncertainties and assumptions referred to above that could cause our results to differ materially from the results expressed or implied by such forward-looking statements include, but are not limited to, those discussed under the heading “Risk Factors” in Part I, Item 1A hereto and the risks, uncertainties and assumptions discussed from time to time in our other public filings with the U.S. Securities and Exchange Commission (“SEC”), which are available on the SEC’s web site at www.sec.gov. All forward-looking statements included in this Annual Report on Form 10-K are based on information available to us as of the date hereof, and we assume no obligation to update these forward-looking statements.
WILLIAMS-SONOMA, INC.
ANNUAL REPORT ON FORM 10-K
FISCAL YEAR ENDED JANUARY 29, 2023
TABLE OF CONTENTS
PART I
Item 1. BUSINESS
OVERVIEW
Williams-Sonoma, Inc., (the "Company”, "we", or "us") incorporated in 1973, is an omni-channel specialty retailer of high-quality products for the home.
In 1956, our founder, Chuck Williams, turned a passion for cooking and eating with friends into a small business with a big idea. He opened a store in Sonoma, California to sell the French cookware that intrigued him while visiting Europe but that could not be found in America. Chuck’s business, which set a standard for customer service, took off and helped fuel a revolution in American cooking and entertaining that continues today.
In the decades that followed, the quality of our products, our ability to identify new opportunities in the market and our people-first approach to business have facilitated our expansion beyond the kitchen into nearly every area of the home. Growth across our portfolio has been fueled by our three key differentiators - our in-house design, our digital-first channel strategy, and our values. Our in-house design capabilities and vertically integrated sourcing organization allow us to deliver high-quality, sustainable products at competitive prices. Through our e-commerce platform, our in-house customer relationship management and data analytic teams optimize our digital spend and customer connections. We have expanded our in-store services to include ship-to-store as we transition our stores to not only provide an exceptional customer service experience but to also serve as design centers and omni-fulfillment hubs.
Williams-Sonoma, Inc. is the world’s largest digital-first, design-led and sustainable home retailer. Our products represent distinct merchandise strategies — Williams Sonoma, Pottery Barn, Pottery Barn Kids, Pottery Barn Teen, West Elm, Williams Sonoma Home, Rejuvenation, and Mark and Graham — are marketed through e-commerce websites, direct-mail catalogs and retail stores. These brands are also part of The Key Rewards, our loyalty and credit card program that offers members exclusive benefits across the Williams-Sonoma family of brands. We operate in the U.S., Puerto Rico, Canada, Australia and the United Kingdom, offer international shipping to customers worldwide, and have unaffiliated franchisees that operate stores in the Middle East, the Philippines, Mexico, South Korea and India, as well as e-commerce websites in certain locations. We are also proud to be a leader in our industry with our Environmental, Social and Governance (“ESG”) efforts.
Williams Sonoma
From the beginning, our namesake brand, Williams Sonoma, has been bringing people together around food. A leading specialty retailer of high-quality products for the kitchen and home, the brand seeks to provide world-class service and an engaging customer experience. Williams Sonoma products include everything for cooking, dining and entertaining, including: cookware, tools, electrics, cutlery, tabletop and bar, outdoor, furniture and a vast library of cookbooks. The brand also includes Williams Sonoma Home, a premium concept that offers classic home furnishings and decorative accessories, extending the Williams Sonoma lifestyle beyond the kitchen into every room of the home.
Pottery Barn
Established in 1949 and acquired by Williams-Sonoma, Inc. in 1986, Pottery Barn is a premier omni-channel home furnishings retailer. America’s most meaningful, beautiful design source, Pottery Barn brings together good products, people and values — seeking inspiration, quality, sustainability and service in everything we do. Thoughtfully designed and crafted to last, Pottery Barn’s furniture, bedding, lighting, rugs, table essentials, decorative accessories and more can be loved for a lifetime.
Pottery Barn Kids
Kids are, and have always been, the inspiration behind what we do at Pottery Barn Kids. Since 1999, it’s been our mission to bring the utmost in quality, sustainability, safety and style into every family’s home. Most importantly, all our designs are rigorously tested to meet the highest child safety standards and expertly crafted from the best materials to last beyond their childhood years.
West Elm
Born in Brooklyn in 2002, West Elm is dedicated to transforming people’s lives and spaces through creativity, style and purpose. West Elm creates unique, modern and affordable home decor and curates a global selection of local, ethically-sourced and Fair Trade Certified products, available online and in our stores worldwide.
Pottery Barn Teen
Launched in 2003, Pottery Barn Teen is the first home concept to focus exclusively on the teen market. Our purpose is to make safe and sustainable designs that inspire teens to create the world they want to live in. We’re designing everything from organic bedding to multi-purpose furniture that adapts and lasts. Our mission is to create for the future.
Rejuvenation
Rejuvenation, founded in 1977 with a passion for timeless design and quality craftsmanship, was acquired by Williams-Sonoma, Inc. in 2011. With design, manufacturing and distribution facilities in Portland, Oregon, Rejuvenation offers a wide assortment of made-to-order lighting, hardware, furniture and home décor inspired by history, designed for today and made to last for years to come.
Mark and Graham
Established in 2012, Mark and Graham is a leading monogrammed lifestyle brand that offers thoughtfully designed personalized products and custom gifts. The digitally native brand is known for high quality collections, ranging from home gifts to luggage to handbags, designed in-house that can be personalized with more than 50 exclusive monograms.
Outward
In 2017, we acquired Outward, Inc., a 3-D imaging and augmented reality platform for the home furnishings and décor industry. Headquartered in San Jose, California, Outward’s technology enables scalable applications in product visualization, digital room design and augmented and virtual reality.
OPERATIONS
As of January 29, 2023, we had the following merchandise strategies: Williams Sonoma, Pottery Barn, Pottery Barn Kids, Pottery Barn Teen, West Elm, Williams Sonoma Home, Rejuvenation and Mark and Graham, which sell our products through our e-commerce websites, retail stores and direct-mail catalogs. We offer shipping from many of our brands to countries worldwide, while our catalogs reach customers throughout the U.S. The e-commerce and retail businesses complement each other by meeting the customers where they are; building brand awareness and acting as effective advertising vehicles. Our ability to leverage insights from both these channels, our omni-channel positioning and our marketing efforts, focused on digital advertising complemented by targeted catalogs, drive sales to each of our channels. Consistent with our published privacy policies, we leverage our proprietary customer file which is a unified view of customers across brands and channels, for digital, email, and catalog marketing purposes, augmented by our propensity to buy models developed by our in-house analytics team. Our retail stores serve as billboards for our brands, which we believe inspires new and existing customers to also shop online. We operate 530 stores, which include 489 stores in 41 states, Washington, D.C. and Puerto Rico, 20 stores in Canada, 19 stores in Australia and 2 stores in the United Kingdom. We also have multi-year franchise agreements with third parties in the Middle East, the Philippines, Mexico, South Korea and India that currently operate 138 franchised locations as well as e-commerce websites in certain locations.
SUPPLIERS
We purchase most of our merchandise from numerous foreign and domestic manufacturers and importers, the largest of which accounted for approximately 3% of our purchases during fiscal 2022. Approximately 67% of our merchandise purchases in fiscal 2022 were sourced from foreign vendors, predominantly in Asia and Europe. Substantially all of these purchases were negotiated and paid for in U.S. dollars. In addition, we manufacture merchandise, primarily upholstered furniture and lighting, at our facilities located in North Carolina, California, Oregon and Mississippi. The current macroeconomic environment is uncertain and we continue to incur increased costs across our global supply chain. It is hard to predict with certainty when these supply chain challenges will be fully resolved, and we currently expect these supply chain challenges to negatively impact our cost of goods sold into 2023. Additionally, we are subject to risks that may disrupt our supply chain operations or regionalization efforts, such as increasing labor costs and union organizing activity. Despite these challenges, we believe our key differentiators, growth strategies and the efficiencies of our operating model to reduce costs and manage inventory levels leave us well-positioned to mitigate these costs in both the short- and long- term. Refer to Item 1A. Risk Factors and to Part II, Item 7. Management’s Discussion and Analysis of Financial Condition and Results of Operations for further discussion on the effect the global supply chain disruption has had on our results of operations.
COMPETITION AND SEASONALITY
The specialty e-commerce and retail businesses are highly competitive. Our e-commerce websites, retail stores and direct-mail catalogs compete with other retailers, including e-commerce retailers, large department stores, discount retailers, other specialty retailers offering home-centered assortments and other direct-mail catalogs. The continued shift to e-commerce has encouraged the entry of many new competitors, including discount retailers selling undifferentiated products at reduced prices, new business models and increased competition from established companies. We compete on the basis of our brand authority, the quality of our merchandise, our customer service, our proprietary customer list, our e-commerce websites and marketing capabilities, the location and appearance of our stores, as well as our in-house design, our digital-first channel strategy, and our values, which we believe have become increasingly relevant and set us apart from our competitors. Our in-house teams design our own products and work with our talented vendors to bring quality, sustainable products to market through our high-touch multi-channel platform.
Our business is subject to substantial seasonal variations in demand. Historically, a significant portion of our net revenues and net earnings have been realized during the period from October through January, and levels of net revenues and net earnings have typically been lower during the period from February through September. We believe this is the general pattern associated with the retail industry. In preparation for and during our holiday selling season, we hire a substantial number of additional temporary employees, primarily in our retail stores, distribution facilities and customer care centers.
HUMAN CAPITAL MANAGEMENT
As of January 29, 2023, we had approximately 21,100 employees, who we refer to as associates, of whom approximately 12,500 were full-time. In preparation for and during our fiscal 2022 holiday selling season, we hired a substantial number of part-time and seasonal employees, primarily in our retail stores, distribution facilities and customer care centers. None of our employees are represented by a collective bargaining agreement.
We have three key ESG pillars as key areas of focus for our Company. One of those three pillars is “People” in keeping with our long-held “People First” culture. This includes the following areas of focus:
Associate Engagement
We conduct an annual Associate Opinion Survey to directly engage with and collect feedback from our associates, which we use to improve the experience of our teams. Our human resources department maintains an open-door policy for associates to report concerns, and we provide an anonymous reporting hotline, which is available in multiple languages and managed by an independent company not affiliated with us. We strive to deliver a workplace experience where the quality of our engagement with fellow associates, business partners and customers matches the quality of the products and services we bring to the marketplace.
Talent Development and Engagement
We invest in our employees through accessible resources and structured training programs that help our associates to create the career they envision for themselves. We offer a large selection of development opportunities for our employees including in-person and online learning, as well as professional development courses, such as goal setting, unconscious bias and inclusive leadership training. We have a company-wide Advisor Program, which matches associates in a manager-and-above role with an associate in a lower-level role to form advisor/advisee relationships to provide career guidance and receive support in working through career and development challenges. We created new learning programs to further build skills and career opportunities for associates, notably focused on design and core retail skills. We also foster other team-based programs to develop talent at all levels of the Company, supplying associates with new skills and training. Through these programs, we give our associates the tools to succeed, learn new skills and develop their careers.
Diversity, Equity and Inclusion
Associate engagement and retention require an understanding of the needs of a diverse, creative and purpose-driven workforce. We firmly believe that working in a culture focused on diversity, equity and inclusion spurs innovation, creates healthy and high-performing teams, and delivers superior customer experiences. We aim to provide equal opportunity for all employees. We have several systems under which associates can report incidents or discrimination confidentially or anonymously and without fear of reprisal. As of the end of fiscal 2022, approximately 67.4% of our total workforce identified as female and approximately 43.7% identified as an ethnic minority group. Additionally, approximately 54.8% of our Vice Presidents and above identified as female. We were also included in the 2023 Bloomberg Gender-Equality Index, which tracks public companies’ commitment to gender equality.
We are focused on increasing the representation of minority talent through hiring and career development. In June 2020, we established an Equity Action Plan and formed an Equity Action Committee, including a diverse group of executives and associates, to drive positive change in the fight for racial justice, and in 2022 we continued our commitment to equity through our partnership and donation support with our racial equity and justice non-profit partners such as the NAACP, the Jackie Robinson Foundation, the National Urban League, and Asian Americans Advancing Justice—Asian Law Caucus.
We are currently building relationships with approximately 180 organizations, universities, colleges and networks to expand our reach to potential candidates. We continue to ensure we bring forward a diverse slate of candidates for all of our corporate roles posted externally, and have seen improvement in both overall representation and hire rate since we launched our Equity Action Plan. We are also a member of CEO Action for Diversity & Inclusion, in which we pledged a goal to “identify and establish associate networks for underrepresented communities to promote diversity and inclusion throughout the Company.” In furtherance of our stated goal, we have developed associate equity networks including an LGBTQIA+ Network, Black Associate Network, Veterans Appreciation Network, Hispanic/LatinX Associate Network, Asian WSI Network, and a Disability, Education & Advocacy Network.
Safety/Health and Wellness
Our vision is to provide a safe and healthy work environment for our associates and customers. Aligned with our values, we strive to continuously improve our work environments to keep our associates and customers as safe as possible. Our efforts include:
-
Incident and hazard reporting;
-
Standard operating procedures aimed at reducing risk of injury;
-
Associate and management training;
-
Promotion of best practices; and
-
Measurement of key safety metrics.
Compensation and Benefits
We offer a benefits package designed to put our associates’ health and well-being, and that of their families, at the forefront. Depending on position and location, associates may be eligible for: 401(k) plan and other investment opportunities; paid vacations, holidays and other time-off programs; health, dental and vision insurance; health and dependent care tax-free spending accounts;
medical, family and bereavement leave; paid maternity/primary caregiver benefits; tax-free commuter benefits; wellness programs including telehealth visits; time off to volunteer, and matching donations to qualifying nonprofit organizations. In addition, consistent with our commitment to diversity and inclusion, we have expanded our benefit offerings to include coverage for transgender-inclusive services, including gender confirmation surgery and hormone therapy. As we strive to keep health care affordable and inclusive, we minimized cost increases to associates and, for a large portion of the associate population, decreased the cost of health care while adding offerings to support mental health and well-being. During fiscal 2022, we also raised our Company minimum wage to $16 per hour for U.S.-based hourly associates across our retail store, corporate, and supply chain workforce.
Community Involvement
Through online and in-store donations, special product collaborations, and national and local fundraising, we give back to the communities we serve. We remain committed to our partnerships with St. Jude Children’s Research Hospital, No Kid Hungry, The Trevor Project, AIDS Walk, Canada Children’s Hospitals and the Arbor Day Foundation. We raised $4.0 million for St. Jude Children’s Research Hospital during fiscal 2022, which included donations from our customers at time of purchase, special St. Jude-designated product sales where a portion of the sale was donated, employee donations, and donations from the Company. We also support organizations and partners, such as Good360 and Habitat for Humanity, who assist those with damaged or lost homes, or those seeking decent, affordable housing. We give charitable grants, donate our merchandise, donate proceeds from the sale of certain products, and provide matching grants for charitable donations made by our associates. Our Williams-Sonoma, Inc. Foundation also provides need-based grants to our associates directly impacted by federally-declared disasters.
We also support our communities through our associates’ time and leadership, and we provide 8 hours of paid Community Involvement Time each year to our eligible associates. Additionally, we brought back opportunities for associates to volunteer their time and talents with curated in-person events that support our local and national nonprofit partners. We believe volunteering deepens our presence in the community, enhances our relationships with customers and strengthens employee engagement.
ENVIRONMENTAL, SOCIAL AND GOVERNANCE MATTERS
We believe that strategies that support the health of our planet, the well-being of our people and a shared sense of purpose foster long-term, sustainable growth for the Company. Our work continued to earn recognition across our industry. We were included in Barron’s 100 Most Sustainable Companies for five years running, recognized as Sustainable Furnishings Council Top Scoring global company for sustainable wood furniture for the past five years, and were included in the Dow Jones Sustainability North America Index for the first time. Given the alignment of our ESG work with our strategic direction, our Board is highly engaged on the topic of sustainability. Since 2019, our Nominations, Corporate Governance and Social Responsibility Committee and our Board have overseen ESG matters. The Nominations, Corporate Governance and Social Responsibility Committee oversees corporate policies and programs that speak to long-standing commitments to our associates, supply chain, environment, health and safety, human rights, cybersecurity and ethics. These policies and programs are relevant to our business, critical to our associates, and important to our customers. The Board of Directors’ oversees environmental and social matters through updates from WSI’s Executive Vice President of Sourcing, Quality Assurance, and Sustainable Development and annual updates from the organization’s dedicated sustainability team. The sustainability team presents to the full Board at least once a year to monitor and review existing and proposed strategy, goals and targets. The Executive Vice President leads both the organization’s dedicated global team of sustainability professionals as well as a working group of cross-functional leaders.
As a multinational retailer with a global supply chain, we are committed to responsible practices across our business—from designing and sourcing responsible products, to reducing waste, to working with suppliers to lower emissions and adopt sustainable business practices. We amplified our climate work in the past year, making progress towards our Science-Based Target for emissions reduction across our value chain. Building on the progress of our cotton and wood goals, we are aligning our preferred materials work with our climate strategy, using materials as part of our efforts to reach our Science-Based Target. In 2022, we drove progress towards our landfill diversion goal with stores implementing waste reduction initiatives, such as backhauling of expanded polystyrene foam. We continued to divert products from landfill into donation streams and to identify opportunities for waste reduction.
We hold our suppliers to high ethical standards, and we are committed to integrity and honesty throughout all aspects of our business. We require our vendors to adhere to the standards outlined in our Vendor Code of Conduct and accompanying implementation standards, which are informed by the conventions of the International Labour Organization (ILO) and the UN’s Guiding Principles on Business and Human Rights. Hundreds of factories in our audit scope are audited annually by independent third-party audit firms to ensure compliance with our standards relating to labor practices, health and safety, environmental protection, ethical conduct, sub-contracting, management systems, and transparency. Using a continuous improvement model, we work alongside factories to improve working conditions.
INTELLECTUAL PROPERTY
As of January 29, 2023, we own and/or have applied to register approximately 210 unique trademarks or service marks. We own and/or have applied to register our key brand names in the U.S. as well as in approximately 96 additional jurisdictions. Generally, exclusive rights to the trademarks and service marks are held by Williams-Sonoma, Inc. and are used by our subsidiaries and franchisees under license. These marks include our core brand names as well as brand names for selected products and services. Our
core brand names, including “Williams Sonoma,” “Pottery Barn,” “pottery barn kids,” “Pottery Barn Teen,” “west elm,” “Williams Sonoma Home,” “Rejuvenation” and “Mark and Graham” are of material importance to us. Trademarks are generally valid as long as they are in use and/or their registrations are properly maintained, and they have not been found to have become generic. Trademark registrations can generally be renewed indefinitely so long as the marks are in use. We also own numerous patents, copyrights and trade dress rights for our products, proprietary designs, product packaging, catalogs, website designs and store designs, among other things, which are used by our subsidiaries and franchisees under license. As of January 29, 2023, we own or have applied to register approximately 370 patents in connection with certain product designs, inventions and proprietary technology. Patents in the U.S. are generally valid for 15 to 20 years as long as their registrations are properly maintained. In addition, we have registered and maintain numerous Internet domain names, including “williams-sonoma.com,” “potterybarn.com,” “potterybarnkids.com,” “potterybarnteen.com,” “westelm.com,” “wshome.com,” “williams-sonomainc.com,” “rejuvenation.com” and “markandgraham.com.” Collectively, the trademarks, patents, copyrights, trade dress rights, domain names, trade secrets and other intellectual property and proprietary technology that we hold are of material importance to us.
REGULATION
As a company with global operations, we are subject to the laws of the United States and multiple foreign jurisdictions in which we operate and the rules and regulations of various governing bodies, which may differ among jurisdictions. Compliance with these laws, rules and regulations has not had, and is not expected to have, a material effect on our capital expenditures, results of operations, or competitive position as compared to prior periods. Also see the section entitled “Risk Factors” in Part I, Item 1A of this Annual Report on Form 10-K.
AVAILABLE INFORMATION
We file annual reports on Form 10-K, quarterly reports on Form 10-Q, current reports on Form 8-K, proxy and information statements and amendments to reports filed or furnished pursuant to Sections 13(a), 14 and 15(d) of the Securities Exchange Act of 1934, as amended. The SEC maintains a website at www.sec.gov that contains reports, proxy and information statements and other information regarding Williams-Sonoma, Inc. and other companies that file materials electronically with the SEC. Our annual reports, Forms 10-K, Forms 10-Q, Forms 8-K and proxy and information statements, and any amendments thereto, are also available, free of charge, on our website at www.williams-sonomainc.com.
Investors and others should note that we announce material financial and operational information to our investors on our Investor Relations website (http://ir.williams-sonomainc.com), press releases, SEC filings and public conference calls and webcasts. Information on our website is not, and will not, be deemed a part of this report or incorporated into any other filings we make with the SEC.
Item 1A. RISK FACTORS
A description of the risks and uncertainties associated with our business is set forth below. You should carefully consider such risks and uncertainties, together with the other information contained in this report and in our other public filings before investing in our common stock. If any of such risks and uncertainties actually occurs, our business, financial condition or operating results could differ materially from the plans, projections and other forward-looking statements included in the section titled “Management’s Discussion and Analysis of Financial Condition and Results of Operations”, “Quantitative and Qualitative Disclosures about Market Risk” and elsewhere in this report and in our other public filings. In addition, if any of the following risks and uncertainties, or if any other risks and uncertainties, actually occurs, our business, financial condition or operating results could be harmed substantially, which could cause the market price of our stock to decline, perhaps significantly.
Risk Factor Summary
The following is a summary of the risks and uncertainties that could cause our business, financial condition or operating results to be harmed. We encourage you to carefully review the full risk factors contained in this report in their entirety for additional information regarding these risks and uncertainties.
Risks Related to Our Business
*•*We are unable to control many of the factors affecting consumer spending, and declines in consumer spending on home furnishings and kitchen products in general could reduce demand for our products.
*•*If we are unable to identify and analyze factors affecting our business, anticipate changing consumer preferences and buying trends, and manage our inventory and marketing spend commensurate with customer demand, our sales levels and operating results may decline.
*•*Our business and operating results may be harmed if we are unable to timely and effectively deliver merchandise to our stores and customers.
*•*Our failure to successfully manage our order-taking and fulfillment operations could have a negative impact on our business and operating results.
- We must protect and maintain our brand image and reputation.
*•*Our sales may be negatively impacted by increasing competition from companies with brands or products similar to ours.
*•*Our facilities and systems, as well as those of our vendors, are vulnerable to natural disasters, adverse weather conditions, technology issues and other unexpected events, any of which could result in an interruption in our business and harm our operating results.
*•*Our aspirations, goals and disclosures related to ESG matters expose us to numerous risks, including risks to our reputation and stock price.
*•*Our business is subject to evolving corporate governance and public disclosure regulations and expectations that could expose us to numerous risks.
*•*Our failure to successfully manage the costs and performance of our digital advertising might have a negative impact on our business
*•*If we are unable to effectively manage our e-commerce business and digital marketing efforts, our reputation and operating results may be harmed.
*•*Declines in our comparable brand revenues may harm our operating results and cause a decline in the market price of our common stock.
*•*Our business has been and may continue to be materially impacted by the COVID-19 pandemic, and the duration and extent to which this will impact our future results of operations and overall financial performance remains uncertain.
*•*Our failure to successfully manage the costs and performance of our digital advertising might have a negative impact on our business.
*•*If we are unable to successfully manage the complexities associated with an omni-channel and multi-brand business, we may suffer declines in our existing business and our ability to attract new business.
*•*A number of factors that affect our ability to successfully open new stores or close existing stores are beyond our control.
*•*Our inability or failure to adequately protect or enforce our intellectual property could negatively impact our business.
*•*We outsource certain aspects of our business to third-party vendors and are in the process of insourcing certain business functions from third-party vendors.
*•*If we fail to attract and retain key personnel, our business and operating results may be harmed.
*•*If we are unable to introduce new brands and brand extensions successfully, or to reposition or close existing brands, our business and operating results may be negatively impacted.
*•*We may be subject to legal proceedings that could result in costly litigation, require significant amounts of management time and result in the diversion of significant operational resources.
Risks Related to Technology
- We may be exposed to cybersecurity risks and costs associated with credit card fraud, identity theft and business interruption that could cause us to incur unexpected expenses and loss of revenue.
*•*We receive, process, store, use and share data, some of which contains personal information, which subjects us to complex and evolving governmental regulation and other legal obligations.
*•*We are undertaking certain systems changes that might disrupt our business operations.
Risks Related to Our Vendors and Our Global Operations
*•*Our dependence on foreign vendors and our increased global operations subject us to a variety of risks and uncertainties that could impact our operations and financial results.
*•*We depend on foreign vendors and third-party agents for timely and effective sourcing of our merchandise, and we may not be able to acquire products in appropriate quantities and at acceptable prices to meet our needs.
*•*If our vendors fail to adhere to our quality control standards and test protocols, we may delay a product launch or recall a product, which could damage our reputation and negatively affect our operations and financial results.
*•*Our efforts to expand globally may not be successful and could negatively impact the value of our brands.
*•*We have limited experience operating on a global basis and our failure to effectively manage the risks and challenges inherent in a global business could adversely affect our business, operating results and financial condition and growth prospects.
Risks Related to Taxes and Tariffs
- Any significant changes in tax, trade or other policies in the U.S. or other countries, including policies that restrict imports or increase import tariffs, could have a material adverse effect on our results of operations.
*•*Fluctuations in our tax obligations and effective tax rate may result in volatility of our operating results.
Risks Related to Our Financial Statements and Liquidity
*•*We may require funding from external sources, which may not be available at the levels we require or may cost more than we expect.
*•*Disruptions in the financial markets may adversely affect our liquidity and capital resources and our business.
*•*Our operating results may be harmed by unsuccessful management of our employment, occupancy and other operating costs, and the operation and growth of our business may be harmed if we are unable to attract qualified personnel.
General Risk Factors
*•*Our inability to obtain commercial insurance at acceptable rates or our failure to adequately reserve for self-insured exposures might increase our expenses and have a negative impact on our business.
*•*If our operating and financial performance in any given period does not meet the guidance that we have provided to the public or the expectations of our investors and analysts, our stock price may decline.
*•**A variety of fac
Showing the first 8K of 100K characters. Open the full section
Item 1B. UNRESOLVED STAFF COMMENTS
Item 2. PROPERTIES
We lease store locations, distribution and manufacturing facilities, corporate facilities and customer care centers for our U.S. and foreign operations for original terms generally ranging from 5 to 22 years. Certain leases contain renewal options for periods of up to 20 years.
For our store locations, our gross leased store space as of January 29, 2023 totaled approximately 5,962,000 square feet for 530 stores compared to approximately 6,004,000 square feet for 544 stores as of January 30, 2022.
Leased Properties
The following table summarizes the location and size of our leased facilities occupied by us as of January 29, 2023:
| Location | Occupied Square Footage (Approximate) | ||||
| Distribution and Manufacturing Facilities | |||||
| U.S. Operations | |||||
| New Jersey | 3,269,000 | ||||
| California | 3,150,000 | ||||
| Mississippi | 2,267,000 | ||||
| Texas | 1,682,000 | ||||
| Georgia | 1,537,000 | ||||
| Arizona | 1,200,000 | ||||
| Florida | 650,000 | ||||
| Tennessee | 603,000 | ||||
| North Carolina | 412,000 | ||||
| Ohio | 329,000 | ||||
| Massachusetts | 140,000 | ||||
| Colorado | 125,000 | ||||
| Oregon | 93,000 | ||||
| Foreign Operations | |||||
| Australia | 187,000 | ||||
| Corporate Facilities | |||||
| New York | 238,000 | ||||
| California | 94,000 | ||||
| Oregon | 61,000 | ||||
| Customer Care Centers | |||||
| Nevada | 36,000 | ||||
| Other | 25,000 |
In addition to the above leased properties, we enter into agreements for other offsite storage needs for our distribution facilities and our retail store locations, as necessary. As of January 29, 2023, the total leased space related to these properties was not material to us and is not included in the occupied square footage reported above.
Owned Properties
As of January 29, 2023, we owned 471,000 square feet of space, primarily in California, for our corporate headquarters and certain data center operations.
We believe that all of our facilities are adequate for our current needs and that suitable additional or substitute space will be available in the future to replace our existing facilities, or to accommodate the expansion of our operations, if necessary.
Item 3. LEGAL PROCEEDINGS
We are involved in lawsuits, claims and proceedings incident to the ordinary course of our business. These disputes, which are not currently material, are increasing in number as our business expands and our company grows. We review the need for any loss contingency reserves and establish reserves when, in the opinion of management, it is probable that a matter would result in liability, and the amount can be reasonably estimated. In view of the inherent difficulty of predicting the outcome of these matters, it may not be possible to determine whether any loss is probable or to reasonably estimate the amount of the loss until the case is close to resolution, in which case no reserve is established until that time. Any claims against us, whether meritorious or not, could result in costly litigation, require significant amounts of management time and result in the diversion of significant operational resources. The results of these lawsuits, claims and proceedings cannot be predicted with certainty. However, we believe that the ultimate resolution of these current matters will not have a material adverse effect on our consolidated financial statements taken as a whole.
Item 4. MINE SAFETY DISCLOSURES
Item 5. MARKET FOR REGISTRANT’S COMMON EQUITY, RELATED STOCKHOLDER MATTERS AND ISSUER PURCHASES OF EQUITY SECURITIES
MARKET INFORMATION
Our common stock is traded on the New York Stock Exchange, or the NYSE, under the symbol WSM. The closing price of our common stock on the NYSE on March 19, 2023 was $116.86.
STOCKHOLDERS
The number of stockholders of record of our common stock as of March 19, 2023 was 286. This number excludes stockholders whose stock is held in nominee or street name by brokers.
DIVIDENDS
While we have historically paid dividends to holders of our common stock on a quarterly basis, the declaration and payment of future dividends will depend on many factors, including, but not limited to, our earnings, financial condition, business development needs and regulatory considerations, and are at the discretion of our Board of Directors.
PERFORMANCE GRAPH
This graph compares the cumulative total stockholder return for our common stock with those of the NYSE Composite Index and S&P Retailing, our peer group index. The cumulative total return listed below assumed an initial investment of $100 and reinvestment of dividends. The graph shows historical stock price performance, including reinvestment of dividends, and is not necessarily indicative of future performance.
COMPARISON OF FIVE YEAR CUMULATIVE TOTAL RETURN*
Among Williams-Sonoma, Inc., the NYSE Composite Index,
and S&P Retailing
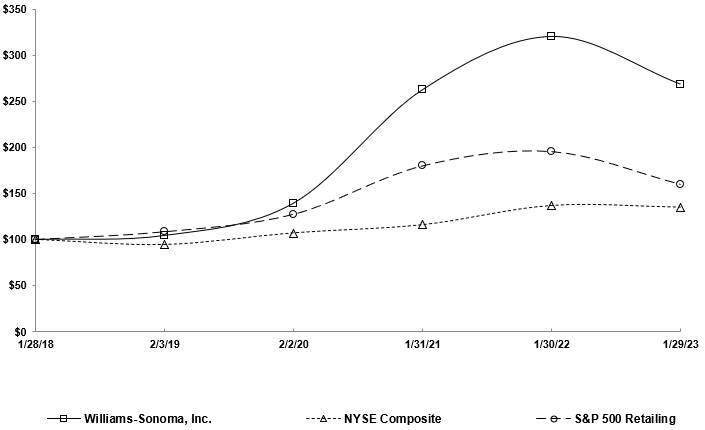
*$100 invested on January 28, 2018 in stock or index, including reinvestment of dividends. Fiscal year ended January 29, 2023.
| 1/28/18 | 2/3/19 | 2/2/20 | 1/31/21 | 1/30/22 | 1/29/23 | |||||||||||||||||||||||||||||||||
| Williams-Sonoma, Inc. | $100.00 | $104.33 | $139.37 | $262.59 | $320.43 | $268.67 | ||||||||||||||||||||||||||||||||
| NYSE Composite Index | $100.00 | $94.38 | $107.18 | $116.13 | $137.22 | $135.37 | ||||||||||||||||||||||||||||||||
| S&P Retailing | $100.00 | $108.42 | $127.45 | $180.19 | $195.77 | $160.10 |
Notes:
A.The lines represent monthly index levels derived from compounded daily returns that include all dividends.
B.The indices are re-weighted daily, using the market capitalization on the previous trading day.
C.If the monthly interval, based on the fiscal year-end, is not a trading day, the preceding trading day is used.
STOCK REPURCHASE PROGRAM
During fiscal 2022, we repurchased 6,423,643 shares of our common stock at an average cost of $137.00 per share and a total cost of $880.0 million under our $1.5 billion stock repurchase program approved in March 2022. As of January 29, 2023, there was $690.0 million remaining under our current stock repurchase program. In March 2023, our Board of Directors authorized a new stock repurchase program for $1 billion, which replaced our existing program.
The following table summarizes our repurchases of shares of our common stock during the fourth quarter of fiscal 2022 under our stock repurchase program:
| Fiscal period | Total Number of Shares Purchased1 | Average Price Paid Per Share | Total Number of Shares Purchased as Part of a Publicly Announced Program1 | Maximum Dollar Value of Shares That May Yet Be Purchased Under the Program | ||||||||||||||||||||||
| October 31, 2022 – November 27, 2022 | — | — | — | $ | 729,044,000 | |||||||||||||||||||||
| November 28, 2022 – December 25, 2022 | 341,935 | $ | 114.30 | 341,935 | $ | 689,962,000 | ||||||||||||||||||||
| December 26, 2022 – January 29, 2023 | — | — | — | $ | 689,962,000 | |||||||||||||||||||||
| Total | 341,935 | $ | 114.30 | 341,935 | $ | 689,962,000 |
1**Excludes shares withheld for employee taxes upon vesting of stock-based awards
Stock repurchases under our program may be made through open market and privately negotiated transactions at times and in such amounts as management deems appropriate. The timing and actual number of shares repurchased will depend on a variety of factors including price, corporate and regulatory requirements, capital availability and other market conditions. The stock repurchase program does not have an expiration date and may be limited or terminated at any time without prior notice.
Item 6. [RESERVED]
Item 7. MANAGEMENT’S DISCUSSION AND ANALYSIS OF FINANCIAL CONDITION AND RESULTS OF OPERATIONS
The following discussion and analysis of our financial condition, results of operations, and liquidity and capital resources for the 52 weeks ended January 29, 2023 (“fiscal 2022”), and the 52 weeks ended January 30, 2022 (“fiscal 2021”) should be read in conjunction with our Consolidated Financial Statements and notes thereto. All explanations of changes in operational results are discussed in order of magnitude.
A discussion and analysis of our financial condition, results of operations, and liquidity and capital resources for the 52 weeks ended January 30, 2022 (“fiscal 2021”), compared to the 52 weeks ended January 31, 2021 (“fiscal 2020”), can be found under Item 7 in our Annual Report on Form 10-K for fiscal 2021, filed with the SEC on March 28, 2022, which is available on the SEC’s website at www.sec.gov and under the Financial Reports section of our Investor Relations website.
OVERVIEW
Williams-Sonoma, Inc. is a specialty retailer of high-quality sustainable products for the home. Our products, representing distinct merchandise strategies — Williams Sonoma, Pottery Barn, Pottery Barn Kids, Pottery Barn Teen, West Elm, Williams Sonoma Home, Rejuvenation, and Mark and Graham — are marketed through e-commerce websites, direct-mail catalogs and retail stores. These brands are also part of The Key Rewards, our loyalty and credit card program that offers members exclusive benefits across the Williams-Sonoma family of brands. We operate in the U.S., Puerto Rico, Canada, Australia and the United Kingdom, offer international shipping to customers worldwide, and have unaffiliated franchisees that operate stores in the Middle East, the Philippines, Mexico, South Korea and India, as well as e-commerce websites in certain locations. We are also proud to be a leader in our industry with our Environmental, Social and Governance (“ESG”) efforts.
During fiscal 2021 and continuing through fiscal 2022, global supply chain disruptions, including COVID-19 related factory closures and increased port congestion, caused delays in inventory receipts and backorder delays, increased raw material costs, and higher shipping-related charges. We expect the impact of higher product costs, ocean freight, detention and demurrage to continue into fiscal 2023, which could negatively impact our business.
Fiscal 2022 Financial Results
Net revenues in fiscal 2022 increased $428.5 million, or 5.2%, with company comparable brand revenue ("company comp") growth of 6.5%. This was driven by strong order fulfillment and growth initiatives. On a two-year basis, company comp growth was 28.5%. Pottery Barn, our largest brand, delivered 14.9% comparable brand revenue ("brand comp") growth driven by our growth initiatives such as our accessible home, apartment and our market-place assortment. On a 3-year basis, Pottery Barn delivered 54.0% brand comp growth. In West Elm, brand comp growth was 2.5% with strong operating margins, on top of 33.1% brand comp growth the prior year, resulting in a 35.6% brand comp growth on a two-year basis. On a 3-year basis West Elm generated 50.8% brand comp growth. West Elm is our brand most affected by the current tough macroeconomic environment. Our Williams Sonoma brand had a brand comp decrease of 1.7% as we continued recovery in our in-stock inventory position and increased our focus on product exclusivity and innovation. On a 3-year basis, Williams Sonoma generated 32.6% brand comp growth. In our Pottery Barn Kids and Teen businesses, we saw brand comp growth of 0.4% driven by growth in baby and dorm as in-stock inventory improved. Finally, our emerging brands, Rejuvenation and Mark and Graham, combined, delivered 9.6% brand comp growth.
We ended the year with a cash balance of $367.3 million and generated positive operating cash flow of $1.1 billion. In addition to our strong cash balance, we also ended the year with no outstanding borrowings under our revolving line of credit. This strong liquidity position allowed us to fund the operations of the business by investing $354.1 million in capital expenditures during fiscal 2022, and to provide shareholder returns of approximately $1.1 billion in fiscal 2022 through share repurchases and dividends.
In fiscal 2022, diluted earnings per share was $16.32 (which included a $0.21 impact from the impairment of Aperture, a division of our Outward, Inc. subsidiary) versus $14.75 in fiscal 2021 (which included a $0.10 impact from acquisition-related expenses of Outward, Inc.).
Our three key differentiators - our in-house design, our digital-first channel strategy, and our values - continued to distinguish us as the world’s largest digital-first, design-led and sustainable home retailer. Our in-house design capabilities and vertically integrated sourcing organization allow us to deliver high-quality, sustainable products at competitive prices. Through our e-commerce platform, our in-house customer relationship management and data analytic teams optimize our digital spend and customer connections. Our stores serve as design centers and omni-fulfillment hubs.
Along with our key differentiators, our success and profitability are driven by our growth initiatives that are cross-brand and/or outside of our core brands. Our largest cross-brand growth driver is business-to-business, which positions us to furnish our customers everywhere - from restaurants to hotels, from football stadiums to office spaces.
Another successful growth initiative is our expansion into global markets. We have expanded our franchise business into India with an exclusive and differentiated product line, and our three stores and websites are outperforming our expectations in a market where we
see tremendous opportunity. In Canada, we relaunched our websites and saw improvements in conversion and average unit retail across brands.
Our emerging brands, Rejuvenation and Mark and Graham, have also provided incremental growth. These two brands service the white space needs of customers. At Rejuvenation, we’re expanding into remodel categories related to kitchen and bathroom, including vanities, cabinet hardware and custom wall lighting. At Mark and Graham, our high-quality gift and personalization business is resonating with our customers, and we saw outsized growth in the travel space including luggage and accessories.
As a digital-first company, we are in continuous pursuit of incremental improvement to our customers’ shopping journey online. We have improved several product-finding and purchasing experiences on our websites, including improved room styling, native registry applications, and the removal of friction in the checkout process. Additionally, we are focused on continued optimization and automation in our distribution centers and logistics networks to improve our service times.
On the sustainability front, we take great pride in the progress we are making within our impact initiatives and ESG leadership across the home furnishings industry. These commitments are reflected in the high quality, durable, sustainable products that we offer our customers, and continues to distinguish our company and our brands.
Looking Ahead to 2023
As we look forward to the year ahead, we believe our key differentiators – our in-house design, our digital-first channel strategy, and our values, our growth initiatives and our unique operating model will set us apart from our competition and allow us to drive long-term growth and profitability. However, the current uncertain macroeconomic environment with the weak housing market, layoffs, inflationary pressure and possible recession may impact our results. Additionally, we continue to experience increased costs across our global supply chain, including higher product costs, higher freight and incremental distribution center costs for additional space to support our overall growth. It is hard to predict with certainty when these supply chain and macroeconomic challenges will be fully resolved and we currently expect these challenges to negatively impact our results into fiscal 2023. In the back half of fiscal 2023, we believe these gross margin pressures may become tailwinds that support our profitability. Despite these challenges, we believe our key differentiators, our growth initiatives and our unique operating model leave us well-positioned to mitigate these challenges in both the short- and long- term. For information on risks, please see “Risk Factors” in Part I, Item 1A.
Results of Operations
NET REVENUES
Net revenues consist of sales of merchandise to our customers through our e-commerce websites, retail stores and direct-mail catalogs, and include shipping fees received from customers for delivery of merchandise to their homes. Our revenues also include sales to our business-to-business customers and franchisees, incentives received from credit card issuers in connection with our private label and co-branded credit cards, and breakage income related to our stored-value cards.
Net revenues in fiscal 2022 increased $428.5 million, or 5.2%, with company comp growth of 6.5%. This was driven by strong order fulfillment and growth initiatives. On a two-year basis, company comp increased 28.5%.
The following table summarizes our net revenues by brand for fiscal 2022 and fiscal 2021:
| (In thousands) | Fiscal 2022 1 | Fiscal 2021 1 | |||||||||
| Pottery Barn | $ | 3,555,521 | $ | 3,120,687 | |||||||
| West Elm | 2,278,131 | 2,234,548 | |||||||||
| Williams Sonoma | 1,286,651 | 1,345,851 | |||||||||
| Pottery Barn Kids and Teen | 1,132,937 | 1,139,893 | |||||||||
| Other 2 | 421,177 | 404,957 | |||||||||
| Total | $ | 8,674,417 | $ | 8,245,936 |
1**Includes business-to-business net revenues within each brand.
2**Primarily consists of net revenues from Rejuvenation, our international franchise operations and Mark and Graham.
Comparable Brand Revenue
Comparable brand revenue includes comparable e-commerce sales, including through our direct-mail catalog, and store sales, as well as shipping fees, sales returns and other discounts associated with current period sales. Comparable stores are defined as permanent stores where gross square footage did not change by more than 20% in the previous 12 months, and which have been open for at least 12 consecutive months without closure for more than seven days within the same fiscal month. Comparable stores that were temporarily closed during fiscal 2021 due to COVID-19 were not excluded from the comparable brand revenue calculation. Outlet comparable store net revenues are included in their respective brands. Business-to-business revenues are included in comparable brand revenue for each of our brands. Sales to our international franchisees are excluded from comparable brand revenue as their stores and e-commerce websites are not operated by us. Sales from certain operations are also excluded until such time that we believe those sales are meaningful to evaluating their performance. Additionally, comparable brand revenue growth for newer concepts is not separately disclosed until such time that we believe those sales are meaningful to evaluating the performance of the brand.
| Comparable brand revenue growth (decline) | Fiscal 2022 1 | Fiscal 2021 1 | |||||||||
| Pottery Barn | 14.9 | % | 23.9 | % | |||||||
| West Elm | 2.5 | 33.1 | |||||||||
| Williams Sonoma | (1.7) | 10.5 | |||||||||
| Pottery Barn Kids and Teen | 0.4 | 11.6 | |||||||||
| Total 2 | 6.5 | % | 22.0 | % |
1**Comparable brand revenue includes business-to-business revenues within each brand.
2**Total comparable brand revenue growth includes the results of Rejuvenation and Mark and Graham.
RETAIL STORE DATA
| Fiscal 2022 | Fiscal 2021 1 | ||||||||||
| Store count – beginning of year | 544 | 581 | |||||||||
| Store openings | 15 | 12 | |||||||||
| Store closings | (29) | (49) | |||||||||
| Store count – end of year | 530 | 544 | |||||||||
| Store selling square footage at year-end | 3,813,000 | 3,821,000 | |||||||||
| Store leased square footage (“LSF”) at year-end | 5,962,000 | 6,004,000 |
1 Retail store data for fiscal 2021 includes stores temporarily closed due to COVID-19. All stores were reopened as of the end of fiscal 2021.
| Fiscal 2022 | Fiscal 2021 | ||||||||||||||||||||||
| Store Count | Avg. LSF Per Store | Store Count | Avg. LSF Per Store | ||||||||||||||||||||
| Pottery Barn | 188 | 14,800 | 188 | 14,500 | |||||||||||||||||||
| Williams Sonoma | 165 | 6,800 | 174 | 6,800 | |||||||||||||||||||
| West Elm | 122 | 13,200 | 121 | 13,200 | |||||||||||||||||||
| Pottery Barn Kids | 46 | 7,700 | 52 | 7,700 | |||||||||||||||||||
| Rejuvenation | 9 | 8,000 | 9 | 9,400 | |||||||||||||||||||
| Total | 530 | 11,200 | 544 | 11,000 |
COST OF GOODS SOLD
| (In thousands) | Fiscal 2022 | % Net Revenues | Fiscal 2021 | % Net Revenues | |||||||||||||||||||
| Cost of goods sold 1 | $ | 4,996,684 | 57.6 | % | $ | 4,613,973 | 56.0 | % |
1**Includes occupancy expenses of $785.4 million and $728.0 million in fiscal 2022 and fiscal 2021, respectively.
Cost of goods sold includes cost of goods, occupancy expenses and shipping costs. Cost of goods consists of cost of merchandise, inbound freight expenses, freight-to-store expenses and other inventory related costs such as replacements, damages, obsolescence and shrinkage. Occupancy expenses consist of rent, other occupancy costs (including property taxes, common area maintenance and utilities) and depreciation. Shipping costs consist of third-party delivery services and shipping materials.
Our classification of expenses in cost of goods sold may not be comparable to other public companies, as we do not include non-occupancy-related costs associated with our distribution network in cost of goods sold. These costs, which include distribution network employment, third-party warehouse management and other distribution-related administrative expenses, are recorded in selling, general and administrative expenses ("SG&A").
Fiscal 2022 vs. Fiscal 2021
Cost of goods sold increased $382.7 million, or 8.3%, compared to fiscal 2021. Cost of goods sold as a percentage of net revenues increased to 57.6% from 56.0% in fiscal 2021. This increase was primarily driven by (i) higher input costs as we absorbed higher product costs, ocean freight, detention and demurrage due to the impact of supply chain disruption and global inflation pressures, (ii) higher outbound customer shipping costs due to out-of-market shipping and shipping multiple times for multi-unit orders, and (iii) higher occupancy costs resulting from incremental costs from our new distribution centers on the east and west coasts to support our long-term growth, which was partially offset by our retail store optimization initiatives.
SELLING, GENERAL AND ADMINISTRATIVE EXPENSES
| (In thousands) | Fiscal 2022 | % Net Revenues | Fiscal 2021 | % Net Revenues | |||||||||||||||||||
| Selling, general and administrative expenses | $ | 2,179,311 | 25.1 | % | $2,178,847 | 26.4 | % |
SG&A consists of non-occupancy-related costs associated with our retail stores, distribution and manufacturing facilities, customer care centers, supply chain operations (buying, receiving and inspection) and corporate administrative functions. These costs include employment, advertising, third-party credit card processing and other general expenses.
Fiscal 2022 vs. Fiscal 2021
SG&A increased $0.5 million and remained relatively flat compared to fiscal 2021. SG&A as a percentage of net revenues decreased to 25.1% from 26.4% for fiscal 2021. This decrease in rate was primarily driven by the leverage of employment costs and advertising expenses from overall cost discipline and adjusted incentive compensation commensurate with business performance.
INCOME TAXES
The effective income tax rate was 24.8% for fiscal 2022 and 22.4% for fiscal 2021. Compared to fiscal 2021, the increase in the tax rate is primarily due to less excess tax benefit from stock-based compensation in fiscal 2022, the return to provision difference between the two fiscal years, the expiration of the statutes of limitation related to uncertain tax positions in fiscal 2021 and the change in permanent reinvestment assertion on Canadian earnings in fiscal 2022.
Since the Tax Cuts and Jobs Act of 2017, we have elected not to provide for income taxes with respect to the earnings of Canada after fiscal 2017. In the second quarter of fiscal 2022, we assessed the overall forecasted cash needs and financial position of our foreign subsidiaries, and management decided to no longer assert its intent to indefinitely reinvest undistributed earnings in Canada. As a result of this change in assertion, we recorded $2.4 million of tax expense mainly related to Canadian withholding taxes.
The Inflation Reduction Act, enacted on August 16, 2022, includes a new 15% minimum tax on “adjusted financial statement income” beginning with the Company’s fiscal year 2023, and a new 1% excise tax on stock repurchases after December 31, 2022, which will be included in the acquisition cost of treasury stock recorded within stockholders' equity. While these tax law changes had no immediate effect in fiscal 2022 and are not expected to have a material adverse effect on our results of operations going forward, we will continue to evaluate its impact as further information becomes available.
LIQUIDITY AND CAPITAL RESOURCES
Material Cash Requirements
We are party to contractual obligations involving commitments to make payments to third parties in the future. Certain contractual obligations are reflected on our Consolidated Balance Sheet as of January 29, 2023, while others are considered future obligations. Our material cash requirements as of January 29, 2023 include the following contractual obligations and commitments arising in the normal course of business:
-
Our operating leases had fixed lease payment obligations, including imputed interest, of $1.7 billion, with $308.3 million payable within 12 months. See Note E to our Consolidated Financial Statements for amount outstanding as of January 29, 2023 related to operating leases.
-
Our purchase obligations consist primarily of open purchase orders to purchase inventory as well as commitments for products and services used in the normal course of business. As of January 29, 2023, our purchase obligations were approximately $981.0 million, with $910.0 million expected to be settled within 12 months.
In addition, we had $37.1 million of unrecognized tax benefits recorded in our accompanying Consolidated Balance Sheet as of January 29, 2023, for which we cannot make a reasonably reliable estimate of the amount and period of payment. See Note D to our Consolidated Financial Statements for information related to income taxes.
We are party to a variety of contractual agreements under which we may be obligated to indemnify the other party for certain matters. These contracts primarily relate to commercial matters, operating leases, trademarks, intellectual property and financial matters. Under these contracts, we may provide certain routine indemnifications relating to representations and warranties or personal injury matters. The terms of these indemnifications range in duration and may not be explicitly defined. Historically, we have not made significant payments for these indemnifications. We believe that if we were to incur a loss in any of these matters, the loss would not have a material effect on our financial condition or results of operations.
See Note I to our Consolidated Financial Statements for further information related to our commitments and contingencies.
Dividends
In fiscal 2022 and fiscal 2021, total cash dividends declared were approximately $216.3 million, or $3.12 per common share, and $199.4 million, or $2.60 per common share, respectively. In March 2023, our Board of Directors authorized a 15% increase in our quarterly cash dividend, from $0.78 to $0.90 per common share, subject to capital availability. Our quarterly cash dividend may be limited or terminated at any time.
Stock Repurchase Program
See section titled “Stock Repurchase Program” within Part II, Item 5 of this Annual Report on Form 10-K for further information.
Liquidity Outlook
We believe our cash on hand, cash flows from operations, and our available credit facilities will provide adequate liquidity for our business operations as well as capital expenditures, dividends, share repurchases, and other liquidity requirements associated with our business operations over the next 12 months. We are currently not aware of any other trends or demands, commitments, events or uncertainties that will result in, or that are reasonably likely to result in, our liquidity increasing or decreasing in any material way that will impact our capital needs during or beyond the next 12 months.
Sources of Liquidity
As of January 29, 2023, we held $367.3 million in cash and cash equivalents, the majority of which was held in interest-bearing demand deposit accounts and money market funds, and of which $81.2 million was held by our international subsidiaries. As is consistent within our industry, our cash balances are seasonal in nature, with the fourth quarter historically representing a significantly higher level of cash than other periods.
Throughout the fiscal year, we utilize our cash resources to build our inventory levels in preparation for our fourth quarter holiday sales. Our largest source of operating cash flows is cash collections from the sale of our merchandise throughout the year. In fiscal 2023, we plan to use our cash resources to fund our inventory and inventory-related purchases, employment related-costs, advertising and marketing initiatives, rental payments on our leases, stock repurchases and dividend payments, property and equipment purchases, and the payment of income taxes.
In addition to our cash balances on hand, we have a credit facility (the "Credit Facility") which provides for a $500 million unsecured revolving line of credit (the “Revolver”). Our Revolver may be used to borrow revolving loans or to request the issuance of letters of credit. We may, upon notice to the administrative agent, request existing or new lenders, at such lenders’ option, to increase the Revolver by up to $250 million to provide for a total of $750 million of unsecured revolving credit.
Currently, the interest rate applicable to the Revolver is variable and may be elected by us as: (i) the LIBOR plus an applicable margin based on our leverage ratio ranging from 0.91% to 1.775% or (ii) a base rate as defined in the Credit Facility, plus an applicable margin based on our leverage ratio ranging from 0% to 0.775%. However, as a result of the future cessation of LIBOR, our interest rate will change in fiscal 2023 in accordance with the Credit Facility. On the earliest of (i) the date that LIBOR rates permanently or indefinitely cease to be provided, (ii) June 30, 2023 or (iii) the early opt-in effective date which is determined by us, the replacement benchmark rate will be determined.
During fiscal 2022, we had no borrowings under our Revolver. Additionally, as of January 29, 2023, issued but undrawn standby letters of credit of $11.2 million were outstanding under our Revolver. The standby letters of credit were primarily issued to secure the liabilities associated with workers’ compensation and other insurance programs.
Our Credit Facility contains certain restrictive loan covenants, including, among others, a financial covenant requiring a maximum leverage ratio (funded debt adjusted for operating lease liabilities to earnings before interest, income tax, depreciation, amortization and rent expense), and covenants limiting our ability to incur indebtedness, grant liens, make acquisitions, merge or consolidate, and dispose of assets. As of January 29, 2023, we were in compliance with our financial covenants under our credit facilities and, based on our current projections, we expect to remain in compliance throughout the next 12 months.
Letter of Credit Facilities
We have three unsecured letter of credit reimbursement facilities for a total of $35 million. Our letter of credit facilities contain covenants that are consistent with our Credit Facility. Interest on unreimbursed amounts under our letter of credit facilities accrues at a base rate as defined in the credit facility, plus an applicable margin based on our leverage ratio. As of January 29, 2023, the aggregate amount outstanding under our letter of credit facilities was $0.5 million, which represents only a future commitment to fund inventory purchases to which we had not taken legal title. On August 19, 2022, we renewed all three of our letter of credit facilities on substantially similar terms. Two of the letter of credit facilities totaling $30 million mature on August 19, 2023, and the latest expiration date possible for future letters of credit issued under these facilities is January 16, 2024. One of the letter of credit facilities totaling $5 million matures on September 30, 2026, which is also the latest expiration date possible for future letters of credit issued under the facility.
Cash Flows from Operating Activities
For fiscal 2022, net cash provided by operating activities was $1.1 billion compared to $1.4 billion in fiscal 2021. For fiscal 2022, net cash provided by operating activities was primarily attributable to net earnings adjusted for non-cash items, partially offset by higher spending on merchandise inventories as a result of our efforts to improve our in-stock position as well as accounts payable. Net cash provided by operating activities compared to fiscal 2021 decreased primarily due to decreases in accounts payable and accrued expenses and other liabilities.
Cash Flows from Investing Activities
For fiscal 2022, net cash used in investing activities was $354.0 million compared to $226.2 million in fiscal 2021 and was primarily attributable to purchases of property and equipment related to technology and supply chain enhancements.
Cash Flows from Financing Activities
For fiscal 2022, net cash used in financing activities was $1.2 billion compared to $1.5 billion in fiscal 2021 and was primarily attributable to the repurchases of common stock and payment of dividends. Net cash used in financing activities for fiscal 2022 decreased compared to fiscal 2021 primarily due to the repayment of debt in the fiscal 2021 that did not recur in fiscal 2022.
IMPACT OF INFLATION
While it is difficult to accurately measure the impact of inflation due to the imprecise nature of the estimates required, we have experienced varying levels of inflation, resulting in part from various supply chain disruptions, increased shipping and transportation costs, increased product costs, increased labor costs in the supply chain and other disruptions caused by the COVID‐19 pandemic and the uncertain economic environment. Global trends, including inflationary pressures, are weakening customer sentiment, negatively impacting consumer spending behavior and slowing down consumer demand for our products. However, our unique operating model and pricing power helped mitigate these increased costs during fiscal 2022. We cannot be assured that our results of operations and financial condition will not be materially impacted by inflation in the future. For information on risks, please see “Risk Factors” in Part I, Item 1A.
CRITICAL ACCOUNTING ESTIMATES
Our Consolidated Financial Statements requires us to make estimates that affect the reported amounts of assets, liabilities, revenues and expenses and related disclosures of contingent assets and liabilities. These estimates are evaluated on an ongoing basis and are based on historical experience and various other factors that we believe to be reasonable under the circumstances. Actual results could differ from these estimates.
Merchandise Inventories
The significant estimates used in our inventory valuation are obsolescence (including excess and slow-moving inventory and lower of cost or net realizable value reserves) and estimates of inventory shrinkage. We reserve for obsolescence based on historical trends of inventory sold below cost and specific identification.
The reserves for shrinkage are recorded throughout the year based on historical shrinkage results, cycle count results within our distribution centers, expectations of future shrinkage and current inventory levels, and are therefore subject to uncertainty. Actual shrinkage is recorded at year-end based on the results of our cycle counts and year end physical inventory counts, and can vary from our estimates recorded throughout the year due to such factors as changes in operations, the mix of our inventory (which ranges from large furniture to small tabletop items) and execution against loss prevention initiatives in our stores, distribution facilities and off-site storage locations, and with our third-party warehouse and transportation providers. Accordingly, there is no material shrinkage reserve at year-end. Historically, actual shrinkage has not differed materially from our estimates.
Our obsolescence and shrinkage reserve calculations contain estimates that require management to make assumptions and to apply judgment regarding a number of factors, including market conditions, the selling environment, historical results and current inventory trends. We have made no material changes to our assumptions included in the calculations of the obsolescence and shrinkage reserves throughout the year. In addition, we do not believe a 10% change in our inventory reserves would have a material effect on our net earnings. As of January 29, 2023 and January 30, 2022, our inventory obsolescence reserves were $24.7 million and $14.0 million, respectively.
Long-lived Assets
Property and equipment is stated at cost. Depreciation is computed using the straight-line method over the estimated useful lives of the assets.
We review the carrying value of all long-lived assets for impairment, primarily at an individual store level, whenever events or changes in circumstances indicate that the carrying value of an asset or asset group may not be recoverable. Our impairment analyses determine whether projected cash flows from operations are sufficient to recover the carrying value of these assets. The asset group is comprised of both property and equipment and operating lease right-of-use assets. Impairment may result when the carrying value of the asset or asset group exceeds the estimated undiscounted future cash flows over its remaining useful life. Our estimate of
undiscounted future cash flows over the lease term is based upon our experience, the historical operations and estimates of future profitability and economic conditions. The estimates of future profitability and economic conditions require estimating such factors as sales growth, gross margin, employment costs, lease escalations, inflation and the overall economics of the retail industry, and are therefore subject to variability and difficult to predict. For right-of-use assets, we determine the fair value of the assets by using estimated market rental rates. These estimates can be affected by factors such as future results, real estate supply and demand, closure plans, and economic conditions that can be difficult to predict. Actual future results may differ from those estimates. If a long-lived asset is found to be impaired, the amount recognized for impairment is equal to the excess of the asset or asset group’s net carrying value over its estimated fair value.
During fiscal 2022, we recognized impairment charges of $3.3 million related to the impairment of property and equipment and $2.6 million related to the impairment of operating lease right-of-use assets, due to lower projected revenues and fair market rental values resulting from underperforming stores in Australia, and we also recognized impairment charges of $9.7 million related to the impairment of property and equipment associated with Aperture, a division of our Outward, Inc. subsidiary, due to these assets not being recoverable in light of projected future cash flows, all of which is recognized within SG&A. During fiscal 2021, no impairment charges were recognized. During fiscal 2020, we recognized asset impairment charges of approximately $19.2 million related to property and equipment and $7.9 million related to right-of use assets for our retail stores, which is recognized within SG&A.
Leases
The significant estimates used in accounting for our leases relate to the incremental borrowing rate used in the present value of lease obligations calculation. As our leases generally do not provide information about the rate implicit in the lease, we utilize an estimated incremental borrowing rate to calculate the present value of our future lease obligations. The incremental borrowing rate represents the rate of interest we would have to pay on a collateralized borrowing, for an amount equal to the lease payments, over a similar term and in a similar economic environment. We use judgment in determining our incremental borrowing rate, which is applied to each lease based on the lease term. A 50 basis point increase or decrease in the incremental borrowing rate would not have a material impact on the value of our new or remeasured right-of-use assets and lease liabilities. As of fiscal 2022 and fiscal 2021, our incremental borrowing rates were 3.4% and 3.2%, respectively. Many of our leases contain renewal and early termination options. The option periods are generally not included in the lease term used to measure our lease liabilities and right-of-use assets upon commencement, as we do not believe the exercise of these options to be reasonably certain. We remeasure the lease liability and right-of-use asset when we are reasonably certain to exercise a renewal or an early termination option. We use judgment in determining lease classification, including our determination of the economic life and the fair market value of the identified asset. The fair market value of the identified asset is generally estimated based on comparable market data provided by third-party sources.
Income Taxes
We record reserves for our estimates of the additional income tax liability that is more likely than not to result from the ultimate resolution of foreign and domestic tax examinations. The results of these examinations and negotiations with taxing authorities may affect the ultimate settlement of these issues. We review and update the estimates used in the accrual for uncertain tax positions as more definitive information becomes available from taxing authorities, upon completion of tax examination, upon expiration of statutes of limitation, or upon occurrence of other events. As of January 29, 2023, we had $37.1 million of gross unrecognized tax benefits, of which $31.0 million would, if recognized, affect the effective tax rate. Additionally, we accrue interest and penalties related to these unrecognized tax benefits in the provision for income taxes. As of January 29, 2023 and January 30, 2022, our accruals for the payment of interest and penalties totaled $6.1 million and $5.7 million, respectively. Due to the potential resolution of tax issues, it is reasonably possible that the balance of our gross unrecognized tax benefits could decrease within the next twelve months by a range of $0 to $6.2 million.
In order to compute income tax on an interim basis, we estimate what our effective tax rate will be for the full fiscal year and adjust these estimates throughout the year as necessary. Adjustments to our income tax provision due to changes in our estimated effective tax rate are recorded in the interim period in which the change occurs. The tax expense (or benefit) related to items other than ordinary income is individually computed and recognized when the items occur. Our effective tax rate in a given financial statement period may be materially impacted by changes in the mix and level of our earnings in various taxing jurisdictions or changes in tax law. Our effective tax rates for fiscal 2022 and fiscal 2021 were 24.8% and 22.4%, respectively.
Item 7A. QUANTITATIVE AND QUALITATIVE DISCLOSURES ABOUT MARKET RISK
We are exposed to market risks, which include significant deterioration of the U.S. and foreign markets, changes in U.S. interest rates, foreign currency exchange rate fluctuations and the effects of economic uncertainty which may affect the prices we pay our vendors in the foreign countries in which we do business. We do not engage in financial transactions for trading or speculative purposes.
Interest Rate Risk
Our Revolver has a variable interest rate which, when drawn upon, subjects us to risks associated with changes in that interest rate. During fiscal 2022, we had no borrowings under the Revolver.
In addition, we have fixed and variable income investments consisting of short-term investments classified as cash and cash equivalents, which are also affected by changes in market interest rates. As of January 29, 2023, our investments, made primarily in interest bearing demand deposit accounts and money market funds, are stated at cost and approximate their fair values.
Foreign Currency Risks
We purchase the majority of our inventory from vendors outside of the U.S. in transactions that are primarily denominated in U.S. dollars and, as such, any foreign currency impact related to these international purchase transactions was not significant to us during fiscal 2022 or fiscal 2021. Since we pay for the majority of our international purchases in U.S. dollars, however, a decline in the U.S. dollar relative to other foreign currencies would subject us to risks associated with increased purchasing costs from our vendors in their effort to offset any lost profits associated with any currency devaluation. We cannot predict with certainty the effect these increased costs may have on our financial statements or results of operations.
In addition, our businesses in Canada, Australia and the United Kingdom, and our operations throughout Asia and Europe, expose us to market risk associated with foreign currency exchange rate fluctuations. Substantially all of our purchases and sales are denominated in U.S. dollars, which limits our exposure to this risk. However, some of our foreign operations have a functional currency other than the U.S. dollar. While the impact of foreign currency exchange rate fluctuations was not material to us in fiscal 2022, we have continued to see volatility in the exchange rates in the countries in which we do business. Additionally, the effect of a hypothetical 10% change in foreign currency exchange rates applicable to our business would not have a material impact on our historical or current consolidated financial statements. As we continue to expand globally, the foreign currency exchange risk related to our foreign operations may increase. To mitigate this risk, we hedge a portion of our foreign currency exposure with foreign currency forward contracts in accordance with our risk management policies (see Note L to our Consolidated Financial Statements).
Item 8. FINANCIAL STATEMENTS AND SUPPLEMENTARY DATA
Williams-Sonoma, Inc.
Consolidated Statements of Earnings
| For the Fiscal Year Ended | |||||||||||||||||
| (In thousands, except per share amounts) | January 29, 2023 | January 30, 2022 | January 31, 2021 | ||||||||||||||
| Net revenues | $ | 8,674,417 | $ | 8,245,936 | $ | 6,783,189 | |||||||||||
| Cost of goods sold | 4,996,684 | 4,613,973 | 4,146,920 | ||||||||||||||
| Gross profit | 3,677,733 | 3,631,963 | 2,636,269 | ||||||||||||||
| Selling, general and administrative expenses | 2,179,311 | 2,178,847 | 1,725,572 | ||||||||||||||
| Operating income | 1,498,422 | 1,453,116 | 910,697 | ||||||||||||||
| Interest (income) expense, net | (2,260) | 1,865 | 16,231 | ||||||||||||||
| Earnings before income taxes | 1,500,682 | 1,451,251 | 894,466 | ||||||||||||||
| Income taxes | 372,778 | 324,914 | 213,752 | ||||||||||||||
| Net earnings | $ | 1,127,904 | $ | 1,126,337 | $ | 680,714 | |||||||||||
| Basic earnings per share | $ | 16.58 | $ | 15.17 | $ | 8.81 | |||||||||||
| Diluted earnings per share | $ | 16.32 | $ | 14.75 | $ | 8.61 | |||||||||||
| Shares used in calculation of earnings per share: | |||||||||||||||||
| Basic | 68,021 | 74,272 | 77,260 | ||||||||||||||
| Diluted | 69,100 | 76,354 | 79,055 |
See Notes to Consolidated Financial Statements.
Williams-Sonoma, Inc.
Consolidated Statements of Comprehensive Income
| For the Fiscal Year Ended | |||||||||||||||||
| (In thousands) | January 29, 2023 | January 30, 2022 | January 31, 2021 | ||||||||||||||
| Net earnings | $ | 1,127,904 | $ | 1,126,337 | $ | 680,714 | |||||||||||
| Other comprehensive income (loss): | |||||||||||||||||
| Foreign currency translation adjustments | (3,572) | (4,488) | 8,195 | ||||||||||||||
| Change in fair value of derivative financial instruments, net of tax (tax benefit) of $329, $(91) and $(113) | 932 | (247) | (315) | ||||||||||||||
| Reclassification adjustment for realized (gain) loss on derivative financial instruments, net of tax (tax benefit) of $121, $(371) and $149 | (341) | 1,024 | (410) | ||||||||||||||
| Comprehensive income | $ | 1,124,923 | $ | 1,122,626 | $ | 688,184 |
See Notes to Consolidated Financial Statements.
Williams-Sonoma, Inc.
Consolidated Balance Sheets
| As of | |||||||||||
| (In thousands, except per share amounts) | January 29, 2023 | January 30, 2022 | |||||||||
| ASSETS | |||||||||||
| Current assets | |||||||||||
| Cash and cash equivalents | $ | 367,344 | $ | 850,338 | |||||||
| Accounts receivable, net | 115,685 | 131,683 | |||||||||
| Merchandise inventories, net | 1,456,123 | 1,246,372 | |||||||||
| Prepaid expenses | 64,961 | 69,252 | |||||||||
| Other current assets | 31,967 | 26,249 | |||||||||
| Total current assets | 2,036,080 | 2,323,894 | |||||||||
| Property and equipment, net | 1,065,381 | 920,773 | |||||||||
| Operating lease right-of-use assets | 1,286,452 | 1,132,764 | |||||||||
| Deferred income taxes, net | 81,389 | 56,585 | |||||||||
| Goodwill | 77,307 | 85,354 | |||||||||
| Other long-term assets, net | 116,407 | 106,250 | |||||||||
| Total assets | $ | 4,663,016 | $ | 4,625,620 | |||||||
| LIABILITIES AND STOCKHOLDERS’ EQUITY | |||||||||||
| Current liabilities | |||||||||||
| Accounts payable | $ | 508,321 | $ | 612,512 | |||||||
| Accrued expenses | 247,594 | 319,924 | |||||||||
| Gift card and other deferred revenue | 479,229 | 447,770 | |||||||||
| Income taxes payable | 61,204 | 79,554 | |||||||||
| Operating lease liabilities | 231,965 | 217,409 | |||||||||
| Other current liabilities | 108,138 | 94,517 | |||||||||
| Total current liabilities | 1,636,451 | 1,771,686 | |||||||||
| Deferred lease incentives | 10,027 | 16,360 | |||||||||
| Long-term operating lease liabilities | 1,211,693 | 1,066,839 | |||||||||
| Other long-term liabilities | 103,794 | 106,528 | |||||||||
| Total liabilities | 2,961,965 | 2,961,413 | |||||||||
| Commitments and contingencies – See Note I | |||||||||||
| Stockholders’ equity | |||||||||||
| Preferred stock: $0.01 par value; 7,500 shares authorized; none issued | — | — | |||||||||
| Common stock: $0.01 par value; 253,125 shares authorized; 66,226 and 71,982 shares issued and outstanding at January 29, 2023 and January 30, 2022, respectively | 663 | 720 | |||||||||
| Additional paid-in capital | 573,117 | 600,942 | |||||||||
| Retained earnings | 1,141,819 | 1,074,084 | |||||||||
| Accumulated other comprehensive loss | (13,809) | (10,828) | |||||||||
| Treasury stock, at cost: 1 and 4 shares as of January 29, 2023 and January 30, 2022, respectively | (739) | (711) | |||||||||
| Total stockholders’ equity | 1,701,051 | 1,664,207 | |||||||||
| Total liabilities and stockholders’ equity | $ | 4,663,016 | $ | 4,625,620 |
See Notes to Consolidated Financial Statements.
Williams-Sonoma, Inc.
Consolidated Statements of Stockholders’ Equity
| Common Stock | Additional Paid-in Capital | Retained Earnings | Accumulated Other Comprehensive Income (Loss) | Treasury Stock | Total Stockholders’ Equity | ||||||||||||||||||||||||||||||||||||
| (In thousands) | Shares | Amount | |||||||||||||||||||||||||||||||||||||||
| Balance at February 2, 2020 | 77,137 | $ | 772 | $ | 605,822 | $ | 644,794 | $ |
Showing the first 8K of 104K characters. Open the full section
Item 9. CHANGES IN AND DISAGREEMENTS WITH ACCOUNTANTS ON ACCOUNTING AND FINANCIAL DISCLOSURE
None.
Item 9A. CONTROLS AND PROCEDURES
Evaluation of Disclosure Controls and Procedures
As of January 29, 2023, an evaluation was performed by management, with the participation of our Chief Executive Officer (“CEO”) and our Chief Financial Officer (“CFO”), of the effectiveness of our disclosure controls and procedures. Based on that evaluation, our management, including our CEO and CFO, concluded that our disclosure controls and procedures are effective to ensure that information we are required to disclose in reports that we file or submit under the Securities Exchange Act of 1934, as amended, is accumulated and communicated to our management, including our CEO and CFO, as appropriate, to allow for timely discussions regarding required disclosures, and that such information is recorded, processed, summarized and reported within the time periods specified in the rules and forms of the SEC.
Management’s Report on Internal Control Over Financial Reporting
Our management is responsible for establishing and maintaining adequate internal control over the Company’s financial reporting. These internal controls are designed to provide reasonable assurance that the reported information is fairly presented, that disclosures are adequate and that the judgments inherent in the preparation of financial statements are reasonable. There are inherent limitations in the effectiveness of any internal control, including the possibility of human error and the circumvention or overriding of controls. Further, because of changes in conditions, the effectiveness of any internal control may vary over time.
Our management assessed the effectiveness of the Company’s internal control over financial reporting as of January 29, 2023. In making this assessment, we used the criteria set forth by the Committee of Sponsoring Organizations of the Treadway Commission (COSO) in Internal Control-Integrated Framework (2013). Based on our assessment using those criteria, our management concluded that, as of January 29, 2023, our internal control over financial reporting is effective.
Our independent registered public accounting firm audited the Consolidated Financial Statements included in this Annual Report on Form 10-K and the Company’s internal control over financial reporting. Their audit report appears on pages 56 through 57 of this Annual Report on Form 10-K.
Changes in Internal Control Over Financial Reporting
There were no significant changes in our internal control over financial reporting that occurred during the fourth quarter of fiscal 2022, that materially affected, or are reasonably likely to materially affect, our internal control over financial reporting.
Item 9B. OTHER INFORMATION
None.
Item 9C. DISCLOSURE REGARDING FOREIGN JURISDICTIONS THAT PREVENT INSPECTIONS
Item 10. DIRECTORS, EXECUTIVE OFFICERS AND CORPORATE GOVERNANCE
Information required by this Item is incorporated by reference herein to information under the headings “Election of Directors,” “Information Concerning Executive Officers,” “Audit and Finance Committee Report,” “Corporate Governance — Corporate Governance Guidelines and Code of Business Conduct and Ethics,” and “Corporate Governance — Audit and Finance Committee” in our Proxy Statement for the 2023 Annual Meeting of Stockholders, which will be filed with the SEC no later than 120 days after January 29, 2023 (the “Proxy Statement”). With regard to the information required by this item regarding compliance with Section 16(a) of the Exchange Act, we will provide disclosure of delinquent Section 16(a) reports, if any, in our Proxy Statement, and such disclosure, if any, is incorporated herein by reference.
Item 11. EXECUTIVE COMPENSATION
Information required by this Item is incorporated by reference herein to information under the headings “Corporate Governance — Compensation Committee,” “Corporate Governance — Director Compensation,” and “Executive Compensation” (excluding the information under the subheading “Pay Versus Performance”) in our Proxy Statement.
Item 12. SECURITY OWNERSHIP OF CERTAIN BENEFICIAL OWNERS AND MANAGEMENT AND RELATED STOCKHOLDER MATTERS
Information required by this Item is incorporated by reference herein to information under the heading “Security Ownership of Principal Stockholders and Management” in our Proxy Statement.
Item 13. CERTAIN RELATIONSHIPS AND RELATED TRANSACTIONS, AND DIRECTOR INDEPENDENCE
Information required by this Item is incorporated by reference herein to information under the heading “Certain Relationships and Related Transactions” in our Proxy Statement.
Item 14. PRINCIPAL ACCOUNTANT FEES AND SERVICES
Information about aggregate fees billed to us by our principal accountant, Deloitte & Touche LLP (PCAOB ID #34), is incorporated by reference herein to information under the headings “Audit and Finance Committee Report” and “Proposal 3 — Ratification of Selection of Independent Registered Public Accounting Firm — Deloitte Fees and Services” in our Proxy Statement.
PART IV
Item 15. EXHIBITS AND FINANCIAL STATEMENT SCHEDULES
| (a) | (1) | Financial Statements: | |||||||||
| The following Consolidated Financial Statements of Williams-Sonoma, Inc. and subsidiaries and the related notes are filed as part of this Annual Report on Form 10-K pursuant to Item 8: | |||||||||||
| PAGE | |||||||||||
| Consolidated Statements of Earnings | 37 | ||||||||||
| Consolidated Statements of Comprehensive Income | 37 | ||||||||||
| Consolidated Balance Sheets | 38 | ||||||||||
| Consolidated Statements of Stockholders’ Equity | 39 | ||||||||||
| Consolidated Statements of Cash Flows | 40 | ||||||||||
| Notes to Consolidated Financial Statements | 41 | ||||||||||
| Report of Independent Registered Public Accounting Firm | 56 | ||||||||||
| (a) | (2) | Financial Statement Schedules: Schedules have been omitted because they are not required, are not applicable, or because the required information, where material, is included in the financial statements, notes, or supplementary financial information. | |||||||||
| (a) | (3) | Exhibits: The exhibits listed in the below Exhibit Index are filed or incorporated by reference as part of this Annual Report on Form 10-K | |||||||||
| (b) | Exhibits: The exhibits listed in the below Exhibit Index are filed or incorporated by reference as part of this Annual Report on Form 10-K | ||||||||||
| (c) | Financial Statement Schedules: Schedules have been omitted because they are not required or are not applicable. |
Exhibit Index
| CERTIFICATIONS | |||||
| 31.1* | Certification of Chief Executive Officer, pursuant to Rule 13a-14(a) and Rule 15d-14(a) of the Securities Exchange Act, as amended | ||||
| 31.2* | Certification of Chief Financial Officer, pursuant to Rule 13a-14(a) and Rule 15d-14(a) of the Securities Exchange Act, as amended | ||||
| 32.1* | Certification of Chief Executive Officer, pursuant to 18 U.S.C. Section 1350, as adopted pursuant to Section 906 of the Sarbanes-Oxley Act of 2002 | ||||
| 32.2* | Certification of Chief Financial Officer, pursuant to 18 U.S.C. Section 1350, as adopted pursuant to Section 906 of the Sarbanes-Oxley Act of 2002 | ||||
| 101* | The following financial statements from the Company’s Annual Report on Form 10-K for the fiscal year ended January 29, 2023, formatted in Inline XBRL: (i) Consolidated Statements of Earnings, (ii) Consolidated Statements of Comprehensive Income, (iii) Consolidated Balance Sheets, (iv) Consolidated Statements of Stockholders’ Equity, (v) Consolidated Statements of Cash Flows and (vi) Notes to Consolidated Financial Statements, tagged as blocks of text and including detailed tags | ||||
| 104* | Cover Page Interactive Data File (formatted as Inline XBRL and contained in the Interactive Data Files submitted under Exhibit 101). |
| * | Filed herewith. |
| + | Indicates a management contract or compensatory plan or arrangement. |
Item 16. FORM 10-K SUMMARY
None.
SIGNATURES
Pursuant to the requirements of Section 13 or 15(d) of the Securities Exchange Act of 1934, as amended, the registrant has duly caused this report to be signed on its behalf by the undersigned, thereunto duly authorized.
| WILLIAMS-SONOMA, INC. | |||||||||||
| Date: March 24, 2023 | By | /S/ LAURA ALBER | |||||||||
| Laura Alber | |||||||||||
| Chief Executive Officer |
Pursuant to the requirements of the Securities Exchange Act of 1934, as amended, this report has been signed below by the following persons on behalf of the registrant and in the capacities and on the dates indicated.
| Date: March 24, 2023 | /s/ SCOTT DAHNKE | |||||||
| Scott Dahnke | ||||||||
| Chairman of the Board of Directors | ||||||||
| Date: March 24, 2023 | /s/ LAURA ALBER | |||||||
| Laura Alber | ||||||||
| Chief Executive Officer and Director | ||||||||
| (principal executive officer) | ||||||||
| Date: March 24, 2023 | /s/ JEFFREY E. HOWIE | |||||||
| Jeffrey E. Howie | ||||||||
| Chief Financial Officer | ||||||||
| (principal financial officer) | ||||||||
| Date: March 24, 2023 | /s/ JEREMY BROOKS | |||||||
| Jeremy Brooks | ||||||||
| Chief Accounting Officer | ||||||||
| (principal accounting officer) | ||||||||
| Date: March 24, 2023 | /s/ ANNE FINUCANE | |||||||
| Anne Finucane | ||||||||
| Director | ||||||||
| Date: March 24, 2023 | /s/ ESI EGGLESTON BRACEY | |||||||
| Esi Eggleston Bracey | ||||||||
| Director | ||||||||
| Date: March 24, 2023 | /s/ FRITS VAN PAASSCHEN | |||||||
| Frits van Paasschen | ||||||||
| Director | ||||||||
| Date: March 24, 2023 | /s/ PAULA PRETLOW | |||||||
| Paula Pretlow | ||||||||
| Director | ||||||||
| Date: March 24, 2023 | /s/ WILLIAM READY | |||||||
| William Ready | ||||||||
| Director |