 filings.tools
Item 5. MARKET FOR REGISTRANT’S COMMON EQUITY, RELATED STOCKHOLDER MATTERS AND ISSUER PURCHASES OF EQUITY SECURITIES
3K characters. Original on sec.gov · Markdown
Item 5. MARKET FOR REGISTRANT’S COMMON EQUITY, RELATED STOCKHOLDER MATTERS AND ISSUER PURCHASES OF EQUITY SECURITIES
Our common stock is listed on the New York Stock Exchange (“NYSE”) under the symbol “WST.”
As of January 27, 2021, we had 718 shareholders of record, which excludes beneficial owners whose shares were held by brokerage firms, depositaries and other institutional firms in “street names” for their customers.
Dividends
Our common stock paid a quarterly dividend of $0.15 per share in each of the first three quarters of 2019; $0.16 per share in the fourth quarter of 2019 and each of the first three quarters of 2020; and $0.17 per share in the fourth quarter of 2020.
Issuer Purchases of Equity Securities
In December 2019, we announced a share repurchase program for calendar-year 2020 authorizing the repurchase of up to 848,000 shares of our common stock from time to time on the open market or in privately-negotiated transactions as permitted under Exchange Act Rule 10b-18. During the year ended December 31, 2020, we purchased 761,500 shares of our common stock under the now completed program at a cost of $115.5 million, or an average price of $151.65 per share. During the three months ended December 31, 2020, there were no purchases of our common stock made by us or any of our “affiliated purchasers” as defined in Rule 10b-18(a)(3) under the Exchange Act.
In December 2020, we announced a share repurchase program for calendar-year 2021 authorizing the repurchase of up to 631,000 shares of our common stock from time to time on the open market or in privately-negotiated transactions as permitted under Exchange Act Rule 10b-18. The number of shares to be repurchased and the timing of such transactions will depend on a variety of factors, including market conditions. This share repurchase program is expected to be completed by December 31, 2021.
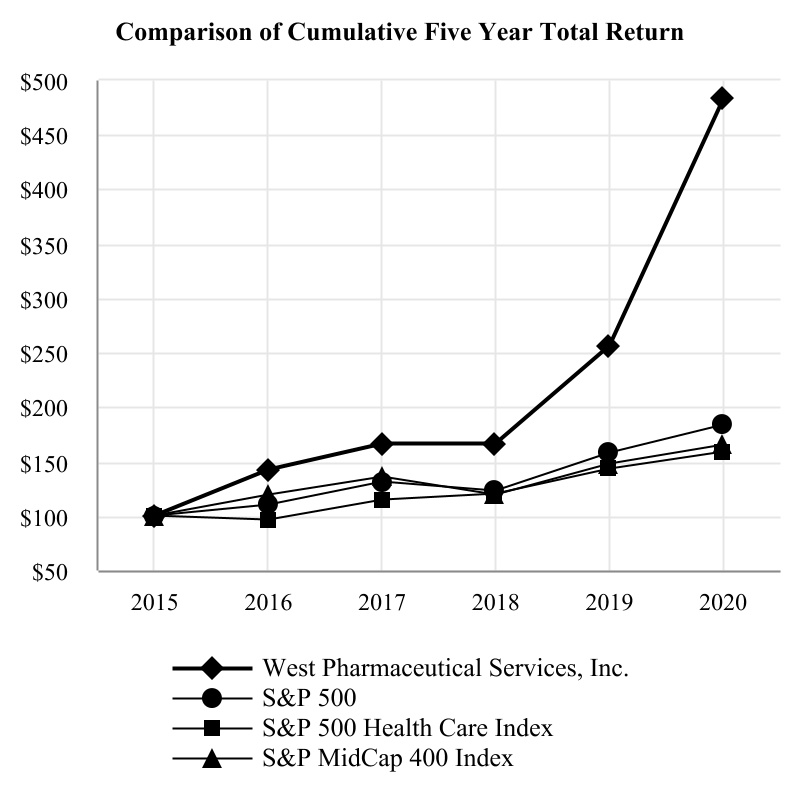
Performance Graph
The following performance graph compares the cumulative total return to holders of our common stock with the cumulative total return of the following Standard & Poor’s (“S&P”) indices, for the five years ended December 31, 2020: 500, 500 Health Care Index, and MidCap 400 Index. The performance graph does not necessarily reflect management's opinion that such indices are an appropriate measure of the relative performance of the stock involved, and is not intended to forecast or be indicative of possible future performance of the Company’s common stock. Due to the increase in our market capitalization, we have decided to replace the S&P MidCap 400 Index with the S&P 500 Health Care Index for comparison purposes, which will be used going forward.
Cumulative total return to shareholders is measured by dividing total dividends (assuming dividend reinvestment) plus the per-share price change for the period by the share price at the beginning of the period. The Company’s cumulative shareholder return is based on an investment of $100 on December 31, 2015 and is compared to the cumulative total return of the S&P indices mentioned above over the period with a like amount invested.
Previous: Item 4. MINE SAFETY DISCLOSURES · Next: Item 6. SELECTED FINANCIAL DATA