 filings.tools
Item 1. OUR BUSINESS
51K characters. Original on sec.gov ·
Item 1. OUR BUSINESS
OUR BUSINESS
We are one of the world's largest private owners of timberlands. We own or control nearly 7 million acres of timberlands, primarily in the U.S., and manage additional timberlands under long-term licenses in Canada. We manage these timberlands on a sustainable basis in compliance with internationally recognized forestry standards. We are also one of the largest manufacturers of wood and specialty cellulose fibers products. Our company is a real estate investment trust (REIT).
We are committed to operate as a sustainable company and are listed on the Dow Jones World Sustainability Index. We focus on increasing energy and resource efficiency, reducing greenhouse gas emissions, reducing water consumption, conserving natural resources, and offering products that meet human needs with superior sustainability attributes. We operate with world class safety results, understand and address the needs of the communities in which we operate, and present ourselves transparently.
In 2014, we generated $7.4 billion in net sales and employed approximately 12,800 people who serve customers worldwide.
This portion of our Annual Report and Form 10-K provides detailed information about who we are, what we do and where we are headed. Unless otherwise specified, current information reported in this Form 10-K is as of the fiscal year ended December 31, 2014.
We break out financial information such as revenues, earnings and assets by the business segments that form our company. We also discuss the development of our company and the geographic areas where we do business.
Throughout this Form 10-K, unless specified otherwise, references to “we,” “our,” “us” and “the company” refer to the consolidated company.
| WE CAN TELL YOU MORE |
AVAILABLE INFORMATION
We meet the information-reporting requirements of the Securities Exchange Act of 1934 by filing periodic reports, proxy statements and other information with the Securities and Exchange Commission (SEC). These reports and statements — information about our company’s business, financial results and other matters — are available at:
| • | the SEC website — www.sec.gov; |
| • | the SEC’s Public Conference Room, 100 F St. N.E., Washington, D.C., 20549, (800) SEC-0330; and |
| • | our website — www.weyerhaeuser.com. |
When we file the information electronically with the SEC, it also is added to our website.
| WHO WE ARE |
We started out as Weyerhaeuser Timber Company, incorporated in the state of Washington in January 1900, when Frederick Weyerhaeuser and 15 partners bought 900,000 acres of timberland. Today, we are working to grow a truly great company for our shareholders, customers and employees. We grow and harvest trees and manufacture and sell products made from trees.
REAL ESTATE INVESTMENT TRUST (REIT) ELECTION
Starting with our 2010 fiscal year, we elected to be taxed as a REIT. We expect to derive most of our REIT income from investments in timberlands, including the sale of standing timber through pay-as-cut sales contracts. REIT income can be distributed to shareholders without first paying corporate level tax, substantially eliminating the double taxation on income. A significant portion of our timberland segment earnings receives this favorable tax treatment. We are, however, subject to corporate taxes on built-in-gains (the excess of fair market value over tax basis at January 1, 2010) on sales of real property (other than standing timber) held by the REIT during the first 10 years following the REIT conversion. We continue to be required to pay federal corporate income taxes on earnings of our Taxable REIT Subsidiary (TRS), which includes our manufacturing businesses and the portion of our Timberlands segment income included in the TRS.
OUR BUSINESS SEGMENTS
In the Consolidated Results section of Management’s Discussion and Analysis of Financial Condition and Results of Operations, you will find our overall performance results for our business segments:
| • | Timberlands, |
| • | Wood Products and |
| • | Cellulose Fibers. |
Detailed financial information about our business segments and our geographic locations is in Note 2: Business Segments and Note 21: Geographic Areas in the Notes to Consolidated Financial Statements, as well as in this section and in the Management’s Discussion and Analysis of Financial Condition and Results of Operations.
EFFECT OF MARKET CONDITIONS
The health of the U.S. housing market strongly affects our Wood Products and Timberlands segments. Wood Products primarily sells into the new residential building and repair and remodel markets. Demand for logs from our Timberlands segment is affected by the production of wood-based building products as well as export demand. Cellulose Fibers is primarily affected by global demand and the relative strength of the U.S. dollar.
WEYERHAEUSER COMPANY > 2014 ANNUAL REPORT AND FORM 10-K 1
COMPETITION IN OUR MARKETS
We operate in highly competitive domestic and foreign markets, with numerous companies selling similar products. Many of our products also face competition from substitutes for wood and wood-fiber products. We compete in our markets primarily through price, product quality and service levels. We are relentlessly focused on improving operational excellence to ensure a competitive cost structure and producing quality products customers want and are wiling to pay for.
Our business segments’ competitive strategies are as follows:
| • | Timberlands — Extract maximum value from each acre we own or manage. |
| • | Wood Products — Deliver high-quality lumber, structural panels, engineered wood products and complementary building products for residential, multi-family, industrial and light commercial applications at competitive costs. |
| • | Cellulose Fibers — Concentrate on value-added pulp products and low cost manufacturing assets. |
SALES OUTSIDE THE U.S.
In 2014, $2.5 billion — 34 percent — of our total consolidated sales from continuing operations were to customers outside the U.S. The table below shows sales outside the U.S. for the last three years.
| SALES OUTSIDE THE U.S. IN MILLIONS OF DOLLARS | |||||||||
| 2014 | 2013 | 2012 | |||||||
| Exports from the U.S. | $ | 1,892 | $ | 1,891 | $ | 1,682 | |||
| Canadian export and domestic sales | 472 | 488 | 348 | ||||||
| Other foreign sales | 150 | 114 | 92 | ||||||
| Total | $ | 2,514 | $ | 2,493 | $ | 2,122 | |||
| Percent of total sales | 34 | % | 29 | % | 30 | % |
OUR EMPLOYEES
We have approximately 12,800 employees. This number includes:
| • | 11,930 employed in North America and |
| • | 870 employed by our operations outside of North America. |
Of these employees, approximately 3,550 are members of unions covered by multi-year collective-bargaining agreements. More information about these agreements is in Note 9: Pension and Other Postretirement Benefit Plans in the Notes to Consolidated Financial Statements.
| WHAT WE DO |
This section provides information about how we:
| • | grow and harvest trees and |
| • | manufacture and sell products made from them. |
For each of our business segments, we provide details about what we do, where we do it, how much we sell and where we are headed.
TIMBERLANDS
Our Timberlands segment manages 6.9 million acres of private commercial timberlands worldwide. We own 6.2 million of those acres and have long-term leases on the other 0.7 million acres. In addition, we have renewable, long-term licenses on Canadian timberlands. The tables presented in this section include data from this segment's business units as of the end of 2014.
WHAT WE DO
Forestry Management
Our Timberlands segment:
| • | grows and harvests trees to be converted into lumber, other wood and building products and pulp and paper; |
| • | exports logs to other countries where they are made into products; |
| • | plants seedlings to reforest harvested areas using the most effective regeneration method for the site and species (in parts of Canada natural regeneration is employed); |
| • | monitors and cares for the planted trees as they grow to maturity; and |
| • | strives to sustain and maximize the timber supply from our timberlands while keeping the health of our environment a key priority. |
Our goal is to maximize returns by selling logs and stumpage to internal and external customers. We focus on solid wood and use intensive silviculture to improve forest productivity and returns while managing our forests on a sustainable basis to meet customer and public expectations.
Sustainable Forestry Practices
We are committed to responsible environmental stewardship wherever we operate, managing forests to produce financially mature timber while protecting the ecosystem services they provide. Our working forests include places with unique environmental, cultural, historical or recreational value. To protect their unique qualities, we follow regulatory requirements, voluntary standards and implement the Sustainable Forestry Initiative® (SFI) standard. Independent auditing of all of the forests we own or manage in the United States and Canada certifies that we meet the SFI standard. Our timberlands in Uruguay are certified under the Forest Stewardship Council (FSC) standard or the Uruguayan national forestry management standard which is endorsed by the Program for the Endorsement of Forest Certification (PEFC).
WEYERHAEUSER COMPANY > 2014 ANNUAL REPORT AND FORM 10-K 2
Canadian Forestry Operations
In Canada, we manage timberlands under long-term licenses that provide raw material for our manufacturing facilities in various provinces. When we harvest trees, we pay the provinces at stumpage rates set by the government, which generally are based on prevailing market prices. We transfer logs to our manufacturing facilities at cost, and do not generate any profit in the Timberlands segment from the harvest of timber from the licensed acres in Canada.
Other Values From Our Timberlands
In the United States, we actively manage mineral, oil and gas leases on our land and use geologic databases to identify and market opportunities for commercial mineral and geothermal development. We recognize leasing revenue over the terms of agreements with customers. Revenue primarily comes from:
| • | royalty payments on oil and gas production; |
| • | upfront bonus payments from oil and gas leasing and exploration activity; |
| • | royalty payments on hard minerals (rock, sand and gravel); |
| • | geothermal lease and option revenues; and |
| • | the sale of mineral assets. |
In managing mineral resources, we generate revenue related to our ownership of the minerals and, separately, related to our ownership of the surface. The ownership of mineral rights and surface acres may be held by two separate parties. Materials that can be mined from the surface, and whose value comes from factors other than their chemical composition, typically belong to the surface owner. Examples of surface materials include rock, sand, gravel, dirt and topsoil. The mineral owner holds the title to commodities that derive value from their unique chemical composition. Examples of mineral rights include oil, gas, coal (even if mined at the surface) and precious metals. If the two types of rights conflict, then mineral rights generally are superior to surface rights. A third type of land right is geothermal, which can belong to either the surface or mineral owner. We routinely reserve mineral and geothermal rights when selling surface timberlands acreage.
Timberlands Products
| PRODUCTS | HOW THEY’RE USED |
| Logs | Logs are made into lumber, other wood and building products and pulp and paper products. |
| Timberlands | Timberland tracts are sold or exchanged to improve our timberland portfolio. |
| Timber | Standing timber is sold to third parties. |
| Minerals, oil and gas | Minerals, oil and gas are sold into construction and energy markets. |
| Other products | Other products includes seed and seedlings, recreational leases, as well as plywood produced by our international operations in Uruguay. |
HOW WE MEASURE OUR PRODUCT
We report Timberlands data in cubic meters. Cubic meters measure the total volume of wood fiber in a tree or log that we can sell. Cubic meter volume is determined from the large and small-end diameters and length and provides a more consistent and comparative measure of timber and log volume among operating regions, species, size and seasons of the year than other units of measure.
We also use multiple units of measure when transacting business including:
| • | Thousand board feet (MBF) — used in the West to measure the expected lumber recovery from a tree or log. This measure does not include taper or recovery of non-lumber residual products. |
| • | Hundred cubic feet (CCF) — used in the West to measure the volume of a log. The measure does not include any calculation for expected lumber recovery. |
| • | Green tons (GT) — used in the South to measure weight, but factors used for conversion to product volume can vary by species, size, location and season. |
WHERE WE DO IT
Our timberlands assets are located primarily in North America. In the U.S. we own and manage sustainable timberlands in nine states for use in wood products and pulp and paper manufacturing. We own or lease:
| • | 4.0 million acres in the southern U.S. (Alabama, Arkansas, Louisiana, Mississippi, North Carolina, Oklahoma and Texas); and |
| • | 2.6 million acres in the Pacific Northwest (Oregon and Washington). |
We also own and operate nurseries and seed orchards in Washington, Oregon, South Carolina and Georgia.
Our international operations are located in Uruguay, where we own 298,000 acres and have long-term leases on 25,000 acres. In Canada, we manage timberlands under long-term licenses that provide raw material for our manufacturing facilities. These licenses are in Alberta, British Columbia, Ontario (license is managed by partnership) and Saskatchewan.
Our total timber inventory — including timber on owned and leased land in our U.S. and international operations — is approximately 345 million cubic meters. The amount of timber inventory does not translate into an amount of lumber or panel products because the quantity of end products:
| • | varies according to the species, size and quality of the timber; and |
| • | will change through time as the mix of these variables adjust. |
The species, size and grade of the trees affects the relative value of our timberlands.
We maintain our timber inventory in an integrated resource inventory and geographic information system (“GIS”). The resource inventory component of the system is proprietary and is largely based on internally developed technologies, including growth and yield models developed by our research and development organization. The GIS component is based on GIS software that is viewed as the standard in our industry.
WEYERHAEUSER COMPANY > 2014 ANNUAL REPORT AND FORM 10-K 3
Timber inventory data collection and verification techniques include the use of industry standard field sampling procedures as well as proprietary remote sensing technologies in some geographies where they generate improved estimates. The data is collected and maintained at the timber stand level.
DISCUSSION OF OPERATIONS BY GEOGRAPHY
Summary of 2014 United States Standing Timber Inventory
| GEOGRAPHIC AREA | MILLIONS OF CUBIC METERS AT DECEMBER 31, 2014 | |
| TOTAL INVENTORY(1) | ||
| West: | ||
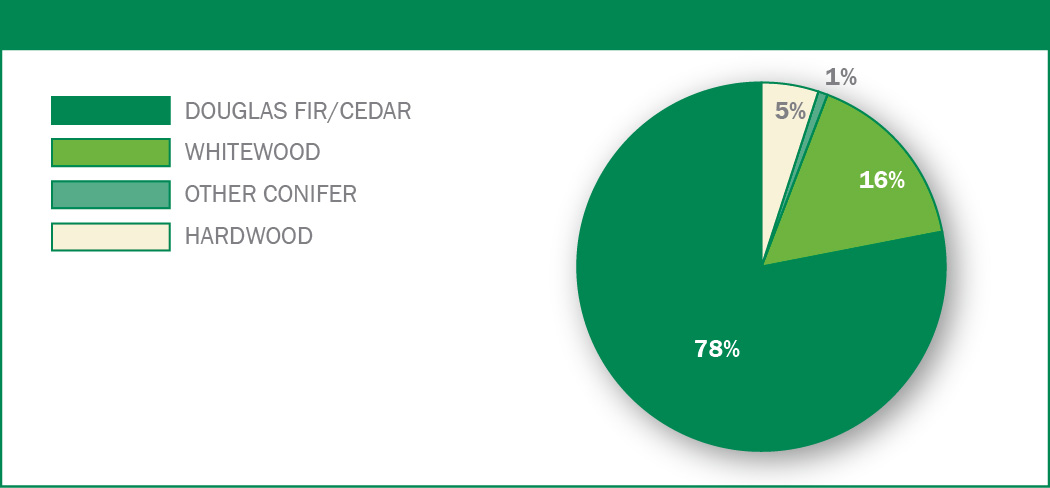
| Douglas fir/Cedar | 153 | |
| Whitewood | 31 | |
| Other conifer | 1 | |
| Hardwood | 11 | |
| 196 | ||
| South: | ||
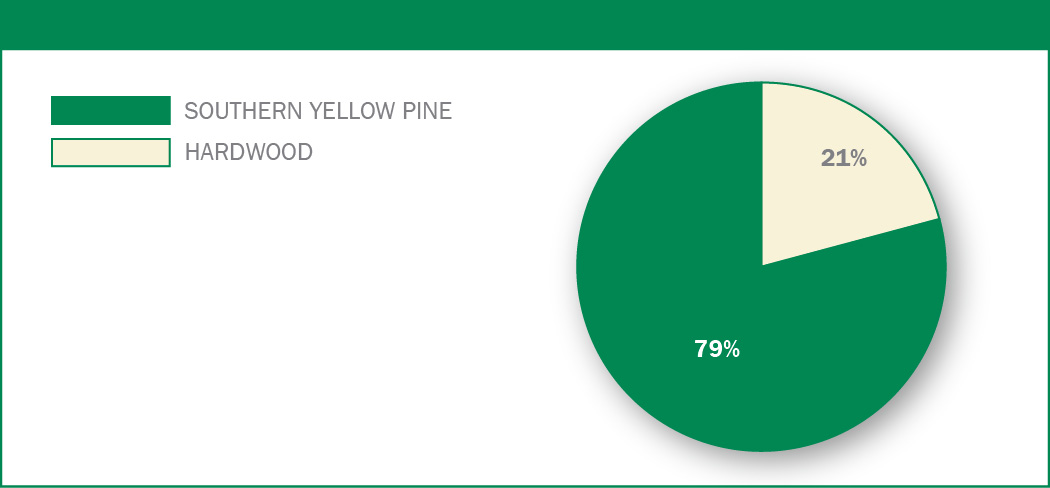
| Southern yellow pine | 110 | |
| Hardwood | 29 | |
| 139 | ||
| Total U.S. | 335 | |
| (1) Inventory includes all conservation and set aside areas. |
Summary of 2014 United States Timberland Locations
| GEOGRAPHIC AREA | THOUSANDS OF ACRES AT DECEMBER 31, 2014 | |||||
| FEE OWNERSHIP | LONG- TERM LEASES | TOTAL ACRES(1) | ||||
| U.S.: | ||||||
| West | 2,594 | — | 2,594 | |||
| South | 3,398 | 642 | 4,040 | |||
| Total U.S. | 5,992 | 642 | 6,634 | |||
| (1) Acres include all conservation and set aside areas. |
We provide a constant year round flow of logs to internal and third-party customers. We sell grade logs to mills that manufacture a diverse range of products including lumber, plywood and veneer. We also sell chips and fiber logs to pulp, paper and oriented strand board mills. Our timberlands are well located to take advantage of road, logging and transportation systems for efficient delivery of logs to these customers.
Western United States
Our Western acres are well situated to serve the wood product markets in Oregon and Washington. In addition, our location on the West Coast provides access to higher-value export markets for Douglas fir and whitewood logs in Japan, China and Korea. The size and quality of our Western timberlands, coupled with their proximity to several deep-water port facilities, positions us to meet the needs of Pacific Rim log markets.
Our lands are composed primarily of Douglas fir, a species highly valued for its structural strength. Our coastal lands also contain whitewood and have a higher proportion of whitewood than our interior holdings. Our management systems range from research and forestry, to technical planning models, mechanized harvesting, and marketing and logistics. They provide us a competitive operating advantage.
On July 23, 2013, we purchased 100 percent of the equity interests in Longview Timber LLC (Longview Timber) for $1.58 billion cash and assumed debt of $1.07 billion, for an aggregate purchase price of $2.65 billion. Longview Timber was a privately-held Delaware limited liability company engaged in the ownership and management of approximately 645,000 acres of timberlands in Oregon and Washington. More information on this transaction can be found in Note 4: Longview Timber Purchase in the Notes to Consolidated Financial Statements.
WEYERHAEUSER COMPANY > 2014 ANNUAL REPORT AND FORM 10-K 4
2014 Western U.S. Inventory by Species
2014 Western U.S. Inventory by Age / Species

The average age of timber harvested in 2014 was 52 years. Most of our U.S. timberland is intensively managed for timber production, but some areas are conserved for environmental, historical, recreational or cultural reasons. Some of our older trees are protected in acreage set aside for conservation, and some are not yet logged due to harvest rate regulations. While over the long term our average harvest age will decrease in accordance with our sustainable forestry practices, we harvest generally 2 percent of our Western acreage each year.
Southern United States
Our Southern acres predominantly contain southern yellow pine and encompass timberlands in seven states.
We intensively manage our timber plantations using forestry research and planning systems to optimize grade log production. We also actively manage our land to capture revenues from our oil, gas and hard minerals resources. We do this while providing quality habitat for a range of animals and birds. We lease more than 93 percent of our acres to the public and state wildlife agencies for recreational purposes.
2014 Southern U.S. Inventory by Species
WEYERHAEUSER COMPANY > 2014 ANNUAL REPORT AND FORM 10-K 5
2014 Southern U.S. Inventory by Age / Species
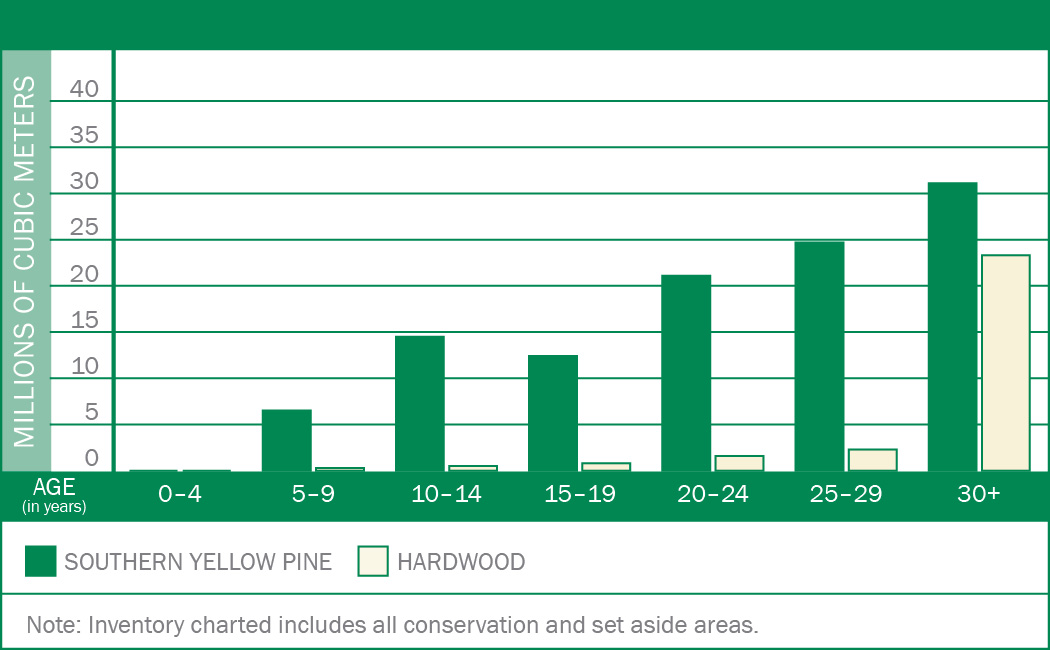
The average age of timber harvested in 2014 was 31 years for southern yellow pine. In accordance with our sustainable forestry practices, we harvest generally 3 percent of our acreage each year in the South.
International
Summary of 2014 International Standing Timber Inventory
| GEOGRAPHIC AREA | MILLIONS OF CUBIC METERS AT DECEMBER 31, 2014 | |
| TOTAL INVENTORY | ||
| Uruguay: | ||
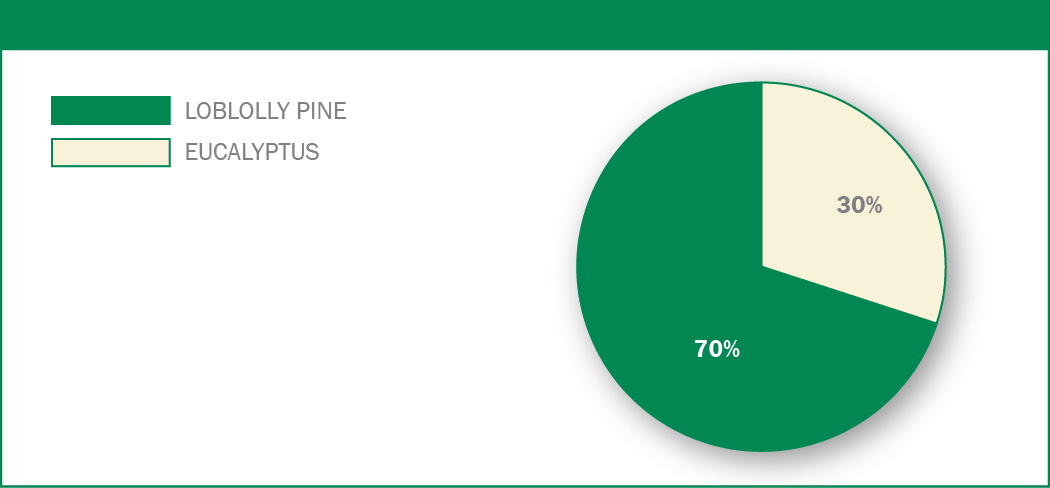
| Pine | 7 | |
| Eucalyptus | 3 | |
| Total International | 10 |
Summary of 2014 International Timberland Locations
| GEOGRAPHIC AREA | THOUSANDS OF ACRES AT DECEMBER 31, 2014 | |||||
| FEE OWNERSHIP | LONG-TERM LEASES | TOTAL ACRES | ||||
| Uruguay | 298 | 25 | 323 |
Our timberland acres in Uruguay are split approximately 50 percent loblolly pine and 50 percent eucalyptus. Loblolly pine comprises more of our timber inventory due to its older age. On average, the timber in Uruguay is in the second third of its rotation age. It is entering into that part of the growth rotation when we will see increased volume accretion. About 96 percent of the area to be planted has been afforested to date.
2014 International Inventory by Species (Uruguay)
In Uruguay, the target rotation ages are 21 to 22 years for pine and 14 to 17 years for eucalyptus. We manage both species to a grade (appearance) regime.
We also operate a plywood mill in Uruguay with a production capacity of 250,000 cubic meters. Production volume reached 216,000 cubic meters in 2014.
In Brazil, we were a managing partner in a joint venture that operated a hardwood sawmill. We sold our interest in this joint venture during 2014.
WEYERHAEUSER COMPANY > 2014 ANNUAL REPORT AND FORM 10-K 6
Canada — Licensed Timberlands
We manage timberlands under long-term licenses in Canada from the provincial government to secure the volume for our manufacturing facilities in various provinces. The provincial governments regulate the volume of timber that may be harvested each year through the Annual Allowable Cut (AAC) allotment, which is updated every 10 years. As of December 31, 2014, our AAC allotment was:
| • | Alberta — 3,917 thousand cubic meters, |
| • | British Columbia — 682 thousand cubic meters, |
| • | Ontario — 146 thousand cubic meters and |
| • | Saskatchewan — 755 thousand cubic meters. |
When the volume is harvested, we pay the province at stumpage rates set by the government and generally based on prevailing market prices. The harvested logs are transferred to our manufacturing facilities at cost (stumpage plus harvest, haul and overhead costs less any margin on selling logs to third parties). Any profit from harvesting the log through to converting it to a finished product is recognized at the respective mill in either the Cellulose Fibers or Wood Products segment.
| GEOGRAPHIC AREA | THOUSANDS OF ACRES AT DECEMBER 31, 2014 | |
| TOTAL LICENSE ARRANGEMENTS | ||
| Canada: | ||
| Alberta | 5,306 | |
| British Columbia | 1,012 | |
| Ontario(1) | 2,573 | |
| Saskatchewan | 4,970 | |
| Total Canada | 13,861 | |
| (1) License is managed by partnership. |
Five-Year Summary of Timberlands Fee Harvest Volumes
| FEE HARVEST VOLUMES IN THOUSANDS | ||||||||||
| 2014 | 2013 | 2012 | 2011 | 2010 | ||||||
| Fee harvest volume – cubic meters: | ||||||||||
| West | 11,173 | 8,907 | 7,170 | 6,595 | 5,569 | |||||
| South | 11,676 | 11,596 | 11,488 | 9,738 | 8,197 | |||||
| International | 990 | 818 | 763 | 854 | 349 | |||||
| Total | 23,839 | 21,321 | 19,421 | 17,187 | 14,115 |
Our Timberlands annual fee harvest volumes represents the depletion of the timber assets we own. Depletion is a method of expensing the cost of establishing the fee timber asset base over the harvest or timber sales volume. The increase in fee harvest volumes from 2010 through 2014 reflects improving market conditions. The increase in fee harvest volumes in the West in 2013 and 2014 also reflects the purchase of Longview Timber.
Our fee harvest volumes are managed sustainably across all regions to ensure the preservation of long-term economic value of the timber and to capture maximum value from the markets. This is accomplished by ensuring annual harvest schedules target financially mature timber and reforestation activities align with the growing of timber through its life cycle to financial maturity.
Five-Year Summary of Timberlands Fee Harvest Volumes - Percentage of Grade and Fiber
| PERCENTAGE OF GRADE AND FIBER | |||||||||||
| 2014 | 2013 | 2012 | 2011 | 2010 | |||||||
| West | Grade | 89 | % | 90 | % | 90 | % | 90 | % | 92 | % |
| Fiber | 11 | % | 10 | % | 10 | % | 10 | % | 8 | % | |
| South | Grade | 59 | % | 57 | % | 59 | % | 58 | % | 55 | % |
| Fiber | 41 | % | 43 | % | 41 | % | 42 | % | 45 | % | |
| International | Grade | 63 | % | 60 | % | 67 | % | 55 | % | 65 | % |
| Fiber | 37 | % | 40 | % | 33 | % | 45 | % | 35 | % | |
| Total | Grade | 73 | % | 69 | % | 71 | % | 70 | % | 70 | % |
| Fiber | 27 | % | 31 | % | 29 | % | 30 | % | 30 | % |
WEYERHAEUSER COMPANY > 2014 ANNUAL REPORT AND FORM 10-K 7
HOW MUCH WE SELL
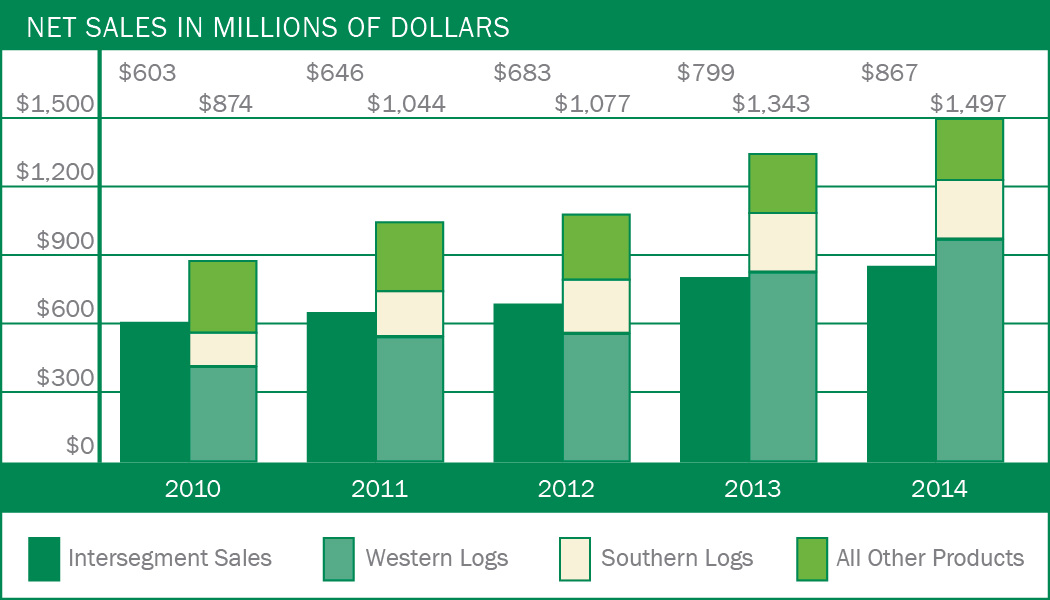
Our net sales to unaffiliated customers over the last two years were:
| • | $1.5 billion in 2014 — up 11 percent from 2013; and |
| • | $1.3 billion in 2013. |
Our intersegment sales over the last two years were:
| • | $867 million in 2014 — up 9 percent from 2013; and |
| • | $799 million in 2013. |
Five-Year Summary of Net Sales for Timberlands
| NET SALES IN MILLIONS OF DOLLARS | |||||||||||||||
| 2014 | 2013 | 2012 | 2011 | 2010 | |||||||||||
| To unaffiliated customers: | |||||||||||||||
| Logs: | |||||||||||||||
| West | $ | 972 | $ | 828 | $ | 559 | $ | 545 | $ | 414 | |||||
| South | 257 | 256 | 233 | 196 | 145 | ||||||||||
| Canada | 22 | 19 | 19 | 17 | 17 | ||||||||||
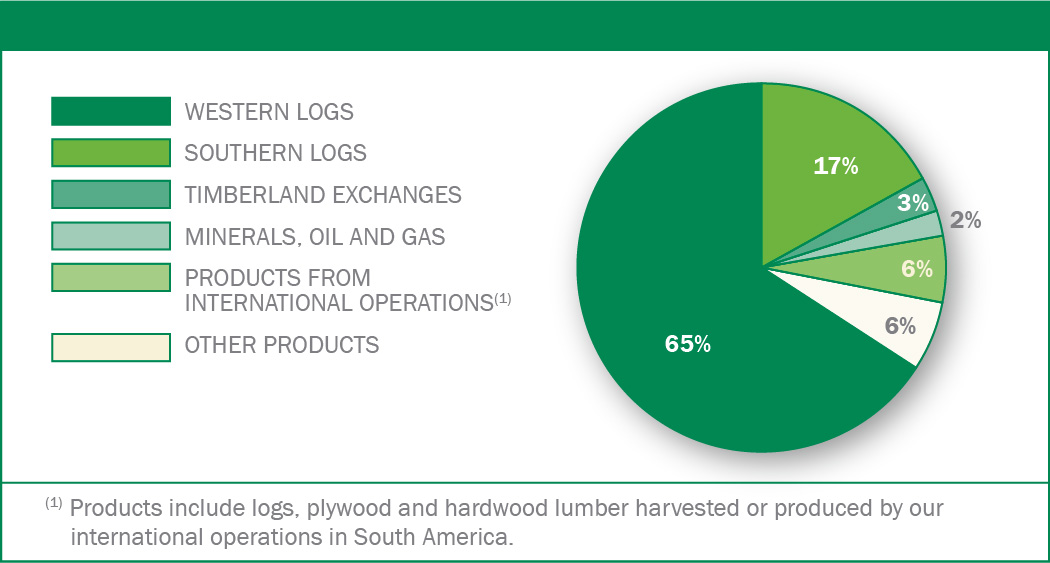
| Total | 1,251 | 1,103 | 811 | 758 | 576 | ||||||||||
| Chip sales | 12 | 9 | 18 | 19 | 16 | ||||||||||
| Timberlands sales and exchanges(1) | 52 | 65 | 59 | 77 | 109 | ||||||||||
| Higher and better use land sales(1) | 19 | 19 | 22 | 25 | 22 | ||||||||||
| Minerals, oil and gas | 32 | 32 | 31 | 53 | 60 | ||||||||||
| Products from international operations(2) | 96 | 90 | 106 | 86 | 65 | ||||||||||
| Other products | 35 | 25 | 30 | 26 | 26 | ||||||||||
| Subtotal sales to unaffiliated customers | 1,497 | 1,343 | 1,077 | 1,044 | 874 | ||||||||||
| Intersegment sales: | |||||||||||||||
| United States | 576 | 518 | 447 | 424 | 409 | ||||||||||
| Other | 291 | 281 | 236 | 222 | 194 | ||||||||||
| Subtotal intersegment sales | 867 | 799 | 683 | 646 | 603 | ||||||||||
| Total | $ | 2,364 | $ | 2,142 | $ | 1,760 | $ | 1,690 | $ | 1,477 | |||||
| (1) Significant dispositions of higher and better use timberland and some non-strategic timberlands are made through subsidiaries. (2) Products include logs, plywood and hardwood lumber harvested or produced by our international operations. Includes sales of our operations in Uruguay, Brazil (sold in 2014) and China (sold in 2012). |
Five-Year Trend for Total Net Sales in Timberlands
WEYERHAEUSER COMPANY > 2014 ANNUAL REPORT AND FORM 10-K 8
Percentage of 2014 Sales Dollars to Unaffiliated Customers
Log Sales Volumes
Logs sold to unaffiliated customers in 2014 increased 1.4 million cubic meters — 10 percent — from 2013.
| • | Sales volumes in the West increased 1.3 million cubic meters — 17 percent — primarily due to strong export and domestic demand and the purchase of Longview Timber. Our western sales to unaffiliated customers generally are higher-grade logs sold into the export market and domestic-grade logs sold to West Coast sawmills. |
| • | Sales to unaffiliated customers in the South decreased 210 thousand cubic meters — 4 percent — primarily due to a shift to stumpage sales. |
| • | Sales volumes from Canada increased 81 thousand cubic meters — 16 percent — in 2014. The increase in volume to unaffiliated customers primarily was due to increased internal mill demand. |
| • | Sales volumes from our international operations increased 247 thousand cubic meters — 69 percent — in 2014. The increase in volume was primarily due to increased fiber log sales in Uruguay. |
We sell three grades of logs — domestic grade, domestic fiber and export. Factors that may affect log sales in each of these categories include:
| • | domestic grade log sales — lumber usage, primarily for housing starts and repair and remodel activity, the needs of our own mills and the availability of logs from both outside markets and our own timberlands; |
| • | domestic fiber log sales — demand for chips by pulp, containerboard mills, and OSB mills; and |
| • | export log sales — the level of housing starts in Japan and construction in China. |
Our sales volumes include logs purchased in the open market and all our domestic and export logs that are sold to unaffiliated customers or transferred at market prices to our internal mills by the sales and marketing staff within our Timberlands business units.
Five-Year Summary of Log Sales Volumes to Unaffiliated Customers for Timberlands
| SALES VOLUMES IN THOUSANDS | ||||||||||
| 2014 | 2013 | 2012 | 2011 | 2010 | ||||||
| Logs – cubic meters: | ||||||||||
| West | 8,980 | 7,708 | 5,898 | 5,267 | 4,476 | |||||
| South | 5,678 | 5,888 | 5,575 | 4,879 | 3,357 | |||||
| Canada | 592 | 511 | 531 | 479 | 507 | |||||
| International | 604 | 357 | 343 | 314 | 283 | |||||
| Total | 15,854 | 14,464 | 12,347 | 10,939 | 8,623 |
WEYERHAEUSER COMPANY > 2014 ANNUAL REPORT AND FORM 10-K 9
Log Prices
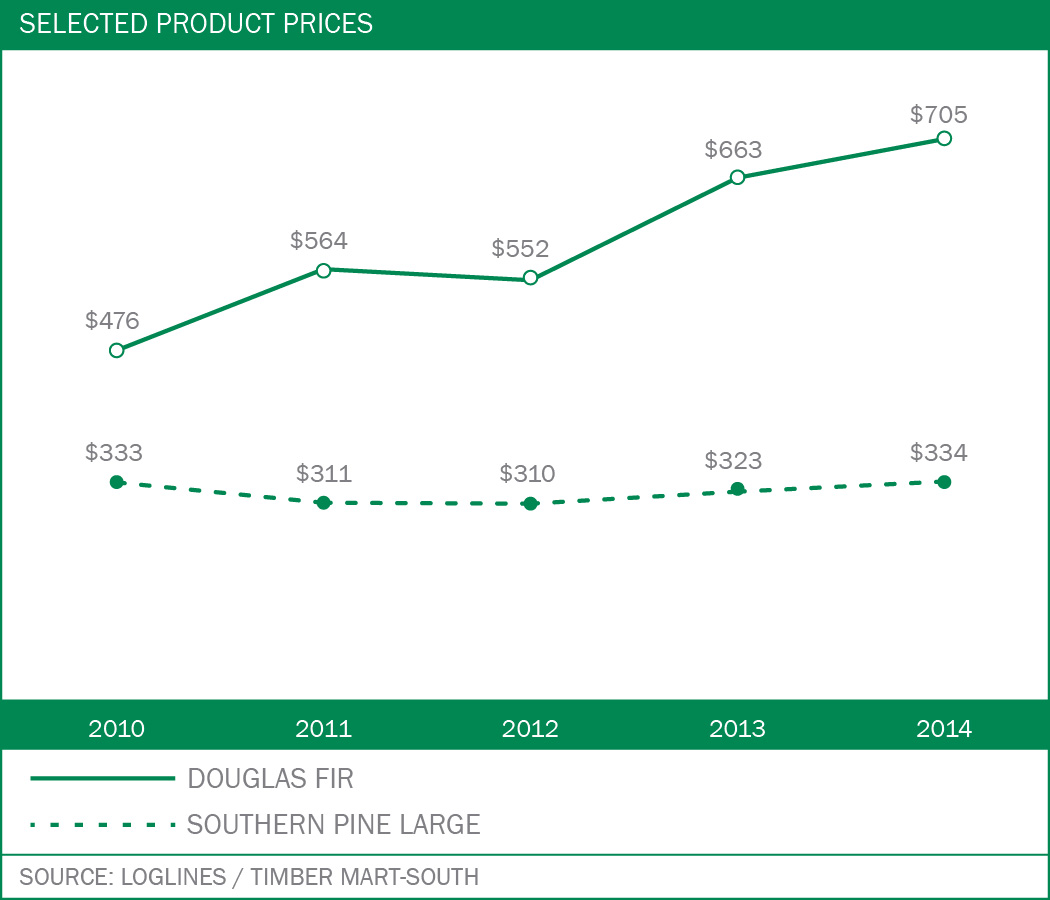
The majority of our log sales to unaffiliated customers involve sales to domestic sawmills and the export market. Log prices in the following tables are on a delivered (mill) basis:
Five-Year Summary of Published Domestic Log Prices (#2 Sawlog Bark On — $/MBF)
Five-Year Summary of Export Log Prices (#2 Sawlog Bark On — $/MBF)

Our log prices are affected by the supply of and demand for grade and fiber logs and are influenced by the same factors that affect log sales. Export log prices are particularly affected by the Japanese housing market.
Our average 2014 log realizations in the West increased from 2013 — primarily due to stronger demand for logs in the domestic market. Our average 2014 log realizations in the South increased from 2013 — primarily due to strengthening market conditions in the South.
Minerals and Energy Products
Mineral revenue was down slightly in 2014 as royalty revenue from natural gas and construction aggregates declined.
WHERE WE’RE HEADED
Our competitive strategies include:
| • | continuing to capitalize on our scale operations, silviculture expertise and sustainability practices; |
| • | maximizing cash flow through operational excellence initiatives such as merchandising for value, harvest and transportation efficiencies, and flexing harvest to seasonal and short term opportunities; |
| • | sustaining our export and domestic market access, infrastructure and strong customer relationships; and |
| • | increasing non-timber revenue streams. |
WEYERHAEUSER COMPANY > 2014 ANNUAL REPORT AND FORM 10-K 10
WOOD PRODUCTS
We are a large manufacturer and distributor of wood products primarily in North America and Asia.
WHAT WE DO
Our wood products segment:
| • | provides a family of high-quality softwood lumber, engineered wood products, structural panels and other specialty products to the residential, multi-family, industrial, light commercial and repair and remodel markets; |
| • | distributes our products as well as complementary building products that we purchase from other manufacturers; and |
| • | exports our softwood lumber, oriented strand board (OSB) and engineered wood products primarily to Asia. |
Wood Products
| PRODUCTS | HOW THEY’RE USED |
| Structural lumber | Structural framing for new residential, repair and remodel, treated applications, industrial and commercial structures |
| Engineered wood products • Solid section • I-joists | Floor and roof joists, and headers and beams for residential, multi-family and commercial structures |
| Structural panels • OSB • Softwood plywood | Structural sheathing, subflooring and stair tread for residential, multi-family and commercial structures |
| Other products | Complementary building products such as cedar, decking, siding, insulation and rebar sold in our distribution facilities |
WHERE WE DO IT
We operate manufacturing facilities in the United States and Canada. We distribute through a combination of Weyerhaeuser and third-party locations. Information about the locations, capacities and actual production of our manufacturing facilities is included below.
Principal Manufacturing Locations
Locations of our principal manufacturing facilities as of December 31, 2014, by major product group were:
| • | Structural lumber |
– U.S. — Alabama, Arkansas, Louisiana, Mississippi, North Carolina, Oklahoma, Oregon and Washington
– Canada — Alberta and British Columbia
| • | Engineered wood products |
– U.S. — Alabama, Louisiana, Oregon and West Virginia
– Canada — British Columbia and Ontario
| • | Oriented strand board |
– U.S. — Louisiana, Michigan, North Carolina and West Virginia
– Canada — Alberta and Saskatchewan
| • | Softwood plywood |
– U.S. — Arkansas and Louisiana
We also own or lease 21 distribution centers in the U.S. where our major products and complementary building products are sold.
Summary of Wood Products Capacities as of December 31, 2014
| CAPACITIES IN MILLIONS | ||||
| PRODUCTION CAPACITY | NUMBER OF FACILITIES | |||
| Structural lumber – board feet | 4,690 | 18 | ||
| Engineered solid section – cubic feet(1) | 43 | 6 | ||
| Oriented strand board – square feet (3/8”) | 3,035 | 6 | ||
| Softwood plywood – square feet (3/8”) | 460 | 2 | ||
| (1) Three engineered wood products facilities also produce engineered I-Joists to meet market demand. 2014 production of I-Joists was 182 million lineal feet. |
Production capacities listed represent annual production volume under normal operating conditions and producing a normal product mix for each individual facility. Production capacities do not include any capacity for facilities that were sold or permanently closed as of the end of 2014. We also operate a facility in Foster, Oregon that produces veneer, primarily for use in our engineered wood products facilities.
During 2013, we decided to permanently close our Colbert, Georgia engineered wood products facility. In 2014, we decided to reopen our Evergreen, Alabama engineered wood products facility. Both facilities were previously indefinitely closed.
WEYERHAEUSER COMPANY > 2014 ANNUAL REPORT AND FORM 10-K 11
Five-Year Summary of Wood Products Production
| PRODUCTION IN MILLIONS | ||||||||||
| 2014 | 2013 | 2012 | 2011 | 2010 | ||||||
| Structural lumber – board feet | 4,152 | 4,084 | 3,846 | 3,528 | 3,289 | |||||
| Engineered solid section – cubic feet(1) | 20.4 | 18.0 | 15.4 | 13.4 | 14.5 | |||||
| Engineered I-joists – lineal feet(1) | 182 | 168 | 147 | 122 | 133 | |||||
| Oriented strand board – square feet (3/8”) | 2,749 | 2,723 | 2,511 | 2,127 | 1,721 | |||||
| Softwood plywood – square feet (3/8”)(2) | 252 | 241 | 214 | 197 | 212 | |||||
| (1) Weyerhaeuser engineered I-joist facilities also may produce engineered solid section. (2) All Weyerhaeuser plywood facilities also produce veneer. |
HOW MUCH WE SELL
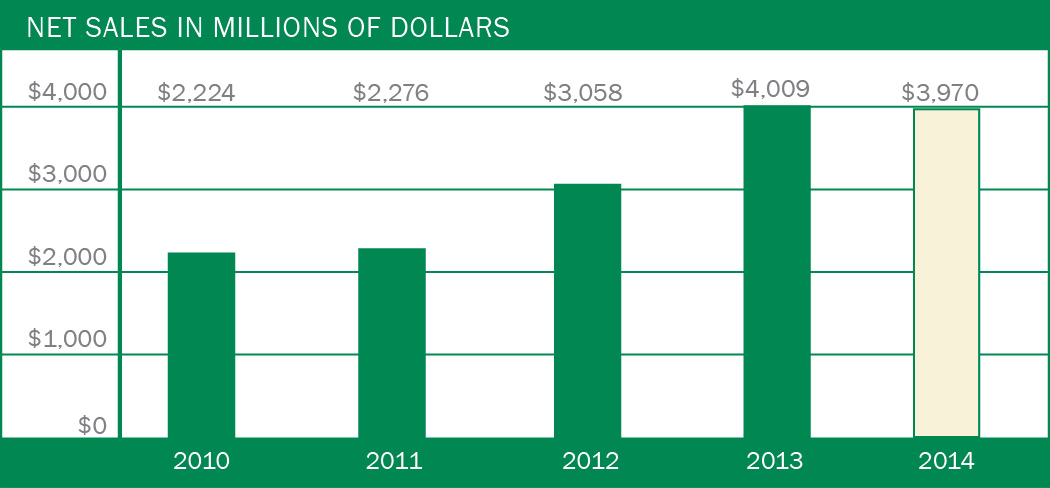
Revenues of our Wood Products segment come from sales to wood products dealers, do-it-yourself retailers, builders and industrial users. Wood Products net sales were $4.0 billion in 2014 and 2013.
Five-Year Summary of Net Sales for Wood Products
| NET SALES IN MILLIONS OF DOLLARS | |||||||||||||||
| 2014 | 2013 | 2012 | 2011 | 2010 | |||||||||||
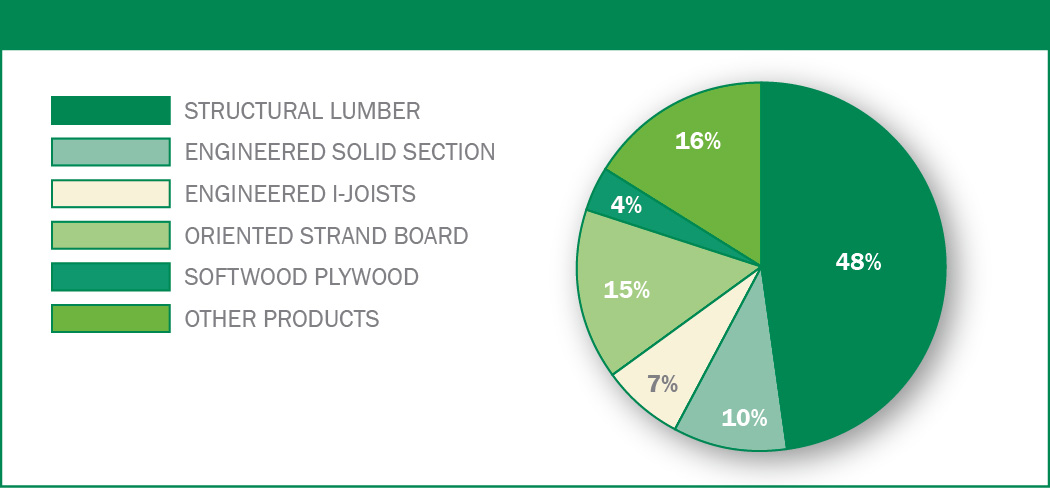
| Structural lumber | $ | 1,901 | $ | 1,873 | $ | 1,400 | $ | 1,087 | $ | 1,044 | |||||
| Engineered solid section | 402 | 353 | 279 | 235 | 246 | ||||||||||
| Engineered I-joists | 277 | 247 | 190 | 161 | 171 | ||||||||||
| Oriented strand board | 610 | 809 | 612 | 354 | 319 | ||||||||||
| Softwood plywood | 143 | 144 | 115 | 66 | 65 | ||||||||||
| Other products produced | 176 | 171 | 167 | 142 | 125 | ||||||||||
| Complementary building products | 461 | 412 | 295 | 231 | 254 | ||||||||||
| Total | $ | 3,970 | $ | 4,009 | $ | 3,058 | $ | 2,276 | $ | 2,224 |
Five-Year Trend for Total Net Sales in Wood Products
Percentage of 2014 Net Sales Dollars in Wood Products
WEYERHAEUSER COMPANY > 2014 ANNUAL REPORT AND FORM 10-K 12
Wood Products Volume
The volume of structural lumber, OSB, and engineered wood products sold in 2014 increased from 2013 due to increased demand.
Five-Year Summary of Sales Volume for Wood Products
| SALES VOLUMES IN MILLIONS | ||||||||||
| 2014 | 2013 | 2012 | 2011 | 2010 | ||||||
| Structural lumber – board feet | 4,463 | 4,436 | 4,031 | 3,586 | 3,356 | |||||
| Engineered solid section – cubic feet | 20.0 | 18.2 | 15.4 | 12.3 | 13.1 | |||||
| Engineered I-joists – lineal feet | 184 | 177 | 152 | 128 | 145 | |||||
| Oriented strand board – square feet (3/8”) | 2,788 | 2,772 | 2,508 | 1,977 | 1,547 | |||||
| Softwood Plywood – square feet (3/8”) | 395 | 402 | 340 | 249 | 237 | |||||
| Sales volumes include sales of internally produced products and complementary building products primarily through our distribution business. |
Wood Products Prices
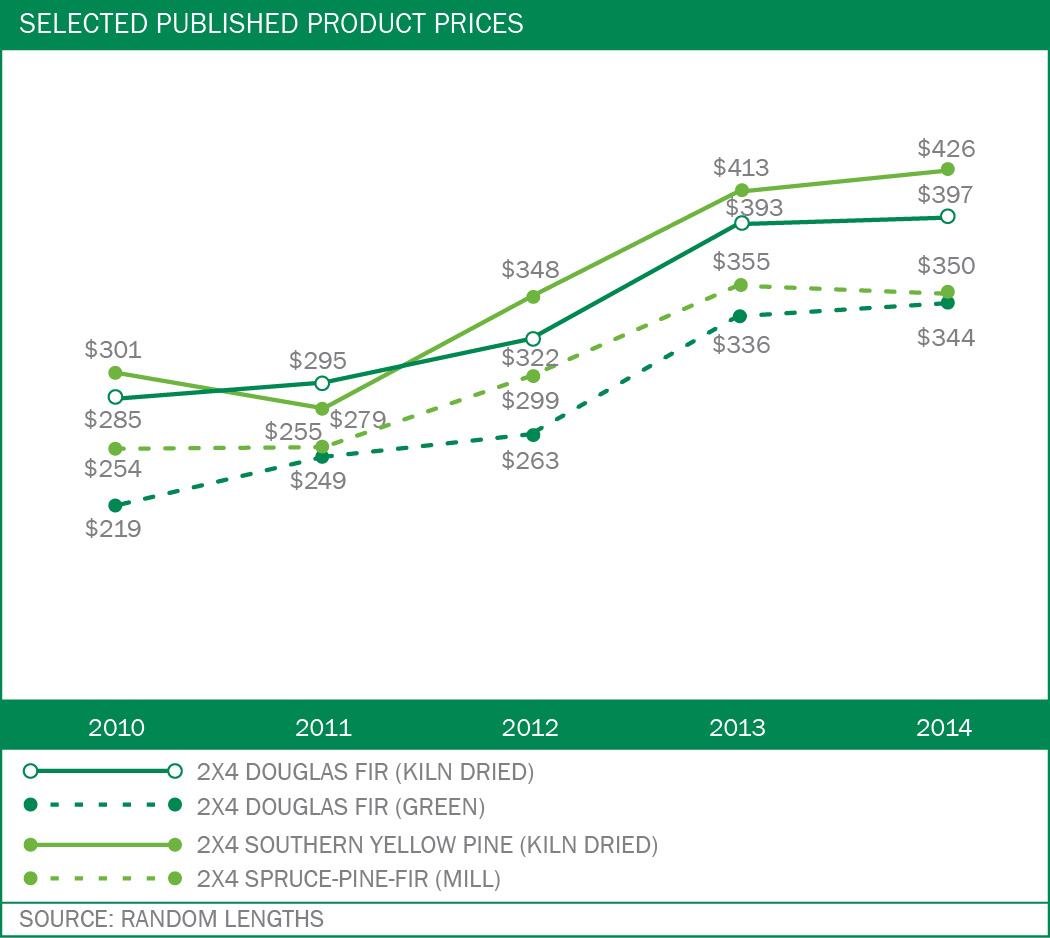
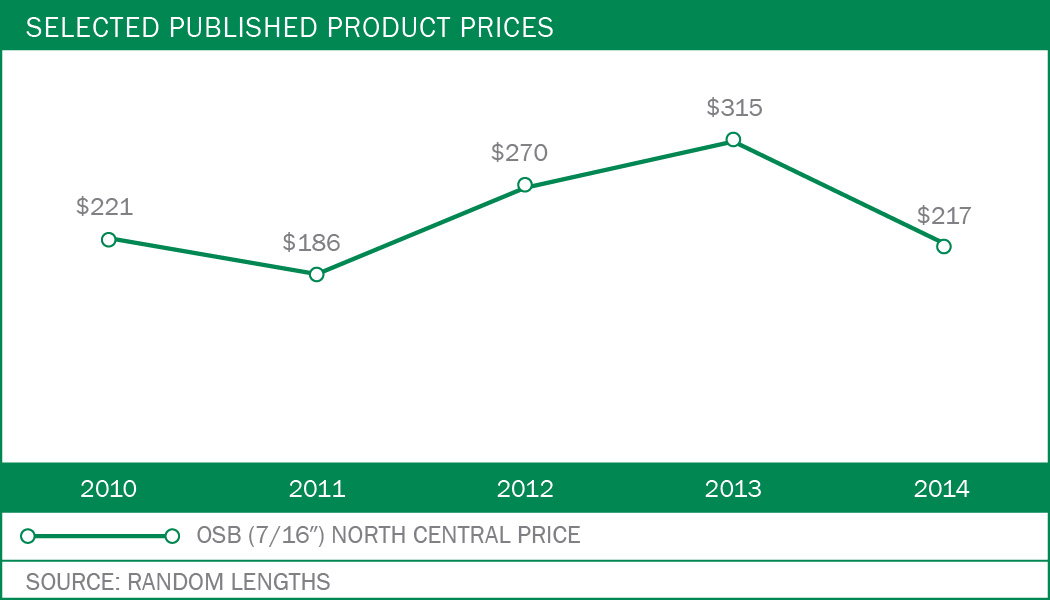
Prices for commodity wood products — Structural lumber and Plywood — increased in 2014 from 2013 while OSB decreased.
In general, the following factors influence prices for wood products:
| • | Demand for wood products used in residential and multi-family construction and the repair and remodel of existing homes affects prices. Residential construction is influenced by factors such as population growth and other demographics, the level of employment, consumer confidence, consumer income, availability of financing and interest rate levels, and the supply and pricing of existing homes on the market. Repair and remodel activity is affected by the size and age of existing housing inventory and access to home equity financing and other credit. |
| • | The availability of supply of commodity building products such as structural lumber, OSB and plywood affects prices. A number of factors can influence supply, including changes in production capacity and utilization rates, weather, raw material supply and availability of transportation. |
The North American housing market continued to show sustained improvement in 2014. This improvement led to increased demand and resulted in improved pricing for commodity wood products, excluding OSB, in 2014. The following graphs reflect product price trends for the past five years.
Five-Year Summary of Published Lumber Prices — $/MBF
Five-Year Summary of Published Oriented Strand Board Prices — $/MSF
WEYERHAEUSER COMPANY > 2014 ANNUAL REPORT AND FORM 10-K 13
WHERE WE’RE HEADED
Our competitive strategies include:
| • | reduce controllable manufacturing costs through operational excellence and capital execution; |
| • | maintain a value-added product mix; |
| • | leverage our brand and reputation as the preferred provider of quality building products; and |
| • | pursue disciplined, profitable sales growth. |
CELLULOSE FIBERS
Our cellulose fibers segment is one of the world’s largest producers of absorbent fluff pulp used in products such as diapers. We also manufacture liquid packaging board and other pulp products. We have a 50 percent interest in North Pacific Paper Corporation (NORPAC) — a joint venture with Nippon Paper Industries that produces primarily high-brightness publication papers and newsprint.
WHAT WE DO
Our cellulose fibers segment:
| • | provides cellulose fibers for absorbent products in markets around the world; |
| • | works closely with our customers to develop unique or specialized applications; |
| • | manufactures liquid packaging board used primarily for the production of containers for liquid products; and |
| • | is largely energy self sufficient, with over 80 percent of its energy derived from black liquor produced at the mills and biomass. |
Cellulose Fibers Products
| PRODUCTS | HOW THEY’RE USED |
| Pulp • Fluff pulp (Southern softwood kraft fiber) • Softwood papergrade pulp • Specialty chemical cellulose pulp | • Used in sanitary disposable products that require bulk, softness and absorbency • Used in products that include printing and writing papers and tissue • Used in textiles, absorbent products, specialty packaging, specialty applications and proprietary high-bulking fibers |
| Liquid packaging board | Converted into containers to hold liquids such as milk, juice and tea |
| Other products • Slush pulp • Wet lap pulp | Used in the manufacture of paper products |
WHERE WE DO IT
Our cellulose fibers products are distributed globally through a direct sales network. Locations of our principal manufacturing facilities by major product group are:
| • | Pulp Manufacturing |
– U.S. — Georgia (2), Mississippi and North Carolina
– Canada — Alberta
| • | Pulp Converting |
– U.S. — Mississippi
– Poland
| • | Liquid packaging board |
– U.S. — Washington
Summary of Cellulose Fibers Capacities as of December 31, 2014
| CAPACITIES IN THOUSANDS | ||||
| PRODUCTION CAPACITY | NUMBER OF FACILITIES | |||
| Pulp – air-dry metric tons | 1,870 | 5 | ||
| Liquid packaging board – tons | 350 | 1 |
Production capacities listed represent annual production volume under normal operating conditions and producing a normal product mix for each individual facility.
Five-Year Summary of Cellulose Fibers Production
| PRODUCTION IN THOUSANDS | ||||||||||
| 2014 | 2013 | 2012 | 2011 | 2010 | ||||||
| Pulp – air-dry metric tons | 1,859 | 1,815 | 1,773 | 1,769 | 1,774 | |||||
| Liquid packaging board – tons | 292 | 307 | 292 | 307 | 316 |
Liquid packaging board production decreased in 2014 primarily due to a scheduled machine rebuild.
WEYERHAEUSER COMPANY > 2014 ANNUAL REPORT AND FORM 10-K 14
HOW MUCH WE SELL
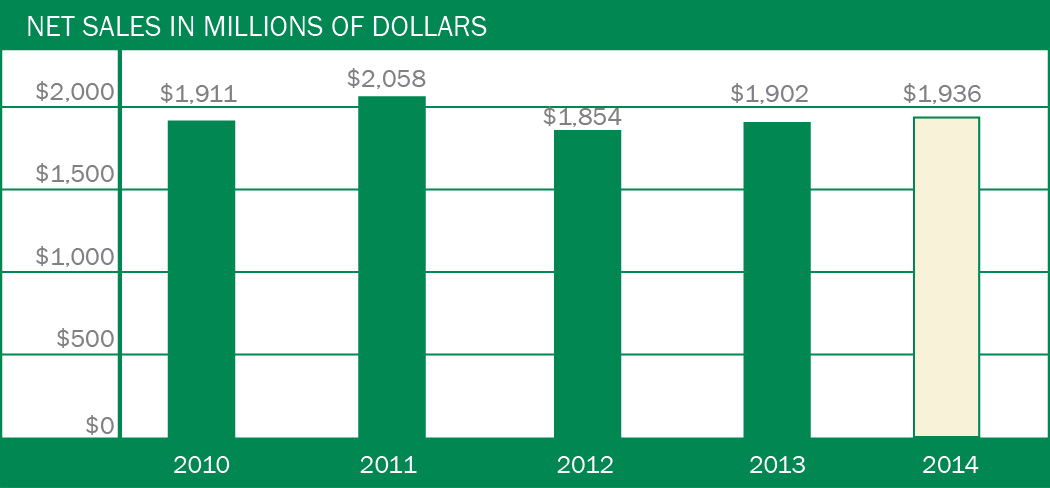
Revenues of our Cellulose Fibers segment come from sales to customers who use the products for further manufacturing or distribution and for direct use. Our net sales were $1.9 billion in 2014, comparable to $1.9 billion in 2013.
Five-Year Summary of Net Sales for Cellulose Fibers
| NET SALES IN MILLIONS OF DOLLARS | |||||||||||||||
| 2014 | 2013 | 2012 | 2011 | 2010 | |||||||||||
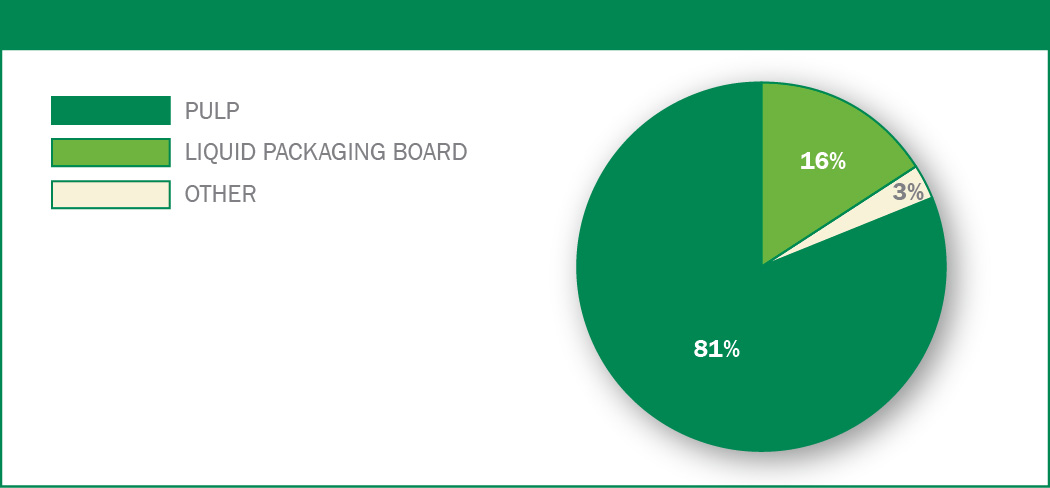
| Pulp | $ | 1,559 | $ | 1,501 | $ | 1,433 | $ | 1,617 | $ | 1,489 | |||||
| Liquid packaging board | 310 | 326 | 332 | 346 | 337 | ||||||||||
| Other products | 67 | 75 | 89 | 95 | 85 | ||||||||||
| Total | $ | 1,936 | $ | 1,902 | $ | 1,854 | $ | 2,058 | $ | 1,911 |
Five-Year Trend for Total Net Sales in Cellulose Fibers
Percentage of 2014 Net Sales Dollars in Cellulose Fibers
Pulp Volumes
Our sales volumes of cellulose fiber products were 1.8 million tons in 2014 and 1.9 million tons in 2013.
Factors that affect sales volumes for cellulose fiber products include:
| • | growth of the world gross domestic product, |
| • | demand for absorbent hygiene products and paper and |
| • | relative strength of the U.S. dollar. |
Five-Year Summary of Sales Volume for Cellulose Fibers
| SALES VOLUMES IN THOUSANDS | ||||||||||
| 2014 | 2013 | 2012 | 2011 | 2010 | ||||||
| Pulp – air-dry metric tons | 1,826 | 1,866 | 1,762 | 1,756 | 1,714 | |||||
| Liquid packaging board – tons | 274 | 305 | 289 | 297 | 311 |
Liquid packaging board sales volume decreased in 2014 primarily due to lower production.
WEYERHAEUSER COMPANY > 2014 ANNUAL REPORT AND FORM 10-K 15
Pulp Prices
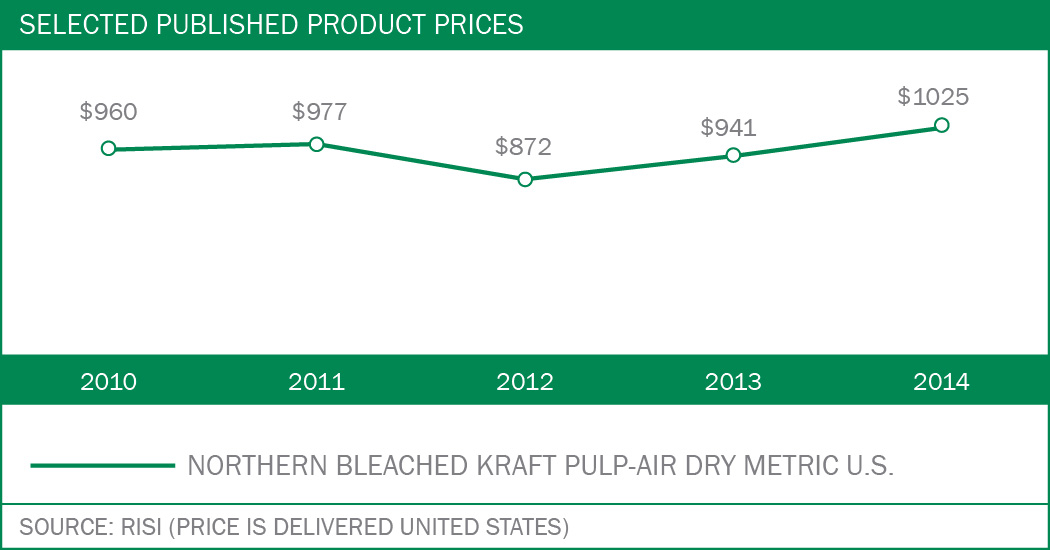
Our average pulp prices in 2014 increased compared with 2013 due to improvement in the market demand and supply balance.
Five-Year Summary of Published NBSK Pulp Prices — $/ADMT
WHERE WE’RE HEADED
Our competitive strategies include:
| • | continued execution of operational excellence initiatives such as manufacturing reliability, predictive, preventive maintenance practices, and liquid packaging board cost and quality improvement; |
| • | profitably growing with long-term strategic customers; and |
| • | focusing capital investments on cost reduction, green energy opportunities and product quality. |
Previous: Cover and table of contents · Next: Item 10. DIRECTORS, EXECUTIVE OFFICERS AND CORPORATE GOVERNANCE