 filings.tools
Item 7. MANAGEMENT’S DISCUSSION AND ANALYSIS OF FINANCIAL CONDITION AND RESULTS OF OPERATIONS
76K characters. Original on sec.gov ·
Item 7. MANAGEMENT’S DISCUSSION AND ANALYSIS OF FINANCIAL CONDITION AND RESULTS OF OPERATIONS
MANAGEMENT’S DISCUSSION AND ANALYSIS OF FINANCIAL CONDITION AND RESULTS OF OPERATIONS (MD&A)
| WHAT YOU WILL FIND IN THIS MD&A |
Our MD&A includes the following major sections:
| • | economic and market conditions affecting our operations; |
| • | financial performance summary; |
| • | results of our operations — consolidated and by segment; |
| • | liquidity and capital resources — where we discuss our cash flows; |
| • | off-balance sheet arrangements; |
| • | environmental matters, legal proceedings and other contingencies; and |
| • | accounting matters — where we discuss critical accounting policies and areas requiring judgments and estimates. |
| ECONOMIC AND MARKET CONDITIONS AFFECTING OUR OPERATIONS |
The strength of the U.S. housing market strongly affects our Wood Products and Timberlands segments. As published by the U.S. Census Bureau, total U.S. housing starts for 2015 were 1,111,000 units, with single-family units accounting for 715,000 of the total. This represents a 10 percent increase in single-family starts from 2014, which were 648,000 units. Multi-family construction also increased in 2015 to 396,000 units compared with 358,000 in 2014. Expectations are for a similar increase in 2016. Consensus forecasts place expected total housing starts between 1.2 and 1.3 million units for 2016. Sources include IHS Global Insight, John Burns Real Estate and RISI. While housing has improved significantly since the recession of 2009, current demand for new housing continues to run below historic pre bubble averages. The 25-year period of 1976-2000 averaged 1.5 million total starts and 1.1 million single family starts, levels which have not yet been achieved in the post recession period.
Wood Products primarily sells into the new residential building and repair and remodel markets. Demand for wood products continued to improve in 2015 following the growth in home construction, however, growth in production also expanded and prices were lower in 2015 than 2014. The Random Lengths framing lumber composite was 14 percent lower in 2015 versus 2014 while oriented strand board (OSB) was 4 percent lower in 2015 as measured by Random Lengths North Central Price. Expectations are for similar to slightly higher wood product prices in 2016 as demand continues to increase with growth in housing starts and remodeling.
Demand for logs from our Timberlands segment is affected by the production of wood-based building products as well as export demand in our Western holdings. In the South, Southern pine sawlog prices were flat to slightly higher in 2015 as available supplies continue to match or exceed growth in demand. Western log prices were lower in 2015 due primarily to the pullback in demand from China which had been actively competing with domestic lumber producers for sawlogs. Expectations are for slightly improved log prices as off-shore demand improves over 2015 and domestic wood products manufacturing output increases with rising housing starts creating increased log demand.
Cellulose Fibers is primarily affected by global supply and demand factors and the relative strength of the U.S. dollar. The slowdown in global growth and reduced expectations for emerging economies slowed demand growth for pulp in 2015. The U.S. dollar continued to strengthen versus the Euro in 2015, rising 12 percent due to stronger US economic growth and increasingly accommodative monetary policies in Eurozone economies. Consequently prices for benchmark NBSK pulp were 8% lower in 2015 versus 2014. Expectations are for similar to slightly lower prices in 2016 as global economic growth is expected to be weak, which will limit growth in demand for products made with cellulose fibers. Furthermore, the US dollar is expected to remain strong relative to other currencies including the euro and a weak euro has historically been associated with lower US dollar prices for cellulose fibers.
WEYERHAEUSER COMPANY > 2015 ANNUAL REPORT AND FORM 10-K 37
| FINANCIAL PERFORMANCE SUMMARY |
Net Sales by Segment

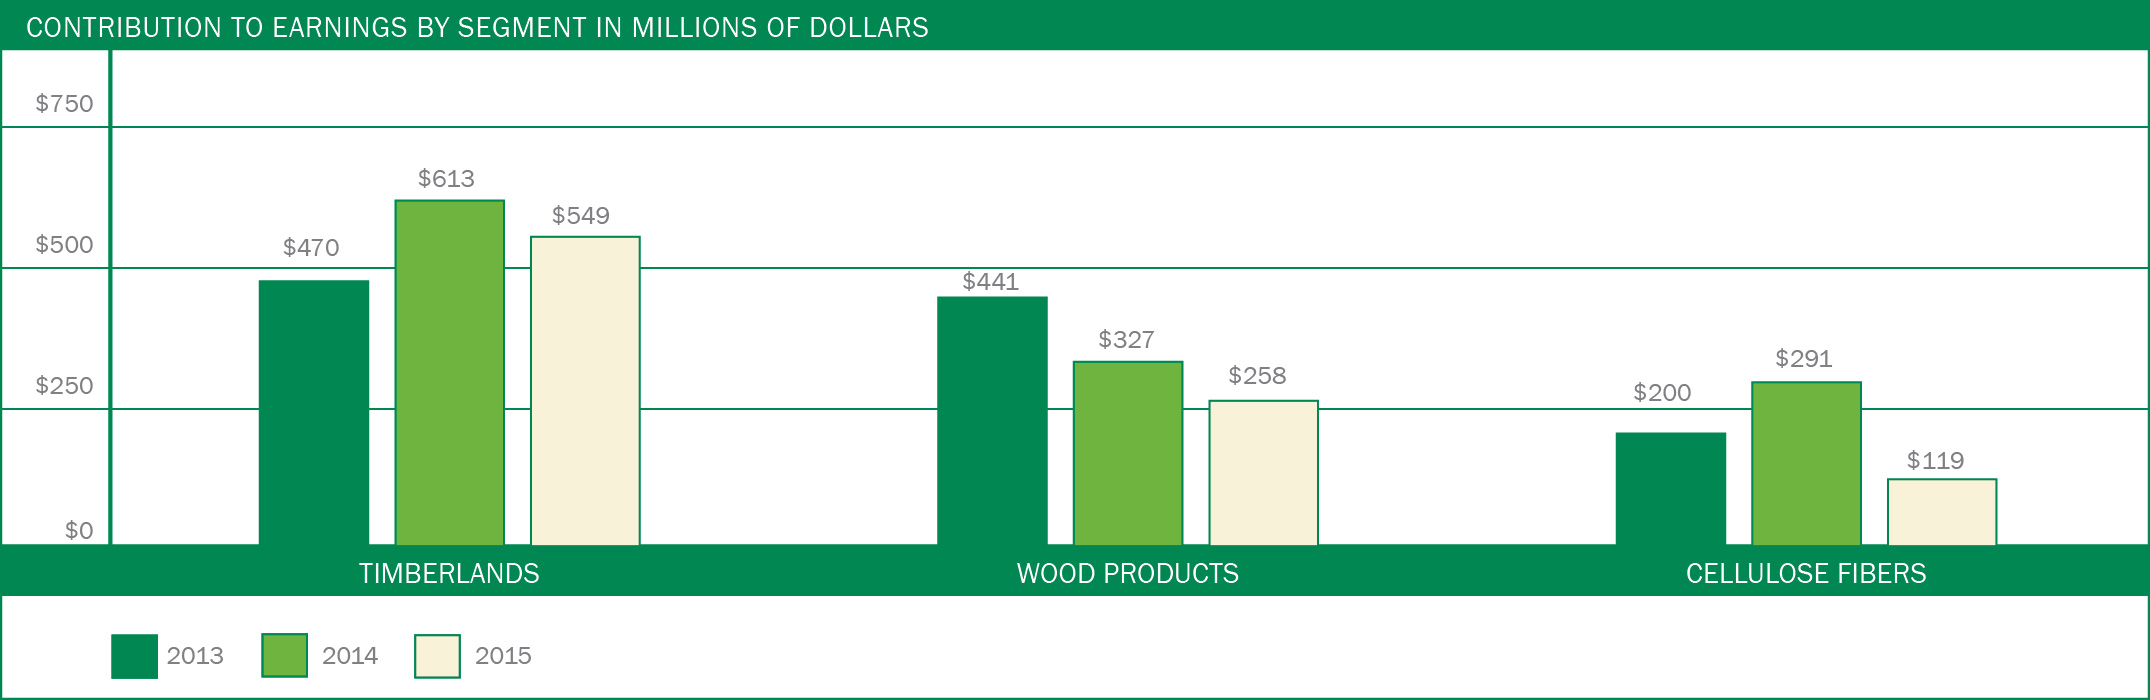
Contribution to Pretax Earnings by Segment
WEYERHAEUSER COMPANY > 2015 ANNUAL REPORT AND FORM 10-K 38
| RESULTS OF OPERATIONS |
In reviewing our results of operations, it is important to understand these terms:
| • | Sales realizations refer to net selling prices — this includes selling price plus freight minus normal sales deductions. |
| • | Net contribution to earnings refers to earnings (loss) attributable to Weyerhaeuser shareholders before interest expense and income taxes. |
CONSOLIDATED RESULTS
HOW WE DID IN 2015
Summary of Financial Results
| DOLLAR AMOUNTS IN MILLIONS, EXCEPT PER-SHARE FIGURES | |||||||||||||||
| AMOUNT OF CHANGE | |||||||||||||||
| 2015 | 2014 | 2013 | 2015 vs. 2014 | 2014 vs. 2013 | |||||||||||
| Net sales | $ | 7,082 | $ | 7,403 | $ | 7,254 | $ | (321 | ) | $ | 149 | ||||
| Operating income | $ | 919 | $ | 1,320 | $ | 634 | $ | (401 | ) | $ | 686 | ||||
| Earnings from discontinued operations, net of tax | $ | — | $ | 998 | $ | 72 | $ | (998 | ) | $ | 926 | ||||
| Net earnings attributable to Weyerhaeuser common shareholders | $ | 462 | $ | 1,782 | $ | 540 | $ | (1,320 | ) | $ | 1,242 | ||||
| Basic earnings per share attributable to Weyerhaeuser common shareholders | $ | 0.89 | $ | 3.20 | $ | 0.95 | $ | (2.31 | ) | $ | 2.25 | ||||
| Diluted earnings per share attributable to Weyerhaeuser common shareholders | $ | 0.89 | $ | 3.18 | $ | 0.95 | $ | (2.29 | ) | $ | 2.23 |
COMPARING 2015 WITH 2014
Net Sales
Net sales decreased $321 million — 4 percent — primarily due to:
| • | lower Timberlands segment sales — $147 million — primarily due to lower average log sales realizations and export sales volumes in the West, and lower log sales volumes in the South; |
| • | lower Wood Products segment sales — $98 million — primarily due to decreased structural lumber and OSB average realizations, partially offset by higher structural lumber, OSB, and engineered solid section sales volumes and higher sales of complementary building products; and |
| • | lower Cellulose Fibers segment sales — $76 million — primarily due to lower pulp and liquid packaging board average sales realizations. |
Net Earnings Attributable to Weyerhaeuser Common Shareholders
Our net earnings attributable to Weyerhaeuser common shareholders decreased $1,320 million primarily due to:
| • | earnings from discontinued operation recognized in 2014 — $998 million. There were no earnings from discontinued operations in 2015; |
| • | lower gross margin — $252 million — primarily due to lower average sales realizations in lumber and OSB in our Wood Products segment, lower average log sales realizations and sales volumes in our Timberlands segment, and lower average sales realizations for pulp and liquid packaging board, and higher operating costs due to scheduled maintenance outages and the West Coast port slowdown in our Cellulose Fibers segment; |
| • | lower other operating income — $219 million — primarily due to a $151 million pretax gain recognized in 2014 related to a previously announced postretirement plan amendment, a $22 million pretax gain recognized in 2014 on the sale of a landfill in Washington State, $14 million of Plum Creek merger-related costs in 2015, and a $13 million noncash impairment charge related to a nonstrategic asset sale in 2015; and |
| • | losses from an equity affiliate in 2015 — $105 million — primarily due to an $84 million noncash asset impairment recorded by an equity affiliate in the fourth quarter 2015. |
These decreases were partially offset by:
| • | lower income taxes — $188 million — primarily due to lower earnings in our Taxable REIT Subsidiary (TRS) in 2015, an income tax benefit recognized in the fourth quarter 2015 related to a noncash asset impairment recorded by an equity affiliate and the expiration of the company's built-in-gains tax period as a result of a change in U.S. tax legislation; and |
| • | lower general and administrative expenses — $49 million. |
COMPARING 2014 WITH 2013
Net Sales
Net sales increased $149 million — 2 percent — primarily due to:
| • | Timberlands segment sales increased $154 million, primarily due to higher log prices and increased sales volumes in the West, including our acquired Longview Timber holdings. |
| • | Cellulose Fibers segment sales increased $34 million primarily due to higher sales realizations for pulp. |
WEYERHAEUSER COMPANY > 2015 ANNUAL REPORT AND FORM 10-K 39
These increases were partially offset by a $39 million decrease in our Wood Products segment sales, primarily due to lower sales realizations for OSB. This decrease in sales was partially offset by higher sales realizations and volumes for engineered wood products and lumber and increased sales from complementary building products.
Net Earnings Attributable to Weyerhaeuser Common Shareholders
Our net earnings attributable to Weyerhaeuser common shareholders increased $1,242 million primarily due to:
| • | a $926 million increase in earnings from discontinued operations, primarily due to a $972 million net gain on the Real Estate Divestiture recognized in 2014; |
| • | a $333 million decrease in charges for restructuring, closure and asset impairments primarily related to a noncash impairment charge relating to a large master-planned community north of Las Vegas, Nevada which was retained by Weyerhaeuser in the divestiture of Weyerhaeuser Real Estate Company (WRECO); |
| • | a $206 million increase in gross margin in our Timberlands and Cellulose Fibers segments, primarily due to higher sales realizations and owning Longview Timber for a full year; |
| • | a $166 million increase in other operating income, primarily due to a $151 million pretax gain recognized in 2014 related to a previously announced postretirement plan amendment; and |
| • | a $79 million decrease in our selling, general and administrative expenses. |
These increases were partially offset by:
| • | a $356 million change in income taxes from a benefit in 2013 to an expense in 2014 primarily related to a previously unrecognized tax benefit recorded in 2013 and higher earnings in our Taxable REIT Subsidiary (TRS) in 2014; and |
| • | a $140 million decrease in gross margin in our Wood Products segment, primarily due to lower sales realizations in OSB. |
TIMBERLANDS
HOW WE DID IN 2015
We report sales volume and annual production data for our Timberlands segment in Our Business/What We Do/Timberlands.
Here is a comparison of net sales to unaffiliated customers, intersegment sales, and net contribution to earnings for the last three years:
Net Sales and Net Contribution to Earnings for Timberlands
| DOLLAR AMOUNTS IN MILLIONS | |||||||||||||||
| AMOUNT OF CHANGE | |||||||||||||||
| 2015 | 2014 | 2013 | 2015 vs. 2014 | 2014 vs. 2013 | |||||||||||
| Net sales to unaffiliated customers: | |||||||||||||||
| Logs: | |||||||||||||||
| West | $ | 830 | $ | 972 | $ | 828 | $ | (142 | ) | $ | 144 | ||||
| South | 241 | 257 | 256 | (16 | ) | 1 | |||||||||
| Canada | 24 | 22 | 19 | 2 | 3 | ||||||||||
| Total | 1,095 | 1,251 | 1,103 | (156 | ) | 148 | |||||||||
| Chip sales | 15 | 12 | 9 | 3 | 3 | ||||||||||
| Timberlands exchanges(1) | 62 | 52 | 65 | 10 | (13 | ) | |||||||||
| Higher and better-use land sales(1) | 14 | 19 | 19 | (5 | ) | — | |||||||||
| Minerals, oil and gas | 26 | 32 | 32 | (6 | ) | — | |||||||||
| Products from international operations(2) | 87 | 96 | 90 | (9 | ) | 6 | |||||||||
| Other products | 51 | 35 | 25 | 16 | 10 | ||||||||||
| Subtotal sales to unaffiliated customers | 1,350 | 1,497 | 1,343 | (147 | ) | 154 | |||||||||
| Intersegment sales: | |||||||||||||||
| United States | 559 | 576 | 518 | (17 | ) | 58 | |||||||||
| Other | 271 | 291 | 281 | (20 | ) | 10 | |||||||||
| Subtotal intersegment sales | 830 | 867 | 799 | (37 | ) | 68 | |||||||||
| Total | $ | 2,180 | $ | 2,364 | $ | 2,142 | $ | (184 | ) | $ | 222 | ||||
| Net contribution to earnings | $ | 549 | $ | 613 | $ | 470 | $ | (64 | ) | $ | 143 | ||||
| (1) Significant dispositions of higher and better use timberland and some nonstrategic timberlands are made through subsidiaries. (2) Products include logs, plywood and hardwood lumber harvested or produced by our international operations. This includes sales from our operations in Uruguay and Brazil (sold in 2014). |
On July 23, 2013, we purchased 100 percent of the equity interests in Longview Timber LLC (Longview Timber) for cash and assumed debt. The sales and net contribution to earnings of our acquired entity from the acquisition date forward are included in the West results of our Timberlands segment. Longview Timber was and continues to be a supplier to our Wood Products segment and those sales are shown in intersegment sales. More information on this transaction can be found in Note 4: Acquisitions in the Notes to Consolidated Financial Statements.
WEYERHAEUSER COMPANY > 2015 ANNUAL REPORT AND FORM 10-K 40
COMPARING 2015 WITH 2014
Net Sales — Unaffiliated Customers
Net sales to unaffiliated customers decreased $147 million — 10 percent — primarily due to a $142 million decrease in Western log sales as a result of lower average sales realizations and export sales volumes, and a $16 million decrease in Southern log sales due to lower sales volumes.
Intersegment Sales
Intersegment sales decreased $37 million — 4 percent — primarily due to a $20 million decrease in Canada due to lower translated revenues as a result of the strengthening U.S. dollar, and a $17 million decrease in the United States due to lower Southern log sales volumes and decreased Western average realizations.
Net contribution to earnings
Net contribution to earnings decreased $64 million — 10 percent — primarily due to:
| • | lower average log sales realizations in the West — $106 million and |
| • | lower sales volumes in the West and South — $46 million. |
These decreases were partially offset by:
| • | lower operating costs, primarily due to lower logging and silviculture costs in the South and lower log purchases in the West — $68 million; |
| • | higher average sales realizations in the South — $13 million; and |
| • | lower selling, general and administrative expenses — $11 million. |
COMPARING 2014 WITH 2013
Net Sales — Unaffiliated Customers
Net sales to unaffiliated customers increased $154 million — 11 percent — primarily due to a $144 million increase in Western log sales due to higher log prices from our legacy Western timberlands and a 17 percent increase in sales volumes including the increase related to the acquired Longview Timber holdings.
Intersegment Sales
Intersegment sales increased $68 million — 9 percent — primarily due to:
| • | higher sales volume in the United States including the increase related to acquired Longview Timber holdings, and higher log prices in our legacy Western and Southern timberlands — $58 million; and |
| • | higher log and chip sales volumes in Canada — $10 million. |
Net contribution to earnings
Net contribution to earnings increased $143 million — 30 percent — primarily due to:
| • | an $87 million increase as a result of owning Longview Timber for a full year; |
| • | a $59 million increase due to higher log prices in our legacy Western timberlands and Southern timberlands; |
| • | a $20 million increase due to higher sales volumes in our legacy Western timberlands; and |
| • | a $12 million decrease in selling, general and administrative expenses, excluding Longview Timber. |
These increases were partially offset by a $40 million increase in operating costs in our legacy Western timberlands due to increased log purchases.
WEYERHAEUSER COMPANY > 2015 ANNUAL REPORT AND FORM 10-K 41
WOOD PRODUCTS
HOW WE DID IN 2015
We report sales volume and annual production data for our Wood Products segment in Our Business/What We Do/Wood Products.
Net Sales and Net Contribution to Earnings for Wood Products
| DOLLAR AMOUNTS IN MILLIONS | |||||||||||||||
| AMOUNT OF CHANGE | |||||||||||||||
| 2015 | 2014 | 2013 | 2015 vs. 2014 | 2014 vs. 2013 | |||||||||||
| Net sales: | |||||||||||||||
| Structural lumber | $ | 1,741 | $ | 1,901 | $ | 1,873 | $ | (160 | ) | $ | 28 | ||||
| Engineered solid section | 428 | 402 | 353 | 26 | 49 | ||||||||||
| Engineered I-joists | 284 | 277 | 247 | 7 | 30 | ||||||||||
| Oriented strand board | 595 | 610 | 809 | (15 | ) | (199 | ) | ||||||||
| Softwood plywood | 129 | 143 | 144 | (14 | ) | (1 | ) | ||||||||
| Other products produced | 189 | 176 | 171 | 13 | 5 | ||||||||||
| Complementary building products | 506 | 461 | 412 | 45 | 49 | ||||||||||
| Total | $ | 3,872 | $ | 3,970 | $ | 4,009 | $ | (98 | ) | $ | (39 | ) | |||
| Net contribution to earnings | $ | 258 | $ | 327 | $ | 441 | $ | (69 | ) | $ | (114 | ) |
COMPARING 2015 WITH 2014
Net Sales
Net sales decreased $98 million — 2 percent — primarily due to an 11 percent decrease in structural lumber average sales realizations, and a 9 percent decrease in OSB average sales realizations.
These decreases were partially offset by:
| • | higher structural lumber sales volumes — 3 percent, |
| • | higher OSB sales volumes — 7 percent, |
| • | higher engineered solid section sales volumes — 6 percent and |
| • | higher sales of complementary building products — 10 percent. |
Net Contribution to Earnings
Net contribution to earnings decreased $69 million — 21 percent — primarily due to:
| • | lower average sales realizations in lumber and OSB — $258 million and |
| • | pretax restructuring charges related to the closure of four distribution centers — $8 million. |
These decreases were partially offset by:
| • | lower unit manufacturing costs due to lower resin and other input costs, higher operating rates, and lower translated Canadian operating costs due to the strengthening of the U.S. dollar — $96 million; |
| • | lower log costs due to decreasing log prices and lower translated Canadian costs due to the strengthening of the U.S. dollar— $45 million; |
| • | lower general and administrative expenses — $28 million; |
| • | lower freight costs due to declining fuel prices — $18 million and |
| • | higher sales volumes across most product lines — $17 million. |
COMPARING 2014 WITH 2013
Net Sales
Net sales decreased $39 million — 1 percent — primarily due to a 25 percent decrease in OSB average sales realizations.
This decrease was partially offset by:
| • | higher engineered solid section shipment volumes — 10 percent, and average sales realizations — 4 percent; |
| • | higher sales of complementary building products — 12 percent; |
| • | higher engineered I-joists average sales realizations — 8 percent, and shipment volumes — 4 percent; and |
| • | higher structural lumber average sales realizations — 1 percent, and shipment volumes — 1 percent. |
Net Contribution to Earnings
Net contribution to earnings decreased $114 million — 26 percent —primarily due to:
| • | lower OSB sales realizations — $204 million and |
| • | higher log costs — $47 million. |
These decreases were partially offset by:
| • | lower lumber manufacturing costs primarily due to aggressive cost control — $40 million; |
| • | higher average sales realizations in engineered wood products and lumber — $35 million; |
| • | higher margins in our distribution business — $31 million; |
WEYERHAEUSER COMPANY > 2015 ANNUAL REPORT AND FORM 10-K 42
| • | lower selling, general and administrative expenses — $15 million; |
| • | higher shipment volumes primarily in engineered wood products and our distribution business — $10 million; and |
| • | an impairment charge in 2013 related to the decision to permanently close an engineered wood products facility — $9 million. |
CELLULOSE FIBERS
HOW WE DID IN 2015
We report sales volume and annual production data for our Cellulose Fibers segment in Our Business/What We Do/Cellulose Fibers.
Here is a comparison of net sales and net contribution to earnings for the last three years:
Net Sales and Net Contribution to Earnings for Cellulose Fibers
| DOLLAR AMOUNTS IN MILLIONS | |||||||||||||||
| AMOUNT OF CHANGE | |||||||||||||||
| 2015 | 2014 | 2013 | 2015 vs. 2014 | 2014 vs. 2013 | |||||||||||
| Net sales: | |||||||||||||||
| Pulp | $ | 1,499 | $ | 1,559 | $ | 1,501 | $ | (60 | ) | $ | 58 | ||||
| Liquid packaging board | 305 | 310 | 326 | (5 | ) | (16 | ) | ||||||||
| Other products | 56 | 67 | 75 | (11 | ) | (8 | ) | ||||||||
| Total | $ | 1,860 | $ | 1,936 | $ | 1,902 | $ | (76 | ) | $ | 34 | ||||
| Net contribution to earnings: | $ | — | $ | — | |||||||||||
| Operating income | $ | 224 | $ | 292 | $ | 197 | (68 | ) | 95 | ||||||
| Gain (Loss) from equity affiliates | (105 | ) | 1 | 3 | (106 | ) | (2 | ) | |||||||
| Total | $ | 119 | $ | 291 | $ | 200 | $ | (172 | ) | $ | 91 |
COMPARING 2015 WITH 2014
Net Sales
Net sales decreased $76 million — 4 percent — primarily due to the following:
| • | pulp average sales realizations decreased $31 per ton — 4 percent; |
| • | liquid packaging board average sales realizations decreased $48 per ton — 4 percent; and |
| • | other products sales volumes decreased 12 percent. |
These decreases were partially offset by increased sales volumes for liquid packaging board of 2 percent.
Net Contribution to Earnings
Net contribution to earnings decreased $172 million — 59 percent — primarily due to:
| • | losses from an equity affiliate — $105 million — primarily due to an $84 million noncash asset impairment recorded in the fourth quarter 2015; |
| • | lower pulp average sales realizations — $58 million; |
| • | higher operating costs primarily due to scheduled maintenance outages and the West Coast port slowdown — $46 million; |
| • | lower liquid packaging board average sales realizations — $18 million; and |
| • | higher fiber costs — $13 million. |
These decreases were partially offset by:
| • | lower energy and chemical costs — $28 million, |
| • | lower translated Canadian operating costs due to the strengthening of the U.S. dollar — $27 million and |
| • | lower selling, general and administrative expenses — $10 million. |
COMPARING 2014 WITH 2013
Net Sales
Net sales increased $34 million — 2 percent — primarily due to increased sales realizations for pulp of $50 per ton — 6 percent and liquid packaging board of $61 per ton — 6 percent.
This was partially offset by decreased sales volumes for pulp of 2 percent and liquid packaging board of 10 percent.
Net Contribution to Earnings
Net contribution to earnings increased $91 million — 46 percent — primarily due to:
| • | higher pulp and liquid packaging board sales realizations — $108 million and |
| • | lower translated Canadian operating costs due to the strengthening of the U.S. dollar — $14 million. |
WEYERHAEUSER COMPANY > 2015 ANNUAL REPORT AND FORM 10-K 43
These increases were partially offset by:
| • | higher energy costs primarily due to reduced electricity sales and higher fuel prices — $13 million and |
| • | higher maintenance costs due to a scheduled machine rebuild in our liquid packaging board facility and pulp planned maintenance outages — $13 million. |
UNALLOCATED ITEMS
Unallocated Items are gains or charges not related to or allocated to an individual operating segment. They include a portion of items such as: share-based compensation, pension and postretirement costs, foreign exchange transaction gains and losses associated with financing, and the elimination of intersegment profit in inventory and the LIFO reserve.
Net Contribution to Earnings for Unallocated Items
| DOLLAR AMOUNTS IN MILLIONS | |||||||||||||||
| AMOUNT OF CHANGE | |||||||||||||||
| 2015 | 2014 | 2013 | 2015 vs. 2014 | 2014 vs. 2013 | |||||||||||
| Unallocated corporate function expenses | $ | (27 | ) | $ | (24 | ) | $ | (38 | ) | $ | (3 | ) | $ | 14 | |
| Unallocated share-based compensation | 6 | (9 | ) | (8 | ) | 15 | (1 | ) | |||||||
| Unallocated pension and postretirement credits (costs) | 11 | 196 | (40 | ) | (185 | ) | 236 | ||||||||
| Foreign exchange gains (losses) | (47 | ) | (27 | ) | (7 | ) | (20 | ) | (20 | ) | |||||
| Elimination of intersegment profit in inventory and LIFO | 10 | (10 | ) | 15 | 20 | (25 | ) | ||||||||
| Other | (65 | ) | (38 | ) | (392 | ) | (27 | ) | 354 | ||||||
| Operating income (loss) | (112 | ) | 88 | (470 | ) | (200 | ) | 558 | |||||||
| Interest income and other | 36 | 38 | 48 | (2 | ) | (10 | ) | ||||||||
| Net contribution to earnings | $ | (76 | ) | $ | 126 | $ | (422 | ) | $ | (202 | ) | $ | 548 |
Unallocated Items in 2015 include:
| • | $13 million noncash impairment charge recognized in first quarter 2015 related to a nonstrategic asset that was sold in second quarter 2015 which is recorded in "Other" above and "Charges for restructuring, closures, and impairments" in our Consolidated Statement of Operations. See Note 18: Charges for Restructuring, Closures and Asset Impairments in the Notes to Consolidated Financial Statements for more information. |
| • | $14 million Plum Creek merger-related costs which are recorded in "Other" above and "Other operating income, net" in our Consolidated Statement of Operations. |
Unallocated Items in 2014 include:
| • | $151 million pretax gain related to a previously announced postretirement plan amendment which is recorded in "Unallocated pension and postretirement credits (costs)" above. See Note 9: Pension and Other Postretirement Benefit Plans in the Notes to Consolidated Financial Statements for more information. |
| • | $39 million in charges related to our selling, general and administrative cost reduction initiative which is recorded in "Other" above. |
| • | $22 million pretax gain on the sale of a landfill in Washington State, which is recorded in "Other" above and "Other operating income, net" in our Consolidated Statement of Operations. See Note 19: Other Operating Income, Net in the Notes to Consolidated Financial Statements for more information. |
INTEREST EXPENSE
Our net interest expense incurred for the last three years was:
| • | $347 million in 2015, |
| • | $344 million in 2014 and |
| • | $369 million in 2013. |
There were no changes in our amount of outstanding debt during 2015 and 2014. Our outstanding debt balane increased $600 million during 2013.
Interest expense in 2013 includes $11 million in fees related to a bridge loan we did not draw from in the acquisition of Longview Timber and $25 million in pretax losses on early extinguishment of debt.
INCOME TAXES
Our provision (benefit) for income taxes for our continuing operations over the last three years was:
| • | $(3) million in 2015, |
| • | $185 million in 2014 and |
| • | $(171) million in 2013. |
During 2015, our provision for income taxes decreased $188 million as compared with 2014, primarily due to lower earnings in our TRS in 2015. We also recorded a $13 million tax benefit for the expiration of the company’s built-in-gains tax period due to a change in tax law in the fourth quarter 2015, and a $28 million tax benefit for the reduction in the deferred tax liability associated with an equity affiliate resulting from a non-cash impairment charge recorded by that entity.
WEYERHAEUSER COMPANY > 2015 ANNUAL REPORT AND FORM 10-K 44
During 2013, we recorded a $193 million tax benefit related to unrecognized tax benefits and a $21 million tax charge related to the repatriation of Canadian earnings.
As a REIT, we generally are not subject to corporate level tax on income of the REIT that is distributed to shareholders. We are no longer subject to corporate taxes on built-in-gains (the excess of fair market value over tax basis at January 1, 2010) due to a change in tax law in the fourth quarter 2015, which statutorily shortened the built-in-gains tax period from 10 years to 5 years following the REIT conversion. We continue to be required to pay federal corporate income taxes on earnings of our TRS, which includes our manufacturing businesses and the portion of our timberlands segment income included in the TRS.
The table below summarizes the historical tax characteristics of distributions to shareholders for the years ended December 31:
| AMOUNTS PER SHARE | |||||||||
| 2015 | 2014 | 2013 | |||||||
| Preference - capital gain distribution | $ | 3.19 | $ | 3.19 | $ | 1.66 | |||
| Common - capital gain distribution | $ | 1.20 | $ | 1.02 | $ | 0.81 |
| LIQUIDITY AND CAPITAL RESOURCES |
We are committed to maintaining a sound, conservative capital structure that enables us to:
| • | protect the interests of our shareholders and lenders and |
| • | have access at all times to major financial markets. |
CASH FROM OPERATIONS
Cash from operations includes:
| • | cash received from customers; |
| • | cash paid to employees and suppliers; |
| • | cash paid for interest on our debt; and |
| • | cash paid or received for taxes. |
Consolidated net cash provided by our operations was:
| • | $1,064 million in 2015, |
| • | $1,088 million in 2014 and |
| • | $1,004 million in 2013. |
COMPARING 2015 WITH 2014
Net cash provided by operations decreased $24 million in 2015 as compared with 2014, primarily due to:
| • | Cash received from customers decreased $296 million as sales decreased in our Timberlands, Wood Products, and Cellulose Fibers segments. |
| • | Net cash outflows related to income taxes decreased $66 million. We paid income taxes of $14 million in 2015 and received tax refunds of $52 million in 2014. |
| • | Cash paid for interest increased $28 million, primarily due to interest received related to tax refunds in 2014. |
These outflows were partially offset by a $393 million decrease in cash paid to employees and suppliers.
COMPARING 2014 WITH 2013
Net cash provided by operations increased $84 million in 2014 as compared with 2013, primarily due to:
| • | Cash received from customers increased $180 million as sales increased in our Timberlands and Cellulose Fibers segments. |
| • | Net cash inflows related to income taxes increased $70 million. We received income tax refunds of $52 million in 2014 and paid $18 million in 2013. |
| • | Cash paid for interest decreased $43 million, primarily due to interest received related to tax refunds in 2014 and refinancing of debt in 2013. |
These inflows were partially offset by a $189 million increase in cash paid to employees and suppliers primarily due to increased production and the acquisition of Longview Timber.
Pension Contributions and Benefit Payments Made and Expected
During 2015, we:
| • | contributed $33 million for our Canadian registered plan in accordance with minimum funding rules and respective provincial regulations; |
| • | contributed to or made benefit payments for our Canadian nonregistered pension plans of $3 million; |
| • | made benefit payments of $24 million for our U.S. nonqualified pension plans; and |
| • | made benefit payments of $23 million for our U.S. and Canadian other postretirement plans. |
There was no minimum required contribution for our U.S. qualified plan for 2015, nor were any contributions made to this plan in 2015.
WEYERHAEUSER COMPANY > 2015 ANNUAL REPORT AND FORM 10-K 45
During 2016, based on estimated year-end assets and projections of plan liabilities, we expect to:
| • | be required to contribute approximately $16 million for our Canadian registered plan; |
| • | be required to contribute or make benefit payments for our Canadian nonregistered plans of $3 million; |
| • | make benefit payments of $19 million for our U.S. nonqualified pension plans; and |
| • | make benefit payments of $22 million for our U.S. and Canadian other postretirement plans. |
We do not anticipate a contribution being required to our U.S. qualified pension plan for 2016.
INVESTING IN OUR BUSINESS
Cash from investing activities includes:
| • | acquisitions of property, equipment, timberlands and reforestation; |
| • | investments in or distribution from equity affiliates; |
| • | proceeds from sale of assets and operations; and |
| • | purchases and redemptions of short-term investments. |
Consolidated net cash provided by (used in) investing activities was:
| • | $(487) million in 2015, |
| • | $361 million in 2014 and |
| • | $(1,829) million in 2013. |
COMPARING 2015 WITH 2014
Net cash from investing activities changed $848 million to an outflow in 2015 as compared with an inflow in 2014, primarily due to:
| • | net proceeds from the Real Estate Divestiture, net of cash divested in 2014; and |
| • | higher capital spending in 2015. |
COMPARING 2014 WITH 2013
Net cash from investing activities changed $2,190 million to an inflow in 2014 as compared with an outflow in 2013, primarily due to:
| • | the acquisition of Longview Timber in 2013; |
| • | net proceeds from the Real Estate Divestiture, net of cash divested in 2014; and |
| • | higher capital spending in 2014. |
LONGVIEW TIMBER PURCHASE
On July 23, 2013, we purchased 100 percent of the equity interests in Longview Timber LLC (Longview Timber) for $1.58 billion cash and assumed debt of $1.07 billion, for an aggregate purchase price of $2.65 billion. More information can be found in Note 4: Acquisitions in the Notes to Consolidated Financial Statements and the "Cash from financing activities" section below.
REAL ESTATE DIVESTITURE
At the close of the Real Estate Divestiture in July 2014, WRECO used $744 million of the debt proceeds to repay intercompany debt and interest to Weyerhaeuser Company. The newly issued debt, remaining proceeds and other WRECO assets and liabilities, including $5 million cash on hand, were acquired by TRI Pointe Homes, Inc. (TRI Pointe) when WRECO became a wholly-owned subsidiary of TRI Pointe at the closing of the transaction. Additionally, $32 million related to the adjustment amount payable pursuant to the terms of the transaction agreement was paid to TRI Pointe. Our net cash proceeds in connection with the Real Estate Divestiture totaled $707 million. More information can be found in Note 3: Discontinued Operations and the "Cash from Financing Activities" section below.
Three-Year Summary of Capital Spending by Business Segment
| DOLLAR AMOUNTS IN MILLIONS | |||||||||
| 2015 | 2014 | 2013 | |||||||
| Timberlands | $ | 75 | $ | 74 | $ | 73 | |||
| Wood Products | 287 | 190 | 113 | ||||||
| Cellulose Fibers | 118 | 123 | 92 | ||||||
| Unallocated Items | 3 | 4 | 5 | ||||||
| Discontinued operations | — | 4 | 10 | ||||||
| Total | $ | 483 | $ | 395 | $ | 293 |
We expect our net capital expenditures for 2016 to be down slightly compared to 2015, subject to the outcome of the strategic review of the Cellulose Fibers business and our transaction with Plum Creek. The amount we spend on capital expenditures could change due to:
| • | future economic conditions, |
| • | environmental regulations, |
| • | changes in the composition of our business, |
| • | weather and |
| • | timing of equipment purchases. |
WEYERHAEUSER COMPANY > 2015 ANNUAL REPORT AND FORM 10-K 46
NOTE RECEIVABLE
In 2014, we received $25 million in full payment of a note receivable and interest of $7 million made in connection with the divestiture of our hardwoods operations in 2011, which is recorded in "Other" in the "Cash flows from investing activities" in our Consolidated Statement of Cash Flows.
VARIABLE INTEREST ENTITIES
In 2013, we repaid a $162 million note and received $184 million related to one of our timber monetization special-purpose entities (SPEs) undertaken in 2003. Net proceeds were $22 million. More information about these entities, which were formed in connection with the sale of nonstrategic timberlands in 2003, can be found in Note 10: Variable Interest Entities in the Notes to Consolidated Financial Statements and our annual report on Form 10-K for 2003.
EQUITY AFFILIATES
In 2013, we sold part of our investment in Liaison Technologies Inc. and received $10 million in cash, which is recorded in "Other" in the "Cash flows from investing activities" in our Consolidated Statement of Cash Flows. See Note 8: Equity Affiliates in the Notes to Consolidated Financial Statements for more information.
PROCEEDS FROM THE SALE OF NONSTRATEGIC ASSETS
Proceeds received from the sale of various nonstrategic assets over the last three years were:
| • | $19 million in 2015, |
| • | $28 million in 2014 and |
| • | $20 million in 2013. |
FINANCING
Cash from financing activities includes:
| • | issuances and payments of long-term debt, |
| • | borrowings and payments under revolving lines of credit, |
| • | changes in book overdrafts, |
| • | proceeds from stock offerings and option exercises and |
| • | payments of cash dividends and repurchasing stock. |
Consolidated net cash provided by (used in) financing activities was:
| • | $(1,145) million in 2015, |
| • | $(704) million in 2014 and |
| • | $762 million in 2013. |
COMPARING 2015 WITH 2014
Net cash used in financing activities increased $441 million in 2015, primarily due to an increase in share repurchases and common stock dividends. This was partially offset by a decrease in stock option exercises.
COMPARING 2014 WITH 2013
Net cash provided by financing activities changed $1,466 million to an outflow in 2014 as compared with an inflow in 2013, primarily due to the issuance of common and preference shares and debt in 2013. This was partially offset by a decrease in payments on debt and share repurchases in 2014. We had no payments on debt in 2014 and $1,567 million in 2013. We repurchased $203 million of shares in 2014 and none in 2013.
LONGVIEW TIMBER PURCHASE
In order to finance our purchase of Longview Timber, see Note 4: Acquisitions in the Notes to Consolidated Financial Statements for more information, we issued the following:
| • | 29 million common shares on June 24, 2013, at the price of $27.75 per share for net proceeds of $781 million; |
| • | 4.4 million common shares on July 8, 2013, at the price of $27.75 per share for net proceeds of $116 million, in connection with the exercise of an overallotment option; and |
| • | 13.8 million of our 6.375 percent Mandatory Convertible Preference Shares, Series A, par value $1.00 and liquidation preference of $50.00 per share on June 24, 2013, for net proceeds of $669 million. |
We paid $11 million in fees related to a bridge loan in 2013, which is recorded in "Other" in the "Cash flows from financing activities" in our Consolidated Statement of Cash Flows. As of the close of the Longview Timber purchase, we did not draw from the loan and these fees were expensed in 2013.
In order to repay the debt that we assumed in the acquisition of Longview Timber, in 2013 we issued $500 million of 4.625 percent notes due September 15, 2023. The net proceeds after deducting the discount, underwriting fees and issuance costs were $495 million. We also entered into a $550 million 7-year senior unsecured term loan credit facility maturing in September 2020 and borrowed $550 million. Borrowings are at LIBOR plus a spread or at other interest rates mutually agreed upon between the borrower and the lending banks.
On October 15, 2013, we repaid the $1,118 million carrying value of the debt that we assumed in the acquisition of Longview Timber and related fees, expenses and premiums using the proceeds from the notes issued and the borrowings from our term loan credit facility borrowed in 2013. A pretax charge of $25 million was included in our net interest expense in 2013, for early retirement premiums, unamortized debt issuance costs and other miscellaneous charges in connection with the early extinguishment of debt. See Note 4: Longview Timber Purchase in the Notes to Consolidated Financial Statements for more information.
WEYERHAEUSER COMPANY > 2015 ANNUAL REPORT AND FORM 10-K 47
DEBT
Our consolidated long-term debt was $4.9 billion as of December 31, 2015, December 31, 2014 and December 31, 2013. Long-term debt proceeds were $1,050 million in 2013.
During 2014, our wholly-owned subsidiary, WRECO, issued $450 million of unsecured and unsubordinated senior debt obligations bearing an interest rate of 4.375 percent due June 15, 2019 and $450 million of unsecured and unsubordinated senior debt obligations bearing an interest rate of 5.875 percent due June 15, 2024. The net proceeds were deposited into an escrow account. Upon closure of the transaction, the newly issued debt and remaining proceeds were acquired by TRI Pointe, along with other WRECO assets and liabilities.
There were no long-term debt retirements in 2015 and 2014. We retired $409 million of long-term debt according to its scheduled maturity in 2013. Additionally, we retired $1,158 million of long-term debt in 2013 prior to its scheduled maturity. The loss recognized on early extinguishment of debt and included in our net interest expense was $25 million.
There are no debt maturities in the next twelve months.
See Note 3: Discontinued Operations and Note 13: Long-Term Debt in the Notes to Consolidated Financial Statements for more information.
REVOLVING CREDIT FACILITIES
During September 2013, Weyerhaeuser Company and WRECO entered into a new $1 billion 5-year senior unsecured revolving credit facility that expires in September 2018. This replaced a $1 billion revolving credit facility that was set to expire June 2015. As of June 16, 2014, WRECO terminated its participation as a borrower in the facility.
There were no net proceeds from the issuance of debt or from borrowings (repayments) under our available credit facility in 2015, 2014 or 2013.
Debt covenants:
As of December 31, 2015, Weyerhaeuser Company:
| • | had no borrowings outstanding under our credit facility and |
| • | was in compliance with the credit facility covenants. |
Weyerhaeuser Company Covenants:
Key covenants related to Weyerhaeuser Company include the requirement to maintain:
| • | a minimum defined net worth of $3.0 billion; |
| • | a defined debt-to-total-capital ratio of 65 percent or less; and |
| • | ownership of, or long-term leases on, no less than four million acres of timberlands. |
Weyerhaeuser Company’s defined net worth is comprised of:
| • | total Weyerhaeuser shareholders’ interest, |
| • | excluding accumulated comprehensive income (loss) related to pension and postretirement benefits, |
| • | minus Weyerhaeuser Company’s investment in our unrestricted subsidiaries. |
Total Weyerhaeuser Company capitalization is comprised of:
| • | total Weyerhaeuser Company debt |
| • | plus total defined net worth. |
As of December 31, 2015, Weyerhaeuser Company had:
| • | a defined net worth of $6.3 billion and |
| • | a defined debt-to-total-capital ratio of 44 percent. |
There are no other significant financial debt covenants related to our third party debt. See Note 12: Lines of Credit in the Notes to Consolidated Financial Statements for more information.
CREDIT RATINGS
On January 21, 2015, Standard & Poor's upgraded our long-term issuer credit ratings from BBB- to BBB and short-term issuer credit ratings from A-3 to A-2. On November 9, 2015, Standard & Poor's announced that our credit rating would likely be lowered from BBB to BBB- upon completion of our merger with Plum Creek.
On April 14, 2015, Moody's Investors Service upgraded our long-term issuer credit ratings from Baa3 to Baa2. On June 12, 2014, Moody's Investors Service changed their outlook on our senior unsecured notes to positive. On April 22, 2013, Moody's Investors Service upgraded our senior unsecured note rating to Baa3 from Ba1 and changed their outlook to stable.
OPTION EXERCISES
Our cash proceeds from the exercise of stock options were:
| • | $34 million in 2015, |
| • | $119 million in 2014 and |
| • | $162 million in 2013. |
Our average stock price was $31.67, $31.89 and $29.69 in 2015, 2014 and 2013, respectively.
WEYERHAEUSER COMPANY > 2015 ANNUAL REPORT AND FORM 10-K 48
DIVIDENDS
We paid cash dividends on commons shares of:
| • | $619 million in 2015, |
| • | $563 million in 2014 and |
| • | $458 million in 2013. |
Changes in the amount of dividends we paid were primarily due to:
| • | an increase in our quarterly dividend from 17 cents per share to 20 cents per share in April 2013; |
| • | an increase in our quarterly dividend from 20 cents per share to 22 cents per share in August 2013; |
| • | an increase in our quarterly dividend from 22 cents per share to 29 cents per share in August 2014; and |
| • | an increase in our quarterly dividend from 29 cents per share to 31 cents per share in August 2015. |
We paid cash dividends on preference shares of $44 million in 2015.
Our dividends declared on preference shares were:
| • | 85.88 cents per share in August 2013 and |
| • | 79.69 cents per share in October 2013; February, April, August and October 2014; and February, May, August and October 2015. |
On February 10, 2016, our board of directors declared a dividend of 31 cents per share, payable on March 18, 2016, to shareholders of record at the close of business March 8, 2016. Additionally, our board of directors declared a dividend of 79.69 cents per share on our 6.375 percent Mandatory Convertible Preference Shares, Series A, payable on April 1, 2016, to shareholders of record at the close of business March 15, 2016.
STOCK REPURCHASES
On August 13, 2014, our board of directors approved a stock repurchase program under which we were authorized to repurchase up to $700 million of outstanding shares (the 2014 Repurchase Program). The 2014 Repurchase Program replaced the prior 2011 stock repurchase program. During 2014, we repurchased 6,062,993 shares of common stock for $203 million under the 2014 Repurchase Program. During 2015 we completed the 2014 Repurchase Program by repurchasing 15,471,962 shares of common stock for $497 million. All common stock purchases under the stock repurchase program were made in open-market transactions.
On August 27, 2015 our board of directors approved a new share repurchase program of up to $500 million on outstanding shares (the 2015 Repurchase Program), commencing upon completion of the 2014 Repurchase Program. During 2015, we repurchased 717,464 shares of common stock for $22 million under the 2015 Repurchase Program. As of December 31, 2015 we had remaining authorization of $478 million for future stock repurchases. All common stock purchases under the stock repurchase program were made in open-market transactions. We had 510,483,285 shares of common stock outstanding as of December 31, 2015.
On November 8, 2015 Weyerhaeuser announced it intends to execute a $2.5 billion share repurchase shortly after closing the merger with Plum Creek Timber Company, Inc. As of December 31, 2015 no portion of this announced repurchase has been completed. The remaining $478 million authorized for the 2015 Repurchase Program is expected to be used in the announced post-merger repurchase.
WEYERHAEUSER COMPANY > 2015 ANNUAL REPORT AND FORM 10-K 49
OUR CONTRACTUAL OBLIGATIONS AND COMMERCIAL COMMITMENTS
More details about our contractual obligations and commercial commitments are in Note 9: Pension and Other Postretirement Benefit Plans, Note 13: Long-Term Debt, Note 15: Legal Proceedings, Commitments and Contingencies and Note 20: Income Taxes in the Notes to Consolidated Financial Statements.
Significant Contractual Obligations as of December 31, 2015
| DOLLAR AMOUNTS IN MILLIONS | |||||||||||||||
| PAYMENTS DUE BY PERIOD | |||||||||||||||
| TOTAL | LESS THAN 1 YEAR | 1–3 YEARS | 3–5 YEARS | MORE THAN 5 YEARS | |||||||||||
| Long-term debt obligations | $ | 4,896 | $ | — | $ | 343 | $ | 1,050 | $ | 3,503 | |||||
| Interest(1) | 3,380 | 321 | 619 | 554 | 1,886 | ||||||||||
| Operating lease obligations | 210 | 27 | 47 | 31 | 105 | ||||||||||
| Purchase obligations(2) | 146 | 84 | 41 | 4 | 17 | ||||||||||
| Harvest commitments(3) | 1 | — | — | — | 1 | ||||||||||
| Employee-related obligations(4) | 486 | 155 | 56 | 41 | 91 | ||||||||||
| Liabilities related to unrecognized tax benefits(5) | 7 | — | — | — | — | ||||||||||
| Total | $ | 9,126 | $ | 587 | $ | 1,106 | $ | 1,680 | $ | 5,603 | |||||
| (1) Amounts presented for interest payments assume that all long-term debt obligations outstanding as of December 31, 2015 will remain outstanding until maturity, and interest rates on variable-rate debt in effect as of December 31, 2015 will remain in effect until maturity. (2) Purchase obligations include agreements to purchase goods or services that are enforceable and legally binding on the company and that specify all significant terms, including: fixed or minimum quantities to be purchased; fixed, minimum or variable price provisions; and the approximate timing of the transaction. Purchase obligations exclude arrangements that the company can cancel without penalty. (3) Harvest commitments are purchased at market value and can be resold at market value in the future. (4) The timing of certain of these payments will be triggered by retirements or other events. These payments can include workers' compensation, deferred compensation and banked vacation, among other obligations. When the timing of payment is uncertain, the amounts are included in the total column only. Minimum pension funding is required by established funding standards and estimates are not made beyond 2016. Estimated payments of contractually obligated postretirement benefits are not included due to the uncertainty of payment timing. (5) We have recognized total liabilities related to unrecognized tax benefits of $7 million as of December 31, 2015, including interest of $1 million. The timing of payments related to these obligations is uncertain; however, none of this amount is expected to be paid within the next year. |
| OFF-BALANCE SHEET ARRANGEMENTS |
Off-balance sheet arrangements have not had — and are not reasonably likely to have — a material effect on our current or future financial condition, results of operations or cash flows. Note 10: Variable Interest Entities and Note 12: Lines of Credit in the Notes to Consolidated Financial Statements contain our disclosures of:
| • | surety bonds, |
| • | letters of credit and guarantees and |
| • | information regarding variable interest entities. |
| ENVIRONMENTAL MATTERS, LEGAL PROCEEDINGS AND OTHER CONTINGENCIES |
See Note 15: Legal Proceedings, Commitments and Contingencies in the Notes to Consolidated Financial Statements.
| ACCOUNTING MATTERS |
CRITICAL ACCOUNTING POLICIES
Our critical accounting policies involve a higher degree of judgment and estimates. They also have a high degree of complexity.
In accounting, we base our judgments and estimates on:
| • | historical experience and |
| • | assumptions we believe are appropriate and reasonable under current circumstances. |
Actual results, however, may differ from the estimated amounts we have recorded.
Our most critical accounting policies relate to our:
| • | pension and postretirement benefit plans; |
| • | potential impairments of long-lived assets; and |
| • | legal, environmental and product liability reserves. |
Details about our other significant accounting policies — what we use and how we estimate — are in Note 1: Summary of Significant Accounting Policies in the Notes to Consolidated Financial Statements.
WEYERHAEUSER COMPANY > 2015 ANNUAL REPORT AND FORM 10-K 50
PENSION AND POSTRETIREMENT BENEFIT PLANS
We sponsor several pension and postretirement benefit plans for our employees. Key assumptions we use in accounting for the plans include our:
| • | expected long-term rate of return on plan assets, |
| • | discount rates, |
| • | anticipated trends in health care costs, |
| • | assumed increases in salaries and |
| • | mortality rates. |
At the end of every year, we review our assumptions with external advisers and make adjustments as appropriate. Actual experience that differs from our assumptions or any changes in our assumptions could have a significant effect on our financial position, results of operations and cash flows.
Other factors that affect our accounting for the plans include:
| • | actual pension fund performance, |
| • | level of lump sum distributions, |
| • | plan changes and amendments, |
| • | changes in plan participation or coverage and |
| • | portfolio changes and restructuring. |
This section provides more information about our:
| • | expected long-term rate of return and |
| • | discount rates. |
Expected Long-Term Rate of Return on Plan Assets
Plan assets are assets of the pension plan trusts that fund the benefits provided under the pension plans. The expected long-term rate of return is our estimate of the long-term rate of return that our plan assets will earn. Our expected long-term rate of return is important in determining the net periodic benefit or cost we recognize for our plans.
Over the 30 years it has been in place, our U.S. pension trust investment strategy has achieved a 14.2 percent net compound annual return rate.
After considering available information at the end of 2015, we continue to assume an expected long-term rate of return of 9.0 percent. Factors we considered include:
| • | the net compounded annual return of 8.0 percent achieved by our U.S. pension trust investment strategy the past 5 years and |
| • | current and expected valuation levels in the global equity and credit markets. |
Our expected long-term rate of return is important in determining the net periodic benefit or cost we recognize for our plans. Every 0.5 percent decrease in our expected long-term rate of return would increase expense or reduce a credit by approximately:
| • | $24 million for our U.S. qualified pension plans and |
| • | $4 million for our Canadian registered pension plans. |
The actual return on plan assets in any given year may vary from our expected long-term rate of return. Actual returns on plan assets affect the funded status of the plans. Differences between actual returns on plan assets and the expected long-term rate of return are reflected as adjustments to cumulative other comprehensive income (loss), a component of total equity.
Discount Rates
Our discount rates as of December 31, 2015, are:
| • | 4.5 percent for our U.S. pension plans — compared with 4.1 percent at December 31, 2014; |
| • | 4.0 percent for our U.S. postretirement plans — compared with 3.6 percent at December 31, 2014; |
| • | 4.0 percent for our Canadian pension plans — compared with 3.9 percent at December 31, 2014; and |
| • | 3.9 percent for our Canadian postretirement plans — compared with 3.8 percent at December 31, 2014. |
We review our discount rates annually and revise them as needed. The discount rates are selected at the measurement date by matching current spot rates of high-quality corporate bonds with maturities similar to the timing of expected cash outflows for benefits.
Pension and postretirement benefit expenses for 2016 will be based on the 4.5 percent and 4.0 percent assumed discount rates for U.S. plans and 4 percent and 3.9 percent assumed discount rates for the Canadian plans.
Our discount rates are important in determining the cost of our plans. A 0.5 percent decrease in our discount rate would increase expense or reduce a credit by approximately:
| • | $35 million for our U.S. qualified pension plans and |
| • | $5 million for our Canadian registered pension plans. |
WEYERHAEUSER COMPANY > 2015 ANNUAL REPORT AND FORM 10-K 51
LONG-LIVED ASSETS
We review the carrying value of our long-lived assets whenever events or changes in circumstances indicate that the carrying value of the assets may not be recoverable through future operations. The carrying value is the amount assigned to long-lived assets in our financial statements.
An impairment occurs when the carrying value of long-lived assets will not be recovered from future cash flows and is more than fair market value. Fair market value is the estimated amount we would receive if we were to sell the assets.
In determining fair market value and whether impairment has occurred, we are required to estimate:
| • | future cash flows, |
| • | residual values and |
| • | fair values of the assets. |
Key assumptions we use in developing the estimates include:
| • | probability of alternative outcomes, |
| • | product pricing, |
| • | raw material costs, |
| • | product sales and |
| • | discount rate. |
CONTINGENT LIABILITIES
We are subject to lawsuits, investigations and other claims related to environmental, product and other matters, and are required to assess the likelihood of any adverse judgments or outcomes to these matters, as well as potential ranges of probable losses.
We record contingent liabilities when:
| • | it becomes probable that we will have to make payments and |
| • | the amount of loss can be reasonably estimated. |
Assessing probability of loss and estimating probable losses requires analysis of multiple factors, including:
| • | historical experience, |
| • | judgments about the potential actions of third party claimants and courts and |
| • | recommendations of legal counsel. |
In addition to contingent liabilities recorded for probable losses, we disclose contingent liabilities when there is a reasonable possibility that an ultimate loss may occur.
While we do our best in developing our projections, recorded contingent liabilities are based on the best information available and actual losses in any future period are inherently uncertain. If estimated probable future losses or actual losses exceed our recorded liability for such claims, we would record additional charges in other (income) expense, net. These exposures and proceedings can be significant and the ultimate negative outcomes could be material to our operating results or cash flow in any given quarter or year. See Note 15: Legal Proceedings, Commitments and Contingencies in the Notes to Consolidated Financial Statements for more information.
PROSPECTIVE ACCOUNTING PRONOUNCEMENTS
A summary of prospective accounting pronouncements is in Note 1: Summary of Significant Accounting Policies in the Notes to Consolidated Financial Statements.
WEYERHAEUSER COMPANY > 2015 ANNUAL REPORT AND FORM 10-K 52
| PERFORMANCE MEASURES |
We use Adjusted Earnings before Interest, Taxes, Depreciation, Depletion and Amortization (Adjusted EBITDA) as a key performance measure to evaluate the performance of the consolidated company and our business segments. This measure should not be considered in isolation from and is not intended to represent an alternative to our results reported in accordance with U.S. generally accepted accounting principles (U.S. GAAP). However, we believe Adjusted EBITDA provides meaningful supplemental information about our operating performance, better facilitates period to period comparisons, and is widely used by analysts, lenders, rating agencies and other interested parties.Our definition of Adjusted EBITDA may be different from similarly titled measures reported by other companies. Adjusted EBITDA, as we define it, is operating income from continuing operations adjusted for depreciation, depletion, amortization, pension and postretirement costs not allocated to business segments (primarily interest cost, expected return on plan assets, amortization of actuarial loss and amortization of prior service cost/credit), special items and discontinued operations.
Adjusted EBITDA by Segment
| DOLLAR AMOUNTS IN MILLIONS | |||||||||
| 2015 | 2014 | 2013 | |||||||
| Timberlands | $ | 758 | $ | 820 | $ | 632 | |||
| Wood Products | 372 | 446 | 574 | ||||||
| Cellulose Fibers | 378 | 447 | 353 | ||||||
| 1,508 | 1,713 | 1,559 | |||||||
| Unallocated Items | (86 | ) | (79 | ) | (61 | ) | |||
| Total | $ | 1,422 | $ | 1,634 | $ | 1,498 |
We reconcile Adjusted EBITDA to net earnings for the consolidated company and to operating income for the business segments, as those are the most directly comparable U.S. GAAP measures for each.
The table below reconciles Adjusted EBITDA to net income by segment during the year ended 2015:
| DOLLAR AMOUNTS IN MILLIONS | |||||||||||||||
| Timberlands | Wood Products | Cellulose Fibers | Unallocated Items | Total | |||||||||||
| Net earnings | $ | 506 | |||||||||||||
| Earnings from discontinued operations, net of taxes | — | ||||||||||||||
| Interest expense, net of capitalized interest | 347 | ||||||||||||||
| Income taxes | (3 | ) | |||||||||||||
| Net contribution to earnings | $ | 549 | $ | 258 | $ | 119 | $ | (76 | ) | $ | 850 | ||||
| Loss from equity affiliates | — | — | 105 | — | 105 | ||||||||||
| Interest income and other | — | — | — | (36 | ) | (36 | ) | ||||||||
| Operating income | 549 | 258 | 224 | (112 | ) | 919 | |||||||||
| Depreciation, depletion and amortization | 209 | 106 | 154 | 10 | 479 | ||||||||||
| Non-operating pension and postretirement credits | — | — | — | (11 | ) | (11 | ) | ||||||||
| Special items(1)(2) | — | 8 | — | 27 | 35 | ||||||||||
| Total | $ | 758 | $ | 372 | $ | 378 | $ | (86 | ) | $ | 1,422 | ||||
| (1) Special items included in Wood Products are pre-tax restructuring charges related to the closure of four distribution centers. (2) Special items included in Unallocated Items consist of a $13 million noncash impairment charge related to a nonstrategic asset that was sold in the second quarter and $14 million of Plum Creek merger-related costs. |
WEYERHAEUSER COMPANY > 2015 ANNUAL REPORT AND FORM 10-K 53
The table below reconciles Adjusted EBITDA to net income by segment during the year ended 2014:
| DOLLAR AMOUNTS IN MILLIONS | |||||||||||||||
| Timberlands | Wood Products | Cellulose Fibers | Unallocated Items | Total | |||||||||||
| Net earnings | $ | 1,826 | |||||||||||||
| Earnings from discontinued operations, net of taxes | (998 | ) | |||||||||||||
| Interest expense, net of capitalized interest | 344 | ||||||||||||||
| Income taxes | 185 | ||||||||||||||
| Net contribution to earnings | $ | 613 | $ | 327 | $ | 291 | $ | 126 | $ | 1,357 | |||||
| Loss from equity affiliates | — | — | 1 | — | 1 | ||||||||||
| Interest income and other | — | — | — | (38 | ) | (38 | ) | ||||||||
| Operating income | 613 | 327 | 292 | 88 | 1,320 | ||||||||||
| Depreciation, depletion and amortization | 207 | 119 | 155 | 12 | 493 | ||||||||||
| Non-operating pension and postretirement credits | — | — | — | (45 | ) | (45 | ) | ||||||||
| Special items(1) | — | — | — | (134 | ) | (134 | ) | ||||||||
| Total | $ | 820 | $ | 446 | $ | 447 | $ | (79 | ) | $ | 1,634 | ||||
| (1) Special items include: a $151 million pretax gain related to a previously announced postretirement plan amendment, $39 million in restructuring and closure charges related to our selling, general and administrative cost reduction initiative and a $22 million pretax gain on the sale of a landfill in Washington State. |
The table below reconciles Adjusted EBITDA to net income by segment during the year ended 2013:
| DOLLAR AMOUNTS IN MILLIONS | |||||||||||||||
| Timberlands | Wood Products | Cellulose Fibers | Unallocated Items | Total | |||||||||||
| Net earnings | $ | 563 | |||||||||||||
| Earnings from discontinued operations, net of taxes | (72 | ) | |||||||||||||
| Interest expense, net of capitalized interest | 369 | ||||||||||||||
| Income taxes | (171 | ) | |||||||||||||
| Net contribution to earnings | $ | 470 | $ | 441 | $ | 200 | $ | (422 | ) | $ | 689 | ||||
| (Earnings) loss from equity affiliates | — | — | (3 | ) | 2 | (1 | ) | ||||||||
| Interest income and other | (4 | ) | — | — | (50 | ) | (54 | ) | |||||||
| Operating income | 466 | 441 | 197 | (470 | ) | 634 | |||||||||
| Depreciation, depletion and amortization | 166 | 123 | 156 | 13 | 458 | ||||||||||
| Non-operating pension and postretirement costs | — | — | — | 40 | 40 | ||||||||||
| Special items(1)(2) | — | 10 | — | 356 | 366 | ||||||||||
| Total | $ | 632 | $ | 574 | $ | 353 | $ | (61 | ) | $ | 1,498 | ||||
| (1) Special Items included in Wood Products consist of a $9 million noncash impairment charge and $1 million of restructuring charges related to the closure of our engineered wood products facility in Colbert, Georgia. (2) Special items included in Unallocated Items consists of a $356 million noncash impairment charge for Coyote Springs, a nonstrategic asset that was sold in 2014. |
WEYERHAEUSER COMPANY > 2015 ANNUAL REPORT AND FORM 10-K 54
Previous: Item 6. SELECTED FINANCIAL DATA · Next: Item 7A. QUANTITATIVE AND QUALITATIVE DISCLOSURES ABOUT MARKET RISK