 filings.tools
Item 1. OUR BUSINESS
91K characters. Original on sec.gov ·
Item 1. OUR BUSINESS
OUR BUSINESS
We are one of the world's largest private owners of timberlands. We own or control 11.5 million acres of timberlands in the U.S. and manage an additional 14.0 million acres of timberlands under long-term licenses in Canada. We manage these timberlands on a sustainable basis in compliance with internationally recognized forestry standards. Our objective is to maximize the long-term value of timberlands we own. We analyze each timberland acre comprehensively to understand its highest-value use. We realize this value in many ways, particularly through growing and harvesting the trees, but also by selling properties when we can create incremental value. In addition, we focus on opportunities to realize value through lease and royalty agreements for the surface and subsurface rights that exist in our ownership.
We are also one of the largest manufacturers of wood products in North America. We manufacture and distribute high-quality wood products, including structural lumber, oriented strand board, engineered wood products and other specialty products. These products are primarily supplied to the residential, multi-family, industrial, light commercial as well as repair and remodel markets. We operate 35 manufacturing facilities in the United States and Canada.
Our company is a real estate investment trust (REIT).
Sustainability and citizenship are part of our core values. In addition to practicing sustainable forestry, we focus on increasing energy and resource efficiency, reducing greenhouse gas emissions, reducing water consumption, conserving natural resources and offering sustainable products that meet our customers' needs. We operate with world-class safety results, actively support the communities in which we operate and strive to communicate transparently with our investors and other stakeholders. We are the only North American forest products company included on the Dow Jones Sustainability North America Index, and we are also recognized for our leading performance in the areas of ethics, citizenship and gender equality.
In 2019, we generated $6.6 billion in net sales and employed approximately 9,400 people who serve customers worldwide.
This portion of our Annual Report on Form 10-K provides detailed information about who we are, what we do and where we are headed. Unless otherwise specified, current information reported in this Form 10-K is as of or for the fiscal year ended December 31, 2019.
We break out financial information such as revenues, earnings and assets by the business segments that form our company. We also discuss the geographic areas where we do business.
Throughout this Form 10-K, unless specified otherwise, references to “we,” “our,” “us” and “the company” refer to the consolidated company.
WE CAN TELL YOU MORE
AVAILABLE INFORMATION
We meet the information reporting requirements of the Securities Exchange Act of 1934 by filing periodic reports (annual reports on Form 10-K, quarterly reports on Form 10-Q), current reports on Form 8-K, proxy statements and other information with the Securities and Exchange Commission (SEC). These reports and statements, which contain information about our company’s business, financial results, corporate governance and other matters, as well as amendments to these reports and statements, are available at:
| • | the SEC website — www.sec.gov and |
|---|
| • | our website (free of charge) — www.weyerhaeuser.com. |
|---|
When we file or furnish information electronically with the SEC, it is also posted to our website.
WHO WE ARE
We were incorporated as Weyerhaeuser Timber Company in the state of Washington in January 1900, when Frederick Weyerhaeuser and 15 partners bought 900,000 acres of timberland. Today, we are working to be the world's premier timber, land and forest products company for our shareholders, customers and employees.
REAL ESTATE INVESTMENT TRUST (REIT) ELECTION
Starting with our 2010 fiscal year, we elected to be taxed as a REIT. REIT income can be distributed to shareholders without first paying corporate level tax, substantially eliminating the double taxation on income. We expect to derive most of our REIT income from our timberlands, including gains from the sales of our standing timber and rent from recreational leases. We continue to be required to pay federal corporate income taxes on earnings of our Taxable REIT Subsidiaries (TRSs), which include our Wood Products segment and a portion of our Timberlands and Real Estate, Energy and Natural Resources segments.
WEYERHAEUSER COMPANY > 2019 ANNUAL REPORT AND FORM 10-K 1
OUR BUSINESS SEGMENTS
In our Management’s Discussion and Analysis of Financial Condition and Results of Operations (MD&A) section you will find discussion of our overall performance results for our business segments, which are as follows:
| • | Timberlands; |
|---|
| • | Real Estate, Energy and Natural Resources (Real Estate & ENR) and |
|---|
| • | Wood Products. |
|---|
Detailed financial information about our business segments and our geographic locations is provided in Note 2: Business Segments and Note 22: Geographic Areas.
EFFECT OF MARKET CONDITIONS
The health of the U.S. housing market strongly affects the performance of all our business segments. Wood Products primarily sells into the new residential building and repair and remodel markets. Demand for logs from our Timberlands segment is affected by production levels of domestic wood-based building products as well as export markets. Real Estate is affected by local real estate market conditions, such as the level of supply or demand for properties sharing the same or similar characteristics as our timberlands. Energy and Natural Resources is affected by underlying demand for commodities, including oil, gas and minerals.
COMPETITION IN OUR MARKETS
We operate in highly competitive domestic and foreign markets, with numerous companies selling similar products. Many of our products also face competition from substitutes for wood products. We compete in our markets primarily through product quality, service levels and price. We are relentlessly focused on operational excellence, producing quality products customers want and are willing to pay for, at the lowest possible cost.
Our business segments’ competitive strategies are as follows:
| • | Timberlands — Deliver maximum timber value from every acre we own or manage. |
|---|
| • | Real Estate & ENR — Deliver premiums to timberland value by identifying and monetizing higher and better use lands and capturing the full value of surface and subsurface assets. |
|---|
| • | Wood Products — Manufacture high-quality structural lumber, oriented strand board and engineered wood products, as well as deliver complementary building products for residential, multi-family, industrial and light commercial applications at competitive costs. |
|---|
OUR EMPLOYEES
We have approximately 9,400 employees. Of these employees, approximately 2,400 are members of unions covered by multi-year collective-bargaining agreements.
WHAT WE DO
This section provides information about how we:
| • | grow and harvest trees, |
|---|
| • | maximize the value of every acre we own and |
|---|
| • | manufacture and sell wood products. |
|---|
For each of our business segments, we provide details about what we do, where we do it, how much we sell and where we are headed.
TIMBERLANDS
Our Timberlands segment manages 11.5 million acres of private commercial timberlands in the U.S. We own 10.8 million of those acres and control the remaining acres through long-term contracts. In addition, we have renewable, long-term licenses on 14.0 million acres of Canadian timberlands.
WHAT WE DO
Forestry Management
Our Timberlands segment:
| • | plants seedlings to reforest harvested areas using the most effective regeneration method for the site and species (natural regeneration is employed and managed in parts of Canada and the northern U.S.); |
|---|
| • | manages our timberlands as the trees grow to maturity; |
|---|
| • | harvests trees to be converted into lumber, wood products, pellets, pulp and paper; |
|---|
WEYERHAEUSER COMPANY > 2019 ANNUAL REPORT AND FORM 10-K 2
| • | manages the health of our forests to sustainably maximize harvest volumes, minimize risks, and protect unique environmental, cultural, historical and recreational value and |
|---|
| • | offers recreational access. |
|---|
We seek to maximize the returns from our timberlands by selling delivered logs and through stumpage sales to both internal and external customers. We leverage our expertise in forestry using research and planning systems to optimize log production and innovative planting and harvesting techniques across varying terrain. We use intensive, customized silviculture to increase forest productivity and returns while managing our forests on a sustainable basis. We use our scale, infrastructure and supply chain expertise to deliver reliable and consistent supply to our customers.
Competitive factors within each of our market areas generally include price, species, grade, quality, proximity to wood consuming facilities and the ability to consistently meet customer requirements. We compete in the marketplace through our ability to provide customers with a consistent and reliable supply of high-quality logs at scale volumes and competitive prices. Our customers also value our status as a Sustainable Forestry Initiative® (SFI) certified supplier.
Sustainable Forestry Practices
We manage our forests intensively to maximize the value of every acre and produce a sustainable supply of wood fiber for our customers. At the same time, we are careful to protect biological diversity, water quality and other ecosystem values. Our working forests also provide unique environmental, cultural, historical and recreational value. We work hard to protect these and other qualities, while still managing our forests to produce financially mature timber. We follow regulatory requirements, voluntary standards and certify 100 percent of our North American timberlands under the SFI Forest Management Standard.
Canadian Forestry Operations
In Canada, we manage timberlands under long-term licenses that provide the primary source of the raw material for our manufacturing facilities in various provinces. When we harvest trees, we pay the provinces at stumpage rates set by the government. We transfer logs to our manufacturing facilities at cost and do not generate any significant profit from the harvest of timber from the licensed acres in Canada.
Timberlands Products
| PRODUCTS | HOW THEY’RE USED |
| Delivered logs: • Grade logs • Fiber logs | Grade logs are made into lumber, plywood, veneer and other products used in residential homes, commercial structures, furniture, industrial and decorative applications. Fiber logs are sold to pulp, paper and oriented strand board mills to make products used for printing, writing, packaging, homebuilding and consumer products, as well as into renewable energy and pellets. |
| Timber | Standing timber is sold to third parties through stumpage sales. |
| Recreational leases | Timberlands are leased or permitted for recreational purposes. |
| Other products | Seed and seedlings grown in the U.S. and wood chips. |
HOW WE MEASURE OUR PRODUCT
We use multiple units of measure when transacting business including:
| • | Thousand board feet (MBF) — used in the West to measure the expected lumber recovery from a tree or log and |
|---|
| • | Green tons (GT) — used in the South to measure weight; factors used for conversion to product volume can vary by species, size, location and season. |
|---|
We report Timberlands volumes in ton equivalents.
WHERE WE DO IT
As of December 31, 2019, we sustainably managed timberlands in 19 states. This included owned or contracted acres in the following locations:
| • | 2.9 million acres in the western U.S. (Oregon and Washington); |
|---|
| • | 6.8 million acres in the southern U.S. (Alabama, Arkansas, Florida, Georgia, Louisiana, Mississippi, North Carolina, Oklahoma, South Carolina, Texas and Virginia) and |
|---|
| • | 1.8 million acres in the northern U.S. (Maine, Montana, New Hampshire, Vermont, West Virginia and Wisconsin). |
|---|
In Canada, we manage timberlands under long-term licenses that provide raw material for our manufacturing facilities. These licenses are in Alberta, British Columbia, Ontario and Saskatchewan.
Our total timber inventory — including timber on owned and contracted land — is approximately 595 million tons. The amount of timber inventory does not translate into an amount of lumber or panel products because the quantity of end products varies according to the species, size and quality of the timber and will change over time as these variables adjust.
WEYERHAEUSER COMPANY > 2019 ANNUAL REPORT AND FORM 10-K 3
We maintain our timber inventory in an integrated resource inventory system and geographic information system (GIS). The resource inventory component of the system is proprietary and is largely based on internally developed methods, including growth and yield models developed by our research and development organization. The GIS component is based on GIS software that is viewed as the standard in our industry.
Timber inventory data collection and verification techniques include the use of industry standard field sampling procedures as well as proprietary remote sensing technologies in some geographies. The data is collected and maintained at the timber stand level.
We also own and operate nurseries and seed orchards in Alabama, Arkansas, Georgia, Louisiana, Mississippi, Oregon, South Carolina and Washington.
Summary of 2019 Standing Timber Inventory
| GEOGRAPHIC AREA | MILLIONS OF TONS AT DECEMBER 31, 2019 | |||
|---|---|---|---|---|
| TOTAL INVENTORY(1) | ||||
| U.S.: | ||||
| West | ||||
| Douglas fir/Cedar | 161 | |||
| Whitewood | 31 | |||
| Hardwood | 13 | |||
| Total West | 205 | |||
| South | ||||
| Southern yellow pine | 258 | |||
| Hardwood | 82 | |||
| Total South | 340 | |||
| North | ||||
| Conifer | 25 | |||
| Hardwood | 25 | |||
| Total North | 50 | |||
| Total Company | 595 | |||
| (1) | Inventory includes all conservation and non-harvestable areas. |
|---|
WEYERHAEUSER COMPANY > 2019 ANNUAL REPORT AND FORM 10-K 4
Summary of 2019 Timberland Locations
| GEOGRAPHIC AREA | THOUSANDS OF ACRES AT DECEMBER 31, 2019 | |||||||||||
|---|---|---|---|---|---|---|---|---|---|---|---|---|
| FEE OWNERSHIP | LONG-TERM CONTRACTS | TOTAL ACRES(1) | ||||||||||
| U.S.: | ||||||||||||
| West | ||||||||||||
| Oregon | 1,591 | — | 1,591 | |||||||||
| Washington | 1,297 | — | 1,297 | |||||||||
| Total West | 2,888 | — | 2,888 | |||||||||
| South | ||||||||||||
| Alabama | 385 | 201 | 586 | |||||||||
| Arkansas | 1,208 | 18 | 1,226 | |||||||||
| Florida | 222 | 83 | 305 | |||||||||
| Georgia | 601 | 50 | 651 | |||||||||
| Louisiana | 1,017 | 351 | 1,368 | |||||||||
| Mississippi | 1,128 | 52 | 1,180 | |||||||||
| North Carolina | 561 | — | 561 | |||||||||
| Oklahoma | 494 | — | 494 | |||||||||
| South Carolina | 275 | — | 275 | |||||||||
| Texas | 16 | 2 | 18 | |||||||||
| Virginia | 123 | — | 123 | |||||||||
| Total South | 6,030 | 757 | 6,787 | |||||||||
| North | ||||||||||||
| Maine | 834 | — | 834 | |||||||||
| Montana(2) | 631 | — | 631 | |||||||||
| New Hampshire | 24 | — | 24 | |||||||||
| Vermont | 86 | — | 86 | |||||||||
| West Virginia | 255 | — | 255 | |||||||||
| Wisconsin | 4 | — | 4 | |||||||||
| Total North | 1,834 | — | 1,834 | |||||||||
| Total Company | 10,752 | 757 | 11,509 | |||||||||
| (1) | Acres include all conservation and non-harvestable areas. |
|---|
| (2) | In December 2019, we announced an agreement to sell our Montana timberlands. The sale is expected to close in second quarter 2020. Refer to Note 4: Divestitures and Assets Held for Sale for further information on the Montana timberlands sale. |
|---|
We provide a year-round flow of logs to internal and external customers. We sell grade and fiber logs to manufacturers that produce a diverse range of products. We also sell standing timber to third parties and lease land for recreational purposes. Our timberlands are generally well located to take advantage of road, logging and transportation systems for efficient delivery of logs to customers.
Western United States
Our Western timberlands are well situated to serve the wood products and pulp markets in Oregon and Washington. Additionally, our location on the West Coast provides access to higher-value export markets for Douglas fir and whitewood logs to Japan, China and Korea. Our largest export market is Japan, where Douglas fir is the preferred species for higher-valued post and beam homebuilding. The size and quality of our Western timberlands, coupled with their proximity to several deep-water port facilities, competitively positions us to meet the needs of Pacific Rim log markets. For the year ended December 31, 2019, we sold 28 percent of our total Western log sales volume internally.
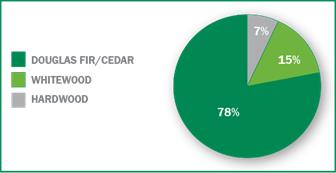
Our holdings are composed primarily of Douglas fir, a species highly valued for its structural strength, stiffness and appearance. Most of our lands are located on the west side of the Cascade Mountain Range with soil and rainfall conditions considered favorable for growing this species. Approximately 80 percent of our lands are in established Douglas fir plantations. Our remaining holdings include a mix of whitewood and hardwood.
WEYERHAEUSER COMPANY > 2019 ANNUAL REPORT AND FORM 10-K 5
Our management systems and supply chain expertise provide us a competitive operating advantage in a number of areas including forestry and research, harvesting, marketing and logistics. Additionally, our scale, diversity of timberlands ownership and infrastructure on the West Coast allow us to consistently and reliably supply logs to our internal and external customers year-round.
We sell recreational use permits covering approximately 2 million acres of our owned Western timberlands.
2019 Western U.S. Inventory by Species
2019 Western U.S. Inventory by Age / Species
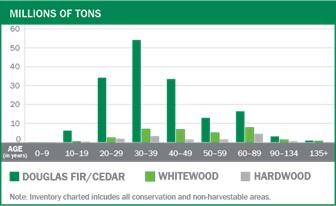
The average age of timber harvested from our Western timberlands in 2019 was 50 years. In accordance with our sustainable forestry practices, we harvest approximately 2 percent of our Western acreage each year.
Southern United States
Our Southern timberland ownership, covering 11 states, is well situated to serve domestic wood products and pulp markets, including third-party customers and our own mills. For the year ended December 31, 2019, we sold 24 percent of our total Southern log sales volume internally. Additionally, our Atlantic and Gulf coastal locations position us to serve an emerging Asian log export market. Our log inventory is comprised of 76 percent Southern yellow pine and 24 percent hardwoods.
Operationally, we focus on efficiently harvesting and hauling logs from our ownership and capitalizing on our scale and supply chain expertise to consistently and reliably serve a broad range of customers through seasonal and weather-related events year-round.
We lease approximately 95 percent of our owned Southern acreage for recreational purposes.
2019 Southern U.S. Inventory by Species

WEYERHAEUSER COMPANY > 2019 ANNUAL REPORT AND FORM 10-K 6
2019 Southern U.S. Inventory by Age / Species
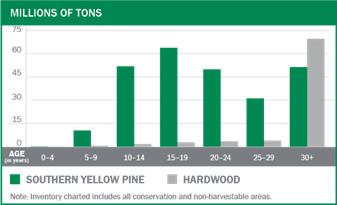
The average age of timber harvested from our Southern timberlands in 2019 was 29 years. In accordance with our sustainable forestry practices, we harvest approximately 3 percent of our acreage each year in the South.
Northern United States
We are one of the largest private owners of northern hardwood timberlands. Our Northern acres contain a diverse mix of temperate broadleaf hardwoods and mixed conifer species across timberlands located in six states. We grow over 50 species and market over 500 product grades to a diverse mix of customers.
Our large-diameter cherry, red oak and hard maple sawlogs and veneer logs serve domestic and export furniture markets. Our maple and other appearance woods are used in furniture and high-value decorative applications. In addition to high-value hardwood sawlogs, our mix includes hardwood fiber logs for pulp and oriented strand board applications. Hardwood pulpwood is a significant market in the Northern region and we have long-term supply agreements, primarily at market rates, for nearly 95 percent of our hardwood pulp production.
We also grow softwood logs that supply our lumber and plywood mills and other customers. Our competitive advantages include a merchandising program to capture the value of the premium hardwood logs.
Regeneration is predominantly natural, augmented by planting where appropriate.
2019 Northern U.S. Inventory by Species

WEYERHAEUSER COMPANY > 2019 ANNUAL REPORT AND FORM 10-K 7
2019 Northern U.S. Inventory by Age / Species

The average age of timber harvested from our Northern timberlands in 2019 was 63 years. Timber harvested in the North is sold predominantly as delivered logs to domestic mills, including our manufacturing facilities. For the year ended December 31, 2019, we sold 9 percent of our total Northern log sales volume internally. In accordance with our sustainable forestry practices, we harvest approximately 1 percent of our acreage each year in the North.
Canada — Licensed Forestlands
We manage forestlands in Canada under long-term licenses from the provincial governments to secure volume for our manufacturing facilities in various provinces. The provincial governments regulate the volume of timber that may be harvested each year through Annual Allowable Cuts (AAC), which are updated every 10 years. As of December 31, 2019, our AAC by province was:
| • | Alberta — 2,221 thousand tons, |
|---|
| • | British Columbia — 547 thousand tons, |
|---|
| • | Ontario — 154 thousand tons and |
|---|
| • | Saskatchewan — 633 thousand tons. |
|---|
When the volume is harvested, we pay the province for that volume at stumpage rates set by the government. The harvested logs are transferred to our manufacturing facilities at cost (stumpage plus harvest, haul and overhead costs less any margin on selling logs to third parties). Any profit from harvesting the log through converting to finished products is recognized at the respective mill in our Wood Products segment.
In 2019, we changed the way we report our Canadian Forestlands operations. As a result, we no longer report related intersegment sales in the Timberlands segment and we now record the minimal associated third-party log sales in the Wood Products segment. These collective transactions did not contribute any earnings to the Timberlands or Wood Products segment. We have conformed prior year presentations with the current year.
Summary of License Arrangements
| GEOGRAPHIC AREA | THOUSANDS OF ACRES AT DECEMBER 31, 2019 | |||
|---|---|---|---|---|
| TOTAL ACRES | ||||
| Province: | ||||
| Alberta | 5,399 | |||
| British Columbia | 1,014 | |||
| Ontario(1) | 2,574 | |||
| Saskatchewan(1) | 4,987 | |||
| Total Canada | 13,974 | |||
| (1) | License is managed by partnership. |
|---|
HOW MUCH WE HARVEST
Our fee harvest volumes are managed sustainably across all regions to ensure the preservation of long-term economic value of the timber and to capture maximum value from the markets. This is accomplished by ensuring annual harvest schedules target financially mature timber and reforestation activities align with the growing of timber through its life cycle to financial maturity.
WEYERHAEUSER COMPANY > 2019 ANNUAL REPORT AND FORM 10-K 8
Five-Year Summary of Timberlands Fee Harvest Volumes
| FEE HARVEST VOLUMES IN THOUSANDS OF TONS(1) | ||||||||||||||||||||
|---|---|---|---|---|---|---|---|---|---|---|---|---|---|---|---|---|---|---|---|---|
| 2019 | 2018 | 2017 | 2016 | 2015 | ||||||||||||||||
| West | 9,237 | 9,571 | 10,083 | 11,083 | 10,563 | |||||||||||||||
| South | 26,278 | 26,708 | 27,149 | 26,343 | 14,113 | |||||||||||||||
| North(2) | 2,042 | 2,129 | 2,205 | 2,044 | — | |||||||||||||||
| Uruguay(3) | — | — | 822 | 1,119 | 980 | |||||||||||||||
| Other(4) | — | — | 1,384 | 701 | — | |||||||||||||||
| Total | 37,557 | 38,408 | 41,643 | 41,290 | 25,656 | |||||||||||||||
| (1) | In February 2016, we merged with Plum Creek. |
|---|
| (2) | In November 2019, we sold our Michigan timberlands. Refer to Note 4: Divestitures and Assets Held for Sale for further information on this divestiture. |
|---|
| (3) | Our Uruguay operations were divested in September 2017. Refer to Note 4: Divestitures and Assets Held for Sale for further information on this divestiture. |
|---|
| (4) | Other consisted of volumes managed for the Twin Creeks Venture. Our management agreement for the Twin Creeks Venture began in April 2016 and terminated in December 2017. For additional information see Note 8: Related Parties. |
|---|
Five-Year Summary of Timberlands Fee Harvest Volumes - Percentage of Grade and Fiber
| PERCENTAGE OF GRADE AND FIBER(1) | ||||||||||||||||||||||
|---|---|---|---|---|---|---|---|---|---|---|---|---|---|---|---|---|---|---|---|---|---|---|
| 2019 | 2018 | 2017 | 2016 | 2015 | ||||||||||||||||||
| West | Grade | 89 | % | 90 | % | 89 | % | 87 | % | 87 | % | |||||||||||
| Fiber | 11 | % | 10 | % | 11 | % | 13 | % | 13 | % | ||||||||||||
| South | Grade | 49 | % | 51 | % | 52 | % | 52 | % | 59 | % | |||||||||||
| Fiber | 51 | % | 49 | % | 48 | % | 48 | % | 41 | % | ||||||||||||
| North(2) | Grade | 37 | % | 46 | % | 49 | % | 47 | % | — | % | |||||||||||
| Fiber | 63 | % | 54 | % | 51 | % | 53 | % | — | % | ||||||||||||
| Uruguay(3) | Grade | — | % | — | % | 69 | % | 66 | % | 65 | % | |||||||||||
| Fiber | — | % | — | % | 31 | % | 34 | % | 35 | % | ||||||||||||
| Other(4) | Grade | — | % | — | % | 47 | % | 45 | % | — | % | |||||||||||
| Fiber | — | % | — | % | 53 | % | 55 | % | — | % | ||||||||||||
| Total | Grade | 59 | % | 62 | % | 63 | % | 64 | % | 73 | % | |||||||||||
| Fiber | 41 | % | 38 | % | 37 | % | 36 | % | 27 | % | ||||||||||||
| (1) | In February 2016, we merged with Plum Creek. |
|---|
| (2) | In November 2019, we sold our Michigan timberlands. Refer to Note 4: Divestitures and Assets Held for Sale for further information on this divestiture. |
|---|
| (3) | Our Uruguay operations were divested in September 2017. Refer to Note 4: Divestitures and Assets Held for Sale for further information on this divestiture. |
|---|
| (4) | Other consisted of volumes managed for the Twin Creeks Venture. Our management agreement for the Twin Creeks Venture began in April 2016 and terminated in December 2017. For additional information see Note 8: Related Parties. |
|---|
HOW MUCH WE SELL
Our net sales to unaffiliated customers over the last two years were:
| • | $1.6 billion in 2019 and |
|---|
| • | $1.9 billion in 2018. |
|---|
Our intersegment sales over the last two years were:
| • | $503 million in 2019 and |
|---|
| • | $537 million in 2018. |
|---|
WEYERHAEUSER COMPANY > 2019 ANNUAL REPORT AND FORM 10-K 9
Five-Year Summary of Net Sales for Timberlands
| NET SALES IN MILLIONS OF DOLLARS(1)(2) | ||||||||||||||||||||
|---|---|---|---|---|---|---|---|---|---|---|---|---|---|---|---|---|---|---|---|---|
| 2019 | 2018 | 2017 | 2016 | 2015 | ||||||||||||||||
| Net sales to unaffiliated customers: | ||||||||||||||||||||
| Delivered logs: | ||||||||||||||||||||
| West | $ | 740 | $ | 987 | $ | 915 | $ | 865 | $ | 830 | ||||||||||
| South | 640 | 625 | 616 | 566 | 241 | |||||||||||||||
| North(3) | 92 | 99 | 95 | 91 | — | |||||||||||||||
| Other(4) | — | — | 23 | 14 | 13 | |||||||||||||||
| Total | 1,472 | 1,711 | 1,649 | 1,536 | 1,084 | |||||||||||||||
| Stumpage and pay-as-cut timber | 42 | 59 | 73 | 85 | 37 | |||||||||||||||
| Uruguay operations(5) | — | — | 63 | 79 | 87 | |||||||||||||||
| Recreational lease revenue | 61 | 59 | 59 | 44 | 25 | |||||||||||||||
| Other products(6) | 43 | 44 | 49 | 36 | 16 | |||||||||||||||
| Subtotal net sales to unaffiliated customers | 1,618 | 1,873 | 1,893 | 1,780 | 1,249 | |||||||||||||||
| Intersegment net sales | 503 | 537 | 522 | 592 | 560 | |||||||||||||||
| Total | $ | 2,121 | $ | 2,410 | $ | 2,415 | $ | 2,372 | $ | 1,809 | ||||||||||
| (1) | In February 2016, we merged with Plum Creek. |
|---|
| (2) | In 2019, we changed the way we report our Canadian Forestlands operations. As a result, we no longer report related intersegment sales in the Timberlands segment and we now record the minimal associated third-party log sales in the Wood Products segment. These collective transactions did not contribute any earnings to the Timberlands segment. We have conformed prior year presentations with the current year. |
|---|
| (3) | In November 2019, we sold our Michigan timberlands. Refer to Note 4: Divestitures and Assets Held for Sale for further information on this divestiture. |
|---|
| (4) | Other delivered logs included sales from timberlands managed for the Twin Creeks Venture. Our management agreement for the Twin Creeks Venture began in April 2016 and terminated in December 2017. For additional information see Note 8: Related Parties. |
|---|
| (5) | Our Uruguay operations were divested in September 2017. Refer to Note 4: Divestitures and Assets Held for Sale for further information on this divestiture. |
|---|
| (6) | Other products include sales of seeds and seedlings from our nursery operations and wood chips. |
|---|
Five-Year Trend for Total Net Sales in Timberlands

WEYERHAEUSER COMPANY > 2019 ANNUAL REPORT AND FORM 10-K 10
Percentage of 2019 Sales Dollars to Unaffiliated Customers
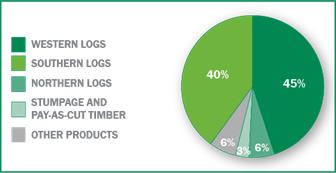
Log Sales Volume
Our sales volume includes fee timber, as well as logs purchased in the open market. Domestic and export logs are sold at market prices to both unaffiliated customers and our internal mills.
Our log sales volumes to unaffiliated customers over the last two years were:
| • | 26,963 thousand tons in 2019 and |
|---|
| • | 27,494 thousand tons in 2018. |
|---|
We sell three grades of logs — domestic grade, domestic fiber and export. Factors that may affect log sales in each of these categories include:
| • | domestic grade log sales — lumber usage, primarily for housing starts and repair and remodel activity, the needs of our own mills and the availability of logs from both outside markets and our own timberlands; |
|---|
| • | domestic fiber log sales — demand for wood chips by pulp, containerboard mills, pellet mills and oriented strand board mills and |
|---|
| • | export log sales — the level of housing starts in Japan and construction in China, as well as availability of logs from other countries, particularly for China. |
|---|
Five-Year Summary of Log Sales Volume to Unaffiliated Customers
| SALES VOLUME IN THOUSANDS(1)(2) | ||||||||||||||||||||
|---|---|---|---|---|---|---|---|---|---|---|---|---|---|---|---|---|---|---|---|---|
| 2019 | 2018 | 2017 | 2016 | 2015 | ||||||||||||||||
| Logs – tons: | ||||||||||||||||||||
| West | 7,173 | 7,858 | 8,202 | 8,713 | 8,212 | |||||||||||||||
| South | 18,232 | 18,008 | 17,895 | 15,967 | 6,480 | |||||||||||||||
| North(3) | 1,558 | 1,628 | 1,574 | 1,500 | — | |||||||||||||||
| Uruguay (4) | — | — | 291 | 470 | 714 | |||||||||||||||
| Other (5) | — | — | 693 | 122 | — | |||||||||||||||
| Total | 26,963 | 27,494 | 28,655 | 26,772 | 15,406 | |||||||||||||||
| (1) | In February 2016, we merged with Plum Creek. |
|---|
| (2) | In 2019, we changed the way we report our Canadian Forestlands operations. As a result, we no longer report related intersegment sales in the Timberlands segment and we now record the minimal associated third-party log sales in the Wood Products segment. These collective transactions did not contribute any earnings to the Timberlands segment. We have conformed prior year presentations with the current year. |
|---|
| (3) | In November 2019, we sold our Michigan timberlands. Refer to Note 4: Divestitures and Assets Held for Sale for further information on this divestiture. |
|---|
| (4) | Our Uruguay operations were divested in September 2017. Refer to Note 4: Divestitures and Assets Held for Sale for further information on this divestiture. |
|---|
| (5) | Other delivered logs included sales from timberlands managed for the Twin Creeks Venture. Our management agreement for the Twin Creeks Venture began in April 2016 and terminated in December 2017. For additional information see Note 8: Related Parties. |
|---|
Log Prices
The majority of our log sales to unaffiliated customers involve sales to domestic sawmills and the export market. Log prices in the following tables are on a delivered (mill) basis.
WEYERHAEUSER COMPANY > 2019 ANNUAL REPORT AND FORM 10-K 11
Five-Year Summary of Published Domestic Log Prices (#2 Sawlog Bark On — $/MBF)

Five-Year Summary of Export Log Prices (#2 Sawlog Bark On — $/MBF)

Log prices are affected by the supply of and demand for grade and fiber logs. Export log prices are particularly affected by the Japanese housing market, Chinese construction activity and the availability of logs.
WHERE WE’RE HEADED
Our competitive strategies include:
| • | continuing to capitalize on our scale of operations, silviculture and supply chain expertise and sustainability practices; |
|---|
| • | improving cash flow through operational excellence initiatives including merchandising for value, harvest and transportation efficiencies as well as focused silviculture investments to improve forest productivity; |
|---|
| • | leveraging our export and domestic market access, infrastructure and strong customer relationships; |
|---|
| • | increasing our recreational lease revenue and |
|---|
| • | continuing to maximize the value of our timberlands portfolio by managing the acres to achieve the highest and best use. |
|---|
REAL ESTATE, ENERGY AND NATURAL RESOURCES
Our Real Estate & ENR segment maximizes the value of our timberland ownership through application of our asset value optimization (AVO) process and captures the full value of surface and subsurface assets, such as oil, natural gas, minerals and wind and solar resources.
WEYERHAEUSER COMPANY > 2019 ANNUAL REPORT AND FORM 10-K 12
WHAT WE DO
Real Estate
Properties that exhibit higher use value than as commercial timberlands are monetized by our Real Estate business over time. We analyze our existing U.S. timberland holdings using a process we call AVO. We start with understanding the value of a parcel operating as commercial timberlands and then assess the specific real estate attributes of the parcel and its corresponding market. The assessment includes demographics, infrastructure and proximity to amenities and recreation to determine the potential to realize a premium value to commercial timberland. Attributes can evolve over time, and accordingly, the assignment of value and opportunity can change. We continually revisit our AVO assessment of all our timberland acres.
These properties are acres we expect to sell for recreational, conservation, commercial or residential purposes over time. We will entitle a small amount of acres to support development. Development, outside of entitlement activities, is typically performed by third parties. Some of our real estate activities are conducted through our TRSs.
Occasionally, we sell a small amount of timberlands acreage in areas where we choose to reduce our market presence and capture a price that exceeds the value derivable from holding and operating as commercial timberlands. These transactions will vary based on factors including the locations and physical characteristics of the timberlands.
The timing of real estate sales is a function of many factors, including the general state of the economy, demand in local real estate markets, the ability of buyers to obtain financing, the number of competing properties listed for sale, the seasonal nature of sales (particularly in the Northern states), the plans of adjacent landowners, our expectation of future price appreciation, the timing of the harvesting activities and the availability of government and not-for-profit funding. In any period, the average sales price per acre will vary based on the location and physical characteristics of parcels sold.
Energy and Natural Resources
We focus on maximizing potential opportunities for oil, natural gas, construction materials, industrial minerals, renewable energy (including wind and solar energy), rights of way easements on our timberlands portfolio and retained mineral interests.
As the owner of mineral rights and interests, we typically do not invest in development or operations but, instead, enter into contracts with operators granting them the rights to explore and sell energy and natural resources produced from our property in exchange for rents and royalties.
We generally reserve mineral rights when selling timberlands acreage. Some Energy and Natural Resources activities are conducted through our TRSs.
Real Estate, Energy and Natural Resources Sources of Revenue
| SOURCES | ACTIVITIES |
| Real Estate | • Select timberland tracts are sold for recreational, conservation, commercial or residential purposes. |
| Energy and Natural Resources | • Rights are granted to explore, extract and sell construction aggregates (rock, sand and gravel), industrial materials and oil and natural gas. • Ground leases and easements are granted to wind and solar developers to generate renewable electricity from our timberlands. • Rights are granted to access and utilize timberland acreage for communications, pipeline, powerline and transportation rights of way. |
WHERE WE DO IT
Our Real Estate business identifies opportunities to realize premium value for our U.S. owned timberland acreage.
The majority of our Energy and Natural Resources revenue sources are located in Oregon, Washington, South Carolina and Georgia (construction material royalties); as well as the Gulf South and West Virginia (oil and natural gas royalties).
HOW MUCH WE SELL
Our net sales to unaffiliated buyers over the last two years were:
| • | $313 million in 2019 and |
|---|
| • | $306 million in 2018. |
|---|
WEYERHAEUSER COMPANY > 2019 ANNUAL REPORT AND FORM 10-K 13
Five-Year Summary of Net Sales for Real Estate, Energy and Natural Resources
| NET SALES IN MILLIONS OF DOLLARS(1)(2) | ||||||||||||||||||||
|---|---|---|---|---|---|---|---|---|---|---|---|---|---|---|---|---|---|---|---|---|
| 2019 | 2018 | 2017 | 2016 | 2015 | ||||||||||||||||
| Net Sales: | ||||||||||||||||||||
| Real Estate | $ | 225 | $ | 229 | $ | 208 | $ | 172 | $ | 75 | ||||||||||
| Energy and Natural Resources | 89 | 78 | 73 | 54 | 26 | |||||||||||||||
| Total | $ | 314 | $ | 307 | $ | 281 | $ | 226 | $ | 101 | ||||||||||
| (1) | In February 2016, we merged with Plum Creek. |
|---|
| (2) | Amounts include net sales to unaffiliated buyers as well as intersegment sales. |
|---|
Five-Year Summary of Real Estate Sales Statistics
| REAL ESTATE SALES STATISTICS(1) | ||||||||||||||||||||
|---|---|---|---|---|---|---|---|---|---|---|---|---|---|---|---|---|---|---|---|---|
| 2019 | 2018 | 2017 | 2016 | 2015 | ||||||||||||||||
| Acres sold | 113,315 | 131,575 | 97,235 | 82,687 | 27,390 | |||||||||||||||
| Average price per acre | $ | 1,848 | $ | 1,701 | $ | 2,079 | $ | 2,072 | $ | 2,490 |
| (1) | In February 2016, we merged with Plum Creek. |
|---|
WHERE WE’RE HEADED
Our competitive strategies include:
| • | continuing to apply the AVO process to identify opportunities to capture a premium to timber value; |
|---|
| • | maintaining a flexible, low-cost execution model by continuing to leverage strategic relationships with outside real estate brokers; |
|---|
| • | capturing the full value of our oil and natural gas, aggregates and industrial minerals and wind renewable energy resources and |
|---|
| • | delivering the most value from every acre. |
|---|
WOOD PRODUCTS
We are a large manufacturer and distributor of wood products in North America.
WHAT WE DO
Our wood products segment:
| • | manufactures high-quality structural lumber, oriented strand board, engineered wood products and other specialty products for the residential, multi-family, industrial, light commercial and repair and remodel markets; |
|---|
| • | distributes our products as well as complementary building products that we purchase from other manufacturers and |
|---|
| • | exports our structural lumber and engineered wood products, primarily to Asia. |
|---|
Wood Products Sources of Revenue
| PRODUCTS | HOW THEY’RE USED |
|---|---|
| Structural lumber | Structural framing for new residential, repair and remodel, treated applications, industrial and commercial structures. |
| Oriented strand board | Structural sheathing, subflooring and stair tread for residential, multi-family and commercial structures. |
| Engineered wood products • Solid section • I-joists • Softwood plywood • Medium density fiberboard | Structural elements for residential, multi-family and commercial structures such as floor and roof joists, headers, beams, subflooring and sheathing. Medium density fiberboard products for store fixtures, molding, doors and cabinet components. |
| Other products | Wood chips and other byproducts. |
| Complementary building products | Complementary building products such as cedar, decking, siding, insulation and rebar sold in our distribution facilities. |
WHERE WE DO IT
We operate manufacturing facilities in the United States and Canada. We distribute through a combination of Weyerhaeuser distribution centers and third-party distributors. Information about the locations, capacities and actual production of our manufacturing facilities is included below.
WEYERHAEUSER COMPANY > 2019 ANNUAL REPORT AND FORM 10-K 14
Summary of Wood Products Capacities and Principal Manufacturing Locations as of December 31, 2019
| CAPACITIES IN MILLIONS | |||||||||
|---|---|---|---|---|---|---|---|---|---|
| PRODUCTION CAPACITY | NUMBER OF FACILITIES | FACILITY LOCATIONS | |||||||
| Structural lumber – board feet | 5,188 | 19 | Alabama, Arkansas, Louisiana (2), Mississippi (3), Montana, North Carolina (3), Oklahoma, Oregon (2), Washington (2), Alberta (2), British Columbia | ||||||
| Oriented strand board – square feet (3/8”) | 3,035 | 6 | Louisiana, Michigan, North Carolina, West Virginia, Alberta, Saskatchewan | ||||||
| Engineered solid section – cubic feet(1) | 42 | 6 | Alabama, Louisiana, Oregon, West Virginia, British Columbia, Ontario | ||||||
| Softwood plywood – square feet (3/8”) | 610 | 3 | Arkansas, Louisiana, Montana | ||||||
| Medium density fiberboard – square feet (3/4") | 265 | 1 | Montana |
| (1) | This represents total press capacity. Three facilities also produce I-joist to meet market demand. In 2019, approximately 25 percent of the total press production was converted into 182 lineal feet of I-joist. |
|---|
Production capacities listed represent annual production volume under normal operating conditions and producing a normal product mix for each individual facility.
We also own or lease 18 distribution centers in the U.S. where our products and complementary building products are sold.
Five-Year Summary of Wood Products Production
| PRODUCTION IN MILLIONS(1) | ||||||||||||||||||||
|---|---|---|---|---|---|---|---|---|---|---|---|---|---|---|---|---|---|---|---|---|
| 2019 | 2018 | 2017 | 2016 | 2015 | ||||||||||||||||
| Structural lumber – board feet | 4,705 | 4,541 | 4,509 | 4,516 | 4,252 | |||||||||||||||
| Oriented strand board – square feet (3/8”) | 2,969 | 2,837 | 2,995 | 2,910 | 2,847 | |||||||||||||||
| Engineered solid section – cubic feet(2) | 22.6 | 24.3 | 25.1 | 22.8 | 20.9 | |||||||||||||||
| Engineered I-joists – lineal feet(2) | 182 | 191 | 213 | 184 | 185 | |||||||||||||||
| Softwood plywood – square feet (3/8”)(3) | 386 | 404 | 370 | 396 | 248 | |||||||||||||||
| Medium density fiberboard – square feet (3/4") | 202 | 220 | 232 | 209 | — |
| (1) | In February 2016, we merged with Plum Creek. |
|---|
| (2) | Our engineered solid section facilities also may produce engineered I-joists. |
|---|
| (3) | All of our plywood facilities also produce veneer. |
|---|
HOW MUCH WE SELL
Revenues of our Wood Products segment come from sales to wood products dealers, do-it-yourself retailers, builders and industrial users. Wood Products net sales were $4.6 billion in 2019 and $5.3 billion in 2018.
Five-Year Summary of Net Sales for Wood Products
| NET SALES IN MILLIONS OF DOLLARS(1) | ||||||||||||||||||||
|---|---|---|---|---|---|---|---|---|---|---|---|---|---|---|---|---|---|---|---|---|
| 2019 | 2018 | 2017 | 2016 | 2015 | ||||||||||||||||
| Structural lumber | $ | 1,892 | $ | 2,258 | $ | 2,058 | $ | 1,839 | $ | 1,741 | ||||||||||
| Oriented strand board | 632 | 891 | 904 | 707 | 595 | |||||||||||||||
| Engineered solid section | 510 | 521 | 500 | 450 | 428 | |||||||||||||||
| Engineered I-joists | 323 | 336 | 336 | 290 | 284 | |||||||||||||||
| Softwood plywood | 161 | 200 | 176 | 174 | 129 | |||||||||||||||
| Medium density fiberboard | 166 | 177 | 183 | 158 | — | |||||||||||||||
| Other products produced(2) | 337 | 330 | 325 | 226 | 213 | |||||||||||||||
| Complementary building products | 602 | 584 | 541 | 515 | 506 | |||||||||||||||
| Total | $ | 4,623 | $ | 5,297 | $ | 5,023 | $ | 4,359 | $ | 3,896 | ||||||||||
| (1) | In February 2016, we merged with Plum Creek. |
|---|
| (2) | Other products produced sales include wood chips, other byproducts and third-party residual log sales from our Canadian Forestlands operations. In 2019, we changed the way we report our Canadian Forestlands operations. As a result, we no longer report related intersegment sales in the Timberlands segment and we now record the minimal associated third-party log sales within other products produced. We have conformed prior year presentations with the current year. |
|---|
WEYERHAEUSER COMPANY > 2019 ANNUAL REPORT AND FORM 10-K 15
Five-Year Trend for Total Net Sales in Wood Products

Percentage of 2019 Net Sales Dollars in Wood Products

Wood Products Volume
Five-Year Summary of Sales Volume for Wood Products
| SALES VOLUME IN MILLIONS(1)(2) | ||||||||||||||||||||
|---|---|---|---|---|---|---|---|---|---|---|---|---|---|---|---|---|---|---|---|---|
| 2019 | 2018 | 2017 | 2016 | 2015 | ||||||||||||||||
| Structural lumber – board feet | 4,857 | 4,684 | 4,658 | 4,723 | 4,588 | |||||||||||||||
| Oriented strand board – square feet (3/8”) | 2,916 | 2,827 | 2,971 | 2,934 | 2,972 | |||||||||||||||
| Engineered solid section – cubic feet | 23.2 | 24.3 | 25.1 | 23.3 | 21.3 | |||||||||||||||
| Engineered I-joists – lineal feet | 192 | 204 | 220 | 195 | 188 | |||||||||||||||
| Softwood Plywood – square feet (3/8”) | 445 | 459 | 453 | 481 | 381 | |||||||||||||||
| Medium density fiberboard – square feet (3/4") | 200 | 212 | 222 | 206 | — |
| (1) | Sales volume includes sales of internally produced products as well as complementary building products sold primarily through our distribution centers. |
|---|
| (2) | In February 2016, we merged with Plum Creek. |
|---|
Wood Products Prices
Prices for commodity wood products — structural lumber, oriented strand board (OSB) and softwood plywood — declined in 2019 from 2018.
In general, the following factors influence sales realizations for wood products:
| • | Demand for wood products used in residential and multi-family construction and the repair and remodel of existing homes affects prices. Residential and multi-family construction is influenced by factors such as population growth and other demographics, availability of labor and lots, the level of employment, consumer confidence, consumer income, availability of financing and interest rate levels, and the supply and pricing of existing homes on the market. Repair and remodel activity is affected by the size and age of existing housing inventory and access to home equity financing and other credit. |
|---|
| • | The supply of commodity building products such as structural lumber, OSB and softwood plywood affects prices. A number of factors can influence supply, including changes in production capacity and utilization rates, weather, raw material supply and availability of transportation. |
|---|
The following graphs reflect product price trends for the past five years.
WEYERHAEUSER COMPANY > 2019 ANNUAL REPORT AND FORM 10-K 16
Five-Year Summary of Published Lumber Prices — $/MBF

Five-Year Summary of Published Oriented Strand Board Prices — $/MSF

WHERE WE’RE HEADED
Our competitive strategies include:
| • | achieving industry-leading controllable manufacturing costs through operational excellence and disciplined capital execution; |
|---|
| • | aligning strongly with fiber supply; |
|---|
| • | leveraging our brand and reputation as the preferred provider of quality building products and |
|---|
| • | pursuing disciplined, profitable sales growth in target markets. |
|---|
WEYERHAEUSER COMPANY > 2019 ANNUAL REPORT AND FORM 10-K 17
INFORMATION ABOUT OUR EXECUTIVE OFFICERS
Adrian M. Blocker, 63, has been senior vice president, Timberlands, since January 2019. Previously, he served as senior vice president, Wood Products, from January 2015 to January 2019. He joined the company in May 2013 as vice president, Lumber. Prior to joining the company, he served as CEO of the Wood Products Council. He has held numerous leadership positions in the industry focused on forest management, fiber procurement, consumer packaging, strategic planning, business development and manufacturing, at companies including West Fraser, International Paper and Champion International.
Russell S. Hagen, 54, has been senior vice president and chief financial officer since February 2016. Previously, he served as senior vice president, Business Development, at Plum Creek from December 2011 to February 2016. Prior to this he was vice president, Real Estate Development, overseeing the development activities of the company's real estate, oil and gas, construction materials and bioenergy businesses. Mr. Hagen began his career in 1988 with Coopers and Lybrand, where he was a certified public accountant and led the audits of public clients in technology, banking and natural resource industries. He joined Plum Creek in 1993 as Manager of Internal Audit and held director-level positions in accounting, financial operations, risk management and information technology.
Kristy T. Harlan, 46, has been senior vice president, general counsel and corporate secretary since January 2017. She leads the company's Law department, with responsibility for global legal, compliance, enterprise risk management, procurement and land title functions. Before joining the company, she was a partner at K&L Gates LLP from January 2007 to November 2016. Previously, she worked as an attorney at Preston Gates & Ellis LLP and Akin Gump Strauss Hauer & Feld LLP.
James A. Kilberg, 63, has been senior vice president, Real Estate, Energy and Natural Resources, since April 2016. In this position, he oversees the company's real estate development, land asset management, conservation, mitigation banking, recreational lease management, oil and gas, construction materials, heavy minerals, wind and solar. Prior to joining the company, he served as Plum Creek's senior vice president, Real Estate, Energy and Natural Resources, from 2006 to February 2016, and as Plum Creek’s vice president, Land Management, from 2001 to 2006. Prior to joining Plum Creek, Mr. Kilberg held several executive positions in real estate, asset management and development.
Denise M. Merle, 56, has been senior vice president and chief administration officer since February 2018. Previously, she served as senior vice president, Human Resources and Information Technology, from February 2016 to February 2018 and senior vice president, Human Resources and Investor Relations, from February 2014 to February 2016. She was director, Finance and Human Resources, for the Lumber business from 2013 to 2016. Prior to that, she was director, Compliance & Enterprise Planning, from 2009 to 2013, and director, Internal Audit, from 2004 to 2009. She has also held various roles in the company's paper and packaging businesses, including finance, capital planning and analysis, and business development. She is a licensed CPA in the state of Washington.
Keith J. O'Rear, 57, has been senior vice president, Wood Products, since January 2019. Previously, he was vice president of Wood Products sales and marketing from 2017 to 2018 and vice president of Wood Products Manufacturing for the company's Mid-South region from 2014 to 2017. Mr. O'Rear led the company's Timberlands operations in Oklahoma and Arkansas from 2013 to 2014, and prior to that he held various manufacturing leadership roles at the company's lumber mills in Dierks, Arkansas, and Idabel, Oklahoma. He also led a variety of initiatives for the company in the areas of safety, reliability, strategic planning and large capital projects.
Devin W. Stockfish, 46, has been president and chief executive officer and a member of the company’s board of directors since January 2019. Previously, he served as senior vice president, Timberlands, from January 2018 to December 2018 and as vice president, Western timberlands, from January 2017 to December 2017. He also served as senior vice president, general counsel and corporate secretary, from July 2014 to December 2016 and as assistant general counsel from March 2013 to July 2014. Before joining the company in March 2013, he was vice president and associate general counsel at Univar Inc. where he focused on mergers and acquisitions, corporate governance and securities law. Previously, he was an attorney in the law department at Starbucks Corporation and practiced corporate law at K&L Gates LLP. Before he began practicing law, Mr. Stockfish was an engineer with the Boeing Company.
WEYERHAEUSER COMPANY > 2019 ANNUAL REPORT AND FORM 10-K 18
NATURAL RESOURCE AND ENVIRONMENTAL MATTERS
We are subject to a multitude of laws and regulations in the operation of our businesses. We also participate in voluntary certification of our timberlands to ensure that we sustain their overall quality, including the protection of wildlife and water quality. Changes in law and regulation, or certification standards, can significantly affect our business.
REGULATIONS AFFECTING FORESTRY PRACTICES
In the United States, regulations established by federal, state and local government agencies to protect water quality, wetlands and other wildlife habitat could affect future harvests and forest management practices on our timberlands. Forest practice laws and regulations that affect present or future harvest and forest management activities in certain states include:
| • | limits on the size of clearcuts, |
|---|
| • | requirements that some timber be left unharvested to protect water quality and fish and wildlife habitat, |
|---|
| • | regulations regarding construction and maintenance of forest roads, |
|---|
| • | rules requiring reforestation following timber harvest, |
|---|
| • | regulations on the use of pesticides and herbicides and |
|---|
| • | various related permit programs. |
|---|
Each state in which we own timberlands has developed best management practices to reduce the effects of forest practices on water quality and aquatic habitats. Additional and more stringent regulations may be adopted by various state and local governments to achieve water-quality standards under the federal Clean Water Act, protect fish and wildlife habitats, human health, or achieve other public policy objectives.
In Canada, our forest operations are carried out on public timberlands under forest licenses with the provinces. All forest operations in Canada are subject to:
| • | forest practices and environmental regulations and |
|---|
| • | license requirements established by contract between us and the relevant province designed to: |
|---|
- protect environmental values and
- encourage other stewardship values.
In Canada, 21 member companies of the Forest Products Association of Canada (FPAC), including Weyerhaeuser’s Canadian subsidiary, announced in May 2010 the signing of a Canadian Boreal Forest Agreement (CBFA) with nine environmental organizations. The CBFA applies to approximately 72 million hectares of public forests licensed to FPAC members and, when fully implemented, was expected to lead to the conservation of significant areas of Canada’s boreal forest and protection of boreal species at risk, in particular, woodland caribou. While the CBFA mandate came to an end in 2017, CBFA signatories continue to work on management plans with provincial governments and seek the participation of aboriginal and local communities in advancing the goals of the CBFA.
ENDANGERED SPECIES PROTECTIONS
In the United States, a number of fish and wildlife species that inhabit geographic areas near or within our timberlands have been listed as threatened or endangered under the federal Endangered Species Act (ESA) or similar state laws, including but not limited to:
| • | the northern spotted owl, the marbled murrelet, a number of salmon species, bull trout and steelhead trout in the Pacific Northwest; |
|---|
| • | several freshwater mussel and sturgeon species and |
|---|
| • | the red-cockaded woodpecker, gopher tortoise, dusky gopher frog, American burying beetle and Northern long-eared bat in the South or Southeast. |
|---|
Additional species or populations may be listed as threatened or endangered as a result of pending or future citizen petitions or petitions initiated by federal or state agencies. In addition, significant citizen litigation seeks to compel the federal agencies to designate "critical habitat" for ESA-listed species, and many cases have resulted in settlements under which designations will be implemented over time. Such designations may adversely affect some management activities and options. Restrictions on timber harvests can result from:
| • | federal and state requirements to protect habitat for threatened and endangered species; |
|---|
| • | regulatory actions by federal or state agencies to protect these species and their habitat and |
|---|
| • | citizen suits under the ESA. |
|---|
Such actions could increase our operating costs and affect timber supply and prices in general. To date, we do not believe that these measures have had, and we do not believe that in 2020 they will have, a significant effect on our harvesting operations. We anticipate that likely future actions will not disproportionately affect Weyerhaeuser as compared with comparable operations of U.S. competitors.
In Canada:
| • | The federal Species at Risk Act (SARA) requires protective measures for species identified as being at risk and for their critical habitat. Pursuant to SARA, Environment Canada continues to identify and assess species deemed to be at risk and their critical habitat. |
|---|
WEYERHAEUSER COMPANY > 2019 ANNUAL REPORT AND FORM 10-K 19
| • | In October 2012, the Canadian Minister of the Environment released a strategy for the recovery of the boreal population of woodland caribou under the SARA. The population and distribution objectives for boreal caribou across Canada are to (1) maintain the current status of existing, self-sustaining local caribou populations and (2) stabilize and achieve self-sustaining status for non-self-sustaining local caribou populations. Critical habitat for boreal caribou is identified for all boreal caribou ranges, except for northern Saskatchewan’s Boreal Shield range (SK1) where additional information is required for that population. Species assessment and recovery plans are developed in consultation with aboriginal communities and stakeholders. |
|---|
| • | In 2017, the Provinces were required to update the federal government on any progress associated with their draft caribou range plans. These draft plans will be further evaluated in 2020, and any additional information on potential effects to forest harvest operations will be released. |
|---|
The identification and protection of habitat and the implementation of range plans and land use action plans may, over time, result in additional restrictions on timber harvests and other forest management practices that could increase operating costs for operators of timberlands in Canada. To date, we do not believe that these Canadian measures have had, and we do not believe that in 2020 they will have, a significant effect on our harvesting operations. We anticipate that likely future measures will not disproportionately affect Weyerhaeuser as compared with similar operations of Canadian competitors.
FOREST CERTIFICATION STANDARDS
We operate in North America under the Sustainable Forestry Initiative® (SFI). This is a certification standard designed to supplement government regulatory programs with voluntary landowner initiatives to further protect certain public resources and values. SFI is an independent standard, overseen by a governing board consisting of:
| • | conservation organizations, |
|---|
| • | academia, |
|---|
| • | the forest industry and |
|---|
| • | large and small forest landowners. |
|---|
Ongoing compliance with SFI may result in some increases in our operating costs and reduction of our timber harvests in some areas. There is also competition from other private certification systems, primarily the Forest Stewardship Council (FSC), coupled with efforts by supporters to further those systems by persuading customers of forest products to require products certified to their preferred system. Certain features of the FSC system could impose additional operating costs on timberland management. Because of the considerable variation in FSC standards, and variability in how those standards are interpreted and applied, if sufficient marketplace demand develops for products made from raw materials sourced from other than SFI-certified forests, we could incur substantial additional costs for operations and be required to reduce harvest levels.
WHAT THESE REGULATIONS AND CERTIFICATION PROGRAMS MEAN TO US
The regulatory and non-regulatory forest management programs described above have:
| • | increased our operating costs; |
|---|
| • | resulted in changes in the value of timber and logs from our timberlands; |
|---|
| • | contributed to increases in the prices paid for wood products and wood chips during periods of high demand; |
|---|
| • | sometimes made it more difficult for us to respond to rapid changes in markets, extreme weather or other unexpected circumstances and |
|---|
| • | potentially encouraged further reductions in the use of, or substitution of other products for, lumber, oriented strand board, engineered wood products and plywood. |
|---|
We believe that these regulations and programs have not had, and in 2020 will not have, a significant effect on our total harvest of timber in the United States or Canada. However, these kinds of programs may have such an effect in the future. We expect we will not be disproportionately affected by these programs as compared with typical owners of comparable timberlands. We also expect that these programs will not significantly disrupt our planned operations over large areas or for extended periods.
CANADIAN ABORIGINAL RIGHTS
Many of the Canadian timberlands are subject to the constitutionally protected treaty or common-law rights of aboriginal peoples of Canada. Most of British Columbia (B.C.) is not covered by treaties, and as a result the claims of B.C.’s aboriginal peoples relating to forest resources have been largely unresolved. Nonetheless, the Supreme Court of Canada ruled that the Tsilhqot’in Nation holds aboriginal title to approximately 1,900 square kilometers in B.C., the first time the court has declared title to exist based on historical occupation by aboriginal peoples. Many aboriginal groups continue to be engaged in treaty discussions with the governments of B.C., other provinces and Canada.
Final or interim resolution of claims brought by aboriginal groups can be expected to result in:
| • | additional restrictions on the sale or harvest of timber, |
|---|
| • | potential increase in operating costs and |
|---|
| • | effect on timber supply and prices in Canada. |
|---|
We believe that such claims will not have a significant effect on our total harvest of timber or production of forest products in 2020, although they may have such an effect in the future.
WEYERHAEUSER COMPANY > 2019 ANNUAL REPORT AND FORM 10-K 20
POLLUTION-CONTROL REGULATIONS
Our operations are subject to various federal, state, provincial and local pollution control laws and regulations.
These laws and regulations, as well as market demands, impose controls with regard to:
| • | air, water and land; |
|---|
| • | solid and hazardous waste management; |
|---|
| • | waste disposal; |
|---|
| • | remediation of contaminated sites and |
|---|
| • | the chemical content of some of our products. |
|---|
Compliance with these laws, regulations and demands usually involves capital expenditures as well as additional operating costs. We cannot easily quantify the future amounts of capital expenditures we might have to make to comply with these laws, regulations and demands or the effects on our operating costs because in some instances compliance standards have not been developed or have not become final or definitive. In addition, it is difficult to isolate the environmental component of most manufacturing capital projects.
Our capital projects typically are designed to:
| • | enhance safety, |
|---|
| • | extend the life of a facility, |
|---|
| • | lower costs and improve efficiency, |
|---|
| • | improve reliability, |
|---|
| • | increase capacity, |
|---|
| • | facilitate raw material changes and handling requirements, |
|---|
| • | increase the economic value of assets or products, and |
|---|
| • | comply with regulatory standards. |
|---|
ENVIRONMENTAL CLEANUP
We are involved in the environmental investigation or remediation of numerous sites. Of these sites:
| • | we may have the sole obligation to remediate, |
|---|
| • | we may share that obligation with one or more parties, |
|---|
| • | several parties may have joint and several obligations to remediate and |
|---|
| • | we may have been named as a potentially responsible party for contaminated sites, including those designated as U.S. Superfund sites. |
|---|
Our liability with respect to these various sites ranges from insignificant to substantial. The amount of liability depends on the:
| • | quantity, toxicity and nature of materials at the site and |
|---|
| • | number and economic viability of the other responsible parties. |
|---|
We spent approximately $5 million in 2019 and expect to spend approximately $9 million in 2020 on environmental remediation of these sites.
It is our policy to accrue for environmental-remediation costs when we:
| • | determine it is probable that such an obligation exists and |
|---|
| • | can reasonably estimate the amount of the obligation. |
|---|
Based on currently available information and analysis, we believe it is reasonably possible that our costs to remediate all the identified sites may exceed our current accruals of $61 million by up to $124 million. This estimate of the upper end of the range of reasonably possible additional costs is much less certain than the estimates we currently are using to determine how much to accrue. The estimate of the upper range also relies on assumptions less favorable to us among the range of reasonably possible outcomes.
REGULATION OF AIR EMISSIONS IN THE U.S.
The United States Environmental Protection Agency (EPA) has promulgated regulations for air emissions from:
| • | wood products facilities and |
|---|
| • | industrial boilers. |
|---|
These regulations cover:
| • | hazardous air pollutants that require use of maximum achievable control technology (MACT) and |
|---|
| • | controls and/or monitoring for pollutants that contribute to smog, haze and more recently, greenhouse gases. |
|---|
WEYERHAEUSER COMPANY > 2019 ANNUAL REPORT AND FORM 10-K 21
The EPA has issued several rules relating to MACT standards and the emission of greenhouse gases from various energy-producing sources. Several court decisions have made the extent of applicability of these rules uncertain. Depending on the final outcomes of these decisions, these regulatory programs could affect our operations by increasing the cost of purchasing electricity or from mandated energy demand reductions that could apply to our mills and other facilities that we operate. The EPA is also expected to issue rules relating to biomass emissions, which is a significant source of energy at our mills. The effect of these existing and future emissions regulations, as well as related court decisions, on our operations remains uncertain. We continue to track and evaluate the litigation and regulatory developments but are not able to predict whether the regulations, when complete and implemented, will have a material effect on our operations.
To address concerns about greenhouse gases as a pollutant, we:
| • | closely monitor legislative, regulatory and scientific developments pertaining to climate change; |
|---|
| • | adopted in 2006, as part of the company's sustainability program, a goal of reducing greenhouse gas emissions by 40 percent by 2020 compared with our emissions in 2000, assuming a comparable portfolio and regulations; |
|---|
| • | determined to achieve this goal by increasing energy efficiency and using more greenhouse gas-neutral, biomass fuels instead of fossil fuels and |
|---|
| • | reduced greenhouse gas emissions by over 50 percent considering changes in the asset portfolio according to 2018 data, compared to our 2000 baseline. |
|---|
Additional factors that could affect regulation of greenhouse gas emissions in the future include:
| • | policy proposals by federal or state governments regarding regulation of greenhouse gas emissions, |
|---|
| • | Congressional legislation regulating or taxing greenhouse gas emissions within the next several years and |
|---|
| • | establishment of a multistate or federal greenhouse gas emissions reduction trading system with potentially significant implications for all U.S. businesses. |
|---|
We believe these developments have not had, and in 2020 will not have, a significant effect on our operations. Although these measures could have a material adverse effect on our operations in the future, we expect that we will not be disproportionately affected by these measures as compared with owners of comparable operations. We maintain an active forestry research program to track and understand any potential effect from actual climate change related parameters that could affect the forests we own and manage and do not anticipate any disruptions to our planned operations.
REGULATION OF AIR EMISSIONS IN CANADA
Our wood products facilities are regulated in Canada under provincial air quality rules. The Canadian federal government has also proposed an air quality management system (AQMS) as a comprehensive national approach for improving air quality in Canada to go along with existing provincial air quality regulations. The AQMS includes:
| • | ambient air quality standards for outdoor air quality management across the country; |
|---|
| • | a framework for air zone air management within provinces and territories that targets specific sources of air emissions; |
|---|
| • | regional airsheds that facilitate coordinated action across borders; |
|---|
| • | industrial sector-based emission requirements that set a national base level of performance for major industries in Canada and |
|---|
| • | improved intergovernmental collaboration to reduce emissions from the transportation sector. |
|---|
In addition to these existing and proposed regulations, Environment and Climate Change Canada, a Canadian federal agency, released the Pan-Canadian Framework on Clean Growth and Climate Change, a "Greenhouse Gas Emission Framework." The framework put in place a national, sector-based greenhouse gas reduction program applicable to a number of industries, including ours.
All Canadian provincial governments:
| • | have greenhouse gas reporting requirements, |
|---|
| • | are working on reduction strategies and |
|---|
| • | together with the Canadian federal government, are considering new or revised emission standards. |
|---|
Along with clean air regulations, British Columbia, a province in which we operate, has adopted a carbon tax and Alberta, where we also have operations, has a mandatory greenhouse gas emission reduction regulation.
Although these and related regulations and measures have not had, and we do not expect in 2020 that they will have, a material effect on our operations, they could in the future.
REGULATION OF WATER IN THE U.S.
Our operations are regulated under the Clean Water Act, which regulates the discharge of pollutants into the waters of the U.S. This generally means obtaining permits for certain of our silviculture activities and abiding by applicable restrictions. Federal agency rulemaking and related litigation under the act has led to increased jurisdiction of the act by expanding the definition of waterways subject to the act’s regulation. This, in turn, has increased the number of required federal and state permits in some areas of our operations as it relates to the application of pesticides and herbicides on timberlands, which has increased operating costs. Pending and future federal and state rulemaking, and judicial challenges thereto, could make application of the Clean Water Act, as well as comparable state laws, more or less costly to Weyerhaeuser, and we are not able to predict the final resolution of these matters. Although this and related regulations have not had, and we do not expect in 2020 that they will have, a material effect on our operations, they could in the future.
WEYERHAEUSER COMPANY > 2019 ANNUAL REPORT AND FORM 10-K 22
REGULATION OF WATER IN CANADA
Changes to the Canadian Federal Fisheries Act have moved the focus of that legislation from habitat protection to fisheries protection and increased penalties. We expect further changes to these regulations, but we cannot predict the scope or potential effect, if any, on our operations. Although this and related Canadian regulations have not had, and we do not expect in 2020 that they will have, a material effect on our operations, they could in the future.
POTENTIAL CHANGES IN POLLUTION REGULATION
State governments in the U.S. continue to promulgate total maximum daily load (TMDL) requirements for pollutants in water bodies that do not meet state or EPA water quality standards. State TMDL requirements may set:
| • | limits on pollutants that may be discharged to a body of water; or |
|---|
| • | additional requirements, such as best management practices for nonpoint sources, including timberland operations, to reduce the amounts of pollutants. |
|---|
Moreover, some states, including at least two in which we operate, have adopted or have introduced legislation to adopt human-health-based water quality standards. These requirements may alter or introduce restrictions on some of our silviculture activities, notably the application of pesticides and herbicides to our timberlands in some areas. In Canada, various levels of government have been working to address water issues including use, quality and management. Recent areas of focus include water allocation, regional watershed protection, protection of drinking water, water pricing and a national water quality index.
Although these developments have not had, and we do not expect in 2020 that they will have, a material effect on our operations, they could in the future.
WEYERHAEUSER COMPANY > 2019 ANNUAL REPORT AND FORM 10-K 23
FORWARD-LOOKING STATEMENTS
This report contains statements concerning our future results and performance that are forward-looking statements within the meaning of the Private Securities Litigation Reform Act of 1995. These statements often reference or describe our expected future financial and operating performance; our plans, strategies, intentions and expectations; our operational excellence and other strategic initiatives, including those pertaining to operating and other costs, product development and production; estimated taxes and tax rates; future debt payments; future restructuring charges; expected results of litigation and other legal proceedings and contingent liabilities, and the sufficiency of litigation and other contingent liability reserves; expected uses of cash, including future dividends and share repurchases; expected capital expenditures; expected economic conditions, including markets, pricing and demand for our products; laws and regulations relevant to our businesses and our expectations relating to pension contributions, returns on invested pension plan assets and expected benefit payments.
Forward-looking statements can be identified by the fact that they do not relate strictly to historical or current facts. They often involve use of words such as expects, may, should, will, believes, anticipates, estimates, projects, intends, plans, targets or approximately, or similar words or terminology. They may use the positive, negative or another variation of those and similar words. These forward-looking statements are based on our current expectations and assumptions and are not guarantees of future events or performance. The realization of our expectations and the accuracy of our assumptions are subject to a number of risks and uncertainties that could cause actual results to differ materially from those described in the forward-looking statements. The factors listed below and those described under Risk Factors and Management's Discussion and Analysis of Financial Condition and Results of Operations (MD&A), as well as other factors not described herein because they are not currently known to us or we currently judge them to be immaterial, may cause our actual results to differ significantly from our forward-looking statements. There is no guarantee that any of the events anticipated by our forward-looking statements will occur. Or if any of the events occur, there is no guarantee what effect it will have on our operations, cash flows, or financial condition. We undertake no obligation to update our forward-looking statements after the date of this report.
RISKS, UNCERTAINTIES AND ASSUMPTIONS
Major risks and uncertainties, and assumptions that we make, that affect our business and may cause actual results to differ materially from the content of these forward-looking statements include, but are not limited to:
| • | the effect of general economic conditions, including employment rates, interest rate levels, housing starts, general availability of financing for home mortgages and the relative strength of the U.S. dollar; |
|---|
| • | market demand for the company's products, including market demand for our timberland properties with higher and better uses, which is related to, among other factors, the strength of the various U.S. business segments and U.S. and international economic conditions; |
|---|
| • | changes in currency exchange rates, particularly the relative value of the U.S. dollar to the Japanese yen, the Chinese yuan, and the Canadian dollar, and the relative value of the euro to the yen; |
|---|
| • | restrictions on international trade and tariffs imposed on imports or exports; |
|---|
| • | the availability and cost of shipping and transportation; |
|---|
| • | economic activity in Asia, especially Japan and China; |
|---|
| • | performance of our manufacturing operations, including maintenance and capital requirements; |
|---|
| • | potential disruptions in our manufacturing operations; |
|---|
| • | the level of competition from domestic and foreign producers; |
|---|
| • | the successful execution of our internal plans and strategic initiatives, including restructuring and cost reduction initiatives; |
|---|
| • | the successful and timely execution and integration of our strategic acquisitions, including our ability to realize expected benefits and synergies, and the successful and timely execution of our strategic divestitures, each of which is subject to a number of risks and conditions beyond our control including, but not limited to, timing and required regulatory approvals; |
|---|
| • | raw material availability and prices; |
|---|
| • | the effect of weather; |
|---|
| • | changes in global or regional climate conditions and governmental response to such changes; |
|---|
| • | the risk of loss from fires, floods, windstorms, hurricanes, pest infestation and other natural disasters; |
|---|
| • | energy prices; |
|---|
| • | transportation and labor availability and costs; |
|---|
| • | federal tax policies; |
|---|
| • | the effect of forestry, land use, environmental and other governmental regulations; |
|---|
| • | legal proceedings; |
|---|
| • | performance of pension fund investments and related derivatives; |
|---|
| • | the effect of timing of employee retirements and changes in the market price of our common stock on charges for share-based compensation; |
|---|
| • | the accuracy of our estimates of costs and expenses related to contingent liabilities; |
|---|
| • | changes in accounting principles and |
|---|
| • | other factors described in this report under Risk Factors and Management's Discussion and Analysis of Financial Condition and Results of Operations (MD&A). |
|---|
WEYERHAEUSER COMPANY > 2019 ANNUAL REPORT AND FORM 10-K 24
Previous: Cover and table of contents · Next: Item 1A. RISK FACTORS