 filings.tools
Item 5. MARKET FOR REGISTRANT’S COMMON EQUITY, RELATED STOCKHOLDER MATTERS AND ISSUER PURCHASES OF EQUITY SECURITIES
3K characters. Original on sec.gov ·
Item 5. MARKET FOR REGISTRANT’S COMMON EQUITY, RELATED STOCKHOLDER MATTERS AND ISSUER PURCHASES OF EQUITY SECURITIES
Market Information
Our common stock trades on the NASDAQ Global Select Market under the symbol “WYNN.” The following table sets forth the high and low sale prices for the indicated periods, as reported by the NASDAQ Global Select Market.
| High | Low | ||||||
| Year Ended December 31, 2014 | |||||||
| First Quarter | $ | 249.31 | $ | 189.03 | |||
| Second Quarter | $ | 231.00 | $ | 188.43 | |||
| Third Quarter | $ | 220.50 | $ | 172.53 | |||
| Fourth Quarter | $ | 192.45 | $ | 133.58 | |||
| Year Ended December 31, 2013 | |||||||
| First Quarter | $ | 126.98 | $ | 113.39 | |||
| Second Quarter | $ | 144.99 | $ | 114.41 | |||
| Third Quarter | $ | 159.85 | $ | 124.57 | |||
| Fourth Quarter | $ | 194.53 | $ | 155.77 |
Holders
There were approximately 193 holders of record of our common stock as of February 13, 2015.
Dividends
Wynn Resorts is a holding company and, as a result, our ability to pay dividends is dependent on our ability to obtain funds and our subsidiaries’ ability to provide funds to us. Restrictions imposed by our subsidiaries’ debt instruments significantly restrict certain key subsidiaries, including Wynn Las Vegas, LLC, Wynn America, LLC and Wynn Macau SA, from making dividends or distributions to Wynn Resorts. These restrictions are subject to certain exceptions for affiliated overhead expenses as defined in the agreements governing the debt instruments, unless certain financial and non-financial criteria have been satisfied.
In November 2014, we paid a cash dividend of $2.50 per share. In each of February 2014, May 2014, August 2014, we paid a cash dividend of $1.25 per share. In December 2013, we paid a cash dividend of $3.00 per share. In each of March 2013, June 2013, August 2013 and November 2013, we paid a cash dividend of $1.00 per share.
On February 3, 2015, we announced a cash dividend of $1.50 per share, payable on February 23, 2015 to Stockholders of record as of February 13, 2015.
Our Board of Directors will continue to periodically assess the level and appropriateness of any cash dividends.
Issuer Purchases of Equity Securities
During the fourth quarter of 2014, we had no repurchases of our common stock.
Stock Performance Graph
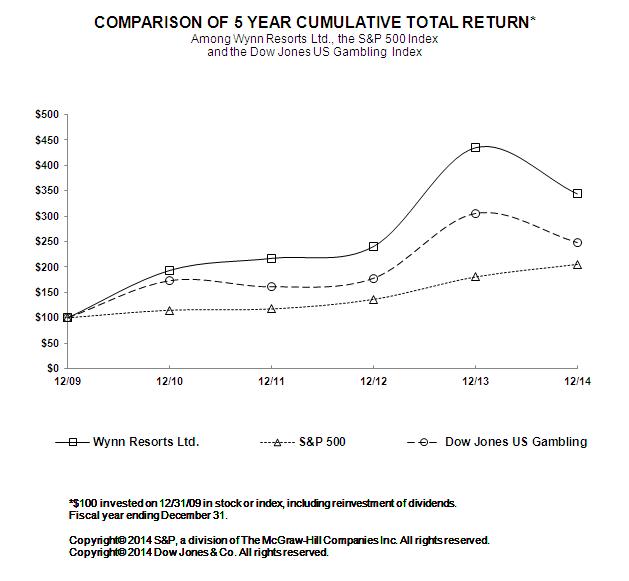
The graph below compares the five year cumulative total return on our common stock to the cumulative total return of the Standard & Poor’s 500 Stock Index (“S&P 500”) and the Dow Jones US Gambling Index. The performance graph assumes that $100 was invested on December 31, 2009 in each of the Company’s common stock, the S&P 500 and the Dow Jones US Gambling Index, and that all dividends were reinvested. The stock price performance shown in this graph is neither necessarily indicative of, nor intended to suggest, future stock price performance.
Previous: Item 4. MINE SAFETY DISCLOSURES · Next: Item 6. SELECTED FINANCIAL DATA