 filings.tools
Item 5. Market for Registrant's Common Equity, Related Stockholder Matters and Issuer Purchases of Equity Securities
3K characters. Original on sec.gov · Markdown
Item 5. Market for Registrant's Common Equity, Related Stockholder Matters and Issuer Purchases of Equity Securities
Market Information and Related Stockholder Matters
Our outstanding common stock trades on the Nasdaq Global Select Market under the symbol "WYNN."
On May 6, 2020, the Company announced that it had suspended its quarterly dividend program due to the financial impact of the COVID-19 pandemic.
On February 11, 2021, the Company completed a registered public offering of 7,475,000 newly issued shares of its common stock, par value $0.01 per share, at a price of $115.00 per share for proceeds of $842.4 million, net of $17.2 million in underwriting discounts and commissions. The Company intends to use the net proceeds from this equity offering for general corporate purposes.
Holders
There were approximately 145 holders of record of our common stock as of February 16, 2021.
Issuer Purchases of Equity Securities
The following table summarizes the shares repurchased in satisfaction of tax withholding obligations on vested restricted stock during the quarter ended December 31, 2020:
| For the Month Ended | Number of Shares Repurchased | Weighted Average Price Paid Per Share | Approximate Dollar Value of Repurchased Shares (in thousands) | |||||||||||||||||
| October 31, 2020 | 137 | $ | 71.45 | $ | 10 | |||||||||||||||
| November 30, 2020 | 16,514 | $ | 76.27 | $ | 1,259 | |||||||||||||||
| December 31, 2020 | 6,795 | $ | 106.87 | $ | 726 |
None of the foregoing repurchases that occurred during the three months ended December 31, 2020 were part of the Company's publicly announced repurchase program. As of December 31, 2020, we had $800.1 million in repurchase authority under the program.
For more information on the Company's publicly announced repurchase program, see Item 8—"Financial Statements and Supplementary Data," Note 8, "Stockholders' Equity (Deficit)."
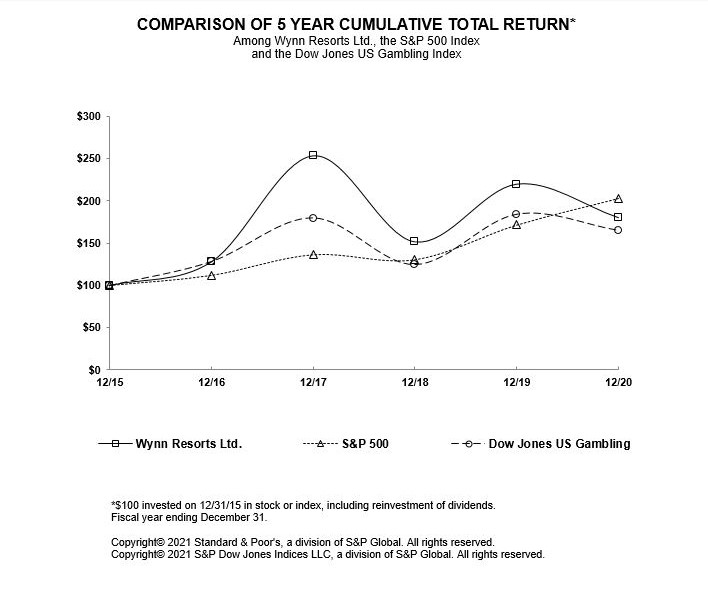
Stock Performance Graph
The graph below compares the five-year cumulative total return on our common stock to the cumulative total return of the Standard & Poor's 500 Stock Index ("S&P 500") and the Dow Jones US Gambling Index. The performance graph assumes that $100 was invested on December 31, 2014 in each of the Company's common stock, the S&P 500 and the Dow Jones US Gambling Index, and that all dividends were reinvested. The stock price performance shown in this graph is neither necessarily indicative of, nor intended to suggest, future stock price performance.
Previous: Item 4. Mine Safety Disclosures · Next: Item 6. Selected Financial Data