 filings.tools
Item 1. Business
81K characters. Original on sec.gov · Markdown
Item 1. Business
ABBREVIATIONS AND INDUSTRY TERMS
| Xcel Energy Inc.’s Subsidiaries and Affiliates (current and former) | |
| Capital Services | Capital Services, LLC |
| Eloigne | Eloigne Company |
| e prime | e prime inc. |
| NCE | New Century Energies, Inc. |
| NSP-Minnesota | Northern States Power Company, a Minnesota corporation |
| NSP System | The electric production and transmission system of NSP-Minnesota and NSP-Wisconsin operated on an integrated basis and managed by NSP-Minnesota |
| NSP-Wisconsin | Northern States Power Company, a Wisconsin corporation |
| Operating companies | NSP-Minnesota, NSP-Wisconsin, PSCo and SPS |
| PSCo | Public Service Company of Colorado |
| SPS | Southwestern Public Service Co. |
| Utility subsidiaries | NSP-Minnesota, NSP-Wisconsin, PSCo and SPS |
| WGI | WestGas InterState, Inc. |
| WYCO | WYCO Development, LLC |
| Xcel Energy | Xcel Energy Inc. and its subsidiaries |
| Federal and State Regulatory Agencies | |
| CPUC | Colorado Public Utilities Commission |
| D.C. Circuit | United States Court of Appeals for the District of Columbia Circuit |
| DOC | Minnesota Department of Commerce |
| DOE | United States Department of Energy |
| DOJ | Department of Justice |
| DOT | United States Department of Transportation |
| EPA | United States Environmental Protection Agency |
| FERC | Federal Energy Regulatory Commission |
| Fifth Circuit | United States Court of Appeals for the Fifth Circuit |
| IRS | Internal Revenue Service |
| Minnesota District Court | U.S. District Court for the District of Minnesota |
| MPSC | Michigan Public Service Commission |
| MPUC | Minnesota Public Utilities Commission |
| NDPSC | North Dakota Public Service Commission |
| NERC | North American Electric Reliability Corporation |
| Ninth Circuit | U.S. Court of Appeals for the Ninth Circuit |
| NMPRC | New Mexico Public Regulation Commission |
| NRC | Nuclear Regulatory Commission |
| OAG | Minnesota Office of the Attorney General |
| PHMSA | Pipeline and Hazardous Materials Safety Administration |
| PSCW | Public Service Commission of Wisconsin |
| PUCT | Public Utility Commission of Texas |
| SDPUC | South Dakota Public Utilities Commission |
| SEC | Securities and Exchange Commission |
| TCEQ | Texas Commission on Environmental Quality |
| Electric, Purchased Gas and Resource Adjustment Clauses | |
| CIP | Conservation improvement program |
| DCRF | Distribution cost recovery factor |
| DSM | Demand side management |
| DSMCA | Demand side management cost adjustment |
| ECA | Retail electric commodity adjustment |
| EE | Energy efficiency |
| EECRF | Energy efficiency cost recovery factor |
| EIR | Environmental improvement rider |
| FCA | Fuel clause adjustment |
| FPPCAC | Fuel and purchased power cost adjustment clause |
| GCA | Gas cost adjustment |
| GUIC | Gas utility infrastructure cost rider |
| PCCA | Purchased capacity cost adjustment |
| PCRF | Power cost recovery factor |
| PGA | Purchased gas adjustment |
| PSIA | Pipeline system integrity adjustment |
| RDF | Renewable development fund |
| RER | Renewable energy rider |
| RES | Renewable energy standard |
| RESA | Renewable energy standard adjustment |
| SCA | Steam cost adjustment |
| SEP | State energy policy rider |
| TCA | Transmission cost adjustment |
| TCR | Transmission cost recovery adjustment |
| TCRF | Transmission cost recovery factor |
| WCA | Windsource® cost adjustment |
| Other | |
| AFUDC | Allowance for funds used during construction |
| ALJ | Administrative law judge |
| APBO | Accumulated postretirement benefit obligation |
| ARAM | Average rate assumption method |
| ARO | Asset retirement obligation |
| ASC | FASB Accounting Standards Codification |
| ASU | FASB Accounting Standards Update |
| ATM | At-the-market |
| ATRR | Annual transmission revenue requirement |
| BART | Best available retrofit technology |
| Boulder | City of Boulder, CO |
| C&I | Commercial and Industrial |
| CAPM | Capital Asset Pricing Model |
| CACJA | Clean Air Clean Jobs Act |
| CAISO | California Independent System Operator |
| CapX2020 | Alliance of electric cooperatives, municipals and investor-owned utilities in the upper Midwest involved in a joint transmission line planning and construction effort |
| CBA | Collective-bargaining agreement |
| CCR | Coal combustion residuals |
| CCR Rule | Final rule (40 CFR 257.50 - 257.107) published by the EPA regulating the management, storage and disposal of CCRs as a nonhazardous waste |
| CDD | Cooling degree-days |
| CEP | Colorado Energy Plan |
| CIG | Colorado Interstate Gas Company, LLC |
| CO2 | Carbon dioxide |
| Corps | U.S. Army Corps of Engineers |
| CPCN | Certificate of public convenience and necessity |
| CPP | Clean Power Plan |
| CWA | Clean Water Act |
| CWIP | Construction work in progress |
| DCF | Discounted Cash Flows |
| DECON | Decommissioning method where radioactive contamination is removed and safely disposed at a requisite facility, or decontaminated to a permitted level. |
| DRC | Development Recovery Company |
| DRIP | Dividend Reinvestment Program |
| EEI | Edison Electric Institute |
| ELG | Effluent limitations guidelines |
| EMANI | European Mutual Association for Nuclear Insurance |
| EPS | Earnings per share |
| EPU | Extended power uprate |
| ERP | Electric resource plan |
| ETR | Effective tax rate |
| FASB | Financial Accounting Standards Board |
| FTR | Financial transmission right |
| GAAP | Generally accepted accounting principles |
| GE | General Electric |
| GHG | Greenhouse gas |
| HDD | Heating degree-days |
| HTY | Historic test year |
| IM | Integrated market |
| IPP | Independent power producing entity |
| IRC | Internal Revenue Code |
| IRP | Integrated Resource Plan |
| ISFSI | Independent Spent Fuel Storage Installation |
| ITC | Investment Tax Credit |
| JOA | Joint operating agreement |
| LCM | Life cycle management |
| LLW | Low-level radioactive waste |
| LSP Transmission | LSP Transmission Holdings, LLC |
| Mankato 1 | Mankato Energy Center, LLC |
| Mankato 2 | Mankato Energy Center II, LLC |
| MDL | Multi-district litigation |
| MGP | Manufactured gas plant |
| MISO | Midcontinent Independent System Operator, Inc. |
| Moody’s | Moody’s Investor Services |
| NAAQS | National Ambient Air Quality Standard |
| Native load | Demand of retail and wholesale customers that a utility has an obligation to serve under statute or contract |
| NAV | Net asset value |
| NEIL | Nuclear Electric Insurance Ltd. |
| NETO | New England Transmission Owners |
| NOL | Net operating loss |
| NOX | Nitrogen oxide |
| O&M | Operating and maintenance |
| OATT | Open Access Transmission Tariff |
| OCC | Office of Consumer Counsel |
| Opinion 531 | Methodology for calculating base ROE adopted by the FERC in June 2014 |
| Paris Agreement | Establishes a framework for GHG mitigation actions by all countries (“nationally determined contributions”) |
| PI | Prairie Island nuclear generating plant |
| PJM | PJM Interconnection, LLC |
| PM | Particulate matter |
| Post-65 | Post-Medicare |
| PPA | Purchased power agreement |
| Pre-65 | Pre-Medicare |
| PRP | Potentially responsible party |
| PTC | Production tax credit |
| QF | Qualifying facilities |
| R&E | Research and experimentation |
| REC | Renewable energy credit |
| RFP | Request for proposal |
| ROE | Return on equity |
| ROFR | Right-of-first-refusal |
| RPS | Renewable portfolio standards |
| RTO | Regional Transmission Organization |
| Standard & Poor’s | Standard & Poor’s Ratings Services |
| SAB | Staff Accounting Bulletin |
| SAB 118 | Income Tax Accounting Implications of the Tax Cuts and Jobs Act |
| SERP | Supplemental executive retirement plan |
| SMMPA | Southern Minnesota Municipal Power Agency |
| SO2 | Sulfur dioxide |
| SPP | Southwest Power Pool, Inc. |
| SSL | Statistically significant increase over established groundwater standards |
| TCEH | Texas Competitive Energy Holdings |
| TCJA | 2017 federal tax reform enacted as Public Law No: 115-97, commonly referred to as the Tax Cuts and Jobs Act |
| THI | Temperature-humidity index |
| TOs | Transmission owners |
| TransCo | Transmission-only subsidiary |
| TSR | Total shareholder return |
| VaR | Value at Risk |
| VIE | Variable interest entity |
| WOTUS | Waters of the U.S. |
| Measurements | |
| Bcf | Billion cubic feet |
| KV | Kilovolts |
| KWh | Kilowatt hours |
| MMBtu | Million British thermal units |
| MW | Megawatts |
| MWh | Megawatt hours |
Forward-Looking Statements
Except for the historical statements contained in this report, the matters discussed herein are forward-looking statements that are subject to certain risks, uncertainties and assumptions. Such forward-looking statements, including the 2019 EPS guidance, long-term EPS and dividend growth rate, as well as assumptions and other statements are intended to be identified in this document by the words “anticipate,” “believe,” “could,” “estimate,” “expect,” “intend,” “may,” “objective,” “outlook,” “plan,” “project,” “possible,” “potential,” “should,” “will,” “would” and similar expressions. Actual results may vary materially. Forward-looking statements speak only as of the date they are made, and we expressly disclaim any obligation to update any forward-looking information. The following factors, in addition to those discussed elsewhere in this Annual Report on Form 10-K for the fiscal year ended Dec. 31, 2018 (including the items described under Factors Affecting Results of Operations; and the other risk factors listed from time to time by Xcel Energy Inc. in reports filed with the SEC, including “Risk Factors” in Item 1A of this Annual Report on Form 10-K hereto), could cause actual results to differ materially from management expectations as suggested by such forward-looking information: changes in environmental laws and regulations; climate change and other weather, natural disaster and resource depletion, including compliance with any accompanying legislative and regulatory changes; ability of subsidiaries to recover costs from customers; reductions in our credit ratings and the cost of maintaining certain contractual relationships; general economic conditions, including inflation rates, monetary fluctuations and their impact on capital expenditures and the ability of Xcel Energy Inc. and its subsidiaries to obtain financing on favorable terms; availability or cost of capital; our customers’ and counterparties’ ability to pay their debts to us; assumptions and costs relating to funding our employee benefit plans and health care benefits; our subsidiaries’ ability to make dividend payments; tax laws; operational safety, including our nuclear generation facilities; successful long-term operational planning; commodity risks associated with energy markets and production; rising energy prices; costs of potential regulatory penalties; effects of geopolitical events, including war and acts of terrorism; cyber security threats and data security breaches; fuel costs; and employee work force and third party contractor factors.
Where To Find More Information
Xcel Energy’s website address is www.xcelenergy.com. Xcel Energy makes available, free of charge through its website, its annual report on Form 10-K, quarterly reports on Form 10-Q, current reports on Form 8-K and all amendments to those reports filed or furnished pursuant to Section 13(a) or 15(d) of the Securities Exchange Act of 1934 as soon as reasonably practicable after the reports are electronically filed with or furnished to the SEC. The SEC maintains an internet site that contains reports, proxy and information statements, and other information regarding issuers that file electronically at http://www.sec.gov.
COMPANY OVERVIEW
Xcel Energy Inc. and its subsidiaries (“Xcel Energy” or the “Company”) is a major U.S. regulated electric and natural gas delivery company which serves customers in eight mid-western and western states, including portions of Colorado, Michigan, Minnesota, New Mexico, North Dakota, South Dakota, Texas and Wisconsin. The Company provides a comprehensive portfolio of energy-related products and services to approximately 3.6 million electric customers and 2.0 million natural gas customers through four operating companies (e.g., NSP-Minnesota, NSP-Wisconsin, PSCo and SPS).
Xcel Energy‘s vision is to be the preferred and trusted provider of the energy our customers need and we strive to provide our investors an attractive total return value proposition and customers with safe, clean and reliable energy services at a competitive price. This mission is enabled via three key strategic priorities:
| • | Lead the clean energy transition; |
| • | Enhance the customer experience; and, |
| • | Keep the bills low. |
Xcel Energy is an environmental leader and in 2018 was the first major utility in the nation to announce a vision to serve all customers with 100% zero-carbon emissions by 2050. The Company is also implementing the nation’s largest multi-state wind plan with 12 new, low-cost wind farms across seven states. By leading the clean energy transition, we have positioned ourselves to create economic development for the communities and customers we serve.
See Item 7. Management’s Discussion and Analysis of Financial Condition and Results of Operations — Management’s Strategic Priorities for further discussion.

- Holding company incorporated under the laws of Minnesota in 1909 and its executive offices are located at 414 Nicollet Mall, Minneapolis, MN 55401.
NSP-Minnesota
NSP-Minnesota conducts business in Minnesota, North Dakota and South Dakota and has electric operations in all three states including the generation, purchase, transmission, distribution and sale of electricity as managed on the NSP System. NSP-Minnesota also purchases, transports, distributes and sells natural gas to retail customers and transports customer-owned natural gas in Minnesota and North Dakota.
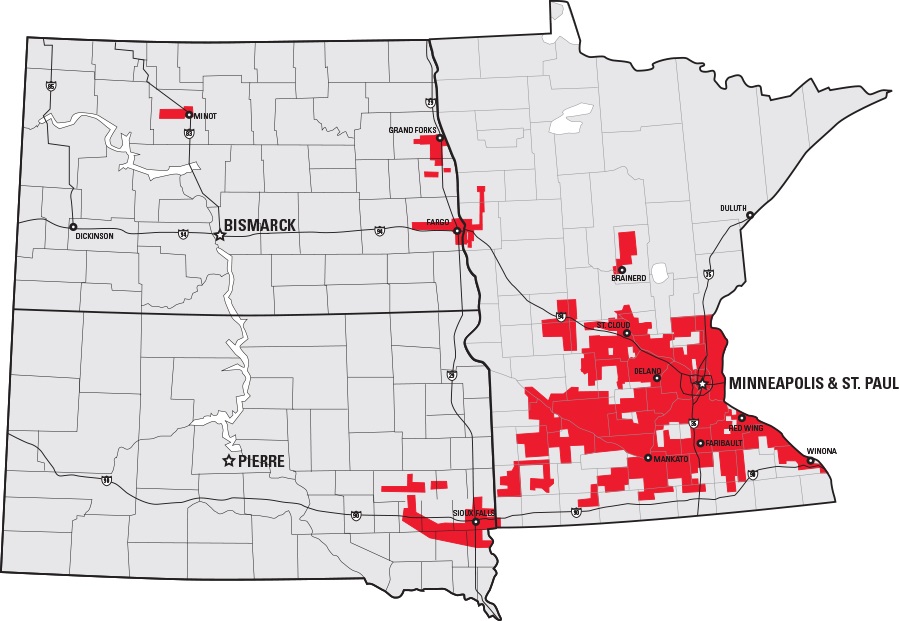 | |||
| NSP-Minnesota | |||
| Electric customers | 1.5 million | ||
| Natural gas customers | 0.5 million | ||
| Consolidated earnings contribution | 35% to 45% | ||
| Total assets | $18.5 billion | ||
| Electric generating capacity | 7,530 MW | ||
| Gas storage capacity | 14.7 Bcf | ||
NSP-Wisconsin
NSP-Wisconsin conducts business in Wisconsin and Michigan and generates, transmits, distributes and sells electricity as managed on the NSP System. NSP-Wisconsin also purchases, transports, distributes and sells natural gas to retail customers and transports customer-owned natural gas.
 | |||
| NSP-Wisconsin | |||
| Electric customers | 0.3 million | ||
| Natural gas customers | 0.1 million | ||
| Consolidated earnings contribution | 5% to 10% | ||
| Total assets | $2.7 billion | ||
| Electric generating capacity | 563 MW | ||
| Gas storage capacity | 3.6 Bcf | ||
PSCo
PSCo conducts business in Colorado and generates, purchases, transmits, distributes and sells electricity in addition to purchasing, transporting, distributing and selling natural gas to retail customers and transporting customer-owned natural gas.
 | |||
| PSCo | |||
| Electric customers | 1.5 million | ||
| Natural gas customers | 1.4 million | ||
| Consolidated earnings contribution | 35% to 45% | ||
| Total assets | $17.3 billion | ||
| Electric generating capacity | 5,685 MW | ||
| Gas storage capacity | 27.1 Bcf | ||
SPS
SPS conducts business in Texas and New Mexico and generates, purchases, transmits, distributes and sells electricity.
 | |||
| SPS | |||
| Electric customers | 0.4 million | ||
| Consolidated earnings contribution | 15% to 20% | ||
| Total assets | $6.7 billion | ||
| Electric generating capacity | 4,406 MW | ||
ELECTRIC UTILITY OPERATIONS
Electric Operating Statistics
| Year Ended Dec. 31 | |||||||||||
| 2018 | 2017 | 2016 | |||||||||
| Electric sales (Millions of KWh) | |||||||||||
| Residential | 25,518 | 24,216 | 24,726 | ||||||||
| Large C&I | 28,686 | 27,951 | 27,664 | ||||||||
| Small C&I | 36,308 | 35,493 | 35,830 | ||||||||
| Public authorities and other | 1,071 | 1,055 | 1,103 | ||||||||
| Total retail | 91,583 | 88,715 | 89,323 | ||||||||
| Sales for resale | 24,199 | 18,349 | 18,694 | ||||||||
| Total energy sold | 115,782 | 107,064 | 108,017 | ||||||||
| Number of customers at end of period | |||||||||||
| Residential | 3,117,262 | 3,082,974 | 3,053,732 | ||||||||
| Large C&I | 1,253 | 1,241 | 1,228 | ||||||||
| Small C&I | 436,836 | 433,883 | 432,012 | ||||||||
| Public authorities and other | 69,794 | 69,376 | 68,935 | ||||||||
| Total retail | 3,625,145 | 3,587,474 | 3,555,907 | ||||||||
| Wholesale | 70 | 58 | 52 | ||||||||
| Total customers | 3,625,215 | 3,587,532 | 3,555,959 | ||||||||
| Electric revenues (Millions of Dollars) | |||||||||||
| Residential | $ | 3,006 | $ | 2,975 | $ | 2,966 | |||||
| Large C&I | 1,696 | 1,779 | 1,707 | ||||||||
| Small C&I | 3,343 | 3,463 | 3,328 | ||||||||
| Public authorities and other | 136 | 143 | 140 | ||||||||
| Total retail | 8,181 | 8,360 | 8,141 | ||||||||
| Wholesale | 801 | 719 | 693 | ||||||||
| Other electric revenues | 737 | 597 | 666 | ||||||||
| Total electric revenues | $ | 9,719 | $ | 9,676 | $ | 9,500 | |||||
| KWh sales per retail customer | 25,263 | 24,729 | 25,120 | ||||||||
| Revenue per retail customer | $ | 2,257 | $ | 2,330 | $ | 2,289 | |||||
| Residential revenue per KWh | 11.78 | ¢ | 12.29 | ¢ | 11.99 | ¢ | |||||
| Large C&I revenue per KWh | 5.91 | 6.36 | 6.17 | ||||||||
| Small C&I revenue per KWh | 9.21 | 9.76 | 9.29 | ||||||||
| Total retail revenue per KWh | 8.93 | 9.42 | 9.11 | ||||||||
| Wholesale revenue per KWh | 3.31 | 3.92 | 3.71 |
Energy Sources 2018


Distributed generation from the SolarRewards® program is not included (approximately 432 million KWh for 2018).
Energy Source Statistics
| Xcel Energy | NSP System | PSCo | SPS | ||||||||
| 2018 | |||||||||||
| Owned Generation | 67 | % | 77 | % | 70 | % | 49 | % | |||
| Purchased Generation | 33 | 23 | 30 | 51 | |||||||
| 100 | % | 100 | % | 100 | % | 100 | % | ||||
| 2017 | |||||||||||
| Owned Generation | 66 | % | 75 | % | 70 | % | 47 | % | |||
| Purchased Generation | 34 | 25 | 30 | 53 | |||||||
| 100 | % | 100 | % | 100 | % | 100 | % |
Renewable Sources
Xcel Energy’s renewable energy portfolio includes wind, hydroelectric, biomass and solar power from both owned generating facilities and PPAs. As of Dec. 31, 2018, each utility or system was in compliance with their applicable RPS. Renewable percentages will vary year over year based on local weather, system demand and transmission constraints.
NSP System
Renewable energy as a percentage of the NSP System’s total:
| 2018 | 2017 | |||||
| Wind | 16.4 | % | 18.3 | % | ||
| Hydroelectric | 5.8 | 6.3 | ||||
| Biomass and solar | 4.8 | 4.2 | ||||
| Renewable | 27.0 | % | 28.8 | % |
Wind — The NSP System has more than 130 PPAs ranging from under one MW to more than 200 MW. The NSP System owns and operates five wind farms with 840 MW, net, of capacity.
| • | The NSP System had approximately 2,550 MW and 2,600 MW of wind energy on its system at the end of 2018 and 2017, respectively. |
| • | Average cost per MWh of wind energy under existing PPAs was approximately $44 for 2018 and 2017. |
| • | Average cost per MWh of wind energy from owned generation was approximately $37 and $42 for 2018 and 2017, respectively. |
PSCo
Renewable energy as a percentage of PSCo’s total:
| 2018 | 2017 | |||||
| Wind | 23.8 | % | 23.7 | % | ||
| Hydroelectric and solar | 3.6 | 3.9 | ||||
| Renewable | 27.4 | % | 27.6 | % |
Wind — PSCo has 19 PPAs ranging from two MW to over 300 MW. PSCo owns and operates the Rush Creek wind farm which has 600 MW, net, of capacity.
| • | PSCo had approximately 3,160 MW and 2,560 MW of wind energy on its system at the end of 2018 and 2017, respectively. |
| • | Average cost per MWh of wind energy under these contracts was approximately $43 and $42 for 2018 and 2017, respectively. |
| • | Rush Creek became operational in December 2018. The 2019 average cost per MWh is expected to be $29. |
SPS
Renewable energy as a percentage of SPS’ total:
| 2018 | 2017 | |||||
| Wind | 19.1 | % | 21.2 | % | ||
| Solar | 2.0 | 2.8 | ||||
| Renewable | 21.1 | % | 24.0 | % |
Wind — SPS has 18 PPAs with facilities ranging from under one MW to 250 MW.
| • | SPS had approximately 1,565 MW and 1,500 MW of wind energy on its system at the end of 2018 and 2017, respectively. |
| • | Average cost per MWh of wind energy under the IPP contracts and QF tariffs was approximately $26 and $27 for 2018 and 2017, respectively. |
| • | In 2018, SPS began construction on the Sagamore and Hale County wind farms. Refer to the SPS Wind Development section for further information. |
Non-Renewable Sources
Delivered cost per MMBtu of each significant category of fuel consumed for owned electric generation and the percentage of total fuel requirements represented by each category of fuel:
| Coal (a) | Nuclear | Natural Gas | |||||||||||||||||||
| Cost | Percent | Cost | Percent | Cost | Percent | ||||||||||||||||
| NSP System | |||||||||||||||||||||
| 2018 | $ | 2.13 | 42 | % | $ | 0.80 | 45 | % | $ | 3.87 | 13 | % | |||||||||
| 2017 | 2.08 | 45 | 0.78 | 45 | 4.10 | 10 | |||||||||||||||
| PSCo | |||||||||||||||||||||
| 2018 | 1.45 | 62 | — | — | 3.74 | 38 | |||||||||||||||
| 2017 | 1.56 | 70 | — | — | 3.82 | 30 | |||||||||||||||
| SPS | |||||||||||||||||||||
| 2018 | 2.04 | 56 | — | — | 2.24 | 44 | |||||||||||||||
| 2017 | 2.18 | 74 | — | — | 3.39 | 26 |
| (a) | Includes refuse-derived fuel and wood for the NSP System. |
Weighted average cost per MMBtu of all fuels for owned electric generation:
| NSP System | PSCo | SPS | ||||||||||
| 2018 | $ | 1.78 | $ | 2.33 | $ | 2.13 | ||||||
| 2017 | 1.72 | 2.25 | 2.50 |
See Items 1A and 7 for further information.
Coal — Inventory maintained (in days):
| Normal | Dec. 31, 2018 Actual | Dec. 31, 2017 Actual (a) | |||
| NSP System | 35 - 50 | 47 | 53 | ||
| PSCo | 35 - 50 | 48 | 48 | ||
| SPS | 35 - 50 | 44 | 52 |
| (a) | Milder weather, purchase commitments and low power and natural gas prices impacted coal inventory levels. |
Coal requirements (in million tons):
| 2018 | 2017 | |||
| NSP System | 7.8 | 8.0 | ||
| PSCo | 9.4 | 10.0 | ||
| SPS | 5.1 | 5.5 |
Coal supply as a percentage of requirements (in million tons) for 2019:
| Contracted Coal Supply | 2019 Estimated Requirements | ||
| NSP System (a) | 76% | (b) | 8.4 |
| PSCo (a) | 83 | 8.4 | |
| SPS (a) | 64 | 4.1 |
| (a) | The general coal purchasing objective is to contract for approximately 75% of first year requirements, 40% of year two requirements and 20% of year three requirements. |
| (b) | Increase in estimated million tons was due to lower delivered coal prices at Sherco in January 2019, combined with higher future forecasted gas prices for 2019 (higher burn forecast). |
Contracted coal transportation as a percentage of requirements in 2019 and 2020:
| 2019 | 2020 | ||
| NSP System | 100% | 100% | |
| PSCo | 100 | 100 | |
| SPS | 100 | 100 |
Natural Gas — Natural gas supplies, transportation and storage services for power plants are procured to provide an adequate supply of fuel. Remaining requirements are procured through a liquid spot market. Generally, natural gas supply contracts have variable pricing that is tied to natural gas indices. Natural gas supply and transportation agreements include obligations for the purchase and/or delivery of specified volumes or payments in lieu of delivery.
Contracts and commitments at Dec. 31:
| NSP System | PSCo | SPS | ||||||||||||||||||||||
| (Millions of Dollars) | Gas Supply | Gas Transportation and Storage (a) | Gas Supply (b) | Gas Transportation and Storage (a) | Gas Supply | Gas Transportation and Storage (a) | ||||||||||||||||||
| 2018 | $ | — | $ | 406 | $ | 412 | $ | 589 | $ | 20 | $ | 152 | ||||||||||||
| 2017 | — | 398 | 545 | 620 | 11 | 191 | ||||||||||||||||||
| Year of Expiration | N/A | 2020 - 2037 | 2021 - 2023 | 2019 - 2040 | One year or less | 2019 - 2033 |
| (a) | For incremental supplies, there are limited on-site fuel storage facilities, with a primary reliance on the spot market. |
| (b) | Majority of natural gas supply under contract is covered by a long-term agreement with Anadarko Energy Services Company and the balance of natural gas supply contracts have variable pricing features tied to changes in various natural gas indices. PSCo hedges a portion of that risk through financial instruments. See Note 10 to the consolidated financial statements for further information. |
Nuclear — NSP-Minnesota secures contracts for uranium concentrates, uranium conversion, uranium enrichment and fuel fabrication to operate its nuclear plants. The contract strategy involves a portfolio of spot purchases and medium and long-term contracts for uranium concentrates, conversion services and enrichment services with multiple producers and with a focus on diversification to minimize potential impacts caused by supply interruptions due to geographical and world political issues.
| • | Current nuclear fuel supply contracts cover 100% of uranium concentrates requirements through 2021 and approximately 51% of the requirements for 2022 - 2033. |
| • | Current contracts for conversion services cover 100% of the requirements through 2021 and approximately 43% of the requirements for 2022 - 2033. |
| • | Current enrichment service contracts cover 100% of the requirements through 2025 and approximately 19% of the requirements for 2026 - 2033. |
Fabrication services for Monticello and PI are 100% committed through 2030 and 2027, respectively.
NSP-Minnesota expects sufficient uranium concentrates, conversion services and enrichment services to be available for the requirements of its nuclear generating plants. Some exposure to market price volatility will remain due to index-based pricing structures contained in supply contracts.
See Item 7 for further information.
Capacity and Demand
Uninterrupted system peak demand and date for the regulated utilities:
| System Peak Demand (in MW) | |||||||||
| 2018 | 2017 | ||||||||
| NSP System (a) | 8,927 | June 29 | 8,546 | July 17 | |||||
| PSCo (a) | 6,718 | July 10 | 6,671 | July 19 | |||||
| SPS (a) | 4,648 | July 19 | 4,374 | July 26 |
| (a) | Peak demand typically occurs in the summer. The increase in peak load from 2017 to 2018 is partly due to warmer weather in 2018. |
NSP-Minnesota
Public Utility Regulation
Summary of Regulatory Agencies and Areas of Jurisdiction — Retail rates, services and other aspects of NSP-Minnesota’s operations are regulated by the MPUC, NDPSC and SDPUC. The MPUC also has regulatory authority over security issuances, certain property transfers, mergers, dispositions of assets and transactions between NSP-Minnesota and its affiliates. In addition, the MPUC reviews and approves NSP-Minnesota’s IRPs for meeting future energy needs. In addition, MPUC certifies the need and siting for generating plants greater than 50 MW and transmission lines greater than 100 KV that will be located within the state. The NDPSC and SDPUC have regulatory authority over generation and transmission facilities, along with the siting and routing of new generation and transmission facilities in North Dakota and South Dakota, respectively.
NSP-Minnesota is subject to the jurisdiction of the FERC for its wholesale electric operations, hydroelectric licensing, accounting practices, wholesale sales for resale, transmission of electricity in interstate commerce, compliance with NERC electric reliability standards, asset transfers and mergers, and natural gas transactions in interstate commerce.
NSP-Minnesota is a transmission owning member of the MISO RTO and operates within the MISO RTO and MISO wholesale markets. NSP-Minnesota makes wholesale sales in other RTO markets at market-based rates. NSP-Minnesota and NSP-Wisconsin also make wholesale electric sales at market-based prices to customers outside of their balancing authority as jointly authorized by the FERC.
Fuel, Purchased Energy and Conservation Cost-Recovery
Mechanisms —
| • | CIP rider — Recovers the costs of conservation and demand-side management programs. |
| • | EIR — Recovers the costs of environmental improvement projects. |
| • | RDF — Allocates money collected from retail customers to support the research and development of emerging renewable energy projects and technologies. |
| • | RES — Recovers the cost of renewable generation in Minnesota. |
| • | RER — Recovers the cost of renewable generation located in North Dakota. |
| • | SEP — Recovers costs related to various energy policies approved by the Minnesota legislature. |
| • | TCR — Recovers costs associated with investments in electric transmission and distribution grid modernization costs. |
| • | Infrastructure rider — Recovers costs for investments in generation and incremental property taxes in South Dakota. |
NSP-Minnesota’s retail electric rates in Minnesota, North Dakota and South Dakota include a FCA for monthly billing adjustments to recover changes in prudently incurred costs of fuel related items and purchased energy. Capacity costs are recovered through base rates and are not recovered through the FCA. Costs associated with MISO are generally recovered through either the FCA or base rates.
In 2017, the MPUC voted to change the FCA process in Minnesota. Under the new process, each month utilities would collect amounts equal to the baseline cost of energy set at the start of the plan year (base would be reset annually). Monthly variations to the baseline costs would be tracked and netted over a 12-month period. Utilities would issue refunds above the baseline costs, and could seek recovery of any overage. Recently, the MPUC delayed implementation until January 2020.
Minnesota state law requires NSP-Minnesota to invest 2% of its state electric revenues and 0.5% of its state gas revenues in CIP. These costs are recovered through an annual cost-recovery mechanism for electric conservation and energy management program expenditures.
Energy Sources and Transmission Service Provider
NSP-Minnesota expects to use power plants, power purchases, CIP/DSM options, new generation facilities and expansion of power plants to meet its system capacity requirements.
Purchased Power — NSP-Minnesota has contracts to purchase power from other utilities and IPPs. Long-term purchased power contracts for dispatchable resources typically require a capacity charge and an energy charge. NSP-Minnesota makes short-term purchases to meet system requirements, replace company owned generation, meet operating reserve obligations or obtain energy at a lower cost.
Purchased Transmission Services — NSP-Minnesota and NSP-Wisconsin have contracts with MISO and other regional transmission service providers to deliver power and energy to their customers.
Wind Development — In 2017, the MPUC approved NSP-Minnesota’s proposal to add 1,550 MW of new wind generation including ownership of 1,150 MW of wind generation.
In April 2018, the MPUC approved NSP-Minnesota’s petition to build and own the Dakota Range, a 300 MW wind project in South Dakota. NSP-Minnesota’s capital investment for the Dakota Range is expected to be approximately $350 million and placed in service in 2021.
In December 2018, the NDPSC approved a settlement agreement for these wind development projects.
PPA Terminations and Amendments — In June 2018, NSP-Minnesota terminated the Benson and Laurentian PPAs, and purchased the Benson biomass facility. As a result, a $103 million regulatory asset was recognized for the costs of the Benson transaction. For Laurentian, a regulatory asset of $109 million was recognized for annual termination payments/obligations. Regulatory approvals provide for recovery of the Benson regulatory asset over 10 years and Laurentian termination payments as they occur (over six years). Termination of the PPAs is expected to save customers over $600 million throughout the next 10 years.
Jurisdictional Cost Recovery Allocation — In December 2016, NSP-Minnesota filed a resource treatment framework with the NDPSC and MPUC. The filing proposed a framework to allow NSP-Minnesota’s operations in North Dakota and Minnesota to gradually become more independent of one another with respect to future generation resource selection while also identifying a path for cost sharing of current resources. NSP-Minnesota’s filing identified two options: a legal separation, creating a separate North Dakota operating company; or a pseudo-separation, which maintains the current corporate structure but directly assigns the costs and benefits of each resource to the jurisdiction that supports it. Docket remains under consideration by the NDPSC.
Minnesota State ROFR Statute Complaint — In September 2017, LSP Transmission filed a complaint in the Minnesota District Court against the Minnesota Attorney General, MPUC and DOC. The complaint was in response to MISO assigning NSP-Minnesota and ITC Midwest, LLC to jointly own a new 345 KV transmission line from near Mankato, Minnesota to Winnebago, Minnesota. The project was estimated by MISO to cost $108 million and was assigned to NSP-Minnesota and ITC Midwest as the incumbent utilities, consistent with a Minnesota state ROFR statute. The complaint challenged the constitutionality of the state ROFR statute and is seeking declaratory judgment that the statute violates the Commerce Clause of the U.S. Constitution and should not be enforced. The Minnesota state agencies and NSP-Minnesota filed motions to dismiss. In June 2018, the Minnesota District Court granted the defendants’ motions to dismiss with prejudice. LSP Transmission filed an appeal in July 2018. It is uncertain when a decision will be rendered.
Nuclear Power Operations and Waste Disposal
NSP-Minnesota owns two nuclear generating plants: the Monticello plant and the PI plant. Nuclear power plant operations produce gaseous, liquid and solid radioactive wastes which are controlled by federal regulation. High-level radioactive wastes primarily include used nuclear fuel. LLW consists primarily of demineralizer resins, paper, protective clothing, rags, tools and equipment that have become contaminated through use in a plant.
NRC Regulation — The NRC regulates nuclear operations. Costs of complying with NRC requirements can affect both operating expenses and capital investments of the plants. NSP-Minnesota has obtained recovery of these compliance costs in customer rates and expects future compliance costs will continue to be recoverable.
LLW Disposal — LLW from NSP-Minnesota’s Monticello and PI nuclear plants is currently disposed at the Clive facility located in Utah and the Waste Control Specialists facility located in Texas. If off-site LLW disposal facilities become unavailable, NSP-Minnesota has storage capacity available on-site at PI and Monticello which would allow both plants to continue to operate until the end of their current licensed lives.
High-Level Radioactive Waste Disposal — The federal government has responsibility to permanently dispose domestic spent nuclear fuel and other high-level radioactive wastes. The Nuclear Waste Policy Act requires the DOE to implement a program for nuclear high-level waste management. This includes the siting, licensing, construction and operation of a repository for spent nuclear fuel from civilian nuclear power reactors and other high-level radioactive wastes at a permanent federal storage or disposal facility. The federal government has been evaluating a nuclear geologic repository at Yucca Mountain, Nevada for many years. Currently, there are no definitive plans for a permanent federal storage facility at Yucca Mountain or any other site.
Review of PI Costs — As part of NSP-Minnesota’s 2016 multi-year electric rate case and IRP, the MPUC ordered an investigation into NSP-Minnesota’s PI nuclear investments. The issue was resolved as part of the 2016 multi-year electric rate case settlement. In November 2018, the DOC issued a final report, in which no cost disallowances were recommended.
Nuclear Spent Fuel Storage — NSP-Minnesota has interim on-site storage for spent nuclear fuel at its Monticello and PI nuclear generating plants. Authorized storage capacity is sufficient to allow NSP-Minnesota to operate until the end of the operating licenses in 2030 for Monticello, 2033 for PI Unit 1, and 2034 for PI Unit 2. Authorizations for additional spent fuel storage capacity may be required at each site to support either continued operation or decommissioning if the federal government does not commence storage operations.
In 2013, NSP-Minnesota’s Monticello nuclear generating plant loaded and placed five storage canisters (canisters #11-15) in the ISFSI and a sixth canister (canister #16) was loaded but remained in the plant pending resolution of weld inspection issues. Successful pressure and leak testing demonstrated the safety and integrity of all six canisters involved. NSP-Minnesota took several actions to assure compliance with the NRC’s regulations and Monticello’s storage license. The NRC has approved NSP-Minnesota’s compliance plan for all canisters.
NSP-Minnesota intends to seek recovery of these costs in a future regulatory proceeding. No public safety issues have been raised, or are believed to exist, in this matter.
See Note 12 to the consolidated financial statements for further information.
Wholesale and Commodity Marketing Operations
NSP-Minnesota conducts various wholesale marketing operations, including the purchase and sale of electric capacity, energy, ancillary services and energy-related products. NSP-Minnesota uses physical and financial instruments to minimize commodity price and credit risk and hedge sales and purchases. NSP-Minnesota also engages in trading activity unrelated to hedging and sharing of any margins is determined through state regulatory proceedings as well as the operation of the FERC approved JOA. NSP-Minnesota does not serve any wholesale requirements customers at cost-based regulated rates.
NSP-Wisconsin
Public Utility Regulation
Summary of Regulatory Agencies and Areas of Jurisdiction — Retail rates, services and other aspects of NSP-Wisconsin’s operations are regulated by the PSCW and the MPSC. In addition, each of the state commissions certifies the need for new generating plants and electric transmission lines before the facilities may be sited and built. NSP-Wisconsin is subject to the jurisdiction of the FERC for its wholesale electric operations, hydroelectric generation licensing, accounting practices, wholesale sales for resale, transmission of electricity in interstate commerce, compliance with NERC electric reliability standards, asset transactions and mergers and natural gas transactions in interstate commerce. NSP-Wisconsin is a transmission owning member of the MISO RTO that operates within the MISO RTO and wholesale energy market. NSP-Wisconsin and NSP-Minnesota are jointly authorized by the FERC to make wholesale electric sales at market-based prices.
The PSCW has a biennial base rate filing requirement. By June of each odd numbered year, NSP-Wisconsin must submit a rate filing for the test year beginning the following January.
Fuel and Purchased Energy Cost Recovery Mechanisms — NSP-Wisconsin does not have an automatic electric fuel adjustment clause. Instead, under Wisconsin rules, utilities submit a forward-looking annual fuel cost plan to the PSCW. Once the PSCW approves the fuel cost plan, utilities defer the amount of any fuel cost under-recovery or over-recovery in excess of a 2% annual tolerance band, for future rate recovery or refund. Approval of a fuel cost plan and any rate adjustment for refund or recovery of deferred costs is determined by the PSCW. Rate recovery of deferred fuel cost is subject to an earnings test based on the utility’s most recently authorized ROE. Fuel cost under-collections that exceed the 2% annual tolerance band may not be recovered if the utility earnings for that year exceed the authorized ROE.
NSP-Wisconsin’s electric fuel costs for 2018 were lower than authorized in rates and outside the 2% annual tolerance band, primarily due to greater than forecasted generation sales into the MISO market and lower purchased power costs coupled with moderate weather. Under the fuel cost recovery rules, NSP-Wisconsin retained approximately $3.6 million of fuel costs and deferred approximately $2.8 million. NSP-Wisconsin will file a reconciliation of 2018 fuel costs with the PSCW by March 31, 2019.
NSP-Wisconsin’s retail electric rate schedules for Michigan customers include power supply cost recovery factors, which are based on 12-month projections. After each 12-month period, a reconciliation is submitted whereby over-recoveries are refunded and any under-recoveries are collected from customers.
Wisconsin Energy Efficiency Program — The primary energy efficiency program is funded by the state’s utilities, but operated by independent contractors subject to oversight by the PSCW and utilities. NSP-Wisconsin recovers these costs from retail customers.
Transmission Initiatives
NSP-Wisconsin operates an integrated system with NSP-Minnesota. See NSP-Minnesota-Energy Sources and Transmission Service Provider.
NSP-Wisconsin / American Transmission Company, LLC - La Crosse to Madison, WI Transmission Line — In December 2018, construction was completed on the Badger Coulee 345 KV transmission line. The line extends from La Crosse, WI. to Madison, WI. NSP-Wisconsin’s half of the line is shared with Dairyland Power Cooperative, WPPI Energy and Southern Minnesota Municipal Power Agency-Wisconsin.
Wholesale and Commodity Marketing Operations
NSP-Wisconsin does not serve any wholesale requirements customers at cost-based regulated rates.
PSCo
Public Utility Regulation
Summary of Regulatory Agencies and Areas of Jurisdiction — PSCo is regulated by the CPUC with respect to its facilities, rates, accounts, services and issuance of securities. PSCo is regulated by the FERC for its wholesale electric operations, accounting practices, hydroelectric licensing, wholesale sales for resale, transmission of electricity in interstate commerce, compliance with the NERC electric reliability standards, asset transactions and mergers and natural gas transactions in interstate commerce. PSCo is not presently a member of an RTO and does not operate within an RTO energy market. However, PSCo does make certain sales to other RTO’s, including SPP. PSCo makes wholesale electric sales at cost-based prices to customers inside PSCo’s balancing authority area and at market-based prices to customers outside PSCo’s balancing authority area as authorized by the FERC.
Fuel, Purchased Energy and Conservation Cost-Recovery
Mechanisms
| • | ECA — Recovers fuel and purchased energy costs. Short-term sales margins are shared with retail customers through the ECA. The ECA is revised quarterly. |
| • | PCCA — Recovers purchased capacity payments. |
| • | SCA — Recovers the difference between PSCo’s actual cost of fuel and costs recovered under its steam service rates. The SCA rate is revised quarterly. |
| • | DSMCA — Recovers DSM, interruptible service costs and performance initiatives for achieving energy savings goals. |
| • | RESA — Recovers the incremental costs of compliance with the RES with a maximum of 2% of the customer’s bill. |
| • | WCA — Recovers costs for customers who choose renewable resources. |
| • | TCA — Recovers costs for transmission investment outside of rate cases. |
| • | CACJA — Recovers costs associated with the CACJA. |
PSCo recovers fuel and purchased energy costs from its wholesale electric customers through a fuel cost adjustment clause approved by the FERC. Wholesale customers pay their jurisdictional allocation of production costs through a fully forecasted formula rate with true-up.
Energy Sources and Transmission Service Providers
PSCo expects to meet its system capacity requirements through electric generating stations, power purchases, new generation facilities, DSM options and expansion of generation plants.
Purchased Power — PSCo purchases power from other utilities and IPPs. Long-term purchased power contracts for dispatchable resources typically require capacity and energy charges. It also contracts to purchase power for both wind and solar resources. PSCo makes short-term purchases to meet system load and energy requirements, replace owned generation, meet operating reserve obligations, or obtain energy at a lower cost.
Purchased Transmission Services — In addition to using its own transmission system, PSCo has contracts with regional transmission service providers to deliver energy to its customers.
Wind Development — In 2018, PSCo completed construction and placed in service its Rush Creek 600 MW wind farm in Colorado.
CEP — In September 2018, the CPUC approved PSCo’s preferred CEP portfolio, which included the retirement of two coal-fired generation units, Comanche Unit 1 (in 2022) and Comanche Unit 2 (in 2025), and the following additions:
| Total Capacity | PSCo's Ownership | |||
| Wind generation | 1,100 MW | 500 MW | ||
| Solar generation | 700 MW | — | ||
| Battery storage | 275 MW | — | ||
| Natural gas generation | 380 MW | 380 MW |
PSCo’s investment is expected to be approximately $1 billion, including transmission to support the increase in renewable generation. This investment includes the 500 MW Cheyenne Ridge wind farm and 345 KV generation tie line, as well as the Shortgrass Substation. CPCNs for these projects were filed in December 2018. A CPUC decision is anticipated by May 2019. CPCNs for the natural gas generation facility are anticipated to be filed by mid-2019.
Boulder Municipalization — In 2011, Boulder passed a ballot measure authorizing the formation of an electric municipal utility, subject to certain conditions. Subsequently, there have been various legal proceedings in multiple venues with jurisdiction over Boulder’s plan. In 2014, the Boulder City Council passed an ordinance to establish an electric utility. PSCo challenged the formation of this utility and the Colorado Court of Appeals ruled in PSCo’s favor, vacating a lower court decision. In June 2018, the Colorado Supreme court rejected Boulder’s request to dismiss the case and remanded it to the Boulder District Court.
Boulder has filed multiple separation applications with the CPUC, which have been challenged by PSCo and other intervenors. In September 2017, the CPUC issued a written decision, agreeing with several key aspects of PSCo’s position. The CPUC has approved the designation of some electrical distribution assets for transfer, subject to Boulder completing certain filings. Those filings were submitted in the fourth quarter of 2018. Subsequently, various parties requested the CPUC commence additional processes; the form of such processes is currently under consideration. In the fourth quarter of 2018, Boulder’s City Council also adopted an Ordinance authorizing Boulder to begin negotiations for the acquisition of certain property or to otherwise condemn that property after Feb. 1, 2019. In the first quarter of 2019, Boulder sent PSCo a Notice of Intent to acquire certain electric distribution assets.
Boulder does not have authorization from the CPUC to initiate a condemnation proceeding at this time.
Wholesale and Commodity Marketing Operations
PSCo conducts various wholesale marketing operations, including the purchase and sale of electric capacity, energy, ancillary services and energy related products. PSCo uses physical and financial instruments to minimize commodity price and credit risk and hedge sales and purchases. PSCo also engages in trading activity unrelated to hedging and sharing of any margins is determined through state regulatory proceedings as well as the operation of the FERC approved JOA.
SPS
Public Utility Regulation
Summary of Regulatory Agencies and Areas of Jurisdiction — The PUCT and NMPRC regulate SPS’ retail electric operations and have jurisdiction over its retail rates and services and the construction of transmission or generation in their respective states. The municipalities in which SPS operates in Texas have original jurisdiction over SPS’ rates in those communities. The municipalities’ rate setting decisions are subject to PUCT review.
SPS is regulated by the FERC for its wholesale electric operations, accounting practices, wholesale sales for resale, the transmission of electricity in interstate commerce, compliance with NERC electric reliability standards, asset transactions and mergers, and natural gas transactions in interstate commerce. SPS is a transmission-owning member of the SPP RTO and operates within the SPP RTO and SPP IM wholesale market. SPS is authorized to make wholesale electric sales at market-based prices.
Fuel, Purchased Energy and Conservation Cost-Recovery
Mechanisms —
| • | DCRF — Recovers distribution costs not included in rates in Texas. |
| • | EECRF — Recovers costs for energy efficiency programs in Texas. |
| • | EE rider — Recovers costs for energy efficiency programs in New Mexico. |
| • | FPPCAC — Adjusts monthly to recover the actual fuel and purchased power costs in New Mexico. |
| • | PCRF — Allows recovery of purchased power costs not included in rates in Texas. |
| • | RPS — Recovers deferred costs for renewable energy programs in New Mexico. |
| • | TCRF — Recovers certain transmission infrastructure improvement costs and changes in wholesale transmission charges not included in base rates in Texas. |
The fixed fuel and purchased energy recovery factor provides for the over- or under-recovery of energy expenses. Regulations require refunding or surcharging over- or under- recovery amounts, including interest, when they exceed 4% of the utility’s annual fuel and purchased energy costs on a rolling 12-month basis, if this condition is expected to continue.
SPS recovers fuel and purchased energy costs from its wholesale customers through a monthly wholesale fuel and purchased energy cost adjustment clause accepted by the FERC. Wholesale customers also pay the jurisdictional allocation of production costs.
Energy Sources and Transmission Service Providers
SPS expects to use electric generating stations, power purchases, DSM and new generation options to meet its system capacity requirements. In addition, it has evaluated water supply issues at the Tolk facility, concluding additional resource investment will be required to operate the plant through its existing life. The Ogallala aquifer has depleted more rapidly than expected. SPS installed a horizontal water well that may help delay the need for a more substantial investment solution. As a result of this issue and future environmental rules facing the plant, it sought a decrease to the remaining life of the facility in the 2017 Texas and New Mexico rate case proceedings.
Purchased Power — SPS purchases power from other utilities and IPPs. Long-term purchased power contracts typically require periodic capacity and energy charges. SPS also makes short-term purchases to meet system load and energy requirements to replace owned generation, meet operating reserve obligations or obtain energy at a lower cost.
Purchased Transmission Services — SPS has contractual arrangements with SPP and regional transmission service providers to deliver power and energy to its native load customers.
Wind Development — In 2018, the NMPRC and PUCT approved SPS’ proposal to add 1,230 MW of new wind generation, including 1,000 MW ownership.
In March 2018, the NMPRC approved SPS’ petition to build and own Sagamore, a 522 MW wind project in New Mexico which is expected to be placed into service in 2020. In May 2018, the PUCT approved SPS’ petition to build and own Hale County, a 478 MW wind project in Texas which is expected to be placed into service in 2019. Both projects qualify for 100% of PTCs. SPS’ capital investment for these wind projects is expected to be approximately $1.6 billion.
Texas State ROFR Request for Declaratory Order — In 2017, SPS and SPP filed a joint petition with the PUCT for a declaratory order regarding SPS’ ROFR. SPS contended that Texas law grants an incumbent electric utility the ROFR to construct new transmission facilities located in the utility’s service area. The PUCT subsequently issued an order finding that SPS does not possess an exclusive right to construct and operate transmission facilities. In January 2018, SPS and two other parties filed appeals in the Texas State District Court. In September 2018, the District Court affirmed the PUCT’s ROFR order. SPS has filed an additional appeal.
NATURAL GAS UTILITY OPERATIONS
Natural Gas Operating Statistics
| Year Ended Dec. 31 | |||||||||||
| 2018 | 2017 | 2016 | |||||||||
| Natural gas deliveries (Thousands of MMBtu) | |||||||||||
| Residential | 149,036 | 134,189 | 132,853 | ||||||||
| C&I | 96,447 | 87,271 | 84,082 | ||||||||
| Total retail | 245,483 | 221,460 | 216,935 | ||||||||
| Transportation and other | 173,092 | 142,497 | 133,498 | ||||||||
| Total deliveries | 418,575 | 363,957 | 350,433 | ||||||||
| Number of customers at end of period | |||||||||||
| Residential | 1,878,576 | 1,856,221 | 1,835,507 | ||||||||
| C&I | 158,424 | 157,798 | 157,286 | ||||||||
| Total retail | 2,037,000 | 2,014,019 | 1,992,793 | ||||||||
| Transportation and other | 7,951 | 7,705 | 7,316 | ||||||||
| Total customers | 2,044,951 | 2,021,724 | 2,000,109 | ||||||||
| Natural gas revenues (Millions of Dollars) | |||||||||||
| Residential | $ | 1,045 | $ | 1,006 | $ | 930 | |||||
| C&I | 556 | 524 | 469 | ||||||||
| Total retail | 1,601 | 1,530 | 1,399 | ||||||||
| Transportation and other | 138 | 120 | 132 | ||||||||
| Total natural gas revenues | $ | 1,739 | $ | 1,650 | $ | 1,531 | |||||
| MMBtu sales per retail customer | 120.51 | 109.96 | 108.86 | ||||||||
| Revenue per retail customer | $ | 786 | $ | 760 | $ | 702 | |||||
| Residential revenue per MMBtu | 7.01 | 7.50 | 7.00 | ||||||||
| C&I revenue per MMBtu | 5.76 | 6.00 | 5.58 | ||||||||
| Transportation and other revenue per MMBtu | 0.80 | 0.84 | 0.99 |
Capability and Demand
Natural gas supply requirements are categorized as firm or interruptible (customers with an alternate energy supply).
Maximum daily send-out (firm and interruptible) and occurrence date:
| 2018 | 2017 | |||||||||
| Utility Subsidiary | MMBtu | Date | MMBtu | Date | ||||||
| NSP-Minnesota | 786,751 | (a) | Jan. 12 | 893,062 | Dec. 26 | |||||
| NSP-Wisconsin | 159,700 | Jan. 5 | 160,170 | Dec. 26 | ||||||
| PSCo | 1,903,878 | (a) | Feb. 20 | 1,948,167 | Jan. 5 |
| (a) | Decrease in MMBtu output due to milder winter temperatures in 2018. |
Natural gas is purchased from independent suppliers, generally based on market indices that reflect current prices, and is delivered under transportation agreements with interstate pipelines.
Contracted firm deliverable pipeline capacity as of Dec. 31:
| Utility Subsidiary | MMBtu Per Day | |||
| NSP-Minnesota | 645,171 | |||
| NSP-Wisconsin | 140,195 | |||
| PSCo | 1,834,843 | (a) |
| (a) | Includes 871,418 MMBtu of natural gas under third-party underground storage agreements. |
The utility subsidiaries contract with providers of underground natural gas storage services. Agreements provided storage of winter natural gas and peak day firm requirements for 2018 as follows:
| Utility Subsidiary | Percent of Winter Requirements | Peak Day Firm Requirements | ||
| NSP-Minnesota | 24% | 29% | ||
| NSP-Wisconsin | 30 | 33 |
PSCo also operates three company-owned underground storage facilities, which provide approximately 43,500 MMBtu of natural gas on peak days. The balance required to meet firm peak day sales obligations is primarily purchased at PSCo’s city gate meter stations.
Natural Gas Supply and Costs
Xcel Energy actively seeks natural gas supply, transportation and storage alternatives to yield a diversified portfolio which provides increased flexibility, decreased interruption and financial risk and economical rates. In addition, the utility subsidiaries conduct natural gas price hedging activities approved by their respective state commissions.
Average delivered cost per MMBtu of natural gas for regulated retail distribution:
| NSP-Minnesota | NSP-Wisconsin | PSCo | |||||||||
| 2018 | $ | 4.03 | $ | 3.84 | $ | 3.20 | |||||
| 2017 | 3.89 | 3.88 | 3.45 |
NSP-Minnesota, NSP-Wisconsin and PSCo have natural gas supply transportation and storage agreements that include obligations for purchase and/or delivery of specified volumes or to make payments in lieu of delivery. As of Dec. 31, 2018, the utility subsidiaries had the following contractual obligations:
| • | NSP-Minnesota — $437 million (expire 2019 - 2033); |
| • | NSP-Wisconsin — $89 million (expire 2019 - 2029); and, |
| • | PSCo — $1.1 billion (expire 2019 - 2029). |
NSP-Minnesota
Public Utility Regulation
Summary of Regulatory Agencies and Areas of Jurisdiction — Retail rates, services and other aspects of NSP-Minnesota’s retail natural gas operations are regulated by the MPUC and NDPSC. The MPUC has regulatory authority over security issuances, certain property transfers, mergers with other utilities and transactions between NSP-Minnesota and its affiliates. The MPUC reviews and approves NSP-Minnesota’s natural gas supply plans for meeting future energy needs. NSP-Minnesota is subject to the jurisdiction of the FERC with respect to certain natural gas transactions in interstate commerce. NSP-Minnesota is also subject to the DOT, Minnesota Office of Pipeline Safety, NDPSC and SDPUC for pipeline safety compliance.
Purchased Gas and Conservation Cost-Recovery Mechanisms — NSP-Minnesota’s retail natural gas rates for Minnesota and North Dakota include a PGA clause that provides for prospective monthly rate adjustments to reflect the forecasted cost of purchased natural gas, transportation and storage service. The annual difference between the natural gas cost revenues collected through PGA rates and the actual natural gas costs is collected or refunded over the subsequent 12-month period.
NSP-Minnesota also recovers costs associated with transmission and distribution pipeline integrity management programs through its GUIC rider. Costs recoverable under the GUIC rider include funding for pipeline assessments as well as deferred costs from NSP-Minnesota’s existing sewer separation and pipeline integrity management programs.
NSP-Wisconsin
Public Utility Regulation
Summary of Regulatory Agencies and Areas of Jurisdiction — NSP-Wisconsin is regulated by the PSCW and MPSC. The PSCW has a biennial base-rate filing requirement. By June of each odd-numbered year, NSP-Wisconsin must submit a rate filing for the test year period beginning the following January.
NSP-Wisconsin is subject to the jurisdiction of the FERC with respect to natural gas transactions in interstate commerce. NSP-Wisconsin is subject to the DOT, PSCW and MPSC for pipeline safety compliance.
Natural Gas Cost-Recovery Mechanisms — NSP-Wisconsin has a retail PGA cost-recovery mechanism for Wisconsin to recover the actual cost of natural gas and transportation and storage services.
NSP-Wisconsin’s natural gas rates for Michigan customers include a natural gas cost-recovery factor, which is based on 12-month projections and trued-up to actual amounts on an annual basis.
PSCo
Public Utility Regulation
Summary of Regulatory Agencies and Areas of Jurisdiction — PSCo is regulated by the CPUC with respect to its facilities, rates, accounts, services and issuance of securities. PSCo holds a FERC certificate that allows it to transport natural gas in interstate commerce without PSCo becoming subject to full FERC jurisdiction. PSCo is subject to the DOT and CPUC with regards to pipeline safety compliance.
Purchased Natural Gas and Conservation Cost-Recovery Mechanisms
| • | GCA — Recovers the costs of purchased natural gas and transportation to meet customer requirements and is revised quarterly to allow for changes in natural gas rates. |
| • | DSMCA — Recovers costs of DSM and performance initiatives to achieve various energy savings goals. |
| • | PSIA — Recovers costs for transmission and distribution pipeline integrity management programs. |
SPS
Natural Gas Facilities Used for Electric Generation
SPS does not provide retail natural gas service, but purchases and transports natural gas for its generation facilities and operates natural gas pipeline facilities connecting the generation facilities to interstate natural gas pipelines. SPS is subject to the jurisdiction of the FERC with respect to natural gas transactions in interstate commerce and the PHMSA and PUCT for pipeline safety compliance.
GENERAL
Seasonality
Demand for electric power and natural gas is affected by seasonal differences in the weather. In general, peak sales of electricity occur in the summer months and peak sales of natural gas occur in the winter months. As a result, the overall operating results may fluctuate substantially on a seasonal basis. Additionally, Xcel Energy’s operations have historically generated less revenues and income when weather conditions are milder in the winter and cooler in the summer.
See Item 7 for further information.
Competition
Xcel Energy is a vertically integrated utility subject to traditional cost-of-service regulation by state public utilities commissions. Xcel Energy is subject to public policies that promote competition and development of energy markets. Xcel Energy’s industrial and large commercial customers have the ability to generate their own electricity. In addition, customers may have the option of substituting other fuels or relocating their facilities to a lower cost region.
Customers have the opportunity to supply their own power with distributed generation including, but not limited to, solar generation and in most jurisdictions can currently avoid paying for most of the fixed production, transmission and distribution costs incurred to serve them. Several states have policies designed to promote the development of solar and other distributed energy resources through incentive policies. With these incentives and federal tax subsidies, distributed generating resources are potential competitors to Xcel Energy’s electric service business.
The FERC has continued to promote competitive wholesale markets through open access transmission and other means. As a result, Xcel Energy Inc.’s utility subsidiaries and their wholesale customers can purchase the output from generation resources of competing wholesale suppliers and use the transmission systems of the utility subsidiaries on a comparable basis to serve their native load.
FERC Order No. 1000 seeks to establish competition for construction and operation of certain new electric transmission facilities. State utilities commissions have also created resource planning programs that promote competition for electricity generation resources used to provide service to retail customers.
Xcel Energy Inc.’s utility subsidiaries have franchise agreements with cities subject to periodic renewal, however, a city could seek alternative means to access electric power or gas, such as municipalization.
While each of Xcel Energy Inc.’s utility subsidiaries faces these challenges, Xcel Energy believes their rates and services are competitive with the alternatives currently available.
ENVIRONMENTAL MATTERS
Xcel Energy’s facilities are regulated by federal and state environmental agencies that have jurisdiction over air emissions, water quality, wastewater discharges, solid wastes and hazardous substances. Various company activities require registrations, permits, licenses, inspections and approvals from these agencies. Xcel Energy has received all necessary authorizations for the construction and continued operation of its generation, transmission and distribution systems. Xcel Energy’s facilities have been designed and constructed to operate in compliance with applicable environmental standards and related monitoring and reporting requirements. However, it is not possible to determine when or to what extent additional facilities or modifications of existing or planned facilities will be required as a result of changes to environmental regulations, interpretations or enforcement policies or what effect future laws or regulations may have upon Xcel Energy’s operations. Xcel Energy will likely be required to incur capital expenditures in the future to comply with requirements for remediation of MGP and other legacy sites. The scope and timing of these expenditures cannot be determined until more information is obtained regarding the need for remediation at legacy sites.
In Minnesota, Texas and Wisconsin, Xcel Energy must comply with emission budgets that require the purchase of emission allowances from other utilities. The Denver North Front Range Nonattainment Area does not meet either the 2008 or 2015 ozone NAAQS. Colorado will continue to consider further reductions available in the non-attainment area as it develops plans to meet ozone standards. Gas plants which operate in PSCo’s non-attainment area may be required to improve or add controls, implement further work practices and/or implement enhanced emissions monitoring as part of future Colorado state plans.
There are significant present and future environmental regulations to encourage use of clean energy technologies and regulate emissions of GHGs. Xcel Energy has undertaken numerous initiatives to meet current requirements and prepare for potential future regulations, reduce GHG emissions and respond to state renewable and energy efficiency goals. If future environmental regulations do not provide credit for the investments Xcel Energy has already made or if they require additional initiatives or emission reductions, substantial costs may be incurred. The EPA, as an alternative to the CPP, has proposed a new regulation that, if adopted, would require implementation of heat rate improvement projects at our coal-fired power plants. It is not known what those costs might be until a final rule is adopted and state plans are developed to implement a final regulation. Xcel Energy believes, based on prior state commission practice, the cost of these initiatives or replacement generation would be recoverable through rates.
Xcel Energy is committed to addressing climate change and potential climate change regulation through efforts to reduce its GHG emissions in a balanced, cost-effective manner. Starting in 2011, Xcel Energy began reporting GHG emissions under the EPA’s mandatory GHG Reporting Program.
Xcel Energy estimates that in 2018, it reduced the CO2 emissions associated with the electric generating resources used to serve its customers by approximately 40% from 2005 levels. This reduction accounts for emissions from electric generating plants owned by Xcel Energy as well as purchased power.
Xcel Energy primarily relied on strategies that resulted in:
| • | Development of renewable energy facilities; |
| • | Retirement and replacement of existing generating plants; and, |
| • | Customer energy efficiency programs. |
CAPITAL SPENDING AND FINANCING
See Item 7 for a discussion of expected capital expenditures and funding sources.
EMPLOYEES
As of Dec. 31, 2018, Xcel Energy had 11,043 full-time employees and 49 part-time employees, of which 5,129 were covered under CBAs.
| Employees Covered by CBAs | Total Employees | |||||
| NSP-Minnesota | 2,064 | 3,278 | ||||
| NSP-Wisconsin | 386 | 540 | ||||
| PSCo | 1,904 | 2,426 | ||||
| SPS | 775 | 1,151 | ||||
| XES | — | 3,697 | ||||
| Total | 5,129 | 11,092 |
| EXECUTIVE OFFICERS (a) | ||||||
| Name | Age (b) | Current and Recent Positions Held | Time in Position | |||
| Ben Fowke | 60 | Chairman of the Board, President and Chief Executive Officer and Director, Xcel Energy Inc. | August 2011 - Present | |||
| Chief Executive Officer, NSP-Minnesota, NSP-Wisconsin, PSCo, and SPS | January 2015 - Present | |||||
| Brett C. Carter | 52 | Executive Vice President and Chief Customer and Innovation Officer, Xcel Energy Inc. | May 2018 - Present | |||
| Senior Vice President and Shared Services Executive, Bank of America | October 2015 - May 2018 | |||||
| Senior Vice President and Chief Operating Officer, Bank of America | March 2015 - October 2015 | |||||
| Senior Vice President and Chief Distribution Officer, Duke Energy Co. | February 2013 - March 2015 | |||||
| Christopher B. Clark | 52 | President and Director, NSP-Minnesota | January 2015 - Present | |||
| Regional Vice President, Rates and Regulatory Affairs, NSP-Minnesota | October 2012 - December 2014 | |||||
| David L. Eves | 60 | Executive Vice President and Group President, Utilities, Xcel Energy Inc. | March 2018 - Present | |||
| President and Director, PSCo | January 2015 - February 2018 | |||||
| President, Director and Chief Executive Officer, PSCo | December 2009 - December 2014 | |||||
| Darla Figoli | 56 | Senior Vice President, Human Resources & Employee Services, Chief Human Resources Officer, Xcel Energy Inc. | May 2018 - Present | |||
| Senior Vice President, Human Resources and Employee Services, Xcel Energy Inc. | May 2015 - May 2018 | |||||
| Vice President, Human Resources, Xcel Energy Inc. | February 2010 - May 2015 | |||||
| Robert C. Frenzel | 48 | Executive Vice President, Chief Financial Officer, Xcel Energy Inc. | May 2016 - Present | |||
| Senior Vice President and Chief Financial Officer, Luminant, a subsidiary of Energy Future Holdings Corp. (c) | February 2012 - April 2016 | |||||
| David T. Hudson | 58 | President and Director, SPS | January 2015 - Present | |||
| President, Director and Chief Executive Officer, SPS | January 2014 - December 2014 | |||||
| Alice Jackson | 40 | President and Director, PSCo | May 2018 - Present | |||
| Area Vice President, Strategic Revenue Initiatives, Xcel Energy Services Inc. | November 2016 - May 2018 | |||||
| Regional Vice President, Rates and Regulatory Affairs, PSCo | October 2011 - November 2016 | |||||
| Kent T. Larson | 59 | Executive Vice President and Group President Operations, Xcel Energy Inc. | January 2015 - Present | |||
| Senior Vice President, Group President Operations, Xcel Energy Services Inc. | August 2014 - December 2014 | |||||
| Senior Vice President Operations, Xcel Energy Services Inc. | September 2011 - August 2014 | |||||
| Timothy O’Connor | 59 | Senior Vice President, Chief Nuclear Officer, Xcel Energy Services Inc. | February 2013 - Present | |||
| Judy M. Poferl | 59 | Senior Vice President, Corporate Secretary and Executive Services, Xcel Energy Inc. | January 2015 - Present | |||
| Vice President, Corporate Secretary, Xcel Energy Inc. | May 2013 - December 2014 | |||||
| Jeffrey S. Savage | 47 | Senior Vice President, Controller, Xcel Energy Inc. | January 2015 - Present | |||
| Vice President, Controller, Xcel Energy Inc. | September 2011 - December 2014 | |||||
| Mark E. Stoering | 58 | President and Director, NSP-Wisconsin | January 2015 - Present | |||
| President, Director and Chief Executive Officer, NSP-Wisconsin | January 2012 - December 2014 | |||||
| Scott M. Wilensky | 62 | Executive Vice President, General Counsel, Xcel Energy Inc. | January 2015 - Present | |||
| Senior Vice President, General Counsel, Xcel Energy Inc. | September 2011 - December 2014 |
(a) No family relationships exist between any of the executive officers or directors.
(b) Ages as of Dec. 31, 2018.
| (c) | In April 2014, Energy Future Holdings Corp., the majority of its subsidiaries, including TCEH the parent company of Luminant, filed a voluntary bankruptcy petition. TCEH emerged from Chapter 11 in October 2016. |
Previous: Cover and table of contents · Next: Item 1A. Risk Factors